Article

Circuit Model and Analysis of Molded Case Circuit Breaker Interruption Phenomenon

1
Department of Electrical Engineering, DongShin University, Naju 58245, Korea
2
Reliability Assessment Center, Hyundai Electric & Energy System Co., Ltd., Yongin 16891, Korea
3
Division of Converged Electronic Engineering, CheongJu University, Cheongju 28503, Korea
*
Authors to whom correspondence should be addressed.
Electronics 2020, 9(12), 2047; https://doi.org/10.3390/electronics9122047
Submission received: 2 November 2020 / Revised: 22 November 2020 / Accepted: 30 November 2020 / Published: 2 December 2020

Abstract

:
There are complex physical phenomena for the interpretation of a molded case circuit breaker (MCCB) in a distribution system. Most of the studies of MCCB interruption phenomena were conducted with numerical analysis and experiments. This traditional approach may help improve the performance of the MCCB itself, but it is difficult to find connectivity with other systems. In this paper, the circuit model is proposed and the interruption phenomenon of MCCB is analyzed. The interruption of the MCCB is divided into three sections to deal with physical phenomena occurring in each area. A simplified model is proposed considering the characteristics of each section. Based on this model, the circuit model is proposed. To implement the features of each section, the calculation of physical phenomena is carried out, and this is expressed in the circuit model with resistance and zener diode. Comparing the results of the simulation with the experimental results is as follows. For 7-plates (basic state), the error rate is −5.6% in section II and 16.8% in section III. For 1-plate, the error rate is 36.5% in section II and −17.0% in section III. This case shows much difference from the simplified model in this paper, resulting in the largest error rate. The 7-plates and 5-plates cases, which are available in the general MCCB owing to the shortest distance from the arc, represent a relatively small error rate. Using the proposed circuit model, it is expected that the entire system, including the interruption phenomenon, can be interpreted as a single circuit model.

1. Introduction

There are various types of circuit breakers installed to protect loads in the event of over-current inflow, depending on capacity and operation. Recently, research on circuit breakers, which are used in a DC power system, has been actively conducted [1,2,3,4]. Among them, the circuit breaker frequently used in the distribution system is the mold case circuit breaker (MCCB). The study in this field is mainly focused on the study of the characteristics of voltage current in the circuit breaker and its experimental study [5,6,7,8,9]. In addition to interruption performance, research is being conducted on the characteristics after interruption [10,11,12,13,14].
The trip movements of circuit breakers are classified as mechanical, thermoelectric, and so on depending on the breaking time according to the current flowing into the circuit breaker. The actual blocking performance of the circuit breaker is the extinguishment capability of the arc current between electrodes after tripping. The arc-extinguishment section of the circuit breaker is equipped with an arc runner, splitter plate, and so on to cancel the arc between the contacts. Among them, the splitter plate extends, cools, and divides the arc current.
The circuit breaker’s interruption consists of complex phenomena. When over-current inflows, bimetal operates the driving part so that the moving electrode is operated by mechanical force. At this time, it takes one to two seconds empirically to detect and actually operate the fault current, varying slightly from circuit breaker to circuit breaker. Then, the arc of high temperature between the contacts damages the moving and fixed electrodes and generates high-pressure hot gas. Then, the arc current moves towards the splitter plate by the pressure of the hot gas and by the complex electrical force. When the moved arc touches the splitter plate, as previously mentioned, the arc is extended, cooled, and divided. These phenomena are nonlinear, so it is somewhat difficult to analyze them individually.
In a typical circuit breaker, when the arc from the contacts reaches the splitter plate, it has a current limit effect that limits the increase in the amount of current introduced by arc voltage. As this effect is an important characteristic that affects the interruption performance of the circuit breaker, many studies are being conducted on the voltage-current characteristics in this area. In a structure with an arc-extinguishment chamber surrounded by molds, such as a wiring circuit breaker, the arc power density increases significantly; in particular, the average current density on the surface of the splitter plate can reach hundreds of A/mm2 [15,16]. Various studies have been conducted on these arc currents [17]. In particular, it was found that, the smaller the electrode size of the contacts, the higher the arc voltage [18,19]. Arc movement during contact separation is also an important factor in analyzing interruption. The reaction force at the contact electrode is proportional to the magnitude of the current, and it is confirmed that it reacts at about ten times the rated current. Therefore, the more the fault current flows into the wiring circuit breaker, the faster the current-time response.
In this paper, the interruption phenomenon of a circuit breaker is analyzed step-by-step. By circuit modeling each step, the complex phenomenon has been simplified. Thus, it is expected to reduce the time spent on interpretation and to derive factors to improve blocking performance. Moreover, the proposed MCCB model can be used for fault phenomenon applications, which have the advantage of integrating the entire system into a single circuit analysis. Research on modeling and analyzing interruption phenomena based on experiments has been carried out previously. Xingwen Li et al. conducted a study of the entire interruption process of the MCCB in accordance with the conditions of the mobile electrode [8]. Fei Wang et al. compared arc behavior during the blocking process with experiments and simulations [20]. Compared with other studies, this study is characterized by modeling the entire interruption process by zone and analyzing the factors that have a dominant influence on each zone. In addition, circuit modeling is used to simplify the system, reducing calculation time and enabling connection between systems. This is the difference from other studies. This study can be applied on the limited contacts (structure with splitter plates between contacts) among low voltage circuit breakers. This requires further research. This study can be used to conduct a structural improvement study.
The composition of this paper is as follows: (2) Interruption Phenomenon and Background Theory, (3) Circuit Modeling, (4) Circuit Model Simulation and Experiment Results, and (5) Conclusions. Chapter 2 briefly introduces the interruption phenomenon, and introduces the background theory needed for the area. In Chapter 3, circuit modeling is conducted on the basis of Chapter 2. Finally, Chapter 4 verifies the validity of this circuit model by comparing the experimental results with the derived circuit model.

2. Interruption Phenomenon and Background Theory

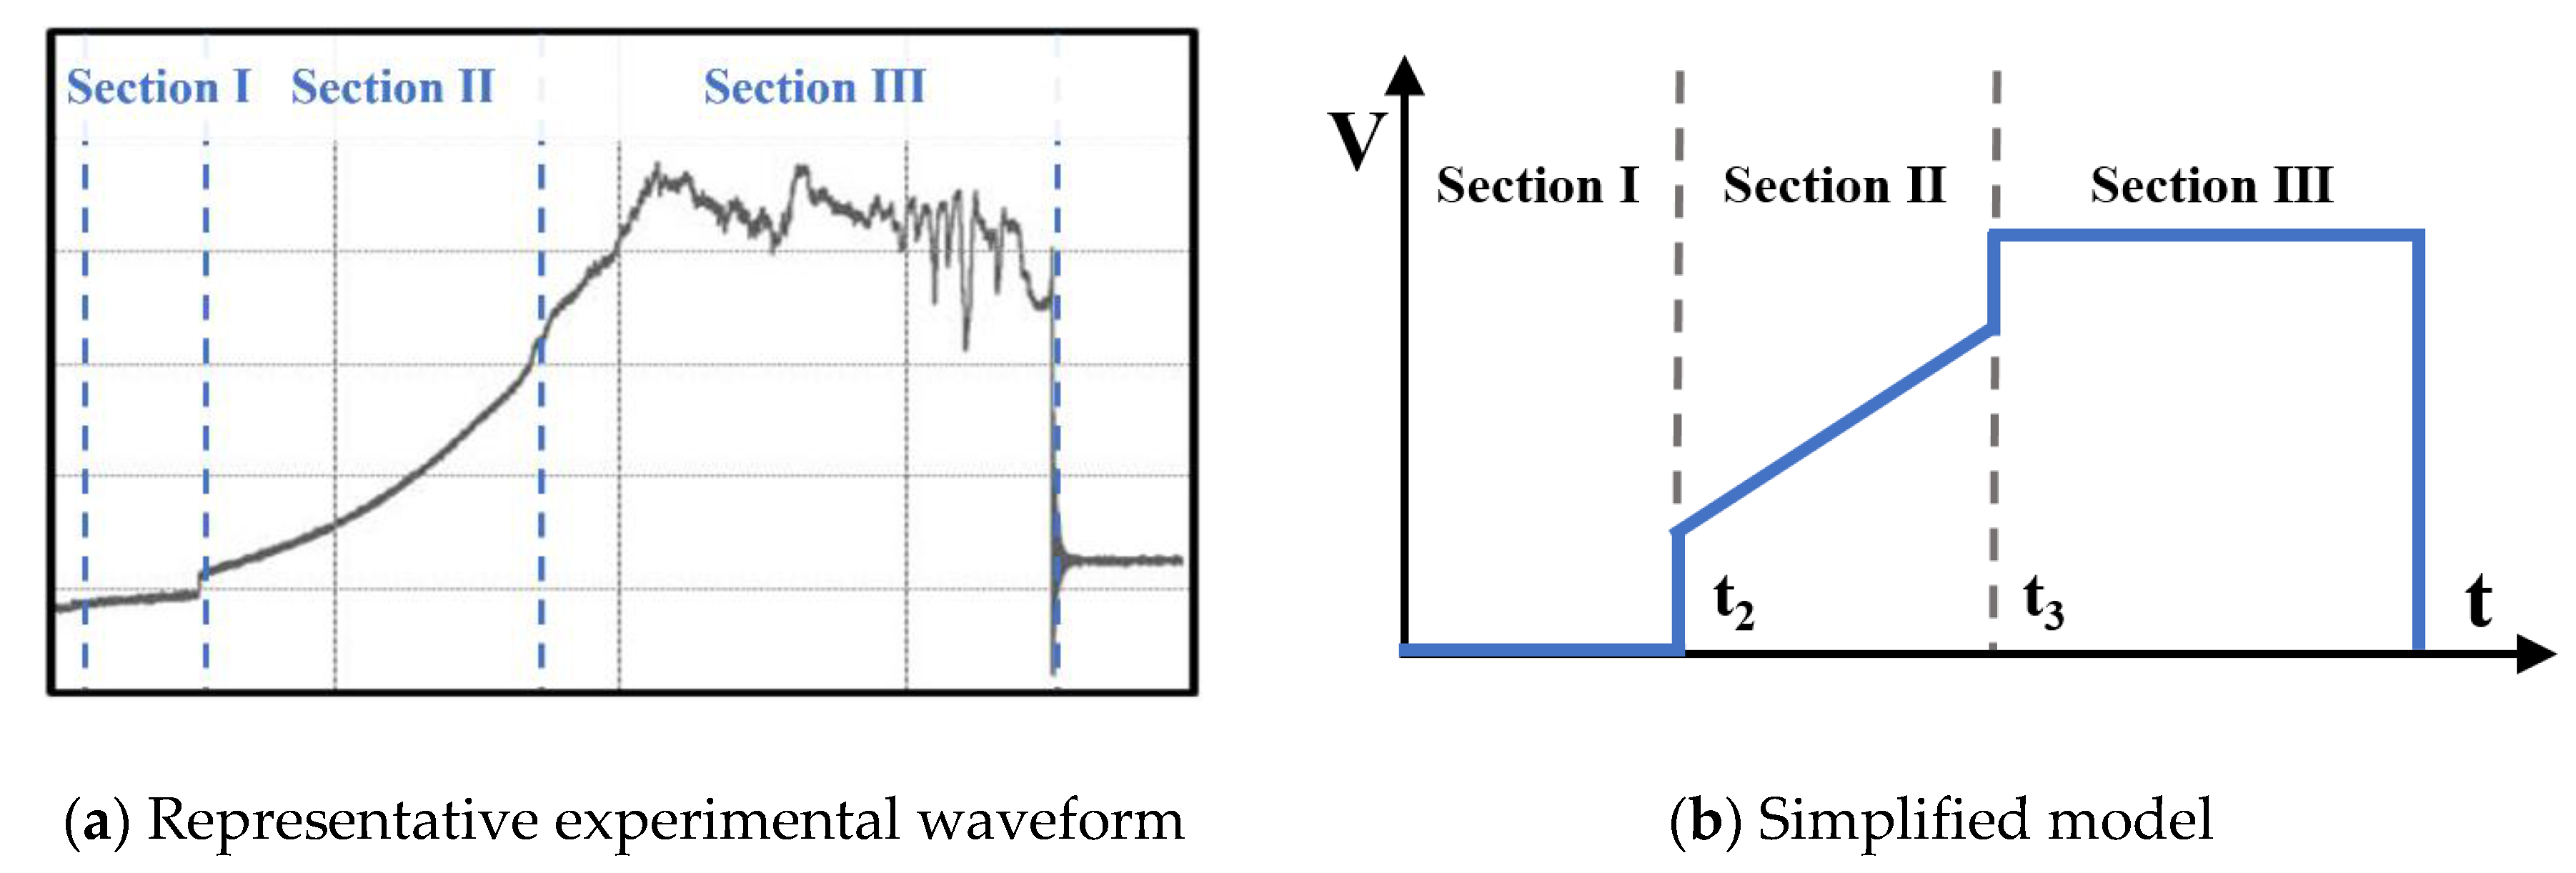
Figure 1 shows the waveform that occurs when the typical MCCB interrupts and the model that simplifies it. The interruption is largely divided into three parts: (1) section I: before contact opening; (2) section II: arc current growth; and (3) section III: arc extinguishment through splitter plate. In Figure 1b, t2 and t3 are the starting times for section II and section III, respectively.
First, section I is the time until the trip is activated and the contact is opened in over-currunt occurrence. The forces acting upon opening are the mechanical forces of the basic MCCB drive and the electrodynamic reaction force [21]. This electrodynamic repulsion force consists of Holm force and Lorentz force. The overall open force is as follows:
F o p e n = F M e c h + F E d = F M e c h + F H o l m + F L o r e n t z
As a result of overcurrent, approximately 1 to 2 ms is required for the circuit breaker to detect and open contact. Assuming that the mechanical force of the MCCB drive unit is constant among the total forces applied to the contacts, it is the electrodynamic repulsion force that can affect the time of additional contact opening. Figure 2 shows the electrodynamic repulsion force generated by the MCCB.
Holm force is as follows. Before the contacts are opened, the current is concentrated in a very small area between the contacts. This causes the concentration of current, and the generated magnetic flux density between contacts produces electromagnetic rebound forces.
F H o l m = μ 0 × I 2 8 × π × ln ( 8 × π × H × A μ 0 × I 2 )
Here, I is the current, in units (A); H is the hardness of the material; and A is the area of the contact, in units (m2). This force exerts its force when the contact is attached, and when the contact begins to fall, it is exponentially less powerful. The maximum value of this force may be affected by the opening of the contact point, but in most cases, the circuit breaker application is omitted owing to its weak force.
In the structure of the MCCB, the direction of current at fixed electrode and the direction of current at moving electrode are set in opposite directions. This generates a push force between the two electrodes, which is called the Lorentz force. Generally, the direction of rotation of the magnetic field is determined by the direction of the current. If the current direction of the two adjacent straight conductors is reversed, the direction of the magnetic fields produced is set in reverse. This strengthens the magnetic field between the two conductors, which forces the two conductors to move away. This occurs between the fixed and moving electrodes in this application. The following is the Lorenz force.
F L o r e n t z = 2 × 10 7 × I 2 × l e d e
Here, le is the length of the electrode arm, in units (m); and de is the distance between the electrodes, in units (m). The application requires additional application of the angle changing in Equation (3). If the current flowing is large enough, the Lorentz force not only operates before the contact opens, but also can have an effect after the contact is opened.
Section II is the section where the contacts are opened, and arcs are generated and enlarged. This section is divided into the arc generating between the electrodes and the arc extending to the splitter plate. First, the former is as follows. The time of contact opening with the mechanical force of the MCCB drive is similar, although there is a small difference for each product. If the mechanical force provided by the product exists and the current is large enough, it can reduce the time when the contact is fully open. However, it is difficult to see the effect if the current is not large.
When an arc occurs, the arc temperature can be obtained from the energy balance equation as follows [22,23]:
η × I × V c o l u = ϵ × σ s b × A s × T 4
T = ( η × I × V c o l u ϵ × σ s b × A s ) 1 / 4
Here, ε is emissivity, σsb is the Strfan=Boltzman constant ( 5.67 × 10 8   W / m 2 K 4 ), As is the surface area of the arc, η is the percentage of electrical power that is converted into radiation, I is the arc current, and Vcolu is the arc voltage. η is assumed to be 70%.
When the arc between the electrodes is generated, the voltage of the arc column is obtained as follows [23]:
V c o l u = 2.24 × ϵ 0.2 × σ s b 0.2 × l a r c η 0.2 × j r o o t 0.7 a 0.7 × I 0.1
Here, larc is length of arc; jroot is the average current density of arc root, in units (a/mm2); and a is the arc column expansion coefficient. This value is set to 1.
Next, we will infer the process of arc extending to the splitter plate as a rough progression of external forces acting on the arc. The main external force is the force caused by hot gas emissions from arc discharge [20]. It can be interpreted through the following ideal gas law.
P × V = n × R × T
Here, P is the pressure, V is the volume, n is the mole constant, R is the gas constant, and T is the temperature. Basically, the moving electrode moves by drawing an arc comparing to the fixed electrode. This shows that the force is applied in the outer direction of the circle. Assuming that the number of moles does not change for approximate force size and direction, the temperature difference in space can be expressed as a pressure difference. This can indicate the direction and magnitude of the force.
Δ P = n × R V × Δ T
f = A × ( P 1 P 0 )
Here, P1 is the pressure changed by the arc current, P0 is the ambient pressure, and A is the cross section of the space affected by the force. Based on the arc current, there is less space inside, and the outside is trapped by the splitter plate. Among these, the upper part of the splitter plate direction has a relatively large amount of space, and exhaust also exists in that direction. Because of this, the generated arc current extends upward towards the plate. The Lorentz force, which we have looked at earlier, can help the arc current extend further upward. Some circuit breakers are designed to induce movement of arc current by utilizing ferrite cores and other surrounding conductors such as splitter plates.
Section III is the process in which the extended arc current meets the splitter plate and consumes energy. The energy consumption, like section II, is classified as the energy consumed in arc current air and the energy consumed by the arc current touching the splitter plate. These two forms of energy consumption are expressed as voltages between electrodes in the circuit model proposed in this paper. The arc column voltage, the first energy consumption form, can be constructed by applying the extended arc current length to expression (6). The second energy consumption form can calculate the energy that the splitter plate has, for instance, the energy taken from the arc current, depending on the temperature of the splitter plate. Expression (10) shows the energy delivered by the arc current to the splitter plate for a certain period of time.
W = c × M × T a r c × Δ t
Here, c is the specific heat, in units (J/gK); M is the weight of matter, in units (g); and Tarc is the arc temperature, in units (K). The voltage drop of the plate is obtained as follows:
P = V p × I = W / Δ t = c × M × T a r c
V p = c × M × T a r c / I

3. Circuit Modeling

In this paper, the circuit modeling study was conducted with the model name UCB 100S as the subject (Figure 3). The characteristics of this subject are that the shape of the splitter plate is constant and that the structure, such as the covering membrane, is simple so that the complexity of this application can be reduced.
In order to examine the main characteristics of the MCCB, cases were divided and modeled as in Figure 4. Figure 4a is a basic platter plate, consisting of seven plates. In Figure 4b–d, plates are removed at a specific location to change the number of plates and the plates where the arc first touches, in order to verify arc movement, energy consumption at the splitter plate, and so on.

3.1. Modeling of Section I

Theoretically, until the trip is made and the contacts are opened, it is in a conduct state. The circuit modeling in this area sets the time at which the contact is opened according to the mechanical force of the basic driving section and the incoming current. The trip time was set at 1.2 ms considering the value of the incoming current at the usual trip time.

3.2. Modeling of Section II

Figure 5 shows the electrodes and the splitter plate structure to be modeled. The electrodes are composed of fixed electrodes and moving electrodes, which are opened like in Figure 5. The maximum distance between electrodes is 18 mm and the maximum angle is 26°. The maximum opening time is set to 3 ms.
After the trip time of 1.2 ms, the moving electrode starts to move. From this point on, the voltages between the electrodes are discarded. The voltage of the arc column is obtained using Equation (6) at this time. Equation (6) indicates the voltage drop by arc column. This is mainly affected by the length of the arc and average current density of the arc lot. Here, the length of the arc between the electrodes shown in Figure 5 is calculated, and it is used to obtain the voltage drop between the electrodes. The values of the variables at this time are as follows: ε is 0.2, η is 0.7, and the diameter of the arc cylinder is 2 mm. Figure 6 indicates the voltage between the electrodes when the splitter plate does not exist, applying a trip time of 1.2 ms and a maximum opening time of contacts of 3 ms. The length of the arc current in section II corresponds to the distance between electrodes, assuming that the contacts are linearly separated.
Based on the voltage between the electrodes, the resistance (Rarc) value of section II is obtained. (Figure 7). Section II of this modelling is measured from 1.2 ms to 7.3 ms. The resistance values are fitted as a primary function, and the error rate is 2.13%. This linearized resistance value is used as the resistance (Rarc) in section II in the circuit model.
The arc generated by the separation of the contacts grows and expands towards the splitter plate. The forces at this point are hot gas emissions and Lorentz power, as mentioned earlier. The Holm force is a very small value, so it is omitted here. Hot gas produced by arc discharge causes temperature differences, i.e., pressure differences, within the circuit breaker space. The magnitude of the force is obtained through Equations (8) and (9). Modeling is carried out in the interior space of the MCCB to examine the direction of the force generated by arc discharge. Heat from the arc is directed into the upper space where exhausts exist, surrounded by plates. As shown in Figure 8, the hot gas movable virtual space (dotted line) is set, and the generated heat is assumed to move in the center direction of this space. At this time, it is assumed that the moving electrode would move and cause a temperature difference with the ambient, resulting in a force from the moving electrode.
Figure 9 shows the magnitude and angle of the synthetic force of hot gas and Lorentz. At this time, the arm length of the electrode at Lorentz force is 14 mm, and the length r between the electrodes and the angle change between the electrodes are calculated to increase the electrode linearly. At the force of hot gas, the spatial cross section area is 640 mm2 and the ambient temperature is 300 K.
Figure 10 shows the representative values of the previously obtained synthetic forces in the MCCB. In Figure 10, the case of 26° is when the electrode is fully open. If you look at the arc movement, you can see that it is heading towards the top two or three plates rather than the middle of the splitter plates. This simulation is conducted to determine which plate the arc reached first. In [20], arc movement when the electrode is opened is studied through experiment and simulation. As with this simulation, it can be seen that the heat by the arc is shifted in the upward direction.

3.3. Modeling of Section III

The arc current is shifted to the upper right by external forces. Moreover, the longer the arc current generated, the more it is affected by external force. The shortest distance between the arc current and the splitter plate is shown as Figure 11. t3 for starting section III is determined based on the results of the experiment, and t3 values per case are as follows: 7-plates is 6 ms, 5-plates is 6.2 ms, 3-plates is 7.2 ms, and 1-plate is 7.3 ms.
The objective here is to obtain the voltage (Vsp) between electrodes during section III. This voltage (Vsp) consists of voltage drop by plate (Vplate) and voltage drop by arc length (Varc), as shown in Equation (13).
V s p = V p l a t e + V a r c
First, the voltage drop by plate (Vplate) is as follows. The energy of one plate over a specified time is calculated using Equation (10), and the voltage of one plate is calculated using Equation (12). Table 1 shows the temperature and voltage drop when the arc first touches the splitter plate in each case. Here, the specific heat of one plate is 0.447 J/(g·K), the weight is set to 4 g, and the top one plate weighs 2 g.
Next is the voltage drop by arc length (Varc). This value is obtained using Equation (6), as shown in the modeling of section II. At this time, the arc length is required, which consists of the shortest distance and a number of distances (2 mm) between plates. For example, in the case of 7-plates (basic state), this is the sum of the shortest distance and seven distances between plates (2 mm) (Figure 11). The shortest distance of cases is as follows: 7-plates is 12 mm, 5-plates is 12 mm, 3-plates is 14 mm, and 1-plate is 19 mm. The constant voltage (Vsp) generated in this section is modeled on the circuit using the zener diode.
The circuit model (Figure 12) is intended to obtain a simplified model (Figure 1b). This circuit model assumes that the arc increases linearly and, in section II, the splitter plate consumes constant average energy in section III. Here, the change time of section t2 and t3 is determined experimentally. In section II, the variable resistance (Rarc) is obtained as shown in Figure 7, and in section III, the voltage (Vsp) is obtained through Equation (13).

4. Comparison of Simulation Model and Experimental Results

Figure 13 shows the simulation result using the proposed circuit model. It is simulated using PSIM. The details of the resulting values are covered in the comparison section of the experimental results.
To verify the proposed circuit model, we conduct an experiment on the aforementioned cases. Figure 14 shows the experimental setup. The experimental power supplies an overcurrent for the MCCB to operate the interruption. This overcurrent is determined by the capacitor’s charging voltage, capacitance, inductance, and so on. In this paper, the charging voltage is set to 640 V, capacitance is set to 26,700 μF, and inductance is set to 0.258 mH. These values are to allow the incoming over-current frequency to have a value of 60 Hz, with half-wave (8.3 ms) of its entire cycle as the current is zero. The experimental waveforms for cases are presented in Figure 15.
Table 2 below compares the simulated voltage waveform with the experimental voltage waveform. In section II, the mean value of the voltage is calculated, and in section III, the peak value of the voltage is calculated because it is assumed to be a constant voltage. Looking at the results, in section II, 1-plate cases show the largest error rate (36.5%) and, in section III, 3-plates cases show the largest error rate (−25.0%). Overall, the largest error rate is in the case of 1-plate, with the largest number of plates removed compared with the basic state. In the experimental waveform of the 1-plate case (Figure 15d), the beginning of section III shows a constant voltage and then the voltage rises unlike other experimental waves. This is not consistent with the simplified model (Figure 1b) proposed by this paper. In addition, 7-plates to 3-plates can be interpreted as arc movement in the upward moving electrode, but 1-plates do not show that much time difference. It is predicted that this is not moving from top electrode, but from bottom electrode through the arc runner. It is important where the arc first touches the splitter plate moved by the force, that is, the top or bottom electrode.
Figure 16 shows the damaged state of plates and supports after several interruption experiments on the splitter plate. The damaged area is marked with white dotted lines. The pictures of the plates show that the second and third plates are the most damaged. This shows that almost all areas of the second plate are charred, and the third plate is slightly dug (white dotted circle). This feature can also be seen in the support fixture in Figure 16b. Most of the damage occurred in the space around the second and third plate above. In addition, this shows that there is a lot of discharge between the seventh (bottom) plate and the arc runner (white dotted circle).

5. Conclusions

In this paper, the mold case circuit breaker interruption phenomenon is analyzed, and on this basis, the circuit model is proposed. Usually, the interruption of the MCCB is divided into three sections to deal with physical phenomena occurring in each area. The energy consumption and timing in the section are implemented using circuit elements. The simulation results show the largest error rate in the case of 1-plate (36.5%) in section II and in the case of 3-plates (−25.0%) in section III. In fact, in normal MCCB cases, 1-plate and 3-plates cases are not suitable because arcs must reach the plate quickly. In addition, considering the experimental waveform (Figure 15d) of the 1-plate case and the discharge of the seventh plate (Figure 16b), the 1-plate case is induced at the bottom (fixed) electrode. The assumption in this paper is that the arc approaches the splitter plate by the synthetic force (Figure 10) from the top (moving) electrode. This is the reason for the large error rate in the case of 1-plate. This is also much different from the simplified model (Figure 1b) of this paper. In the case of 7-plates (basic state) and 5-plates, the shortest distance (12 mm) from the arc is the same, and only the number of plates is different. This is an element that can be changed depending on the capacity of the MCCB. The errors in these two cases are −5.6% and 14.7% in section II, and 16.8% and 2.3% in section III, respectively, all not exceeding 20%. The results of this paper can be applied to the improvement of interruption performance of the MCCB, and it is expected that the whole system including the interruption phenomenon can be interpreted as a single circuit model using the proposed circuit model. Future works are behavioral analysis of the arc and detailed modelling of energy consumption in the splitter plate.

Author Contributions

K.-AL. carried out the main research tasks and wrote the full manuscript. Y.-M.C. performed the experiments and revised the details. H.-J.L. planned the work and examined the contents of the paper. All authors have read and agreed to the published version of the manuscript.

Funding

This research received no external funding.

Conflicts of Interest

The authors declare no conflict of interest.

References

  1. Bhatta, S.; Fu, R.; Zhang, Y. A New Method of Detecting and Interrupting High Impedance Faults by Specifying the Z-Source Breaker in DC Power Networks. Electronics 2020, 9, 1654. [Google Scholar] [CrossRef]
  2. Wang, L.; Feng, B.; Wang, Y.; Wu, T. Bidirectional Short-Circuit Current Blocker for DC Microgrid Based on Solid-State Circuit Breaker. Electronics 2020, 9, 306. [Google Scholar] [CrossRef] [Green Version]
  3. Tapia, L.; Baraia-Etxaburu, I.J.; Valera, J. Design of a Solid-State Circuit Breaker for a DC Grid-Based Vessel Power System. Electronics 2019, 8, 953. [Google Scholar] [CrossRef] [Green Version]
  4. Ju-Yong, K.; Ho-Sun, K.; Ju-Won, B.; Dong-Keun, J. Analysis of Effective Three-Level Neutral Point Clamped Converter System for the Bipolar LVDC Distribution. Electronics 2019, 8, 691. [Google Scholar]
  5. Mcbride, J.W.; Sharkh, S.M. The influence of contact opening velocity on arc characteristics. In Proceedings of the 16th International Conference on Electrical Contacts, Loughborough, UK, 7–11 September 1992; pp. 395–400. [Google Scholar]
  6. Sekikawa, J.; Kubono, T. An experimental equation of V-I characteristics of breaking arc for Ag, Au, Cu and Ni electrical contacts. IEICE Trans. Inf. Syst. 2003, E86–C, 926–931. [Google Scholar]
  7. Nakayama, K.; Yokomizu, Y.; Matsumura, T. Mechanism of voltage rise of high-current arc at atmospheric pressure due to deion plates. IEEJ Trans. Power Energy 2002, 9, 1016–1021. [Google Scholar] [CrossRef] [Green Version]
  8. Xingwen, L.; Degui, C. Analysis of the Interruption Process of Molded Case Circuit Breakers. IEEE Trans. Compon. Packag. Manuf. Technol. 2007, 30, 375–382. [Google Scholar]
  9. Dongkyu, S.; Golosnoy, I.O.; McBride, J.W. Experimental Study of Reignition Evaluators in Low-Voltage Switching Devices. IEEE Trans. Compon. Packag. Manuf. Technol. 2018, 8, 950–957. [Google Scholar]
  10. Young-Maan, C.; Jae-ho, R.; Ji-Eun, B.; Kwang-Cheol, K. Implementing a Dielectric Recovery Strength Measuring System for Molded Case Circuit Breakers. Int. J. Electr. Eng. Technol. 2018, 13, 1752–1758. [Google Scholar]
  11. Kun-A, L.; Kwang-Cheol, K. Experimental Investigation of Improvement in the Dielectric Recovery Characteristics of a Molded Case Circuit Breaker Splitter Plate. J. Electr. Eng. Technol. 2020, 15, 757–763. [Google Scholar]
  12. Dehui, C.; Xingwen, L.; Ruicheng, D. Measurement of the Dielectric Recovery Strength and Reignition of AC Contactors. IEICE Trans. Inf. Syst. 2005, E88–C, 1641–1646. [Google Scholar]
  13. Shea, J.J. Dielectric Recovery Characteristics of a High Current Arcing Gap. IEEE Trans. Compon. Packag. Manuf. Technol. 2002, 25, 402–408. [Google Scholar] [CrossRef]
  14. Shea, J.J. The influence of arc chamber wall material on arc gap dielectric recovery voltage. IEEE Trans. Compon. Packag. Technol. 2001, 24, 342–348. [Google Scholar] [CrossRef]
  15. Hemmi, R.; Yokomizu, Y.; Matsumura, T. Anode-fall voltages of air arcs between electrodes of copper, silver, and tungsten at currents up to 1500 A. IEEJ Trans. Power Energy 2004, 124, 143–149. [Google Scholar] [CrossRef] [Green Version]
  16. Ioyama, K.; Yanobe, T. Estimation for the spot size of short gap discharge in near one atmosphere pressure. IEICE Trans. Electron. 1999, E82–C, 55–59. [Google Scholar]
  17. Wooho, K.; Yong-Jung, K.; Hyosung, K. Arc Voltage and Current Characteristics in Low-Voltage Direct Current. Energies 2018, 11, 2511. [Google Scholar]
  18. Walczuk, E.; Blaszczyk, H. Dynamic voltage-current characteristics of short arc at higher currents. In Proceedings of the 13th International Conference on Electric Contacts, Lausanne, Switzerland, 15–19 September 1986; pp. 170–175. [Google Scholar]
  19. Watanabe, S.; Kokura, K.; Minoda, K. Characteristics of the arc voltage of a high-current air arc in a sealed chamber. IEEJ Trans. Power Energy 2014, 186, 34–42. [Google Scholar] [CrossRef]
  20. Fei, Y.; Yi, W.; Hao, S.; Murphy, A.B. Low-voltage circuit breaker arcs—Simulation and measurements. Int. J. Phys. D Appl. Phys. 2013, 46, 1–19. [Google Scholar]
  21. Digpalsinh, P.; Mayur, G. Analysis and improvement in repulsive force of 630 A frame Moulded Case Circuit Breaker (MCCB). Int. Perspect. Sci. 2016, 8, 424–427. [Google Scholar]
  22. Shea, J.J. Blow-open forces on double-break contacts. IEEE Trans. Compon. Packag. Manuf. Technol. 1994, 17, 32–38. [Google Scholar] [CrossRef]
  23. Zhu, T.; Hongwu, L.; Ruiliang, G.; Shenli, J.; Nairui, Y. Study on voltage characteristics of short air arc with high current density arc root. Int. AIP Adv. 2019, 9, 1–9. [Google Scholar] [CrossRef] [Green Version]
Figure 1. Molded case circuit breaker (MCCB) interruption voltage.
Electronics 09 02047 g001
Figure 2. Electrodynamic repulsion force generated in the MCCB.
Electronics 09 02047 g002
Figure 3. Research target MCCB.
Electronics 09 02047 g003
Figure 4. Splitter plate change cases for MCCB modeling.
Electronics 09 02047 g004
Figure 5. Structure and dimensions of the contacts and splitter plate.
Electronics 09 02047 g005
Figure 6. Voltage waveform between contacts without a splitter plate.
Electronics 09 02047 g006
Figure 7. Resistance (Rarc) between the contacts in section II.
Electronics 09 02047 g007
Figure 8. MCCB interior space and virtual space for hot gas movement (side view).
Electronics 09 02047 g008
Figure 9. The combined force of the hot gas force and the Lorentz force.
Electronics 09 02047 g009
Figure 10. Vector of synthetic force according to the angle between contacts.
Electronics 09 02047 g010
Figure 11. The shortest distance between the arc and splitter plate in basic state.
Electronics 09 02047 g011
Figure 12. Circuit model for the MCCB interruption phenomenon.
Electronics 09 02047 g012
Figure 13. Simulation results for the circuit model.
Electronics 09 02047 g013
Figure 14. Experimental setup for MCCB interruption phenomena analysis.
Electronics 09 02047 g014
Figure 15. Experimental waveforms for cases.
Electronics 09 02047 g015
Figure 16. Damaged splitter plate after experimentations.
Electronics 09 02047 g016
Table 1. Voltage drop of splitter plate change cases.
CaseTemperature (K)Voltage Drop of One Plate (V)Total Voltage Drop (V)
7-plates21,1388.1853.17
5-plates20,5768.5242.59
3-plates16,49311.8735.61
1-plate15,92712.5112.51
Table 2. Comparison of simulation and experiment voltage waveform.
Section IISection III
ModelSimulation Value (V)Experiment Value (V)Error Rate (%)Simulation Value (V)Experiment Value (V)Error Rate (%)
7-plates70.875−5.616714316.8
5-plates68.762.514.71351322.3
3-plates69.673.5−1.196128−25.0
1-plate69.353.136.57388−17.0
Publisher’s Note: MDPI stays neutral with regard to jurisdictional claims in published maps and institutional affiliations.

