Article

Evolutionary Game for Content Cache in a mm-Wave-Based Vehicular Fog

Department of Computer Engineering, Gachon University, Seongnam 13120, Korea
Electronics 2020, 9(11), 1794; https://doi.org/10.3390/electronics9111794
Submission received: 6 October 2020 / Revised: 24 October 2020 / Accepted: 25 October 2020 / Published: 29 October 2020
(This article belongs to the Special Issue Access Technology in 5G and Mobile Communication Networks)

Abstract

:
Vehicular fog computing is attractive for sharing computing resources and data for safety and infortainment of self-driving cars. Recently, the V2X communication technology using mm-Wave frequency spectrum accelerates such future mobile computing with large bandwidth and beam-forming using a directional antenna. Although the beam-forming technique requires a complicate procedure for beam alignment, it can reduce mutual interference by spatial diversity. From the beam-forming scheduling, the vehicular fog can improve network performance, which is limited by data locations. Beams toward a vehicle for the same content should be scheduled in the time domain. Instead, we propose to replicate the content to multiple vehicles nearby to diversify beam directions. However, it is a challenge for vehicles to cache the content because the content caching costs not only limited local storage, but data transmission for other vehicles. For this, we adopt evolutionary game theory in which vehicles learn an evolutionarily stable strategy (ESS) from repeated games and maximize social utility. In this paper, we contribute to modeling a road segmentation for the mm-Wave V2X communication in order to derive connectivity probability with distributed content caches for the vehicular fog, and centralized and distributed algorithms for the evolutionary content cache game. From experiments, we confirm that content cache can improve V2X connectivity and the proposed evolution algorithm leads vehicles to choose the ESS for the content cache in the vehicular fog.

1. Introduction

A fleet of the self-driving vehicles will form vehicular cloud or fog at a road in the near future, where they cooperate for safe driving and infotainment by sharing the limited computing resources. Autonomous driving requires rich sensor data not only collected from own equipped sensors such as LiDAR, near-medium range radar, long-range radar (LRR) and dash-cams, but also from other vehicles nearby through vehicle-to-everything (V2X) communication. The rich sensor data like high-resolution video (e.g., UHD 4K) from dash-cams or LiDAR can enhance control precision; road curvature can be recognized from 30 m advance if using a 2 MP (Mega Pixel) image while 50 m with a 0.3 MP image [1].
To deliver various and large data in the vehicular fog, the legacy V2X communication based on dedicated short-range communication (DSRC) and IEEE 802.11p is not suitable because of low data rate with insufficient bandwidth, up to 6–27 Mbps for safety and infotainment. Therefore, 5G community is now developing V2X communication using mm-Wave frequency bands, and are rushing to standardize in global standardization organizations such as ITU, 3GPP, etc. The 3GPP already studied and released a channel model of a side link for V2X communication in the release 15 [2], which includes sub-6 GHz band (FR1) and mm-Waves (FR2) together with features for Non-Line-of-Sight (NLOS) state. This mm-Wave V2X communication can increase data rate using a LOS link between vehicles and offload networks.
Unfortunately, the mm-Wave link has low diffraction, poor penetration and high pathloss due to its frequency characteristics, which leads vehicles to adopt a directional antenna for beam-forming gain. Previous studies on the mm-Wave V2X communication have mainly focused on modeling the characteristics of V2X channels and aligning mm-Wave beams between moving vehicles. In dense vehicular fog, however, inter-beam interference is critical due to uncoordinated beams. Petrov et al. [3] showed that interference from the adjacent lanes significantly degrade performance especially when highly directional antennas are used. For this, Kim et al. [1] proposed a multi-channel assignment for mm-Wave beams to reduce the inter-beam interference in the dense vehicular fog. Zhou et al. [4] introduced deep learning-based beam management to reduce interference between beams.
In this paper, we propose a content distribution technique to reduce the inter-beam interference in the vehicular fog. Within the vehicular fog, data contents are queried and delivered using information centric networking (ICN) technology [5]. Conventional host-centric networking can suffer from excessive routing procedures to recover connectivity from frequent disconnections caused by high vehicle mobility. The ICN allows vehicles to broadcast interest messages for contents nearby and to receive them using an intermittent mm-Wave link. For this, the ICN encourages vehicles to cache popular content in local storage in order to diversify content locations and reduce delivery latency. This cache distribution leads to diversification of V2V communication paths in the vehicular fog. Otherwise, n network flows for a certain content have to share for a same route and its links. Therefore, the cache distribution can reduce required link capacity from O ( n ) to O ( 1 ) . Furthermore, the spatial division of the mm-Wave beams is increased as vehicles form beams toward different directions. As shown in Figure 1, the inter-beam interference can be avoided as two caches on vehicle C and D diversify beams from vehicle A and B for the same video content.
To improve the efficiency of content cache, contents can be encoded by source coding techniques such as LT [6], Raptor [7], etc and stored evenly in multiple vehicle caches, which can remove duplication and complexity of transmission schedule. To say, a vehicle can decode a content if it can retrieve a sufficient number of coded blocks from any surrounding vehicles even in dynamic vehicular topology. However, vehicles may not be able to cooperate for sharing local cache in the vehicle fog because it costs not only the storage, but opportunity for data reception; it has to spend time for serving contents. As the number of the free-riders increases, total utility as throughput will decrease due to severe inter-beam interference in the dense vehicular fog.
In this paper, we apply an evolutionary game theory for the content cache in mm-Wave-based vehicular fog to solve the free-rider problem. This evolutionary game enables vehicles to learn the best strategy from repeated games and choose one of two strategy, cooperation or defection in order to maximize their own profit. For this, we propose a replicator dynamics equation to update the strategy of each vehicle and show that such behaviour dynamics can lead vehicles to converge into an evolutionarily stable strategy (ESS). To derive the utility of each vehicle, first, we establish a communication model of mm-Wave-based vehicular fog based on 2D-Poisson Point Process (PPP) in a multi-lane road, where the road is sectorized by beam-width of a directional antenna and interference is calculated by different beam-forming of neighbor vehicles according to content locations. Second, we apply one of two different algorithms, global and local replicator dynamics, to decide caching probability depending on whether the vehicles have global strategy information or not. From experiments for the global dynamics, we can observe that vehicles try to cooperate for caching when the cooperators are few because payoff from the cooperation is more than the cost. However, the connectivity gain from diversification of beam directions is limited as the proportion of cooperators becomes high. Accordingly, the cooperator proportion of the ESS is the point at which the payoff of cooperation and defection is the same. The local dynamics allow vehicles to decide their own strategy based on their past experience and converge into 1 or 0 for cooperation probability. Thereby, overall utility of the vehicular fog can have a stable state even for the heterogeneous players, but which can be varying with the initial probability of cooperation.
The rest of this paper is organized as follows. First, we introduce a concept of the vehicular fog and explain how to store contents in coded cache briefly in Section 2. We review 5G mm-Wave communications and discuss recent works on mm-Wave-based V2X communications. We establish a mode of mm-Wave V2X communications at multi-lane roads in Section 3, where we first introduce a propagation model of mm-Wave and a radiation pattern of a directional antenna, build a model of sectorized beams and content caches in a multi-lane road, and calculate connectivity of a V2V link. In Section 4, the evolutionary game is proposed for content cache in the vehicular fog. In Section 5, we evaluate performance on the mm-Wave V2X communication with distributed content caches, and discuss experimental outcomes. We conclude this paper in Section 6.

2. Related Works

2.1. Vehicular Fog and Coded Cache

Gerla et al. [5] proposed a vehicular fog that consists of embedded computers of vehicles and roadside units, in which vehicles share computing resources such as processors, storages, various sensors, etc and exchange safety data using multi-hop V2X communications. Several researches [8,9,10] about efficient resource allocation and energy-saving followed. As mentioned in [11], the vehicular fog prefers information-centric networking (ICN) to conventional host-centric networking [12,13,14,15] for data delivery.
The ICN consists of two key functionalities; one is to discover a publisher location of a Named Data Object (NDO) (or content) and the other is to deliver the NDO from a publisher to a subscriber. Those two procedures happen together or separately. In the coupled approach, the NDO query results in the NDO acquisition without any further procedure, while the decoupled approach requires additional procedures asking the NDO with the publisher’s location. Additionally, existing ICN solutions can be classified into two categories, proactive and reactive approaches, according to the discovery mechanism, e.g., NetInf, PURSUIT and COMET [12,13,14,15]. Content-centric networking (CCN) as the reactive approach can know NDO location by flooding Interest packets without any registration procedure. Content Routers (CRs) maintain a Pending Interest Table (PIT) to prevent duplicated Interest flooding and trace a reverse route to a subscriber using the “breadcrumb” in the PIT. Such CCN can be applied to the vehicular network as a vehicular content-centric network (VCCN) [16].
Zhang et al. [14] showed that caching technique can improve ICN performance by increasing content availability. Especially, it is useful for the VCCN that suffers from a dynamic network topology due to mobility. Considering limitation in local storage compared to countless contents, efficient caching policy is needed, for example, the popularity of contents following the zipfś law [17,18]. However, the simple distribution of content replicas still wastes limited vehicle storage. Instead, coded cache that has only partial blocks of a coded content can be used for the VCCN, which removes the duplication and complexity of the download scheduling.
Coded cache for distributed storage has been explored in many previous researches. First, Montpetit et al. [19] proposed to apply network coding (NC) and its architectural case for the ICN. Such CCN-NC was exploited more by [20,21], where they designed protocols and cache management framework in detail. Maddah-Ali et al. [22] showed an optimal decentralized scheme using multicast of coded contents without any coordination in a content delivery network (CDN) and which is feasible only when nodes have homogeneous storage capacity [23]. Recently, Luo et al. [24] proposed a coded caching algorithm for a distributed multi-server system to reduce the peak data rate and Mital et al. [25] also proposed a practical coded storage and delivery scheme using maximum distance separable (MDS) codes.

2.2. mm-Wave Communications

The mm-Wave spectrum receives much attention for 5G communication which is attractive to support wide bandwidth for giga-bit data rate. The mm-Wave communication links can be used not only for access links, but also for backhaul links that constitute multi-hop mesh or ad-hoc networks [26,27,28,29]. The feasibility of the mm-Wave communication had already been explored by many universities and companies using channel measurement and beam-forming/tracking experiments [30,31,32]. 3GPP, global standardization organization completes 5G specification about a new radio (NR) applicable to sub-6 GHz band (FR1) and mm-Waves (FR2) spectrums in the Release 15, and now focus on convergence technologies such as multimedia priority service, V2X, 5G satellite access, etc as Phase 2 for Release 16 and 17.
There have been many literatures to investigate MAC protocols for the mm-Wave communication. First, IEEE standards such as 802.15.3 Task Group 3c (TG3c) [33] and IEEE 802.11ad [34] specify physical and MAC layer protocols of Carrier Sensing Multiple Access/Collision Avoidance (CSMA/CA) or TDMA and beam-forming at 60 GHz unlicensed bands. For the beam training and alignment, the access point (AP) schedules two different periods, Association Beamforming Training (A-BFT) during Beacon Header Interval (BHI) and Service Period (SP) during Data Transmission Interval (DTI). The A-BFT allows us to detect a sector by sweeping all directions and further beam refinement occurs during the SP by exchanging special Beam Refinement Protocol (BRP) packets.
Based on the IEEE 802.11ad standard, Chen et al. [35] proposed a spatial reuse strategy for concurrent transmissions with directional antennas. Son et al. [36] propose a frame-based directive MAC protocol (FDMAC) which is a centralized scheduling algorithm based on greedy coloring providing multiple concurrent transmissions. Singh et al. [37] proposed a memory-guided directional MAC (MDMAC), as a fully distributed MAC protocol, which achieves approximate TDM scheduling for wireless meshes using memory about transmission success and fail. Another distributed algorithm, directional to directional MAC (DtDMAC) [38] uses an exponential backoff procedure for asynchronous operation.

2.3. mm-Wave V2X Communications

The V2X channel model was explored by many researchers. Va et al. [39] reviewed the state-of-the-art in measurements related to mm-Wave vehicular channels. Antonescu et al. [40] and Anjinappa et al. [41] proposed channel propagation statistic models for mm-Wave V2X communications using ray-tracing simulations, which include the effects of link blockage, scattering and multipath fading. Wang et al. introduce propagation characteristics of V2V channels, particularly for shadowing effects induced by obstructing vehicles between a transmitter and receiver [42]. In [43,44], He et al. proposed a geometric multiple-input multiple-output (MIMO) channel model for mm-Wave mobile-to-mobile (M2M) applications based on the two-ring reference model. Giordani et al. [45] validated the channel model that the 3GPP has proposed for NR-V2X systems. He et al. [46] also validated a vehicle-to-infrastructure (V2I) channel model given by 3GPP using ray-tracing simulator with 3D environment by OpenStreetMap. The stochastic geometry model for the V2X has been established by many researchers in order to find optimal solutions for the connectivity and throughput under varying blockage, beam direction and vehicle density. Tassi et al. [47] proposed a stochastic model of mm-Wave-based V2I, where the blockage probability and throughput were investigated with varying vehicle densities and speeds at a multi-lane highway. Lorca et al. [48] presented a theoretical analysis of the Doppler power spectrum in the presence of beamforming at the transmitter and/or the receiver in V2I systems. Wang et al. [49] analyzed the coverage of urban mm-Wave micro-cellular networks based on stochastic geometry with a LOS probability function of randomly oriented buildings for a V2I scenario. Yi et al. [50] proposed an effective spatial framework for mm-Wave V2X in vehicular platoon systems based on stochastic geometry approaches.
Beam alignment is critical for the mm-Wave communications, especially for the V2V communication as the vehicles move fast. For this, several studies utilize an out-of-band channel or sensors such as radars, GPS, camera, etc. Gonzalez et al. [51] and Kumari et al. [52] performed the beam alignment in a V2I using information from the IEEE 802.11ad module or the LRR radar signal. Choi et al. [53] proposed to use sensors or DSRC for a high-level solution for mm-Wave communication link configuration that can reduce the mm-Wave beam training overhead. Mavromatics et al. [54] leveraged vehicle sensory data of position and the motion for beam-forming by DSRC beacons.
For the beam scheduling, Perfecto et al. analyzed the interplay between the beamwidth assignment and the scheduling period in V2V communications [55] and proposed an optimization algorithm to establish a V2V link having optimal beam-width, using swarm intelligence based on the channel and queue state information [56]. Va et al. [57] proposed a swarm intelligence to efficiently pair vehicles of V2V links and optimize beam widths considering the channel state information and queue state information.
Several V2X testbed for the mm-Wave communication were built for preliminary study. Loch et al. [58] developed a practical mm-Wave vehicular testbed to evaluate performance, where a fixed beam-steering approach enabled the RSUs to transmit large amounts of data in a considerably short amount of time for a wide range of speeds. Park et al. [59] investigated mm-Wave blockage characteristics based on measurements collected in a typical V2V environment at 28 GHz. Kim [60] established a V2V testbed using mm-Wave-based IEEE 802.11ad WiGig and evaluated link connectivity in the driving situation. Several practical works about mm-Wave-based UAV communications and user equipment were introduced [61,62].

3. mm-Wave-Based Vehicular Communication Model

In this section, we establish a mm-Wave communication model for a vehicular fog with three folds. First, we adopt a well-known mm-Wave channel propagation model on 60 GHz frequency spectrum. Second, beam sectorization achieved by a directional antenna is considered with different beamforming gains. Third, we apply a multi-lane model to derive theoretical vehicle density of the vehicular fog and blockage probability.

3.1. mm-Wave Channel Propagation

Pathloss model of 60 GHz wireless local area was established for LOS environment based on measurement study [30,63,64,65]. Symbols for the model are shown in Table 1.
L d ( d B ) = A + 20 l o g 10 ( f 10 3 ) + 10 α l o g 10 ( d 10 3 ) ,
where the A is 32.5 dB and no shadow factor. f is an operating frequency (GHz) and d is a distance between a transmitter and receiver (m) and α is a pathloss exponent of LOS (e.g., 2).
In outdoor vehicular communication, additional attenuation from vapour water ( L v a p ), oxygen( L O 2 ), and rain ( L R ) should be considered. Those atmosphere parameters (dB/km) for further loss are assumed constant for a relatively short communication period in this study.
L a ( d B ) = d ( L v a p + L O 2 + L R ) .
Total pathloss can be the sum of Equations (1) and (2). For simplicity, we assume the pathloss, L a from atmosphere condition is static during a short communication period. Therefore, the pathloss is only determined by the distance, d, at a given operational frequency, f (e.g., 60 GHz). According to LOS or NLOS with obstacles, the pathloss exponent value for the distance is different.
In the LOS environment, the radio range can be derived by the outage probability with a required signal-to-noise ratio (SNR) threshold, T of target modulation coding scheme (MCS).
P ( P L ( d ) P t + G r + G t T G s ) ,
where G s = N F + I L + C B .
In above equation, reachable coverage d is P L 1 ( T x + G r + G t T G s ) . Except the constant loss ( G s ), the maximum range for threshold T can be rewritten by the Equation (4), where the d is decided almost by the antenna gain of transmission (Tx) and reception (Rx) (i.e., beam-forming factor) and threshold; in this study, no Tx power control is considered between vehicles.
d = P t G t G r T G s 1 / α
where the α is a pathloss exponent.

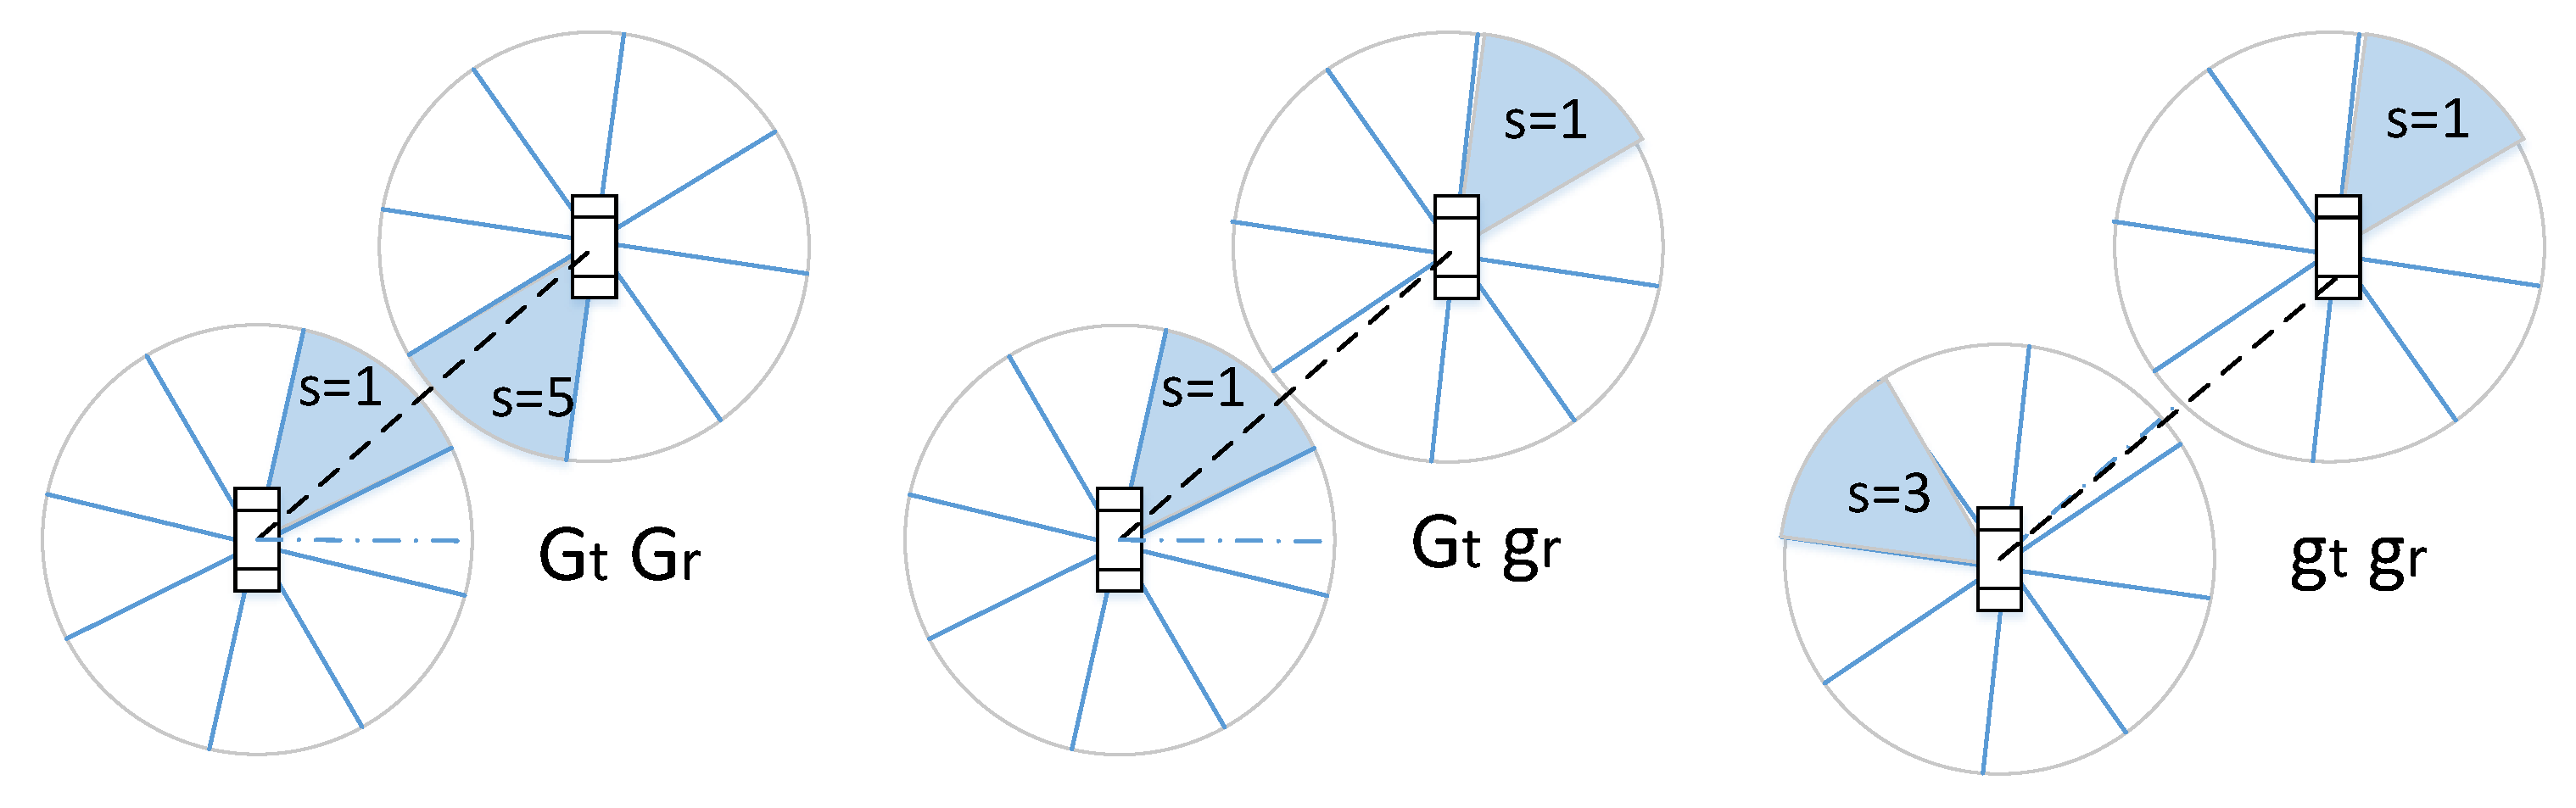
3.2. Directional Antenna and Coverage

Directional antenna increases radiation intensity toward a designated direction ( θ , ϕ ) with beam-width of θ w compared to isotropic antenna that emits power in isotropic; θ and ϕ are angles in z-axis [0, π ) and xy-axis domain [0, 2 π ), respectively. This directional antenna is useful for mm-Wave communications that suffer from high attenuation in the link path.
Directional antenna gain is
g ( θ , ϕ ) = η u ( ϕ , θ ) u 0 ,
where η is antenna efficiency ( 0 < η 1 ) and u 0 is average power density toward omni-direction. Suppose that transmission power of all directions is almost constant, the average power density is u 0 = 1 / 4 π P t and directivity is D = 4 π u ( θ , ϕ ) / P t if the loss η is negligible. Then directivity gain can be acquired by a following equation Equation (6).
g ( ϕ , θ ) = | u ( ϕ , θ ) | 1 / 4 π 0 2 π 0 π F ( θ ) F ( ϕ ) s i n ( θ ) d θ d ϕ
where the F ( ϕ ) and F ( θ ) are radiation intensity functions for azimuthal and elevation plane.
The beam-forming achieved by a uniform linear array antenna (ULA) or uniform circular array antenna (UCA) can be modelled by a sectorized directional antenna following ITU-R reference [66] which covers 400 MHz to 70 GHz spectrum frequencies. Then the main lobe gain can be decided by beamwidth of the each sector antenna, ϕ s , and then number of sectors | S | is 2 π / ϕ s . The radiation intensity of the sectorized directional antenna can be considered by one of two different radiation intensity functions in the azimuthal plane, rectangular or exponential sectoral radiation while the elevation plane is assumed to be an exponential function. In rectangular sectoral radiation, the azimuthal power intensity is derived as
F ( ϕ ) = 0 if ϕ s 2 | ϕ | 0 1 if ϕ s 2 | ϕ | < 0 .
Elevation power is
F ( θ ) = e a θ 2 , a = l n ( 0.5 ) 4 θ 3 2 ,
where θ 3 is 3 dB beam-width of the antenna in the elevation plane (degrees).
Consequently, the radiation intensity of an isotropic source, u 0 can be calculated by Equations (6)–(8),
u 0 = ϕ s θ 3 4 π π 2.773 e θ 3 2 / 11.09 .
The directivity gain of the rectangular radiation model is
D ( ϕ s ) = 38750 ϕ s θ 3 e θ 3 2 / 36400 ,
where D = u m / u 0 and maximum radiation intensity, u m is 1.
When applying the exponential function for sectoral radiation for the azimuthal function F ( ϕ ) , we can have the directivity gain as below,
F ( ϕ ) = e b ϕ 2 , b = l n ( 0.5 ) 4 ϕ s 2 , D ( θ 3 ) = 36400 ϕ s θ 3 e θ 3 2 / 36400 .
The directivity gain of both antennae was experimented on in our previous work [1]. We denote antenna gain of bore sight (i.e., main-lobe) and others (i.e., side-lobe) as G and g, respectively; main-lobe gain is G = γ D and side-lobe gain is g = ( 1 γ ) D when the front-to-back lobe ratio (FBR) is γ (0 < γ ≤ 1, 1 for omni-direction). As shown in Figure 2, Tx and Rx antennae of vehicles can steer toward different sectors and beam-forming gain can be varying according to the directivity of those antennae. In Equation (4), connectivity range can be determined by the directivity gain of the Tx and Rx antennae as illustrated in Figure 3. When both antennae face toward each other, coverage is d 3 with gain G t G r . Directivity gain from only one antenna leads to G t g r or g t G r and coverage d 2 . Otherwise, the gain can be only g t g r and its coverage is d 1 .

3.3. Multi-Lane Road Model
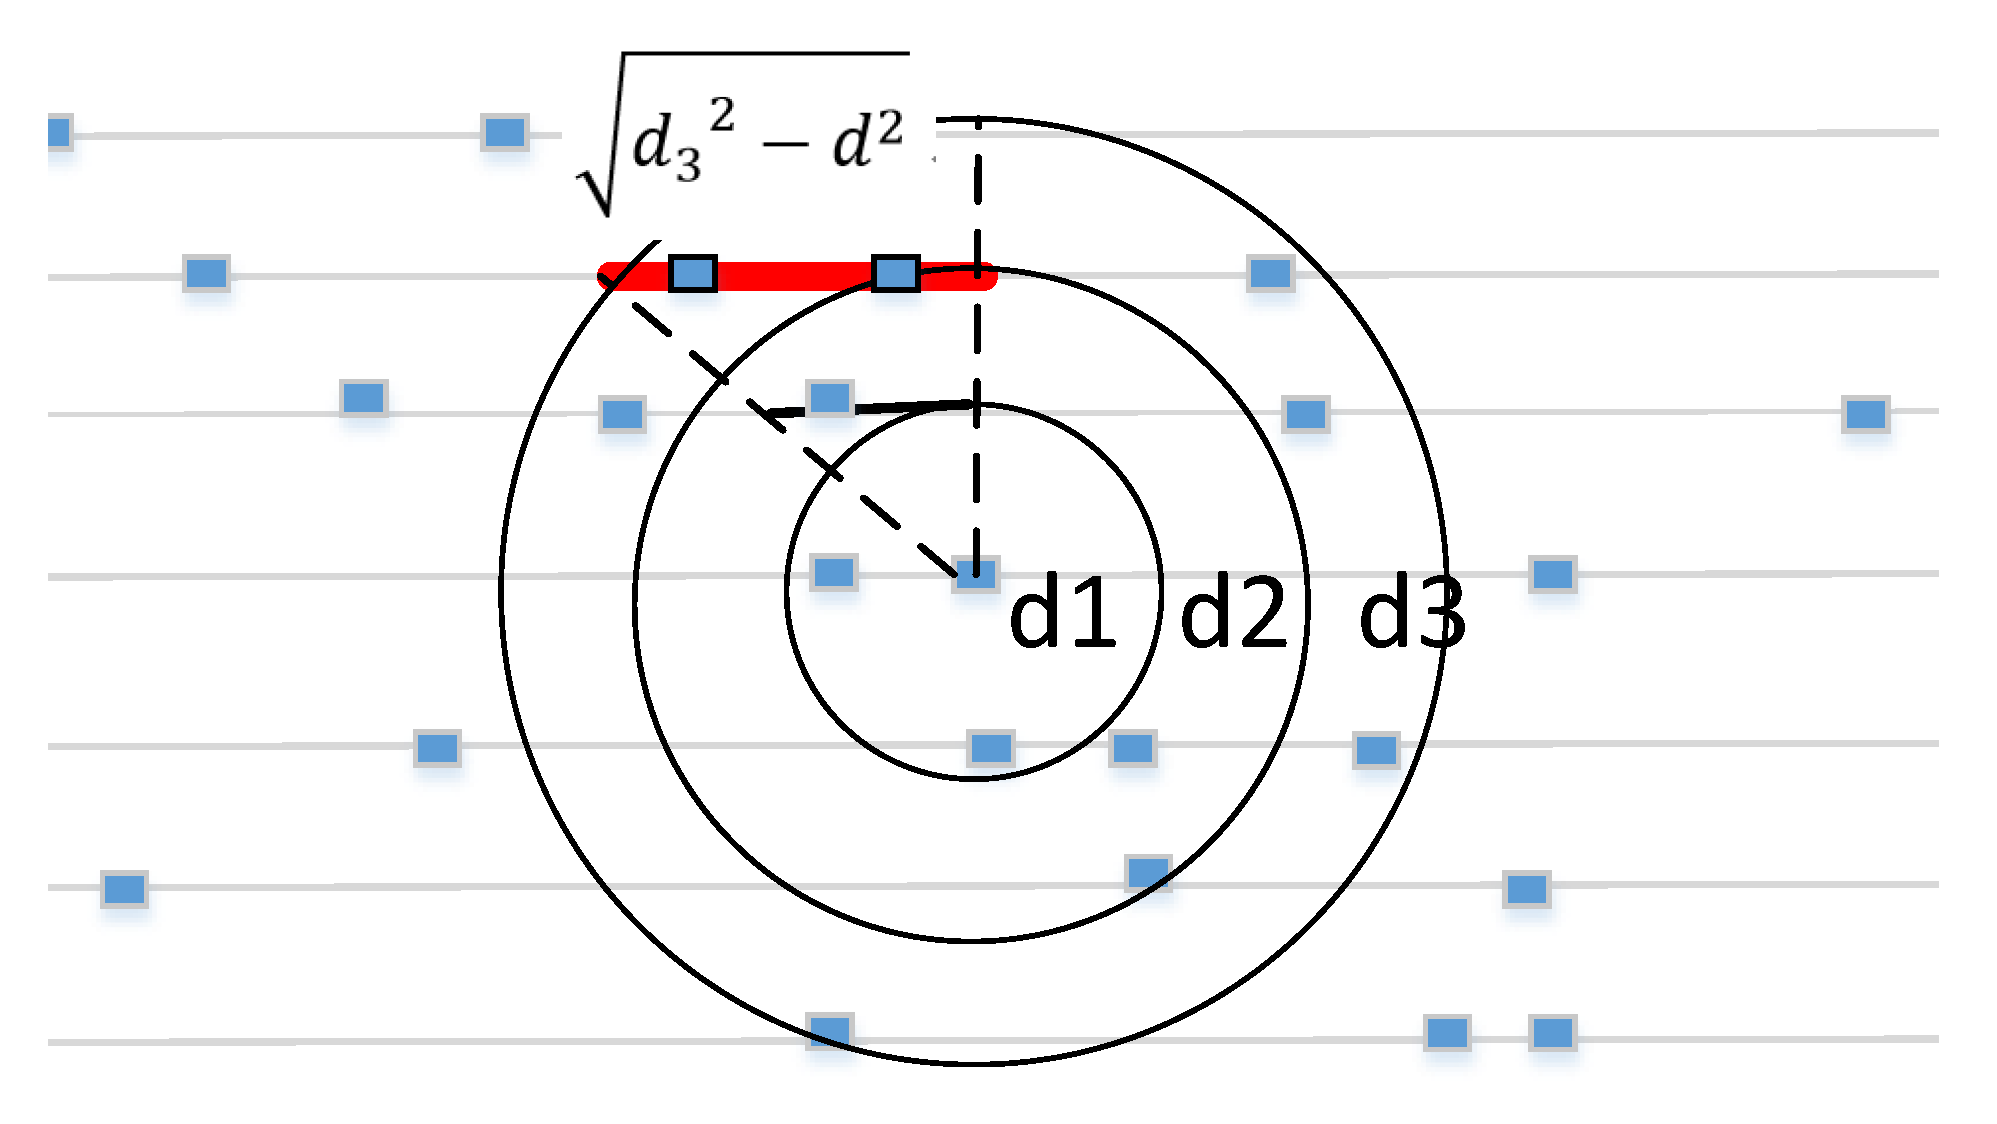
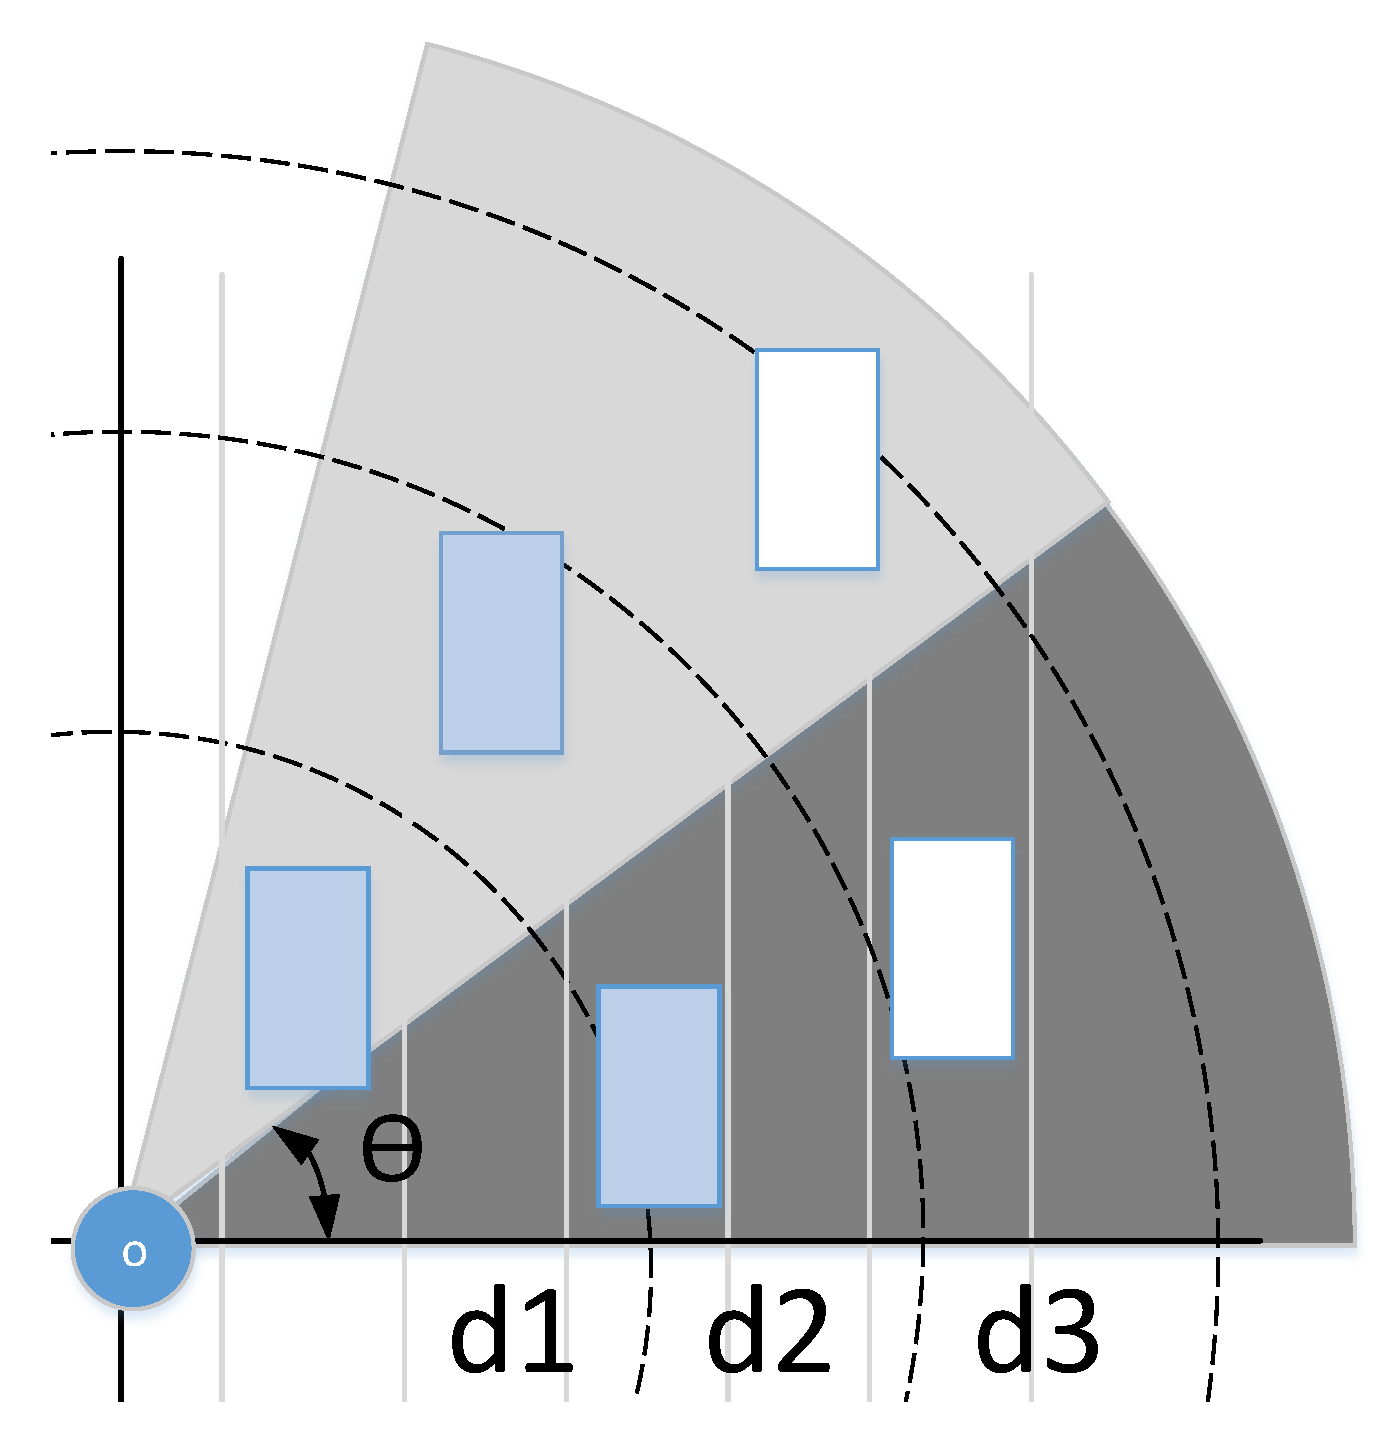
Vehicle distribution over the road area is modeled typically by 2D Poisson point process (2D-PPP), which shows more degree of freedom in vehicle location, but not tractable. In this paper, we adopt a multi-lane stochastic geometry model for directional mm-Wave vehicular communications, in which each of the multi-lanes is supposed to have consistent vehicle density λ for probability mass function [67].
The number of neighbor vehicles that a transmitting vehicle can reach is varying with radio range as shown in Figure 3. Average nodes in multiple lanes of each region d 1 , d 2 and d 3 can be calculated as below when vehicle densities of those regions are λ g g , λ G g and λ G G , respectively.
  • Number of neighbor vehicles in area d 1 : both vehicles can have connection regardless of beam direction.
    E [ N 1 ] = λ g g 2 d 1 + 4 d 1 2 d 2 , d < d 1 ,
    where d is distance from an origin node which is calculated by number of lanes (i.e., d = i L w , i-th lane with lane width L w ).
  • Number of neighbor vehicles in area d 2 : there are two cases of connectivity in the region, G t g r or g t G r .
    E [ N 2 ] = 2 λ G g 2 d 2 + 4 d 2 2 d 2 , d 1 d < d 2 .
  • Number of neighbor vehicles in area d 3 : both Tx and Rx antennae have beam directions toward each other.
    E [ N 3 ] = λ G G 2 d 3 + 4 d 3 2 d 2 , d 2 d < d 3 .
Consequently, total expected neighbor vehicles are E [ N ] = i E ( N d i ) , i { 1 , 2 , 3 }

3.4. Blockage Probability

Various sizes of vehicles at a road can cause blockage in mm-Wave links of V2V communications. Previously, the impact of vehicles as obstacles have been explored at their height point of view since the vehicles with different heights can affect transmitting signals by obstructing the Fresnel zone. In contrast to the DSRC spectrum, 5.9 GHz, mm-Wave has a very small Fresnel zone that is proportional to wavelength that determines diffraction characteristics. For example, zone radius of 5.9 GHz is 3 m while only 1 m at 60 GHz if a communication pair is apart by 500 m. In addition, the zone radius is proportional to the square root of distance. The zone radius converges into zero as the distance comes below 200 m at the mm-Wave link which implies that there is no effect from invisible obstacles in LOS considering the very short length of V2V links (less than 100 m).
As can be seen in Figure 4, vehicles closer to an origin can block signals from vehicles outside. In other words, the vehicles located on d 2 and d 3 regions may not have LOS toward the origin especially in higher node density. Based on lanes and node density, the LOS probability of each vehicle can be derived as follow.
θ = tan 1 d 2 2 i L w i L w
At a lane, i, block probability P b i can be calculated by road length and vehicle density.
P b i = L v λ i L w tan ( θ ) i L w tan ( θ ) = L v λ ,
where the L v is vehicle length.
Accordingly, block probability of a vehicle on a N-th lane is,
P b ( N ) = 1 i = 1 N 1 1 P b i .
Large vehicles such as trucks and buses typically cause blockage on the road compared to normal size vehicles; average height of the large vehicles is 3.35 m while one of the normal vehicles is 1.5 m. Average proportion of the large vehicles is about 15% of total vehicles. Accordingly, the blockage model can be built by PPP of the large vehicles which are independent of another PPP of the normal vehicles.

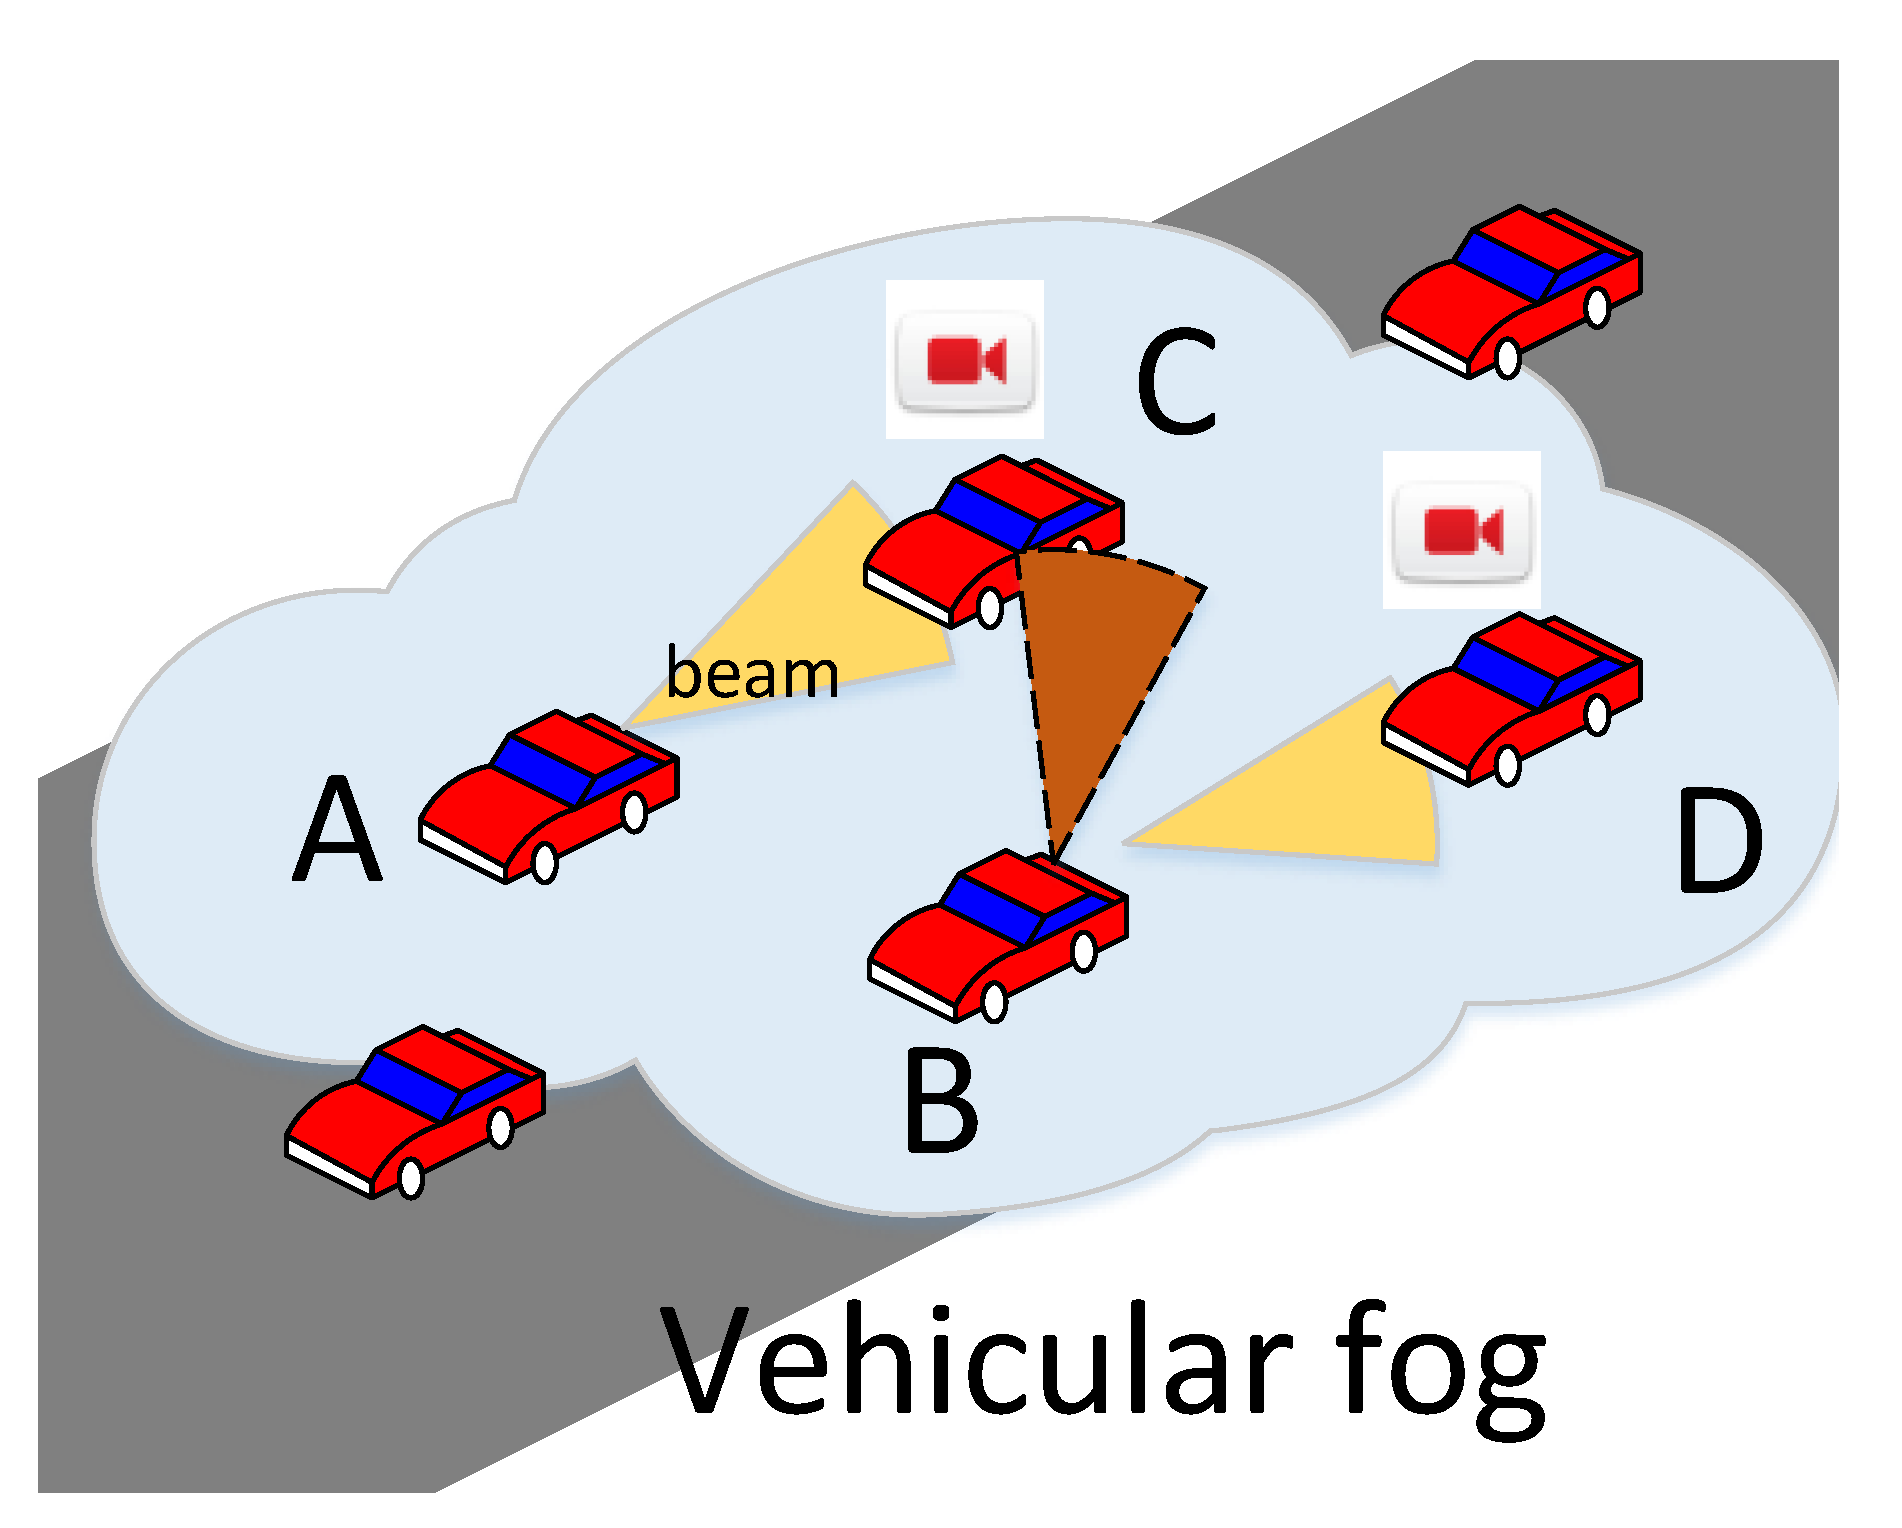
3.5. Beam Direction and Content Cache

To classify beam directions, we divide sectors based on road formation. When the vehicle length, e.g., L v = 4.5 m and number of lanes ( N L ) with each width ( L w ) are given, the minimum sector size θ can be tan 1 ( d / L v ) with beam range, d = N L L w ( d d 3 ).
The transmitting origin vehicle chooses randomly one of those beam sectors for content data delivery. Figure 5 shows there are two vehicles that have requested contents among eight neighbor vehicles. In a vehicular ICN, vehicles cache contents to improve network performance. Furthermore, each vehicle can cache coded blocks of content instead of an entire content in order to overcome the limitation of local storage and increase availability.
Caching probability p k | S is a proportion of sectors k = [ 1 , | S | ] that contain coded caches over total sectors. For example, the p k | S is 1 / 8 and 1 / 4 when the k = 1 and k = 2 in the example of Figure 5a,b, respectively.
The beam directions of vehicles in the vehicular fog depend on coded cache distribution for a content. For this, antenna gain in Figure 2 can be different according to number of coded caches, k. Suppose that only one of neighbour has coded blocks in the Figure 5a, the probability to get interference from neighbour nodes in range d 3 is P ( G t G r | k = 1 ) = 1 | S | as the cache and client nodes beam to each other. Meanwhile, P ( g t G r | k = 1 ) = 1 1 | S | for other sectors not chosen. For k = 2 , as the client node has two adjacent caches, there are two beam-forming cases of Figure 5a,b. First, the probability to face to each other is
P ( G t G r | k = 2 ) = 1 2 | S | .
Otherwise the client chooses the other cache,
P ( G t g r | k = 2 ) = 1 | S | 1 1 2 .
Table 2 shows four cases of beam-forming gain according to antenna directions when total k sectors have coded cache. Probability of each gain is denoted as p G G , p G g = P ( G t g r | k ) + P ( g t G r | k ) and p g g . Accordingly, effective antenna gain of the node i can be expressed as a discrete random variable, G g ( p g , k | S ) , g { G G , G g , g g } in following sections.

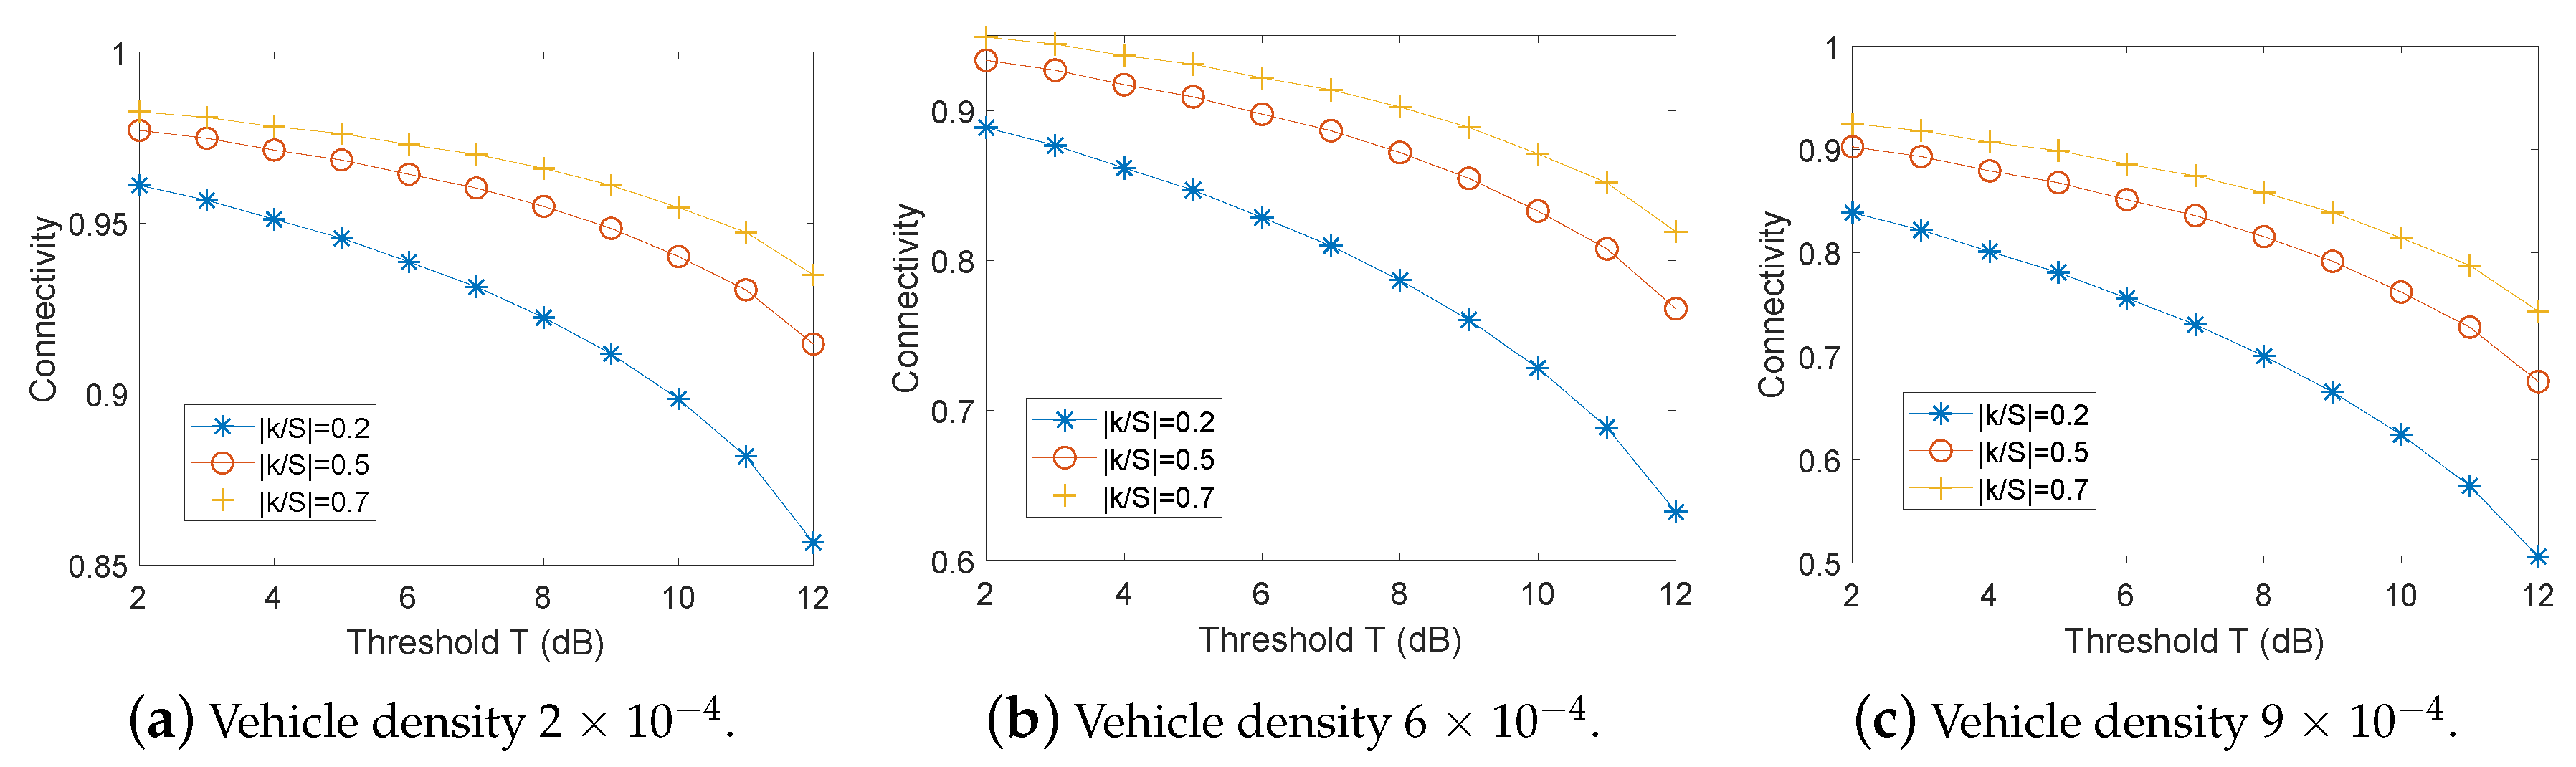
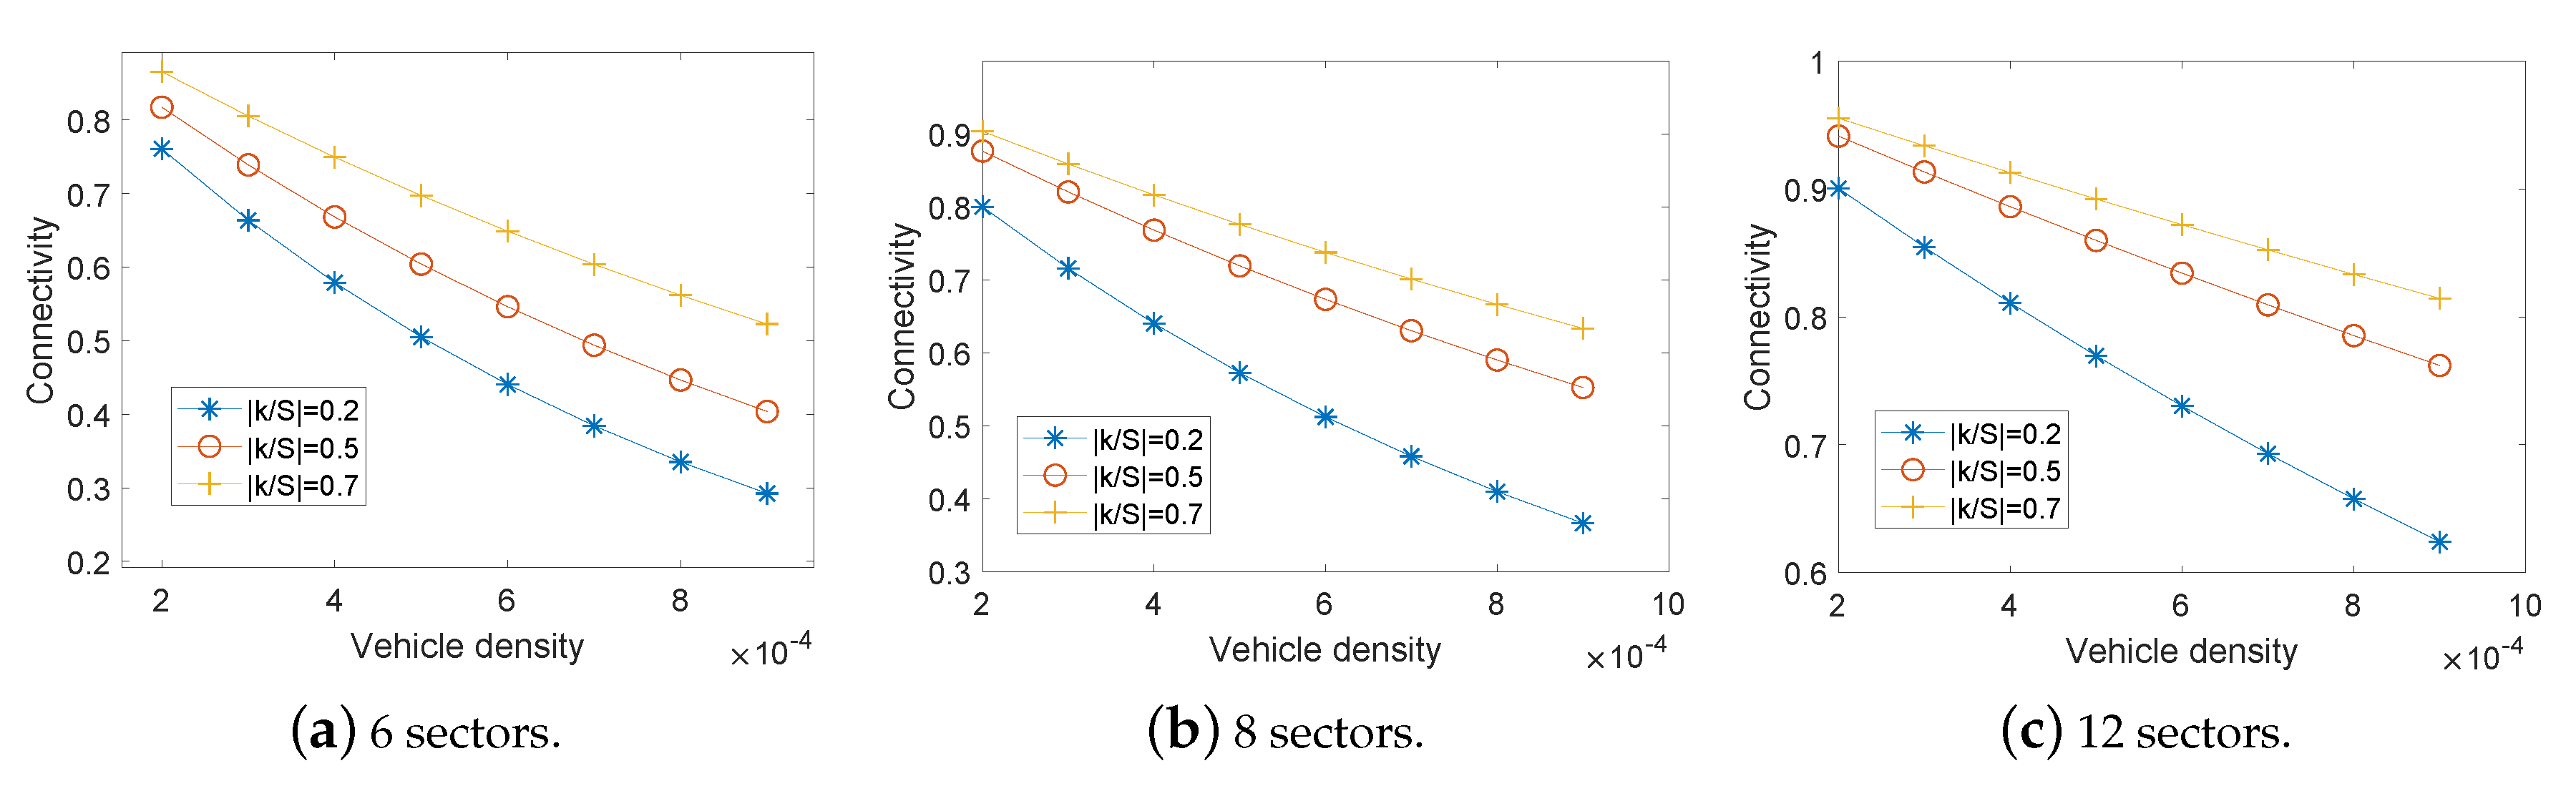
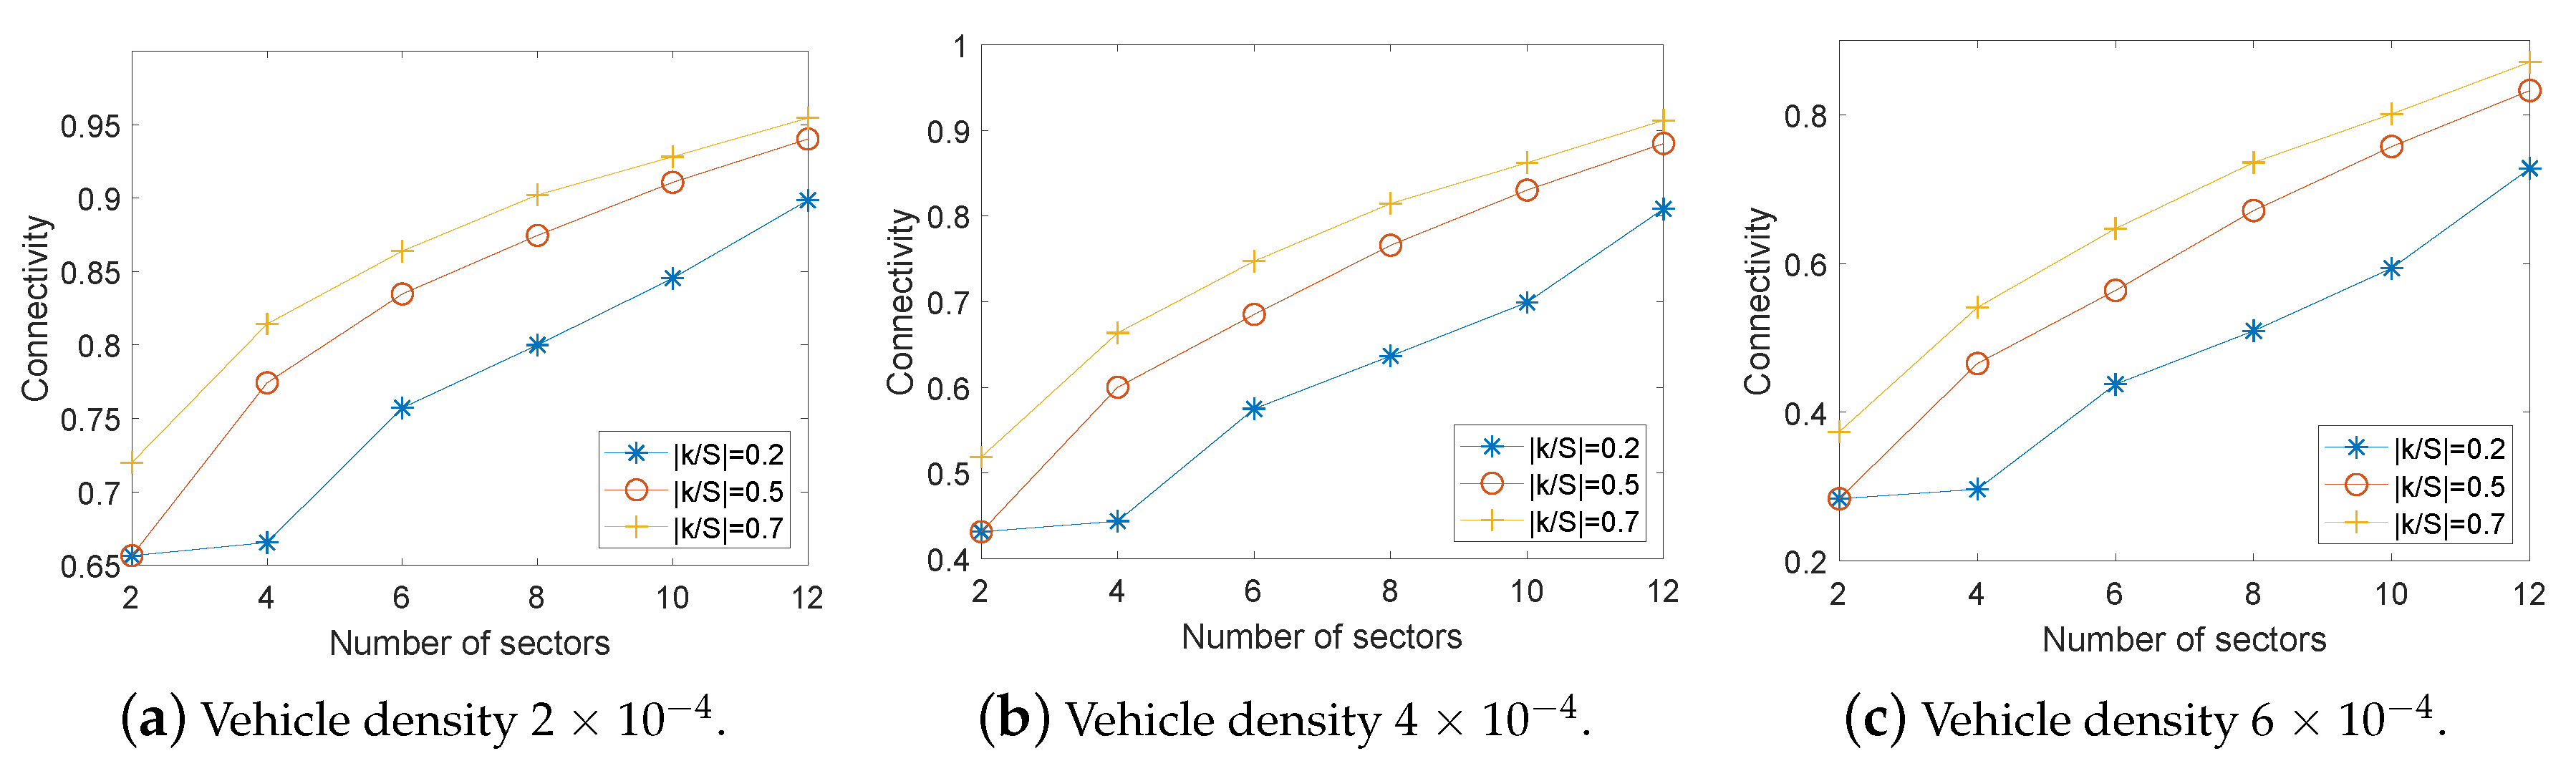
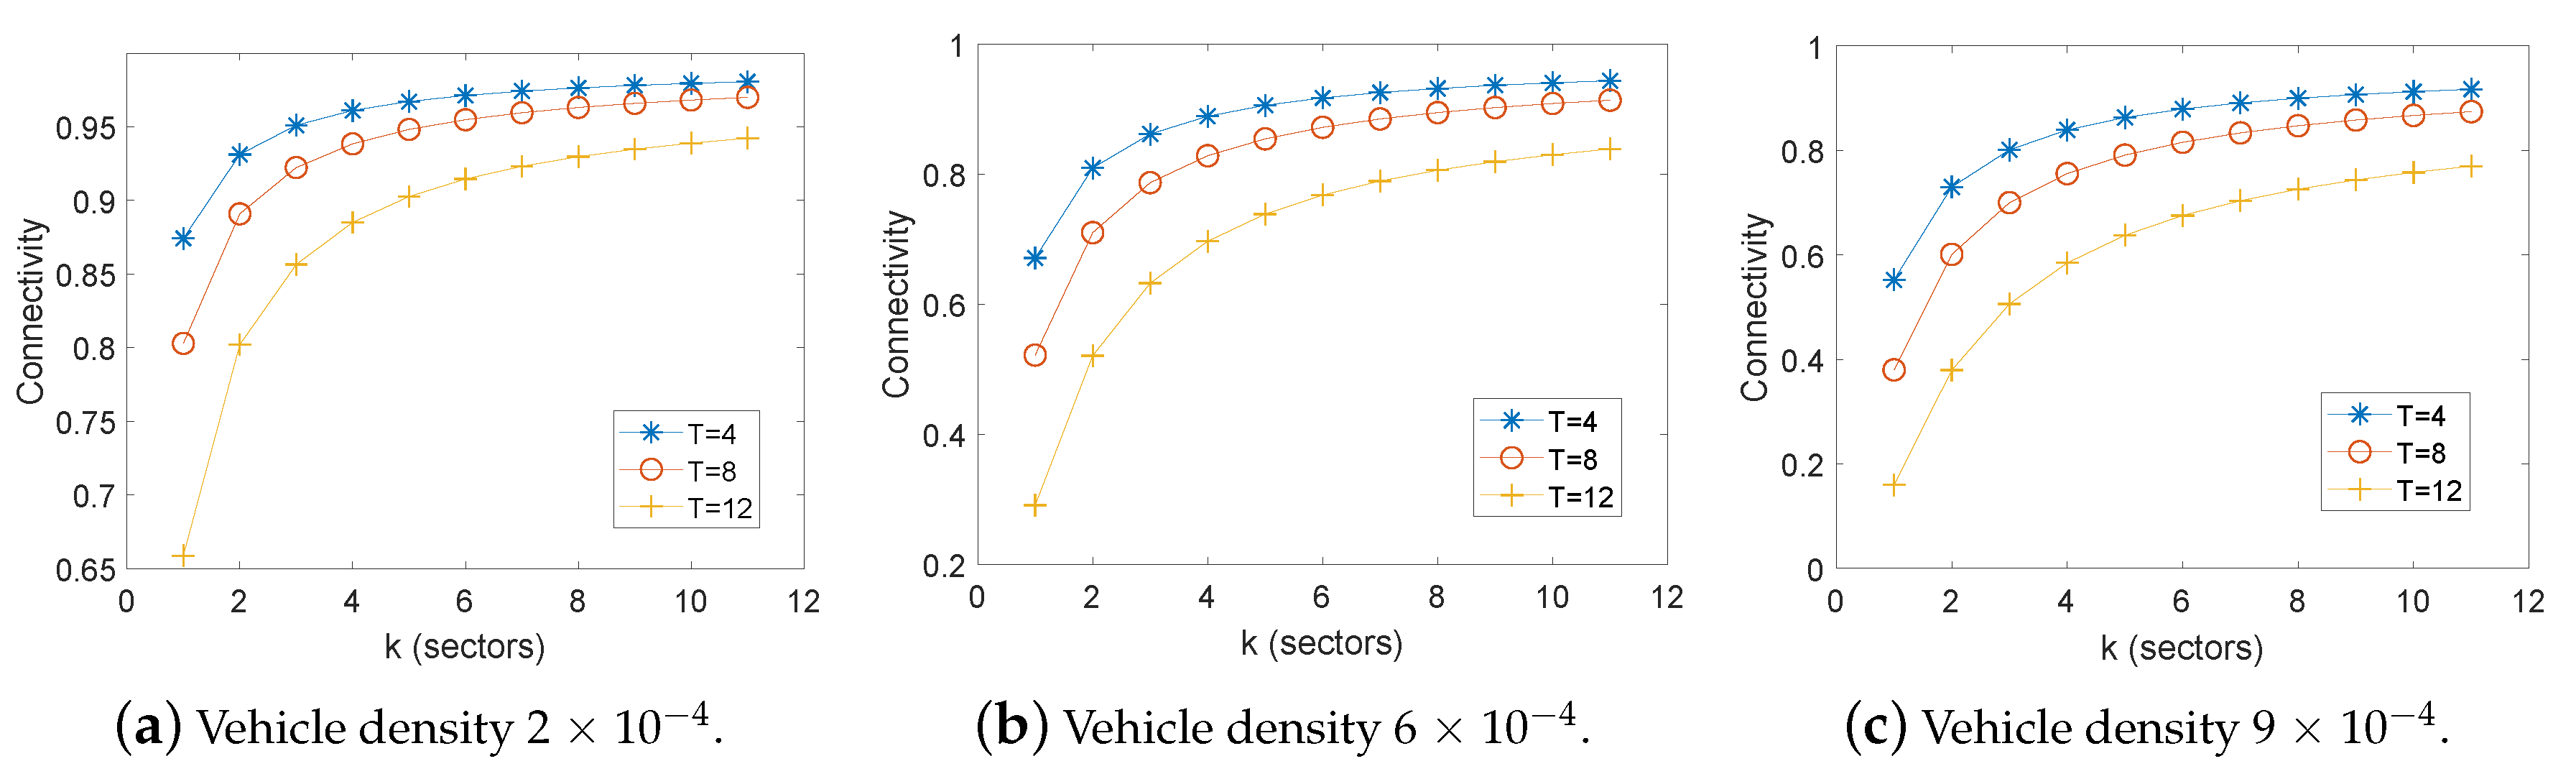
3.6. Connectivity Probability

In this section, we derive probability of beam connectivity based on the model of vehicular fog that is established in Section 3.2, Section 3.3, Section 3.4 and Section 3.5. Receive signal-to-interference-plus-noise ratio (SINR) of each vehicle is
S I N R = G 0 P t H 0 d α N 0 + n Φ G n P H n | X n | α ,
where d is distance between a transmitter and receiver with path loss exponent α at LOS, and H is channel fading modelled by Layleigh distribution. X n is distance between the origin and interference nodes.
The complementary cumulative distribution function (CCDF) of the SINR with target SINR T is referred to as connectivity probability, P c ( T ) = P ( S I N R T ) .
P ( S I N R T ) = P H 0 T d α ( N 0 + I Φ ) G 0 P t
= 0 P H 0 T d α G 0 P t f I Φ ( x ) d x
= 0 F H 0 c T d α G 0 P t f I Φ ( x ) d x = E I Φ e x p I Φ T d α G 0 P t .
Laplace transform of the aggregate interference in 2D-PPP at s = T d α G 0 P t is,
L I Φ ( s ) = E e x p ( s I Φ ) = E X Φ E H e x p ( s G g P H | X | α )
= E X Φ 1 1 + s G g P | X | α .
Using the probability generating functional (PGFL) of PPP,
L I Φ ( s ) = e x p λ I Φ R 2 1 1 + ( s G g P ) 1 | x | α x d x .
Here we convert the 2D multi-lane model into 1-D non-homogeneous PPP model using the compression factor as follows [67].
c ( d , i ) = 1 d 2 + 2 d 2 ( i L w ) 2 + 1 d ,
which maps positions in multi-lanes into ones of the central lane. The vehicle density of each coverage zone is λ g g = p g g λ , λ G g = p G g λ and λ G G = p G G λ . Accordingly, the PPP intensity of the transmitting vehicle on i-th lane becomes c ( d , i ) λ { G G , G g , g g } .
Therefore, the interference from the i-th lane can be calculated as
L g = G G i ( s ) = e x p R 1 c ( d , i ) p g , k | S λ 1 + ( s G g P ) 1 | x i | α d x i ,
where the p g , k | S = p G G and G g = G t G r for example of the d 3 coverage.
Finally, total interference with N = N R + N L lanes that are right and left-side lanes from the origin node is,
L I Φ ( s , p g , k | S ) = L G G 0 ( s ) × i = 1 N L g i ( s ) , g { G G , G g , g g } ,
where interferers are at LOS of each region. Thus, the interference at LOS and NLOS from the i-th lane can be denoted with the blockage probability, P b ( i ) as follow.
L I Φ i ( κ , p g , k | S ) = e x p ( R 1 c ( d , i ) p g , k | S λ 1 + κ | x i | α L ( 1 P b ( i ) ) d x i
R 1 c ( d , i ) p g , k | S λ 1 + κ | x i | α N P b ( i ) d x i ) ,
where κ = ( s G P ) 1 and pathloss exponent of LOS or NLOS, α L = 2 and α N = 4 are given by [68]. In consequence, aggregate interference of all regions as connectivity can be
P c ( k , S , T ) = p g , k | S L I Φ ( κ , p g , k | S ) , p g , k | S { p G G , p G g , p g g } .

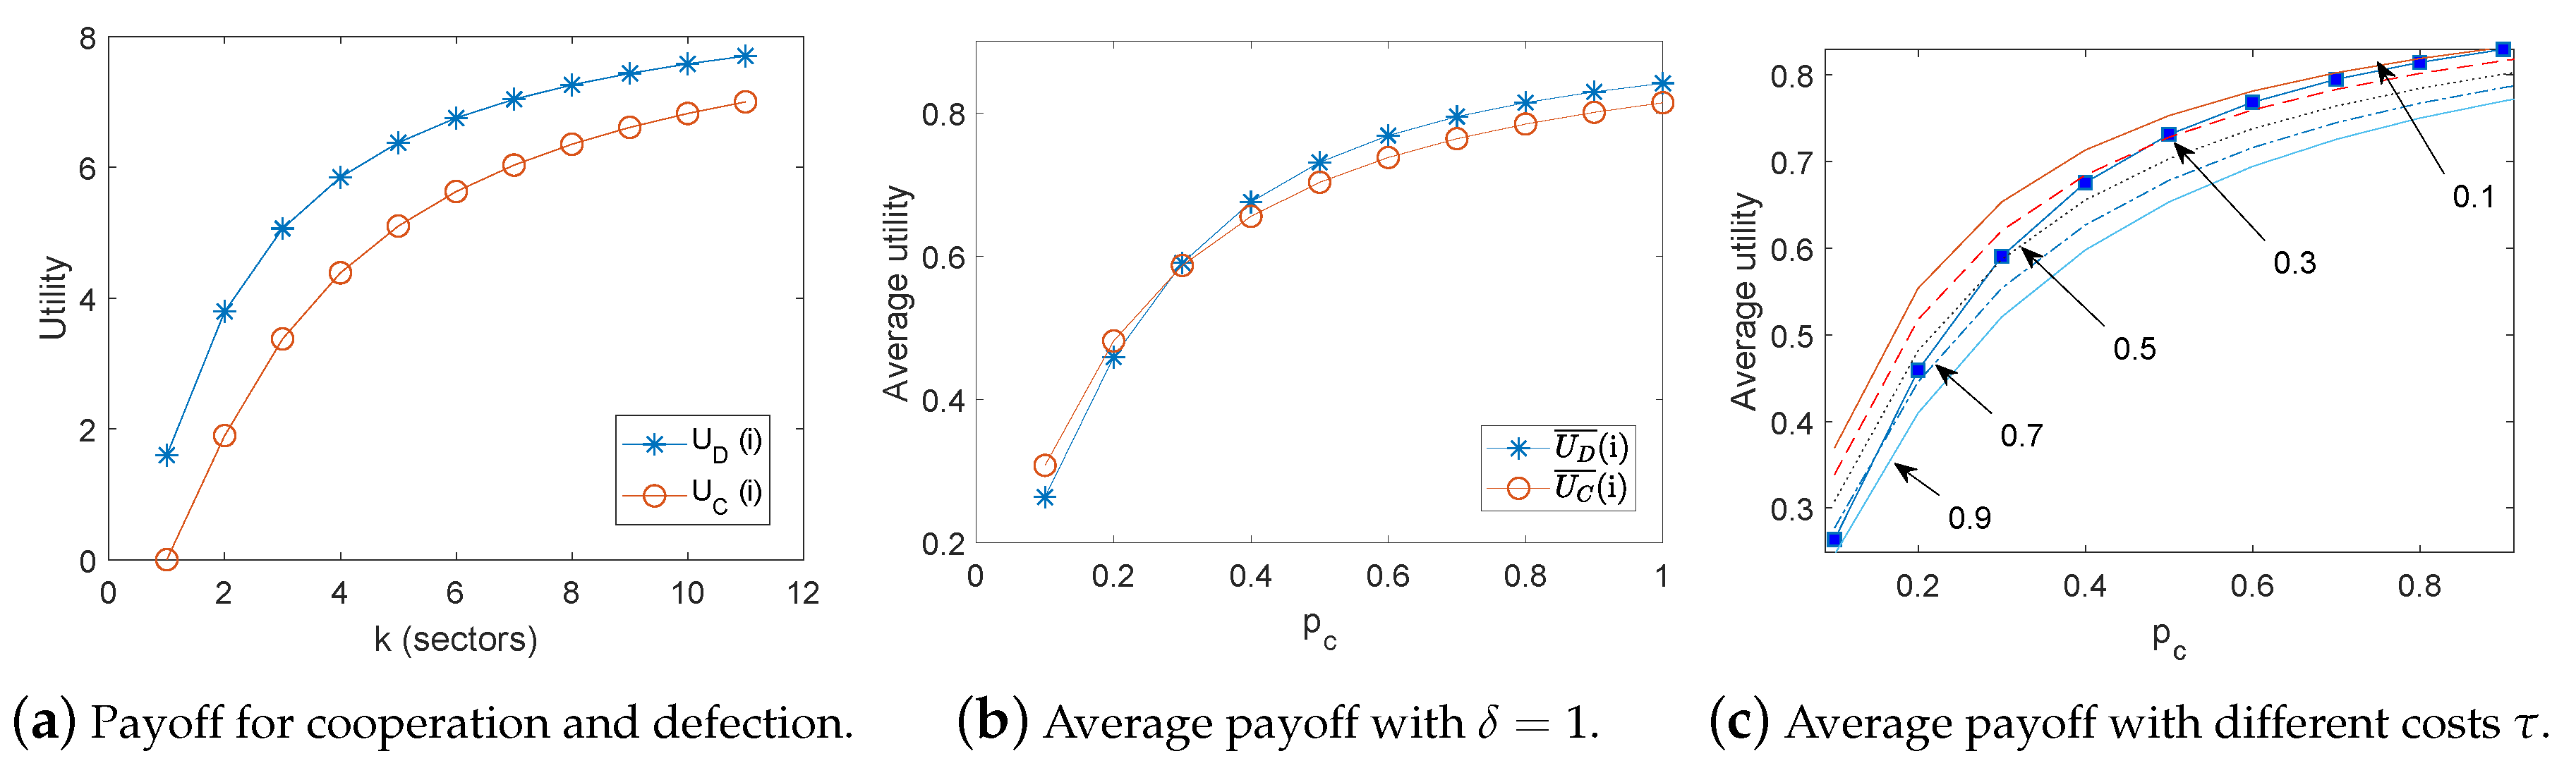
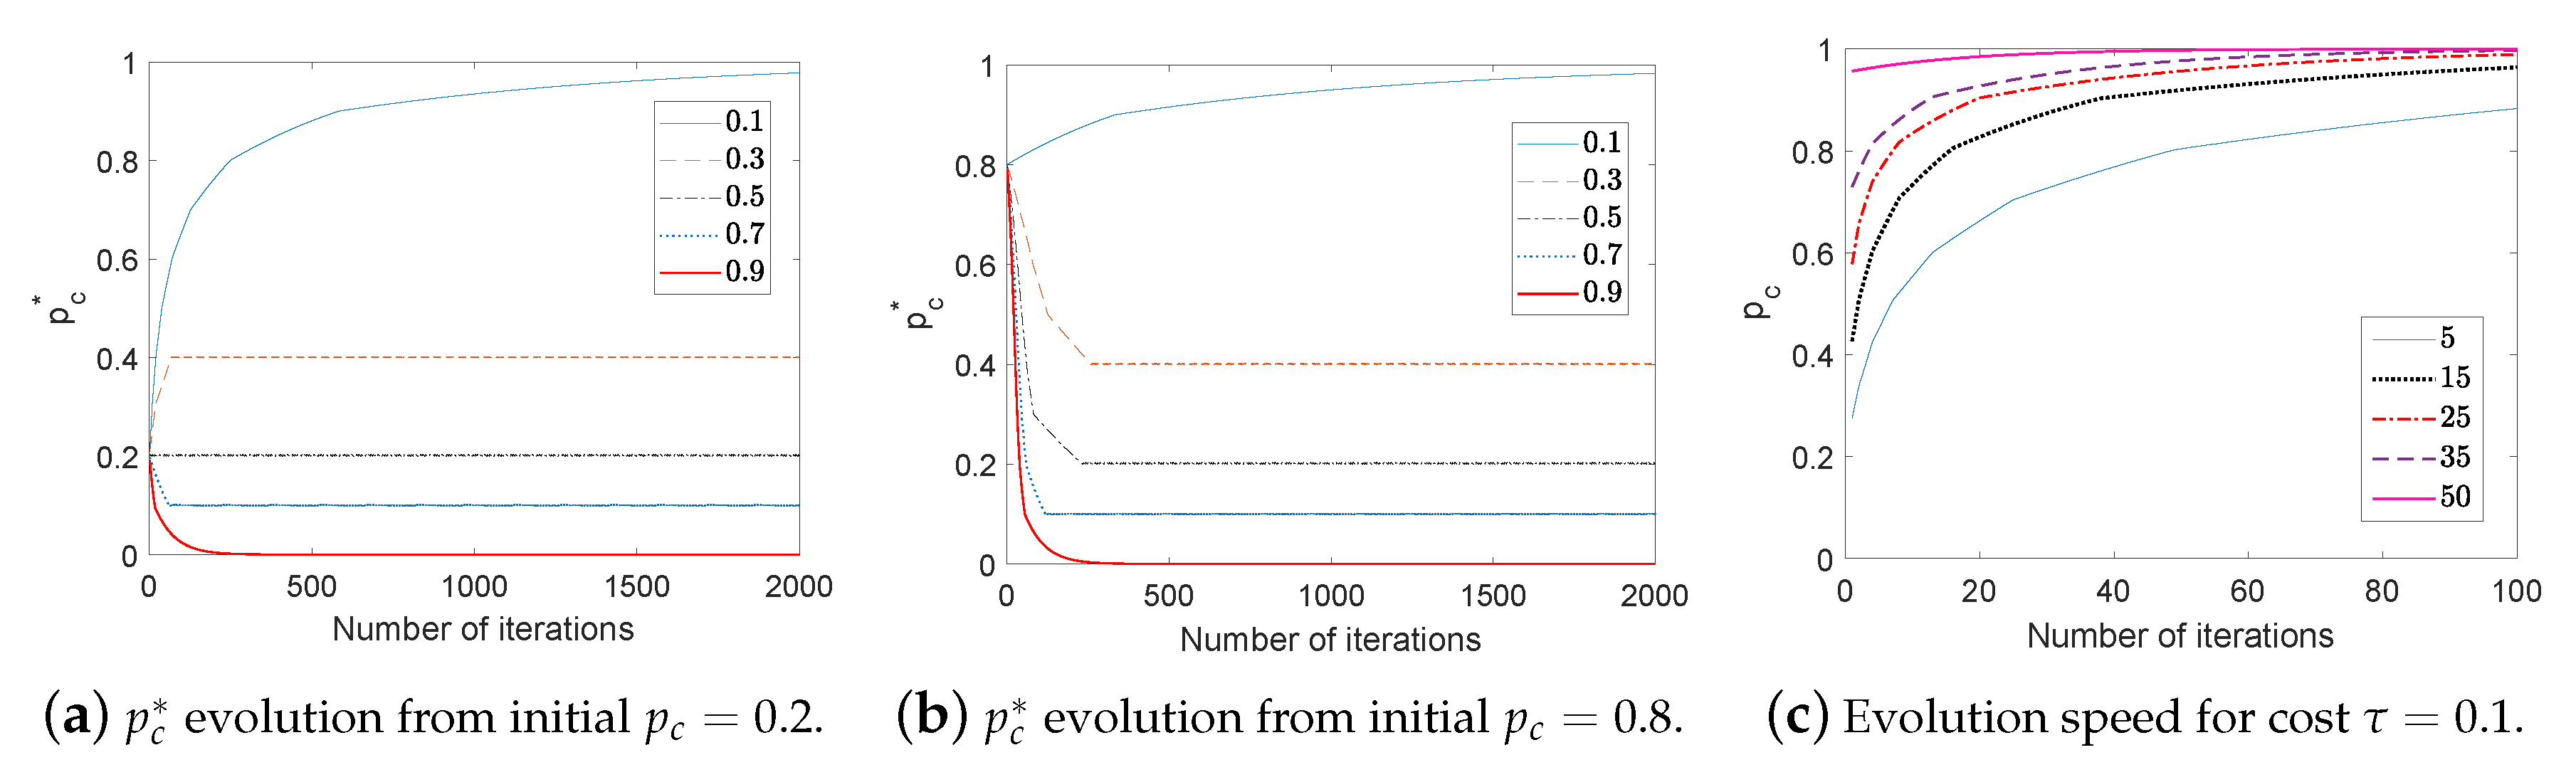
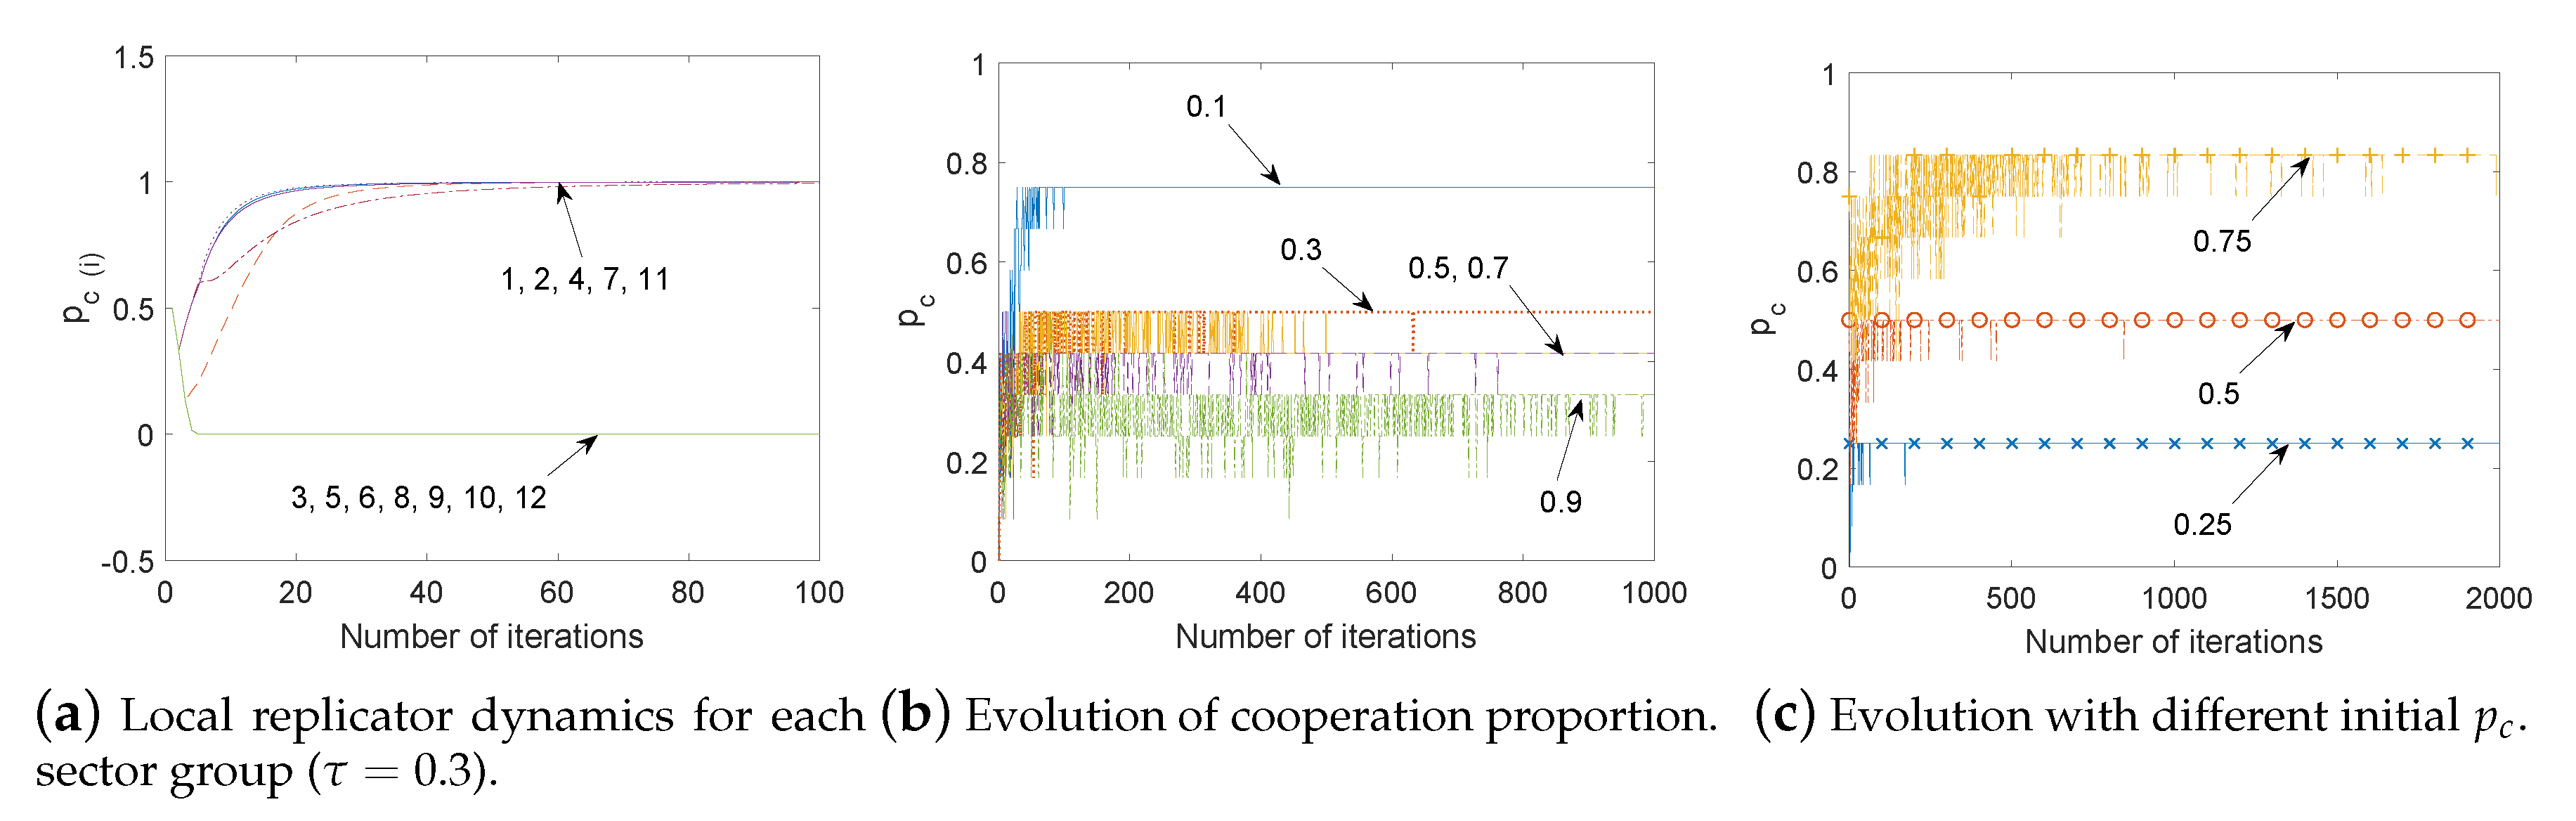
4. Evolutionary Content Cache Game

The content cache policy for a vehicular fog can be considered as a non-cooperative game, where the vehicles as game players play in selfish, only to request contents but not to share theirs. At last, vehicles can face the situation that no one stores coded blocks of contents and delivers them. Or, the vehicles can experience excessive interference with only a few cache nodes. For this, we apply the evolutionary game theory to the content caching, which leads the players to a robust equilibrium strategy by repeated strategic interactions. In detail, players change their strategies by comparing with others strategies’ payoff and eventually reach a dominant strategy that all players adopt and no mutant strategy can invade, called Evolutionarily Stable Strategy (ESS).
In the model of road sectorization, a group of vehicles located on a same sector is regarded as a single player in this evolutionary game, denoted by S = { s 1 , . . . , s K } . Each player has a strategy space { C , D } , cooperation (C) and defection (D); for cooperation, caching vehicles share coded blocks of contents and spend time to deliver them to clients as servers. Otherwise, vehicles only request contents as clients without caching.
When a client node i has neighbor caches in S sectors and has k cooperators among them, a payoff function of defection can be
U D ( i | k , S , T ) = δ i P c ( k , S , T )
where the payoff is instantaneous throughput derived by connectivity P c with SINR threshold, T and data rate δ . We assume that topology and interference are not changed during transmission time.
A payoff function of cooperation substrates costs from the payoff of defection.
U C ( i | k , S , T ) = U D ( i | k , S , T ) ( 1 τ k ) ,
where τ is a ratio of uploading data rate for serving content to the downloading data rate δ as a cost factor, and this cost is divided by total cooperators, k. For instance, τ can be 0.1 if the downloading rate is 1 Mbps and the uploading rate is 100 kbps. In other words, serving duration per vehicle becomes shorter as the number of cooperators increases.
When the fraction of cooperation for the content cache is p c , the average payoff of cooperation and defection can be calculated as below.
U D ¯ ( p c ) = k = 1 N 1 N 1 k p c k ( 1 p c ) N 1 k U D ( k )
U C ¯ ( p c ) = k = 1 N 1 N 1 k p c k ( 1 p c ) N 1 k U C ( k + 1 ) .
Using Equations (31) and (32), we can derive an overall payoff U ( p c ) = p c U C ¯ ( p c ) + ( 1 p c ) U D ¯ ( p c ) . Since this payoff is determined by the p c , we are interested in the population state, p c when the content caching is at equilibrium state by the ESS. If the p c is given by the ESS, U ( p , ϵ p + ( 1 ϵ ) p c ) U ( p c , ϵ p + ( 1 ϵ ) p c ) is satisfied for all mutant strategies p p c as equilibrium condition.
In our evolutionary game, two different scenarios are considered for a centralized and distributed algorithm; vehicles exchange their own strategy information or not. For the centralized algorithm, vehicles can choose own strategy based on others’ strategies. For the distributed algorithm, vehicles decide their own strategy based on their past experience. For the evolution of the population state, replicator dynamics need to be designed carefully in order to reach the ESS. In this study, we define the replicator dynamics as
p ˙ c = η p c ( 1 p c ) [ U ( c , p c ) U ( p ) ] ,
where the p c grows up with the rate of differential payoffs between pure cooperation strategy, c and mixed strategy (cooperation or defection), and η is a growth rate. These replicator dynamics can be applied to the centralized algorithm and show p c by the ESS.
In the distributed algorithm, since vehicles are uncertain of other vehicles’ strategy and payoff, they choose different strategies randomly out of equilibrium and learn from the past strategic interactions. For this learning process, each vehicle calculates average payoffs and evolution dynamics in time to adjust strategy. For example, a vehicle s i chooses the pure strategy, c for n times during T iterations, then U s i ¯ ( c , p s i ) = 1 n t T U s i ( c , p s i ) . Similarly, U s i ¯ ( p ) is average of all payoffs for past mixed strategies, 1 T t T U s i ( p ) Accordingly, the time evolution of the vehicle strategy can be
p c s i ( t + 1 ) = p c s i ( t ) + η p c s i ( t ) ( 1 p c s i ( t ) ) [ U s i ¯ ( c , p s i ) U s i ¯ ( p ) ] ,
where U s i ( c , p s i ) is the time average payoff of a vehicle s i with a pure cooperation strategy, c when p s i strategies of other vehicles s i are given. η is learning speed for evolution.

5. Experiments

Based on the channel, antenna and road segmentation models for V2V communications discussed in Section 3, we evaluate networking performance of the vehicular fog in terms of connectivity between a transmitter and receiver vehicle (both are apart by 20 m). Simulation parameters are shown in Table 3. All vehicles are assumed to use 60 GHz frequency and 2 GHz bandwidth, and constant transmission power, 12 dBm. Free-space pathloss is applied with exponents for LOS and NLOS cases, 2 and 4, respectively. The maximum number of lanes is 20 for each left and right-side from an origin vehicle. For a directional antenna, we use the rectangular sectoral radiation model (elevation π / 2 and γ = 0.2).
Figure 6 shows connectivity with varying SINR required for target modulation and coding scheme (MCS) levels. The connectivity decreases exponentially as the required SINR increases like in a typical BER (bit error ratio)-SNR curve. According to vehicle density, the connectivity is different due to the degree of interference from neighbor vehicles. For example, as the density increases from λ = 2 × 10 4 to 9 × 10 4 , connectivity decreases more than 20% as shown in Figure 6a–c. For the proportion of cached sectors k / S , the connectivity is improved as the k / S increases regardless of the node density. Thus, we can conclude that content caches contribute to diversifying beam directions and reduces interference. However, the improvement becomes less as the proportion becomes higher from 0.2 to 0.7.
The connectivity decreases almost exponentially by increasing vehicle density, especially when the k / S is small, 0.2 versus 0.5 or 0.7 as shown in Figure 7. Compared to the SINR threshold, the vehicle density is more critical to networking performance because of increasing interference. With more sectorization using narrow beam-width, inter-beam interference can be reduced. For example, six sectors in Figure 7a lead to around 55% connectivity while 12 sectors achieve 85% in Figure 7c when caching probability is k / S = 0.5 and vehicle density is λ = 6 × 10 4 .
The degree of sectorization can enhance vehicle connectivity by increasing spatial diversity. In Figure 8, the connectivity increases as vehicles have a higher probability to avoid inter-beam interference with more sectors. In addition, more antenna gain can be acquired from narrow beam-width. For | k / S | = 0.2 , the connectivity of two and four sectors are similar because both have only one cached sector and beam-forming gain is comparable. This connectivity gain from sectorization is notable especially with higher vehicle density as shown in Figure 8a,c. However, the connectivity increment becomes saturated. For example of Figure 8a, the connectivity increases almost 8% from 4 to 6 sectors, but only 2% from 6 to 8 sectors in case of k / S = 0.5 . In other words, there is a limitation to increase diversity gain from sectorization at a given vehicle density.
As we observed from the above experiments, the number of cached sectors affects the connectivity. Figure 9 shows connectivity with a varying number of cached sectors, k of total 12 sectors. The connectivity increases drastically especially in small k, but slightly after a certain k value. For example, increment after k = 4 is negligible in case of SINR threshold T = 4 dB. For a higher SINR threshold, more cached sectors are useful for enhancing connectivity.
From the above experimental results, we can conclude that narrow beam-forming is helpful for increasing connectivity. More caches can reduce interference, especially for a high SINR threshold. However, both approaches have a limitation in improving connectivity at a given vehicle density. Accordingly, the number of cached vehicles needs to be decided to achieve optimal connectivity within the vehicular fog.
In previous experiments, we were not concerned with the cost for content caching. Thus, the utility of cooperative or defective vehicles is investigated in Figure 10. Here the number of sectors, vehicle density and SINR threshold are configured as 12, λ = 9 × 10 4 and 12 dB, respectively. For the payoff function of cooperation and defection, cost value is τ = 0.5 and downloading data rate is δ = 10 . In Figure 10a, utility curves of both cooperation and defection are convex with an increasing number of cooperative sectors.
Figure 10b depicts average utility with normalized δ = 1 defined by Equations (31) and (32), where the number of cooperation sectors is one more than defection. Cooperation utility is little bit higher with low cooperation probability, p c , but lower with high p c than the defection utility. Accordingly, a vehicle probably chooses a cooperation strategy in lower p c while a defection strategy in high p c .
Figure 10c shows comparison of the average utility of defection and cooperation with different costs, τ . In the figure, the marked line indicates defection utility and other lines are for cooperation. The average utility of cooperation is higher than the defection with a lower cost when the cooperation proportion p c is low. For instance, if τ < 0.7 , the cooperation payoff is higher than defection until p c = 0.2 . With p c = 0.3 , the cost τ < 0.5 can be acceptable for vehicles to choose a cooperation strategy. The cooperation strategy is not attractive as the p c increases since connectivity does not increase notably after a certain number of caches as shown in Figure 9. Accordingly, vehicles prefer to select a defection strategy if either the p c or cost τ is high.
Figure 11 shows evolution of p c into the ESS using global strategy information for the cost τ from 0.1 to 0.9 when the payoff of strategy follows the Figure 10c. For this, a vehicle chooses its own strategy based on the global information using the replicator dynamics of Equation (33) and broadcasts its selection as the centralized algorithm. Here, we use two different initial p c = 0.2 and 0.8 with evolution speed, η is 1. According to the cost τ , p c of the ESS is 1, 0.4, 0.2, 0.1 and 0, respectively. Regardless of the initial p c , p c of the ESS is same as shown in Figure 11a,b. Evolution for the cost τ = 0.1 is slower than others since the difference between U D and U C becomes smaller as the p c increases. To exploit strategy convergence with different evolution speed, the η value is configured from 5 to 50 as shown in Figure 11c. The p c increases faster with the higher η values from the initial p c = 0.2 . However, it still takes time to converge into p c , so for implementation, p c can be chosen among possible discrete values, k / | S | instead of continuously increasing values.
Figure 12 shows p c evolution based on local replicator dynamics that has no global information of other vehicles’ selection. All vehicles conduct mixed strategies based on own probability p c s i ( t ) for each iteration. Each vehicle updates the p c s i ( t ) using the replicator dynamics of Equation (34) based on its history. There are many possible ESSs for this heterogeneous players’ game; all combinations of 1 or 0 for the p c of each sector are candidates or p c when U s i ¯ ( c , p s i ) = U s i ¯ ( p ) . For example, the sector 1, 2, 4, 7 and 11 choose cooperation strategy with p c = 1 while others choose defection as shown in Figure 12a, where evolution speed η is 2, cost τ is 0.3 and initial p c is 0.5. Coincidently, above ESS is the same as the result of centralized approach shown in Figure 11a,b, but it could be varying according to strategies chosen at initial phase of the iterations. Figure 12b shows proportion of cooperative sectors over total 12 sectors with different τ from 0.1 to 0.9. At an initial iteration where vehicles pursue a mixed strategy, the proportion p c changes dynamically, but it converges into a stable state as individual p c s i increases or decreases into 1 or 0. In contrast to the global algorithm that leads to a single ESS p c regardless of the initial state, the distributed algorithm can cause different stable points according to the initial p c as shown in Figure 12c. When each vehicle has own initial p c s i such as 0.75, 0.5 and 0.25 with cost τ = 0.3 , we can observe that cooperation proportion reaches into the stable point similar with the individual initial p c s i . With higher initial p c , each vehicle has higher probability to choose a cooperation strategy and experience better payoff, which increases the p c into 1. Otherwise, a vehicle may have better average payoff from defections rather than only a few cooperation because other cooperators raise the overall payoff at each iteration, and finally its p c s i goes to 0.

6. Conclusions

A platoon of autonomous vehicles constitutes a vehicular fog which collaboratively shares resources and data for vehicle control. In such dense vehicular fog, recent mm-Wave-based V2X communications can suffer from more interferences from neighbor vehicles forming beams using directional antennae. To avoid such mutual beam interference, we propose to distribute contents over vehicle caches to diversify mm-Wave beam directions. For this, we build a model of a sectorized multi-lane road and investigate throughput of the mm-Wave V2V communications using content caches. Experiments on the model show that a narrower beam and more caches can improve the connectivity but both have limitations in terms of increment. To decide the caching probability of each vehicle, we adopt an evolutionary game theory that allows vehicles to update their probability based on global information of caching strategy or only information of its past strategy. With the global information, homogeneous vehicles update caching probability together based on differential payoff between cooperation and defection. Otherwise, heterogeneous vehicles select their own strategy without interactions. Both approaches show that a stable proportion of vehicles cooperate for content cache to maximize their own utility after several hundred repeated games. This convergence speed needs to be enhanced to satisfy the dynamic topology of vehicular fog.

Funding

This work was partly supported by the Technology development Program of MSS (no. S2901002) and the ICT development R&D program of MSIT (no. NRF-2017R1C1B1006607).

Acknowledgments

In this section you can acknowledge any support given which is not covered by the author contribution or funding sections. This may include administrative and technical support, or donations in kind (e.g., materials used for experiments).

Conflicts of Interest

The authors declare no conflict of interest.

References

  1. Kim, W. MC-GiV2V: Multichannel Allocation in mmWave-Based Vehicular Ad Hoc Networks. Wirel. Commun. Mob. Comput. 2018, 2018, 2753025. [Google Scholar] [CrossRef]
  2. 3GPP. TR 37.885, Technical Specification Group Radio Access Networks, Study on Evaluation Methodology of New Vehicle-to-Everything (V2X) Use Cases for LET and NR, Rel. 16; Sophia-Antipolis: Valbonne, France, 2018. [Google Scholar]
  3. Petrov, V.; Kokkoniemi, J.; Moltchanov, D.; Lehtomäki, J.; Juntti, M.; Koucheryavy, Y. The impact of interference from the side lanes on mmWave/THz band V2V communication systems with directional antennas. IEEE Trans. Veh. Technol. 2018, 67, 5028–5041. [Google Scholar] [CrossRef]
  4. Zhou, P.; Fang, X.; Wang, X.; Long, Y.; He, R.; Han, X. Deep learning-based beam management and interference coordination in dense mmWave networks. IEEE Trans. Veh. Technol. 2018, 68, 592–603. [Google Scholar] [CrossRef]
  5. Gerla, M.; Lee, E.K.; Pau, G.; Lee, U. Internet of vehicles: From intelligent grid to autonomous cars and vehicular clouds. In Proceedings of the 2014 IEEE World Forum on Internet of Things (WF-IoT), Seoul, Korea, 6–8 March 2014; pp. 241–246. [Google Scholar]
  6. Nguyen, T.D.; Yang, L.L.; Hanzo, L. Systematic Luby transform codes and their soft decoding. In Proceedings of the 2007 IEEE Workshop on Signal Processing Systems, Shanghai, China, 17–19 October 2007; pp. 67–72. [Google Scholar]
  7. Shokrollahi, A. Raptor codes. IEEE Trans. Inf. Theory 2006, 52, 2551–2567. [Google Scholar] [CrossRef]
  8. Shojafar, M.; Cordeschi, N.; Baccarelli, E. Energy-efficient adaptive resource management for real-time vehicular cloud services. IEEE Trans. Cloud Comput. 2016, 7, 196–209. [Google Scholar] [CrossRef]
  9. Zheng, K.; Meng, H.; Chatzimisios, P.; Lei, L.; Shen, X. An SMDP-based resource allocation in vehicular cloud computing systems. IEEE Trans. Ind. Electron. 2015, 62, 7920–7928. [Google Scholar]
  10. Yu, R.; Zhang, Y.; Gjessing, S.; Xia, W.; Yang, K. Toward cloud-based vehicular networks with efficient resource management. IEEE Netw. 2013, 27, 48–55. [Google Scholar] [CrossRef] [Green Version]
  11. Lee, E.; Lee, E.K.; Gerla, M.; Oh, S.Y. Vehicular cloud networking: Architecture and design principles. IEEE Commun. Mag. 2014, 52, 148–155. [Google Scholar] [CrossRef]
  12. Ahlgren, B.; Dannewitz, C.; Imbrenda, C.; Kutscher, D.; Ohlman, B. A survey of information-centric networking. IEEE Commun. Mag. 2012, 50, 26–36. [Google Scholar] [CrossRef]
  13. Xylomenos, G.; Ververidis, C.N.; Siris, V.A.; Fotiou, N.; Tsilopoulos, C.; Vasilakos, X.; Katsaros, K.V.; Polyzos, G.C. A survey of information-centric networking research. IEEE Commun. Surv. Tutor. 2013, 16, 1024–1049. [Google Scholar] [CrossRef]
  14. Zhang, M.; Luo, H.; Zhang, H. A survey of caching mechanisms in information-centric networking. IEEE Commun. Surv. Tutor. 2015, 17, 1473–1499. [Google Scholar] [CrossRef]
  15. Kim, W. Beyond LTE-advance for information centric networking. Comput. Stand. Interfaces 2017, 49, 59–66. [Google Scholar] [CrossRef]
  16. Bouk, S.H.; Ahmed, S.H.; Kim, D. Vehicular content centric network (VCCN) a survey and research challenges. In Proceedings of the 30th Annual ACM Symposium on Applied Computing, Salamanca, Spain, 13–17 April 2015; pp. 695–700. [Google Scholar]
  17. Wang, Y.; Li, Z.; Tyson, G.; Uhlig, S.; Xie, G. Optimal cache allocation for content-centric networking. In Proceedings of the 2013 21st IEEE International Conference on Network Protocols (ICNP), Goettingen, Germany, 7–10 October 2013; pp. 1–10. [Google Scholar]
  18. Zhang, Y.; Tan, X.; Li, W. PPC: Popularity prediction caching in ICN. IEEE Commun. Lett. 2017, 22, 5–8. [Google Scholar] [CrossRef]
  19. Montpetit, M.J.; Westphal, C.; Trossen, D. Network coding meets information-centric networking: An architectural case for information dispersion through native network coding. In Proceedings of the 1st ACM Workshop on Emerging Name-Oriented Mobile Networking Design-Architecture, Algorithms, and Applications, Hilton Head, SC, USA, 11–14 June 2012; pp. 31–36. [Google Scholar]
  20. Liu, W.X.; Yu, S.Z.; Zhu, P.Y. Multisource Dissemination in content-centric networking. In Proceedings of the 2013 Fourth International Conference on the Network of the Future (NoF), Pohang, Korea, 23–25 October 2013; pp. 1–5. [Google Scholar]
  21. Wang, J.; Ren, J.; Lu, K.; Wang, J.; Liu, S.; Westphal, C. An optimal cache management framework for information-centric networks with network coding. In Proceedings of the 2014 IFIP Networking Conference, Trondheim, Norway, 2–4 June 2014; pp. 1–9. [Google Scholar]
  22. Maddah-Ali, M.A.; Niesen, U. Decentralized coded caching attains order-optimal memory-rate tradeoff. IEEE/ACM Trans. Netw. 2014, 23, 1029–1040. [Google Scholar] [CrossRef] [Green Version]
  23. Amiri, M.M.; Yang, Q.; Gündüz, D. Decentralized coded caching with distinct cache capacities. In Proceedings of the 2016 50th Asilomar Conference on Signals, Systems and Computers, Pacific Grove, CA, USA, 6–9 November 2016; pp. 734–738. [Google Scholar]
  24. Luo, T.; Aggarwal, V.; Peleato, B. Coded caching with distributed storage. IEEE Trans. Inf. Theory 2019, 65, 7742–7755. [Google Scholar] [CrossRef]
  25. Mital, N.; Gündüz, D.; Ling, C. Coded caching in a multi-server system with random topology. IEEE Trans. Commun. 2020, 68, 4620–4631. [Google Scholar] [CrossRef]
  26. Wang, P.; Li, Y.; Song, L.; Vucetic, B. Multi-gigabit millimeter wave wireless communications for 5G: From fixed access to cellular networks. IEEE Commun. Mag. 2015, 53, 168–178. [Google Scholar] [CrossRef]
  27. Dehos, C.; González, J.L.; De Domenico, A.; Ktenas, D.; Dussopt, L. Millimeter-wave access and backhauling: The solution to the exponential data traffic increase in 5G mobile communications systems? IEEE Commun. Mag. 2014, 52, 88–95. [Google Scholar] [CrossRef]
  28. Zola, E.; Kassler, A.J.; Kim, W. Joint user association and energy aware routing for green small cell mmWave backhaul networks. In Proceedings of the 2017 IEEE Wireless Communications and Networking Conference (WCNC), San Francisco, CA, USA, 19–22 March 2017; pp. 1–6. [Google Scholar]
  29. Hilt, A. Availability and Fade Margin Calculations for 5G Microwave and Millimeter-Wave Anyhaul Links. Appl. Sci. 2019, 9, 5240. [Google Scholar] [CrossRef] [Green Version]
  30. Rappaport, T.S.; Sun, S.; Mayzus, R.; Zhao, H.; Azar, Y.; Wang, K.; Wong, G.N.; Schulz, J.K.; Samimi, M.; Gutierrez, F. Millimeter wave mobile communications for 5G cellular: It will work! IEEE Access 2013, 1, 335–349. [Google Scholar] [CrossRef]
  31. Sun, S.; MacCartney, G.R.; Samimi, M.K.; Nie, S.; Rappaport, T.S. Millimeter wave multi-beam antenna combining for 5G cellular link improvement in New York City. In Proceedings of the 2014 IEEE International Conference on Communications (ICC), Sydney, Australia, 10–14 June 2014; pp. 5468–5473. [Google Scholar]
  32. MacCartney, G.R.; Rappaport, T.S. 73 GHz millimeter wave propagation measurements for outdoor urban mobile and backhaul communications in New York City. In Proceedings of the 2014 IEEE International Conference on Communications (ICC), Sydney, Australia, 10–14 June 2014; pp. 4862–4867. [Google Scholar]
  33. IEEE Std 802.15.3c-2009. Wireless Medium Access Control (MAC) and Physical Layer (PHY) Specifications for High Rate Wireless Personal Area Networks (WPANs); IEEE Standards Association Press: Piscataway, NJ, USA, 2009; Volume 49, pp. 114–121. [Google Scholar]
  34. IEEE. Part11: Wireless LAN Medium Acess Control (MAC) and Physical Layer (PHY) Specifications C Amendment 5: Enhancements for Very High Throughput in the 60 GHz Band. IEEE P802.11ad/D1.0; IEEE: Piscataway, NJ, USA, 2010. [Google Scholar]
  35. Chen, Q.; Peng, X.; Yang, J.; Chin, F. Spatial reuse strategy in mmWave WPANs with directional antennas. In Proceedings of the 2012 IEEE Global Communications Conference (GLOBECOM), Anaheim, CA, USA, 3–7 December 2012; pp. 5392–5397. [Google Scholar]
  36. Son, I.K.; Mao, S.; Gong, M.X.; Li, Y. On frame-based scheduling for directional mmWave WPANs. In Proceedings of the 2012 Proceedings IEEE INFOCOM, Orlando, FL, USA, 25–30 March 2012; pp. 2149–2157. [Google Scholar] [CrossRef]
  37. Singh, S.; Mudumbai, R.; Madhow, U. Distributed coordination with deaf neighbors: Efficient medium access for 60 GHz mesh networks. In Proceedings of the 2010 Proceedings IEEE INFOCOM, San Diego, CA, USA, 14–19 March 2010; pp. 1–9. [Google Scholar]
  38. Shihab, E.; Cai, L.; Pan, J. A distributed asynchronous directional-to-directional MAC protocol for wireless ad hoc networks. IEEE Trans. Veh. Technol. 2009, 58, 5124–5134. [Google Scholar] [CrossRef] [Green Version]
  39. Va, V.; Shimizu, T.; Bansal, G.; Heath, R.W., Jr. Millimeter wave vehicular communications: A survey. Found. Trends Netw. 2016, 10, 1–113. [Google Scholar] [CrossRef]
  40. Antonescu, B.; Moayyed, M.T.; Basagni, S. mmWave channel propagation modeling for V2X communication systems. In Proceedings of the 2017 IEEE 28th Annual International Symposium on Personal, Indoor, and Mobile Radio Communications (PIMRC), Montreal, QC, Canada, 8–13 October 2017; pp. 1–6. [Google Scholar]
  41. Anjinappa, C.K.; Guvenc, I. Millimeter-wave V2X channels: Propagation statistics, beamforming, and blockage. In Proceedings of the 2018 IEEE 88th Vehicular Technology Conference (VTC-Fall), Chicago, IL, USA, 27–30 August 2018; pp. 1–6. [Google Scholar]
  42. Wang, Q.; Matolak, D.W.; Ai, B. Shadowing Characterization for 5 GHz Vehicle-to-Vehicle Channels. IEEE Trans. Veh. Technol. 2017, 67, 1855–1866. [Google Scholar] [CrossRef]
  43. He, R.; Ai, B.; Stuber, G.L.; Wang, G.; Zhong, Z. A cluster based geometrical model for millimeter wave mobile-to-mobile channels. In Proceedings of the 2017 IEEE/CIC International Conference on Communications in China (ICCC), Qingdao, China, 22–24 October 2017; pp. 1–6. [Google Scholar]
  44. He, R.; Ai, B.; Stüber, G.L.; Wang, G.; Zhong, Z. Geometrical-based modeling for millimeter-wave MIMO mobile-to-mobile channels. IEEE Trans. Veh. Technol. 2018, 67, 2848–2863. [Google Scholar] [CrossRef]
  45. Giordani, M.; Shimizu, T.; Zanella, A.; Higuchi, T.; Altintas, O.; Zorzi, M. Path loss models for V2V mmWave communication: Performance evaluation and open challenges. In Proceedings of the 2019 IEEE 2nd Connected and Automated Vehicles Symposium (CAVS), Honolulu, HI, USA, 22–23 September 2019; pp. 1–5. [Google Scholar]
  46. He, D.; Wang, L.; Guan, K.; Ai, B.; Kim, J.; Zhong, Z. Channel characterization for mmwave vehicle-to-infrastructure communications in urban street environment. In Proceedings of the 2019 13th European Conference on Antennas and Propagation (EuCAP), Krakow, Poland, 31 March–5 April 2019; pp. 1–5. [Google Scholar]
  47. Tassi, A.; Egan, M.; Piechocki, R.J.; Nix, A. Modeling and Design of Millimeter-Wave Networks for Highway Vehicular Communication. IEEE Trans. Veh. Technol. 2017, 66, 10676–10691. [Google Scholar] [CrossRef] [Green Version]
  48. Lorca, J.; Hunukumbure, M.; Wang, Y. On overcoming the impact of Doppler spectrum in millimeter-wave V2I communications. In Proceedings of the 2017 IEEE Globecom Workshops (GC Wkshps), Singapore, 4–8 December 2017; pp. 1–6. [Google Scholar]
  49. Wang, Y.; Venugopal, K.; Molisch, A.F.; Heath, R.W. MmWave vehicle-to-infrastructure communication: Analysis of urban microcellular networks. IEEE Trans. Veh. Technol. 2018, 67, 7086–7100. [Google Scholar] [CrossRef] [Green Version]
  50. Yi, W.; Liu, Y.; Deng, Y.; Nallanathan, A.; Heath, R.W. Modeling and analysis of MmWave V2X networks with vehicular platoon systems. IEEE J. Sel. Areas Commun. 2019, 37, 2851–2866. [Google Scholar] [CrossRef]
  51. González-Prelcic, N.; Méndez-Rial, R.; Heath, R.W. Radar aided beam alignment in mmwave V2I communications supporting antenna diversity. In Proceedings of the 2016 Information Theory and Applications Workshop (ITA), La Jolla, CA, USA, 31 January–5 February 2016; pp. 1–7. [Google Scholar]
  52. Kumari, P.; Choi, J.; Prelcic, N.G.; Heath, R.W. IEEE 802.11 ad-based Radar: An Approach to Joint Vehicular Communication-Radar System. IEEE Trans. Veh. Technol. 2017, 67, 3012–3127. [Google Scholar] [CrossRef] [Green Version]
  53. Choi, J.; Va, V.; Gonzalez-Prelcic, N.; Daniels, R.; Bhat, C.R.; Heath, R.W. Millimeter-wave vehicular communication to support massive automotive sensing. IEEE Commun. Mag. 2016, 54, 160–167. [Google Scholar] [CrossRef] [Green Version]
  54. Mavromatis, I.; Tassi, A.; Piechocki, R.J.; Nix, A. Beam alignment for millimetre wave links with motion prediction of autonomous vehicles. In Proceedings of the Antennas, Propagation & RF Technology for Transport and Autonomous Platforms, Birmingham, UK, 2 February 2017. [Google Scholar]
  55. Perfecto, C.; Del Ser, J.; Bennis, M. On the interplay between scheduling interval and beamwidth selection for low-latency and reliable V2V mmWave communications. In Proceedings of the 2017 20th Conference on Innovations in Clouds, Internet and Networks (ICIN), Paris, France, 7–9 March 2017; pp. 1–8. [Google Scholar]
  56. Perfecto, C.; Del Ser, J.; Bennis, M. Millimeter-wave V2V communications: Distributed association and beam alignment. IEEE J. Sel. Areas Commun. 2017, 35, 2148–2162. [Google Scholar] [CrossRef] [Green Version]
  57. Va, V.; Choi, J.; Heath, R.W. The impact of beamwidth on temporal channel variation in vehicular channels and its implications. IEEE Trans. Veh. Technol. 2017, 66, 5014–5029. [Google Scholar] [CrossRef]
  58. Loch, A.; Asadi, A.; Sim, G.H.; Widmer, J.; Hollick, M. mm-Wave on wheels: Practical 60 GHz vehicular communication without beam training. In Proceedings of the 2017 9th International Conference on Communication Systems and Networks (COMSNETS), Bangalore, India, 4–8 January 2017; pp. 1–8. [Google Scholar]
  59. Park, J.J.; Lee, J.; Liang, J.; Kim, K.W.; Lee, K.C.; Kim, M.D. Millimeter wave vehicular blockage characteristics based on 28 GHz measurements. In Proceedings of the 2017 IEEE 86th Vehicular Technology Conference (VTC-Fall), Toronto, ON, Canada, 24–27 September 2017; pp. 1–5. [Google Scholar]
  60. Kim, W. Experimental demonstration of MmWave vehicle-to-vehicle communications using IEEE 802.11 ad. Sensors 2019, 19, 2057. [Google Scholar] [CrossRef] [Green Version]
  61. Huo, Y.; Lu, F.; Wu, F.; Dong, X. Multi-beam multi-stream communications for 5G and beyond mobile user equipment and UAV proof of concept designs. In Proceedings of the 2019 IEEE 90th Vehicular Technology Conference (VTC2019-Fall), Honolulu, HI, USA, 22–25 September 2019; pp. 1–5. [Google Scholar]
  62. Huo, Y.; Dong, X.; Xu, W.; Yuen, M. Enabling multi-functional 5G and beyond user equipment: A survey and tutorial. IEEE Access 2019, 7, 116975–117008. [Google Scholar] [CrossRef]
  63. Maltsev, A.; Pudeyev, A.; Karls, I.; Bolotin, I.; Morozov, G.; Weiler, R.; Peter, M.; Keusgen, W. Quasi-deterministic approach to mmwave channel modeling in a non-stationary environment. In Proceedings of the 2014 Globecom Workshops (GC Wkshps), Austin, TX, USA, 8–12 December 2014; pp. 966–971. [Google Scholar]
  64. Weiler, R.J.; Peter, M.; Keusgen, W.; Maltsev, A.; Karls, I.; Pudeyev, A.; Bolotin, I.; Siaud, I.; Ulmer-Moll, A.M. Quasi-deterministic millimeter-wave channel models in MiWEBA. EURASIP J. Wirel. Commun. Netw. 2016, 2016, 84. [Google Scholar] [CrossRef] [Green Version]
  65. Maltsev, A.; Maslennikov, R.; Sevastyanov, A.; Khoryaev, A.; Lomayev, A. Experimental investigations of 60 GHz WLAN systems in office environment. IEEE J. Sel. Areas Commun. 2009, 27. [Google Scholar] [CrossRef]
  66. Reference Radiation Patterns of Omnidirectional, Sectoral and Other Antennas for the Fixed and Mobile Service for Use in Sharing Studies in the Frequency Range from 400 MHz to about 70 GHz; Recommendation F.1336; ITU-R: Geneva, Switzerland, 2014.
  67. Farooq, M.J.; ElSawy, H.; Alouini, M.S. A stochastic geometry model for multi-hop highway vehicular communication. IEEE Trans. Wirel. Commun. 2016, 15, 2276–2291. [Google Scholar] [CrossRef] [Green Version]
  68. Thornburg, A.; Bai, T.; Heath, R.W. Performance analysis of outdoor mmWave ad hoc networks. IEEE Trans. Signal Process. 2016, 64, 4065–4079. [Google Scholar] [CrossRef]
Figure 1. Vehicular fog architecture with directional mm-Wave communication links.
Electronics 09 01794 g001
Figure 2. Beam directions by sectorized antennae of Tx and Rx. According to beam direction of a Tx and Rx, different antenna gain causes 3 different radio ranges.
Electronics 09 01794 g002
Figure 3. 2D-Poisson Point Process (PPP) on multiple lanes locates vehicles along lanes. Vehicle density can be different to the beam coverage that is decided by beam-forming gain.
Electronics 09 01794 g003
Figure 4. Blockage model in multilane highway. Some vehicles in d 1 range region can block signals from an origin in other lanes of d 2 and d 3 ; colored vehicles blocks signals for two vehicles on d 3 regions.
Electronics 09 01794 g004
Figure 5. Beam diversification toward coded caches in sectors. In (a), beams from adjacent client nodes can interfere in the single cache node. In contrast, the client node can choose one of cache nodes randomly which can decrease probability of inter-beam interference as shown in (b).
Electronics 09 01794 g005
Figure 6. Connectivity ( P c ) versus signal-to-interference-plus-noise ratio (SINR) threshold (T) with S = 12 sectors. |k/S| is a proportion of cached sectors over total sectors.
Electronics 09 01794 g006
Figure 7. Connectivity ( P c ) versus vehicle densities with threshold T = 10 dB.
Electronics 09 01794 g007
Figure 8. Connectivity ( P c ) versus number of sectors with threshold T = 10 dB.
Electronics 09 01794 g008
Figure 9. Connectivity ( P c ) versus k among S = 12 sectors.
Electronics 09 01794 g009
Figure 10. Payoff and average payoff for defection and cooperation.
Electronics 09 01794 g010
Figure 11. Evolution of p c based on payoff of cooperation and defection.
Electronics 09 01794 g011
Figure 12. Content cache probability using distributed algorithm based on local replicator dynamics.
Electronics 09 01794 g012
Table 1. Symbols for the mm-Wave V2X model.
SymbolDescriptionUnit
PLPathlossdB
NFNoise figuredB
IL, CBImplementation and cable lossdB
SSet of sectors{1, 2, …,|S|}
dDistance between vehiclesmeter
G t , G r Antenna gain for Tx or RxdBi
TThreshold of target SNRdB
P t Transmission powerdBm
λ Vehicle density
L w Lane width of roadmeter
L v Average vehicle lengthmeter
P b Beam blockage probability[0, 1]
P c Connectivity probability[0, 1]
α Pathloss exponent2, 4
HChannel response
Table 2. Probability of beam-forming gain with cache sectors, k.
Gain P c Range
G t G r 1 | S | 1 k d 3
G t g r 1 | S | ( 1 1 k ) d 2
g t G r ( 1 1 | S | ) 1 k d 2
g t g r ( 1 1 | S | ) ( 1 1 k ) d 1
Table 3. Simulation parameters.
ParameterValueUnit
Freq60GHz
BW2GHz
P t 12dBm
d20meter
NF3dB
IL + CB27dB
L w 3meter
L v 4meter
Max lanes40
γ 0.2
α L 2
α N 4
Publisher’s Note: MDPI stays neutral with regard to jurisdictional claims in published maps and institutional affiliations.

