Abstract
This paper connects two large research areas, namely sentiment analysis and human–robot interaction. Emotion analysis, as a subfield of sentiment analysis, explores text data and, based on the characteristics of the text and generally known emotional models, evaluates what emotion is presented in it. The analysis of emotions in the human–robot interaction aims to evaluate the emotional state of the human being and on this basis to decide how the robot should adapt its behavior to the human being. There are several approaches and algorithms to detect emotions in the text data. We decided to apply a combined method of dictionary approach with machine learning algorithms. As a result of the ambiguity and subjectivity of labeling emotions, it was possible to assign more than one emotion to a sentence; thus, we were dealing with a multi-label problem. Based on the overview of the problem, we performed experiments with the Naive Bayes, Support Vector Machine and Neural Network classifiers. Results obtained from classification were subsequently used in human–robot experiments. Despise the lower accuracy of emotion classification, we proved the importance of expressing emotion gestures based on the words we speak.
1. Introduction
The population is getting older. According to the World Health Organization (WHO), it is estimated that by the year 2050, the elderly will account for 25% of the world population (35% of the population in Europe) (https://www.un.org/en/development/desa/population/publications/pdf/ageing/WPA2017_Highlights.pdf). Caring for these seniors—physically, emotionally and mentally—will be an enormous undertaking, and experts say there will be a shortage of trained professionals and those willing to take on the job. Robots may fill the gap, taking care of older people. The shortage of trained professionals and desire to age-in-place can be solved by social assistive robotics. While there exist assistive robotics [1] (e.g., intelligent walkers, wheelchair robots, manipulator arms and exoskeletons), they lack the social aspect as well as the affective component.
In this situation, it is essential to devote research that goes beyond the concept of assistive robotics, and which will focus on the development of a robot that would also be a companion of an elderly. In this type of robot, the key factor is its acceptance by humans. We need to equip the robot with abilities that would make it a pleasant companion and thus a companion who can at least partially understand the emotional mood of the elderly. This means that based on what the person says, looks like and how the person behaves, the robot will be able to choose the right answers and movements or gestures. We focused on estimating the emotional state of the elderly, mainly from what the person says. We also focused on the analysis of speech, specifically in its written form, as today numerous the speech to text systems able to reliably transform speech into text. We used the text as the input and analyzed it in terms of emotions, which falls into a very current area of research—analysis of sentiment.
Wada et al. [2] studied the psychological effects of a seal robot, PARO, used to engage seniors at a day service center. Results show moods of elderly people were improved by interaction with the robots over the course of a 6-week period. Šabanovic et al. [3] used PARO in a study with older adults with dementia. They showed that PARO provides indirect benefits for users by increasing their activity in particular modalities of social interaction, including visual, verbal and physical interaction. PARO also has positive effects on older adults’ activity levels over the duration of study, suggesting they are not due to short-term ‘novelty effects’. Huang and Huang [4] conveyed a study to explore the elderly’s acceptance of companion robots from the perspective of user factors. They found that the elderly living with parents, with master’s (or doctor’s) education, medical professional background and experience in the use of scientific and technological products expressed more positive attitudes in the responses to the items on the constructs of attitude and perceived usefulness, while the attitude of those with primary school education and humanities professional background, with no experience in scientific and technological products, was relatively negative.
The presented studies indicate that the communication of older adults with a robot can be beneficial, it can improve their emotional mood, increase their activity in particular modalities of various kinds of interactions. On the other hand, there is a big obstacle in their negative approach to communication with the robot, especially in the group of people with only primary education and with no experience with scientific and technological products. We focused on this problem and tried to help break down these people’s prejudices about robots, for example, by equipping the robot with the ability to be sensitive to the emotions that an older adult expresses in some way. The scenario in which we wanted to verify the achieved results was as follows. A robot can use information about the polarity of a mood of the elderly to communicate with him/her friendly, sensitive and appropriately. When a robot communicates with a human (e.g., an elder), it must choose one from many answers which are suitable for the situation. For example, it can choose an answer which can cheer up the person, if it has information that the current emotional mood of the person is sad. It can also adapt its movements and choose a movement from all possible ones to cheer up this elderly. The robot should have prepared answers and movements for all possible basic emotions of an elderly. Finally, the understanding of the emotional moods of humans can lead to better acceptance of a communication with robots.
The main contributions of the paper can be summarized as follows:
- The development of the new approach to emotions analysis from texts. Whereas the field of sentiment analysis is quite well-researched, emotions analysis faces a problem of insufficient accuracy because it represents the multi-class classification problem, where the classes correspond to the emotions. We trained machine learning methods, particularly for each emotion and then the ensemble of binary classifiers was used for emotions classification in a human–robot interaction scenario.
- We used lexicon-based and machine learning approaches to the emotion analysis. Models for emotion classification were trained using various machine learning methods, e.g., Naive Bayes (Multi-nomial, Bernoulli and Gaussian), Support Vector Machine and feed-forward neural network using various data representations such as Bag-of-Words, TF-IDF and sentence embeddings (ConceptNet Numberbatch).
- The ensemble classifier consisted of nine best models for each emotion. The model was demonstrated in four different scenarios with the humanoid robot NAO.
- Results of the experiments, which conclude that the best scenario for human acceptance is the one with emotions classification accompanied by emotional movements of the robot. Experiments with communication between human and robot NAO showed that human acceptance of a robot could be increased using an analysis of the emotional mood of the human.
2. Background
2.1. Sentiment Analysis
Sentiment analysis is an interdisciplinary field connecting natural language processing (NLP), computational linguistic and text mining. As we can see from the number of papers published by reputable conferences and journal papers in NLP and computational linguistics, it is an admittedly hot topic. The vital role is to deal with opinion, sentiment and subjectivity in text. It attempts to analyze and take advantage of extensive quantities of user-generated content and enables the computer to ‘understand’ text.
Research Tasks in Sentiment Analysis
Sentiment analysis involves various research tasks [5], such as:
- subjectivity detection aiming to discover subjective or neutral terms, phrases or sentences and is frequently used as an initial step in polarity and intensity classifications, to separate subjective information from the objective. Adjectives (beautiful) and adverbs (perfectly) are remarkably capable of expressing subjectivity. On the other hand, also to achieve a high degree of accuracy, we must include the verb (destroy). These subjective words are embedded into dictionaries along with their polarity;
- polarity classification attempts to classify texts into positive, negative or neutral terms. It forms the basis for determining the polarity of the text as a whole. There are three degrees of polarity: positive (excellent), neutral (average) and negative (poor). Determining the polarity of words is closely connected with switching polarity problems. Switching polarity [6] can be done by negation, which is the reason for extending the polarity of words to determine the polarity of combinations of words (taking into account entire sentences or parts of the sentence);
- intensity classification goes a step further and attempts to identify the different degrees of positivity and negativity; e.g., strongly-negative, negative, fair, positive and strongly positive. It can be best described by numbers or words. A numerical description is helpful when processing on computers. The intensity of polarity significantly changes the polarity of collocation; e.g., surprisingly good, highly qualitative;
- opinion spam is another problem inhibiting accurate sentiment analysis. In recent years we noticed an increased demand for opinion classification, but almost no attention has been paid to examining the credibility of opinions in reviews. Since there is no such quality control, anybody has an opportunity to write whatever they like on the web, lowering the quality of reviews. The largest problem is the chaos of deceptive public opinion. These days, users usually come to the web to check products they have an intention to buy. Spam distorts product quality evaluation. We distinguish three types of opinion spam: the first is a misguided opinion, the second an opinion that does not relate directly to the subject and the last is distortion, as in text not relevant to opinion analysis [7];
- emotion detection seeks to identify if a text conveys any type of emotion or not. It is similar to subjectivity detection. Within the scope of emotion detection we discriminate emotion classification—fine-grained classification of existing emotion in a text into one (or more) of a set of specific emotions (e.g., anger, fear, etc.), emotion intensity—degree or amount of an emotion (such as anger—very angry or sadness—slightly sad, etc.) [8] and finally emotion cause detection—extracting potential causes that lead to emotion expressions in text [9].
2.2. Emotion Analysis
Emotion analysis can be viewed as a natural evolution of sentiment analysis and its more fine-grained model. Digging deeper into psychology, we have to differentiate between terms emotion, mood, feeling. Emotion is an instantaneous perception of a feeling. They can be over in a matter of seconds to minutes, at most [10]. Mood is considered as a group of persisting feelings associated with evaluative and cognitive states which influence all the future evaluations, feelings and actions [11]. Unlike emotions, moods are non-intentional, though they may be elicited by a particular event or things. It is challenging to identify triggers causing mood; however, while in the state of a certain mood, the threshold is lowered for arousing related emotion. Feeling is mental associations and reactions to an emotion that are personal and acquired through experience.
How can we determine emotions? To be able to identify emotions in text, firstly, we need emotion models to estimate them.
Emotion’s Models
According to Grandjean et al. [12], three major directions in affect computing are recognized: categorical/discrete, dimensional and appraisals-based approaches.
- Basic emotion model—The categorical approach claims there are a small number of basic emotions that are hard-wired in our brain, and recognized across the world. Each affective state is classified into a single category, Table 1. However, a couple of researchers proved that people show non-basic, subtle and rather complex affective states that could be impossible to handle, such as thinking, embarrassment or depression. Assigning text to a specific category can be done either manually or using learning-based techniques.
 Table 1. Listing emotion models and their appertaining emotions.
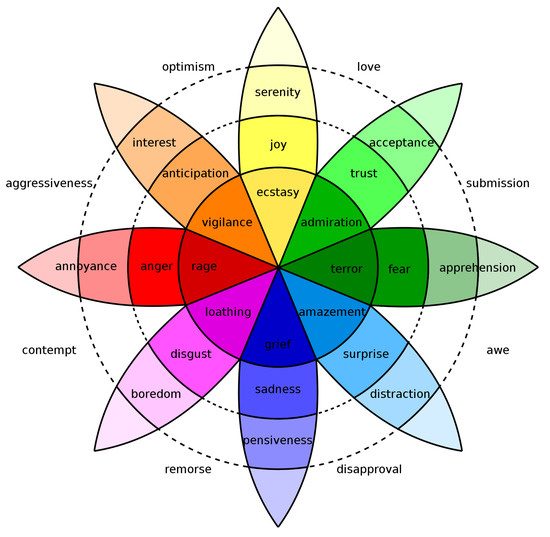 Figure 1. Plutchik’s wheel of emotion.
 - Dimensional feeling model—The dimensional approach is based on Wundt’s proposal that feelings (which he distinguishes from emotions) can be described as pleasantness–unpleasantness, excitement–inhibition and tension–relaxation, as well as Osgood’s work on the dimensions of affective meaning (arousal, valence and potency). Most recent models concentrate on only two dimensions, valence and arousal. Valence (pleasure/displeasure) depicts how positive or negative an emotion may be. Arousal (activation/deactivation) depicts how excited or apathetic an emotion is.
- Componential appraisal models—This proposes that emotions are extracted from our “appraisals” (i.e., our evaluations, interpretations and explanations) of events. These appraisals lead to different specific reactions in different people. OCC model is presumably the most widely accepted cognitive appraisal model for emotions [13] and it proposes three aspects of the environment to which humans react emotionally: events of concern to oneself, agents that one considers responsible for such events and objects of concern. It defines emotions as a valenced reaction to events, agents and objects, and considers valenced reactions as a means to differentiate between emotions and non-emotions. This approach is very suitable for affect sensing from the text.
Despite the existence of various other models, the categorical and dimensional approaches are the most commonly used models for automatic analysis and prediction of affect in continuous input.
It is worth mentioning the survey made by Ekman [17]. The authors surveyed 248 scientists working in the field of emotion. Authors looked for the answer if/how the nature of emotion has changed over time. Which proposal—either Darwin’s Darwin [18] (emotions are discrete) or Wundt’s Wundt [19] (emotions differentiate into dimensions of pleasant–unpleasant and low–high intensity)—is most used nowadays? Findings from this survey indicate that scientists agreed upon five emotions (all of which were described by both Darwin and Wundt): anger (91%), fear (90%), disgust (86%), sadness (80%) and happiness (76%). Shame, surprise and embarrassment were endorsed by 40–50%. Least agreed basic emotions are guilt (37%), contempt (34%), love (32%), awe (31%), pain (28%), envy (28%), compassion (20%), pride (9%) and gratitude (6%).
Recent advances in the field of sentiment analysis and computational linguistics in general, allow us to accomplish more advanced tasks such as emotion detection in documents. To detect emotion, researchers use generally known algorithms created for sentiment analysis. There are three major approaches to detecting emotions in text:
- Keyword-based methods—the most intuitive approach. The main goal was to find out patterns similar to emotion keywords and match them. The first task is to find out the word which expresses the emotion in a sentence. This is usually done by tagging the words of a sentence with Parts-Of-Speech tagger and then extracting the Noun, Verb, Adjective and Adverb (NAVA) words—the most probable emotion carrying words. Then these words are matched against a list of words representing emotions according to a specific emotion model. Whichever emotion matches with the keyword is considered as the emotion of the specific sentence. Different approaches can be applied when the word matches with multiple emotions from the list. In some keyword-dictionaries, each word has a probability score for each emotion, and the emotion with the highest score is picked as the emotion of the word. In some other works, the first emotion matched with the word is picked as the primary emotion of the word. The reference list of keywords or the keyword dictionary differs depending on the researcher.
- Machine Learning methods—both supervised and unsupervised methods are used for emotion classification. For supervised methods, an annotated emotions dataset is used from which one learns which features are most salient to distinguish between classes. The dataset is divided into training and testing sets. Naive Bayes classifier, Support Vector Machine, MaxEntropy and Decision Tree are the most used algorithms.
- Hybrid methods—combined methods defined to achieve the benefit of multiple methods and reach the maximum level of accuracy.
2.3. Human–Robot Interaction
Human–robot interaction (HRI) is a study of interaction dynamics between humans and robots, a multidisciplinary field that includes engineering (electrical, mechanical, industrial and design), computer science (human–computer interaction, artificial intelligence, robotics, natural language understanding, computer vision and speech recognition), social sciences (psychology, cognitive science, communications, anthropology and human factors) and humanities (ethics and philosophy) [20].
Robots are poised to fill a growing number of roles in today’s society, from factory automation to service applications, medical care and entertainment. While robots were initially used for repetitive tasks where all human direction is given a priori, they are becoming involved in increasingly more complex and less structured tasks and activities, including interaction with the humans required to complete those tasks. The fundamental goal of HRI is to develop the principles and algorithms for robot systems that enable safe and effective interaction with humans [20].
The appearance and function of a robot affect the way that people perceive it, interact with it and build long-term relationships with it [21]. As every person is different, the success of robot acceptance lies in its capability to act as a social entity and its adaptability to differentiate behavior within appropriate response times and tasks.
Interaction, by definition, means “communication with each other or reacting to each another” (https://dictionary.cambridge.org/dictionary/english/interaction). There are several possibilities for robots to communicate with humans. The way of communication is largely influenced by whether the human and robot are in close proximity to each other or not. Therefore, the interaction can be categorized into remote and proximate interaction. Within these two general categories, we can differentiate applications that require mobility, physical manipulation and social interaction [22].
2.3.1. Socially Assistive Robotics
Social interaction includes social, emotive and cognitive aspects of interaction. It involves research areas of assistive robotics, social robotics and socially assistive robotics. Social Assistive Robotics (SAR) is defined as the intersection of assistive robotics and socially interactive robotics. It is a comparatively new field of robotics that focuses on developing robots capable of assisting users through social rather than physical interaction. Social robots have to be able to perceive, interpret and respond appropriately to verbal and nonverbal cues from the human. SAR compared with social robots, focuses on the challenges of providing motivation, education, therapy, coaching, training and rehabilitation through nonphysical interaction. An effective socially assistive robot must understand and interact with its environment, exhibit social behavior, focus its attention and communication on the user, sustain engagement with the user and achieve specific assistive goals. The robot must do all of this in a way that is safe, ethical and effective for the potentially vulnerable user. SAR has been shown to have promise as a therapeutic tool for children, the elderly, stroke patients and other special-needs populations requiring personalized care.
2.3.2. Long-Term Interaction
Many applications with social robots involve only short-term interactions. However, short-term interaction is not enough. Many real-world applications (e.g., education, therapy, companionship and elderly care) call for keeping people interested for longer. We have to maintain human engagement and build relationship and trust between human and robot through adaptation and personalization. An important aspect of long-term interaction is memory. As the robot memorizes information, he can better execute personalized behavior. Zheng [23] proposed four types of memory information (factual information: personal facts like names; an intention: knowledge of user’s plans and future actions; interaction history: representation of past events; and meta-behavior: metadata of user’s behaviors during interactions). Their preliminary results show that meta behavior elicits stronger positive feelings in comparison to the other three memory information. Richards and Bransky [24] performed an experiment about forgetting and recalling information (4 levels: complete recall; total loss of recall; partial recall; and incorrect recall). By exhibit forgetting, either explicitly stating forgetfulness or not mentioning it at all, the believability of the character was raised. The study also suggests that forgetting affects the level of trust the user feels.
Talking about long-term interaction, we have to take into account novelty effect. Novelty effect, in the context of HRI, can be explained in such a way that interaction with the robot can be initially highly triggering and engaging but after a couple of interactions, the newness wears off, and people can lose interest in interaction with the robot. To avoid such behavior, the challenge is to keep people engaged in the interaction and motivate them to interact longer (weeks, months or even years). This is not as simple as it may sound.
2.3.3. Personalization
Personalization is closely associated with long-term interaction mentioned above. It is another important research area in SAR. Personalization is an ability of the robot to adapt its behavior to a specific human, context, environment and task. There are numerous studies researching impact of personalization to HRI [25,26,27,28,29].
However, there are studies that contraindicate this claim. Kennedy et al. [30] implemented robot tutoring system. Their idea was to determine how social and adaptive behavior of the robot is desirable to support children in their learning. Task objective was to determine the prime numbers. Participants consisted of 45 children aged 7–8. Four scenarios were introduced—without a robot with a screen only, asocial robot and social personalized robot. Results show that learning with the robot in comparison to without robot (only screen) boosts learning gain, however, learning with the social personalized robot in comparison with a screen only robot does not improve further learning. Gao et al. [31] built a reinforcement learning framework for personalization that allows a robot to select supportive verbal behavior to maximize the user’s task progress and positive reactions. Their conclusion was that people preferred robots that exhibited more varied behaviors in comparison to the robot whose behavior converged to the specific (personalized) one over time.
Nevertheless, we implemented personalized robot behavior in our user-case scenario described in Section 6.
2.3.4. Artificial Companionship
So far, robot companions lack many important social and emotional abilities (e.g., recognizing social, affective expressions and states, understanding intentions and accounting for the context of the situation, expressing appropriate social, affective behavior) to engage with humans in natural interaction.
An artificial companion should be capable of evaluating how humans feel about the interaction and how they interpret the agent’s actions and use this information to adapt its behavior accordingly [32]. For instance, a robotic companion (Figure 2) should act empathically towards a user if it detects that she is sad or not willing to engage in an interaction, e.g., it would not disturb them trying to engage them in some activity if they do not approach it.
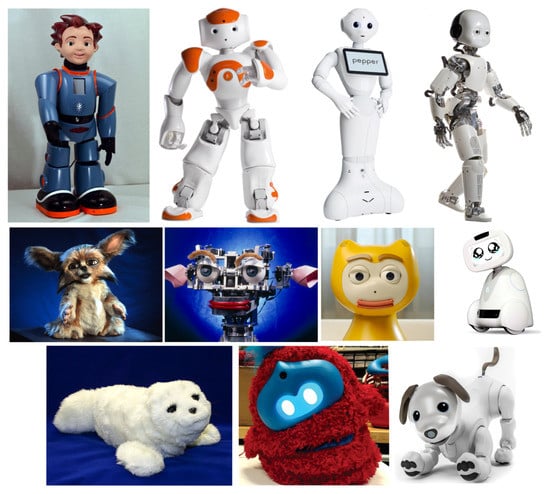
Figure 2.
Robot companions. Humanoids in top row—from left to right (1) Zeno (Hanson Robotics), (2) NAO (Aldebaran Robotics), (3) Pepper (Aldebaran Robotics), (4) iCub (Italian Institute of Technology); Middle row—from left to right (1) Leonardo (MIT), (2) Kismet (MIT), (3) iCat (Philips), (4) Buddy (Blue Frog Robotics); Bottom row—from left to right (1) Paro (AIST), (2) TEGA (MIT), (3) New AIBO (Sony).
2.3.5. Affective Loop
Another challenging research task in SAR is endowing the robot with emotional intelligence. It is important that the interaction between human and robot would be affective; thus, it must have the ability to perceive, interpret, express and regulate emotions.
Understanding human emotions by robot and at the same time having the option to express emotion back to human was defined by Höök [33] as affective loop (AL). AL (see Figure 3) is the interactive process in which “the user [of the system] first expresses her emotions through some physical interaction involving her body, for example, through gestures or manipulations; and the system then responds by generating affective expression, using, for example, colours, animations, and haptics” which “in turn affects the user (mind and body) making the user response and step-by-step feel more and more involved with the system” [34].
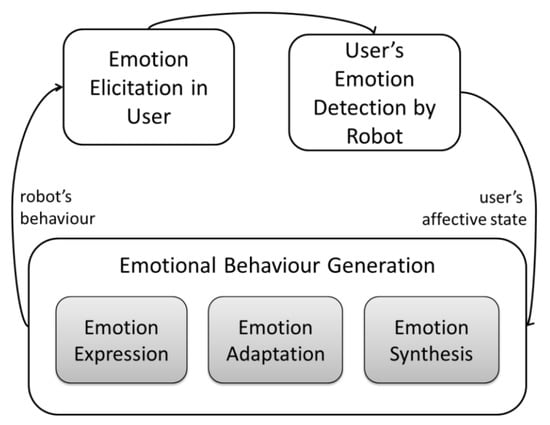
Figure 3.
Affective loop adopted from Paiva et al. [34].
Emotion detection is part of the broader area of affective computing (AC) with aims to enable computers to recognize and express emotions [35]. AC defines emotion as playing an essential role in decision making and learning. Emotions influence the mechanisms of rational thinking. Picard [35] highlighted several results from neurological literature that indicate emotions play a necessary role in human creativity and intelligence, as well as rational human thinking and decision-making.
Computers that interact naturally and intelligently with humans need at least the ability to recognize and express affection. Affect plays a crucial role in understanding such phenomena as attention, memory and aesthetics. Emotion is necessary for creative behavior in humans. Neurological studies indicate that decision-making without emotion can be as impaired as that made with too much emotion. Picard [35] argues affective computers should not only provide better performance in assisting humans but also might enhance computers’ abilities to make decisions.
Therefore, one of the main goals of AC is enabling computers to understand human emotional state and adjust its response accordingly. Human emotional state can be expressed either non-verbally, verbally or both. Pioneer researcher in body language [36] found that within the realm of interpreting the affect or emotional state of others, we perceive 55% non-verbally (facial expression), 45% verbally out of which 38% by speech (tone of voice, inflection and other sounds) and 7% by words.
Automatic affect recognition is a challenging task due to the various modalities emotions can be expressed with.
- Facial expression—the face is the most important component of human communication [37,38,39,40].
- Body language—bodily expressions (whole body static postures and whole body movement) and gestures provide strong and reliable cues to the emotional state of an observed individuals [41,42,43,44].
- Speech—pitch (level, range and variability), timing and loudness are considered the most influential parameters for expressing emotions through speech [45,46].
On the other hand, how and when, machines should exhibit emotions is also an important research question. Herewith with this is closely linked synthetic emotion. Synthetic emotion is an emotion produced by a robot. Integration of different modalities, when they are congruent and synchronous, leads to a significant increase in human emotion recognition accuracy [47]. However, when information is incongruent across different sensory modalities, integration may lead to a biased percept, and emotion recognition accuracy is impaired [47].
3. Related Work
There are numerous studies focusing on detecting emotion from text. Desmet and Hoste [48] used Support Vector Machines to differentiate between the 15 different emotions (abuse, anger, blame, fear, forgiveness, guilt, happiness, hopefulness, hopelessness, information, instructions, love, pride, sorrow, thankfulness), using lexical and semantic features (viz. Bags-of-Words of lemmas, Part-of-Speech tags and trigrams) and information from external resources that encode semantic relatedness and subjectivity. In Wicentowski and Sydes [49], they detected the same 15 emotions using maximum entropy classification. In Luyckx et al. [50], the authors presented experiments in fine-grained emotion detection using Support Vector Machine (SVM) into 15 categories. In Pak et al. [51], authors combined machine learning algorithm (SVM with features: n-grams, POS-tags, General Inquirer dictionary, Affective Norms of English Words lexicon, dependency graphs and lastly, heuristic features) with hand-written rules. Bandhakavi et al. [52] proposed a generative Unigram Mixture Model (UMM) to learn a word-emotion association lexicon from an input document. Alm et al. [53] uses Ekman’s six basic emotions (fear, joy, sadness, disgust, anger, surprise +/−). Data were classified by linear classifier—a variation of the Winnow update rule—implemented in the Sparse Network of Winnows (SNoW) learning architecture [54] into two categories either emotional/non emotional or positive emotion/negative emotion.
Much attention these days centers on “reinventing” deep learning to solve varied tasks. Emotion detection is no exception, hence we see a burst of research papers in this area. Kratzwald et al. [55] authors proposed bi-directional LSTM networks (BiLSTMs). They proposed an extension of transfer learning called sent2affect—the network is first trained on the basis of sentiment analysis and, after exchanging the output layer, is then tuned to the task of emotion recognition. Khanpour and Caragea [56] detected six Ekman’s emotion from Online Health Community messages. They proposed a computational model that combines the strengths of CNNs, LSTMs and lexicon-based approaches to capture the hidden semantics in messages. Kim and Klinger [57] used Plutchik’s eight emotions and ‘no emotion’ as emotion categories. They applied several models: rule-based (as a feature dictionary), multi-layer perceptron (as a feature Bag-of-Words), conditional random fields (POS-tags, National Research Council (NRC) dictionary, English pronounce list), BiLSTM-CRF (as a feature FastText embeddings with dimension 300). Furthermore, it is worth mentioning that besides emotion, also experiences, causes and targets of the emotions were annotated. Gupta et al. [58], Chatterjee et al. [59] proposed deep learning approach called “Sentiment and Semantic LSTM (SS-LSTM)”. Detection of emotions was viewed as a multi-classification problem into four classes—happy, sad, angry and others.
Table 2 shows emotion datasets widely used in the research community in emotion analysis. As our aim was to use text data in human–robot interaction (in comparison with works mentioned above), we could not use any of the presented corpuses. The text should be neither long nor very short and intriguing to keep the participants focused. Therefore, we chose fables as they are interesting short stories and compiled our own corpus which will be described in Section 4.1.
Table 2.
Overview of datasets used in emotion detection.
We see our problem as a multi-label classification task. Therefore, we decided to use Plutchik’s eight emotions as emotional model together with ‘no emotion’ category. We applied lexicon-based approach (as we are using NRC emotional dictionary for features extraction) with supervised machine learning methods such as Naive Bayes and SVM. Whereas our dataset is small, we also decided to apply semi-supervised k-Means algorithm for expanding our training data.
4. Methodology
We propose a learning algorithm based on lexicon methods and machine learning methods. The workflow of our approach is shown on Figure 4. Specifics of each box are explained in the following sections.
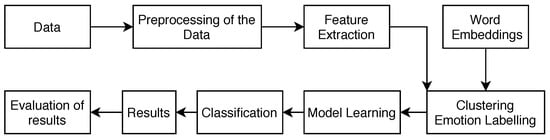
Figure 4.
Emotion detection flow chart.
4.1. Block: Data
We build our own English corpus consisting of Aesop’s fable. Fables were downloaded (http://www.aesopfables.com, http://read.gov/aesop/), cleaned and saved into .txt documents. Each document contained one fable. In total, we have 740 English fables.
We wanted stories to be read in the human–robot experiment scenario. To keep the audience interested and to stay focused, the text should be neither long nor very short and interesting. Therefore we chose fables as they are short stories with moral truth, using animals as the main characters.
Corpus of English fables consisted of 393 annotated sentences and 2999 unannotated sentences. Further, we will discuss only annotated sentences. Sentences were annotated into eight categories (Plutchik’s eight emotions: joy, trust, sadness, fear, disgust, anger, anticipation, surprise). The number of emotions chosen for each sentence was arbitrary. In Figure 5, the count of each emotion across the dataset is depicted. Figure 6 displays the number of sentences with the number of emotions they contain. As we can see, sentences were mostly rated by one emotion, followed by neutral sentences. Having more than one emotion for a sentence means that we are dealing with a multi-label classification problem. There is no evidence of a positive/negative relationship between emotion’s classes (Figure 7).
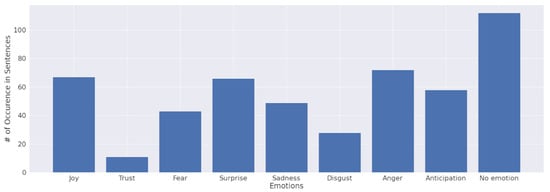
Figure 5.
Number of emotions in annotated dataset.
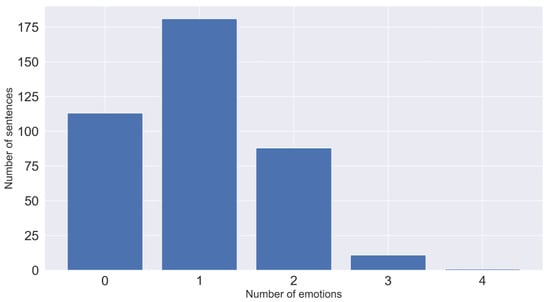
Figure 6.
Number of sentences with multiple emotions.
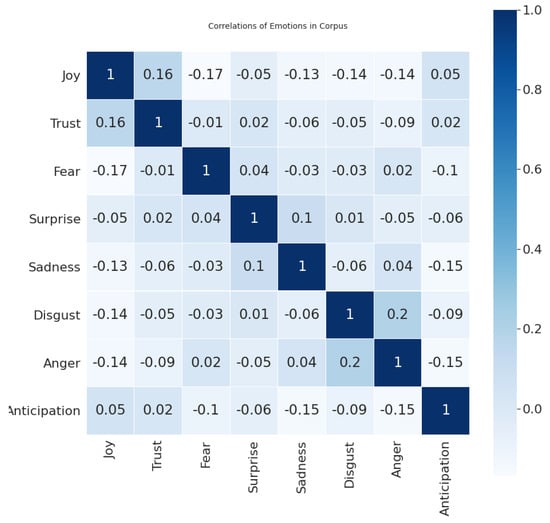
Figure 7.
Correlation of emotion’s classes in the dataset.
4.2. Block: Processing of The Data
The process of data preparation is shown in Figure 8. The first row in the picture represents the process with a sentence. Second-row displays wherein the process features are extracted (e.g., punctuation is gathered from raw sentences; matching emotional words from a dictionary and Part-of-Speech (POS) tagging is done after tokenization and removing high occurrence words). Fables were formatted as follows: one sentence = one row in a document. Firstly we unified every character to lower case; applied function for dividing shortened forms of words into two words (grammatical contractions— ); and cleaned the text from interpunctuation (a sign of question mark, colon and an exclamation mark were used as features). Every sentence was tokenized into words. Afterwards, the POS tagger was applied. Next, we applied the National Research Council (NRC) dictionary to find out if any given word is a word from the vocabulary. In case the word was contained in the vocabulary, we assigned emotion to the word. Finally, we performed stopwords removal and lemmatization of the words (keeping words in their root form).
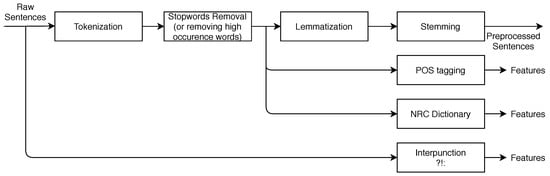
Figure 8.
Process of cleaning and preparing data for vectorization.
4.3. Block: Feature Extraction and Word Embeddings
We used vector space representation of the text and very sentence was represented by a vector of features. Each sample in the dataset was described as follows:
- POS tagging (4 features): we used pos_tag function from nltk library. Every POS tag was represented as a number of occurrences in a given sentence. We chose 14 POS labels grouped into four categories:
- –
- noun: NN noun, singular, NNS noun, plural;
- –
- adjective: JJ adjective, JJR adjective, comparative, JJS adjective, superlative;
- –
- verb: VB verb, base form, VBD verb, past tense, VBG verb, gerund/present participle, VBN verb, past participle, VBP verb, sing. present, non-3d, VBZ verb, 3rd person sing. present;
- –
- adverb: RB adverb, RBR adverb, comparative, RBS adverb, superlative.
- emotion (8 features): we used the NRC dictionary to obtain counts of emotions occurring in each sentence—anger, fear, sadness, disgust, surprise, anticipation, trust and joy;
- punctuation (3 features): we extracted presence of colons “:”, exclamation marks “!” and question marks “?”;
- numerical feature vector: we extracted all words from pre-processed sentences (Figure 8) to create vocabulary:
- –
- Bag-of-Words (BoW) representation (number of features was dependent on thresholding occurrence of tokens in input): each sentence was represented as a number of occurrence of given words in the vocabulary. Vocabulary was generated from all tokens in sentences.
- –
- Term Frequency-Inverse Document Frequency (TF-IDF) (number of features was dependent on thresholding occurrence of tokens in input): similar to BoW, but instead of the number of occurrences, each token was represented as a proportion between the number of occurrence in given sentence and occurrence in the whole corpus.
- –
- sentence embeddings (300 features): every word (token) in a sentence is represented by its vector obtained from pretrained ConceptNet Numberbatch model. We used word embeddings to create sentence embeddings. Sentence embeddings are basically averaged sum of word embeddings vectors appertaining to the sentence.
4.4. Block: Clustering
Annotation of sentences is exhausting and time-consuming; therefore, we decided to utilize k-Means algorithm to annotate additional data. We have selected the k-Means, as it represent the reliable and fast clustering algorithm, frequently adopted in many real-world applications. In addition to the performance, another aspect was fast processing of new, unknown samples by the trained model, which was important factor during the run-time.
k-Means clustering algorithm is well-known algorithm that approximates the maximum-likelihood solution for determining the locations of the means of a mixture density of component densities.
where:
- S—number of sentences in dataset,
- W—vector representation of sentences,
- K—number of emotion categories,
- —clusters of sentences,
- —center of clusters.
The outcomes of the algorithm are clustered data annotated according to the centroid where they belong.
Our usage of k-Means can be described as follows: we randomly chose five representatives of each class (e.g., in-class joy—5 representatives for “0” category and five representatives for “1” category) and calculated centroid. Centroids were calculated as an average of the sum of vectors (from the vector representation of the data). We ended up with 18 centroids. Before every pair of centroid was fed into the k-Means algorithm, we calculated the distance of every sentence from given centroids and removed the furthest and closest one. After that, labels for every class were predicted. Acquired data gave us the option to expand the training dataset if needed.
4.5. Block: Model Learning
While working with multi-label classification problem we give a brief overview of three methods. In general, we focused on selection of the stable methods which are able to provide reliable results while also perform well from the run-time aspects. We can approach to multi-label classification problem in these ways:
- Problem transformation—transformation of the multi-label classification problem so that a binary classification algorithm can be applied. In this case, we applied one-vs.-rest approach, where each class was considered as a separate classification problem, so binary classifiers were trained to recognize each particular class.
- Multi-label algorithm—use of the algorithm which are directly adapted to the multi-label task without demanding transformation (Multi-Label k-NN, Decision Trees, etc.). In such a case, there was a possibility to directly use the model, which is suitable to perform the multi-label classification.
- Ensemble approach—model which combine the classification result from multiple models.
The following sections will describe the methods used and evaluated in our methodology.
4.5.1. Support Vector Machine Model
SVM is a classification model based on the idea of support vectors. The models separate the sample space into two or more classes with the widest margin possible. SVM is originally a linear classifier; however, it can relatively efficiently perform non-linear classification by using a kernel function [65]. Kernel is a method which maps features into higher dimensional space specified by the used kernel function. For the model building, we need training samples labeled −1 or 1 for each class. SVM then attempts to divide the classes with a parameterized (non)linear boundary in such a way to maximize the margin between given classes. A parameterized linear equation is defined as in formula (6). Values of for each class are represented in the following way. If given a sample of class 1, values should be greater or equal to one, if given sample of class −1, values should be equal or smaller than −1, respectively:
Both of these conditions are ensuring that samples are on the correct side of the ‘street’. Continuing to complete the solution, creating the widest margin between samples, it was observed that only two nearest points to the separating street determines its width. It can be expressed as a difference vector of these points multiplied by the vector of the street W and its magnitude .
The objective is to maximize the width of the street, which is known as the primal problem of SVM. In our case, we used Radial Basis Function (RBF) as kernel.
4.5.2. Multi-Class Naive Bayes Model
Naive Bayes classifier is a probabilistic classifier based on Bayes’ theorem and independence assumption between the features. Let us assume that event A and event B are independent and their conditional probability is defined according Bayes’ theorem:
In practice, can be an estimated constant calculated from the dataset. Replacing with a constant , the previous formula is then expressed as:
Let us assume that A represents class and B represents a feature relating to the class A. This equation then handles only one feature. Let us extend the rule with more features. Then the conditional probability of class A on features B, C is the following:
That assumes that features B and C are independent of each other. Then, simplifying the above expression is possible using the replacement of with . For n observations—features —the conditional probability for any class can be expressed as below:
This classification model is called Naive Bayes classifier. Naive Bayes is often applied as a baseline for text classification [66]. In this work, we used multi-class Naive Bayes classifier.
4.5.3. Feed-Forward Neural Network Model
Another popular models used in the text classification tasks are neural networks [67,68]. In our experiments, we used a feed-forward neural network model. It proved to be the most suitable neural network model for a given task, as the more advanced neural models (CNN, LSTM) require significantly more data to train them properly. Neural networks are flexible models composed of computational units—neurons, arranged in interconnected layers. Connections between neurons correspond to numerical parameters of the model—weights. The primary predictive model is feed-forward neural network [69], which consists of the following layers:
- input layer—input neurons correspond directly to the input attributes , ,…, ;
- one (or more) hidden layer—transform the input data in non-linear fashion;
- output layer—output neurons determine the prediction of the model; depending on the architecture, the network can provide multiple outputs , ,…, .
The calculation for all neurons on the hidden and output layers is identical—the output value of each neuron (activation) is calculated as a weighted sum of inputs of the neurons transformed using the activation function. On the hidden layers, we used ReLU activation function [70]. The output of the ReLU function can be represented as:
On the output layer, we used the sigmoid activation function [71], which transforms the output into a probability estimations:
We used Adaptive Moment Estimation (Adam) [72] as an optimization method during the training. RMSProp [73] and Momentum [74] methods are based on different approaches. Momentum accelerates the training in the direction of the minimum, while RMSProp reduces the oscillations by adaptive change of the learning rate. Adam algorithm combines both Momentum and RMSProp heuristics.
The loss function expresses the magnitude of the loss that the model will make in the prediction. By minimizing the loss function, we can obtain the weights for all network layers. In our work, we used Binary Cross-Entropy (BCE):
where y is the actual value and is the predicted value.
Based on the prediction and weights, we obtain an output loss which propagates back to the previous layers using the backpropagation algorithm [75]. The weights are then modified to minimize the output error.
In the experiments, we used a feed-forward neural network. The architecture of the network comprised of the input layer, four hidden fully connected layers with 32, 64, 128 and 256 neurons and the ReLU activation function. The output layer contained nine neurons, each representing a particular class and a sigmoid activating function. The model included 55,881 trainable parameters.
4.6. Block: Classification
Our approach to the classification lies in transforming our problem into 9 separate problems (8 emotion classes and one class without emotion). Based on the fact that emotions are not dependent on each other (Figure 7), we trained the classifiers for each emotion separately. When a new sample comes into the classification, all of the classifiers estimate the probability for each class. Each classifier has only one vote. The threshold is set to probability of 50% for accepting the label.
4.7. Block: Evaluation of Results
To evaluate results, we used statistical metrics usually used in text classification: precision, recall, F1 score, Matthews Correlation Coefficient and subset accuracy. The dataset was split into training and testing sets in a 70/30 ratio. We used stratified sampling for the multi-label classification implemented in scikit-multilearn (http://http://scikit.ml/stratification.html) library.
Firstly, we define the confusion matrix. The confusion matrix summarizes the classification performance of a classifier with respect to test data. It is a two-dimensional matrix, where one dimension represents the true class of a document and the second dimension represents class label predicted by the classifier. Table 3 presents an example of confusion matrix.
Table 3.
Confusion matrix for two classes.
- Precision—defined as the fraction of the number of texts correctly labeled as belonging to the positive class among the total number of retrieved texts annotated as belonging to the positive class.
- Recall—defined as the fraction of the number of texts correctly annotated as belonging to the positive class among the number of the retrieved text belonging to the positive class
- F1 score—the weighted average of precision and recall. This score takes both false positives and false negatives into an account.
- Matthews Correlation Coefficient (MCC)—in comparison with F1 score, it is a more reliable statistical rate which produces a high score only if the prediction obtained good results in all of the four confusion matrix categories (true positives, false negatives, true negatives and false positives), proportionally both to the size of positive elements and the size of negative elements in the dataset [76]. It returns a value between and . A coefficient of represents a perfect prediction, 0 no better than random prediction and indicates total disagreement between prediction and actual class.
- Subset Accuracy—the percentage of samples that are classified correctly within the particular class.
- Exact Accuracy—the percentage of samples that are classified correctly across all labels (it ignores samples that are partially correct).
5. Experiments with Text Data
5.1. Baseline
Our baseline model consisted of NRC dictionary and 393 annotated sentences. We matched every word against the dictionary and assigned the number of appertaining occurrences to each emotion. Later we transformed the number of occurrences to binary representation (“0” if an emotion is not present, “1” if emotion has more than one occurrence). Table 4 shows that out of eight emotion, Joy is classified most accurately and Disgust with Trust the worst. The reason for it lies in our data. Looking back at Figure 5, we can see that trust and disgust are the least represented classes.
Table 4.
Accuracy of emotion dictionary, lexicon approach.
5.2. Building of the Naive Bayes Model Using Bag-of-Words
We firstly begin by testing our data against the Bag-of-Words representation (Table 5). As we can see, the precision is rather low. Above-average results are obtained only in case of No emotion class. Trust and Disgust got 0, however looking at the subset accuracy we see that they achieve scores 97% and 91%, respectively. That means, even though we did not classify a positive case, we got a good estimate on the overall class. We experimented with several model’s setups such as:
Table 5.
Accuracy of Bag-of-Words representation, Multi-nomial Naive Bayes classifier.
- changing threshold for minimal/maximal count of the word to be excluded from vocabulary when creating BoW representation;
- uni-grams, bi-grams;
- stopwords removing/not removing;
- changing the number of additional features for sentence representation (NRC, POS, punctuation);
- changing classifiers Multi-nomial Naive Bayes, Bernoulli Naive Bayes, Gaussian Naive Bayes, SVM;
- expanding training set for data annotated by k-Means.
Fine-tuning with different pre-processing settings such as stopwords removing/not removing, uni-grams/bi-grams and the threshold for minimal/maximal count of a word to be excluded from vocabulary we improved Joy and Anticipation precision (Table 6).
Table 6.
Accuracy of fine-tuned settings in Bag-of-Words representation, Multi-nominal Naive Bayes classifier.
Then, we extended the features with emotions from NRC dictionary, POS tags, punctuation and continued tuning our model. We saw improvement on No emotion and Anger classes (Table 7).
Table 7.
Accuracy of fine-tuned setting in Bag-of-Words representation and added features, Multi-nomial Naive Bayes classifier.
We tried also every feature individually. We noticed increase in accuracy of Fear to 25%, Surprise to 50%, Sadness to 50% and Disgust to 25%. To increase the accuracy, we needed to use different setup for every class.
Adding k-Means annotated data to the training set we observe Disgust accuracy to rise to 67%. All other accuracy metrics remained at the same level.
5.3. Building of the Naive Bayes Model Using TF-IDF
Foundation of experiment 2 was the TF-IDF representation of sentences. Results from our experiment can be seen in Table 8. The highest score was obtained in the Joy class. The lowest were in Trust and Disgust classes.
Table 8.
Accuracy of Term Frequency-Inverse Document Frequency (TF-IDF) representation, Multi-nomial Naive Bayes classifier.
After fine-tuning the parameters of our model, we trained the model and compared the results. Table 9 summarizes the results of the Multi-nomial Naive Bayes classifier with TF-IDF after fine-tuning, Table 10 summarizes the fine-tuning of the model trained using the extended set of features.
Table 9.
Accuracy of fine-tuned settings in TF-IDF representation, Multi-nomial Naive Bayes classifier.
Table 10.
Accuracy of fine-tuned setting in TF-IDF representation and added features, Multi-nomial Naive Bayes.
Adding more semi-automatically labeled data further raised the accuracy of the Sadness class to 67%.
5.4. ConceptNet Numberbatch Converted to Sentence Embeddings
The base of this experiment was to use the sentence embeddings. On top of that, we added NRC emotional dictionary, punctuation and POS tags. Lastly, we used word embeddings—ConceptNet Numberbatch and converted them to the sentence embeddings. We can see from Table 11, that accuracy in classes is low but it covers all classes except one—Trust.
Table 11.
ConceptNet Numberbatch—sentence embeddings.
Adding features to the model did not help to raise its accuracy significantly. Adding data labeled by k-Means helped to improve accuracy in the class No emotion to 68% by using SVM classifier. The average accuracy for the rest of the classes was 20%.
5.5. Neural Network Classifier
In this experiment, we trained feed-forward neural network classifier to compare the performance of the neural network approach with standard machine learning methods used in the previous experiments. The architecture of the network is described in Section 4.5.3. The performance of the model is summarized in Table 12. As we can see from the results, neural network classifier gained slightly better performance (when considering averaged metrics) to standard machine learning models. However, the lack of the training data caused that the more advanced deep learning approaches (such as CNN or LSTM models) or more advanced popular language models (e.g., BERT) could not be properly trained to solve this task.
Table 12.
Feed-forward neural network.
5.6. Ensemble Classifier
We combined the best-obtained models for each class and integrated them into the ensemble classifier, as shown in Table 13. We can see an increase in exact accuracy, which is the most strict metric and expresses how many completely correct rows (all labels are correct) we obtained from the classifier. We did not include the neural network model in the ensemble. The ensemble members were selected as a binary classifiers for each of the particular class, which in case of the neural network would require its re-training in one-vs-rest approach. Therefore, neural network was primarily used to compare the performance of the ensemble model.
Table 13.
Ensemble of binary classifiers. NB: Multi-nominal Naive Bayes, SVM: Support Vector Machine, NRC: emotion dictionary, POS: Part-of-Speech tags, PUNC: punctuation, SW: stop words.
During the experiments, besides the initial base classifiers, we compared the ensemble model performance with some other machine learning algorithms. For the comparison purposes, we used the feed-forward neural network model described in Section 4.5.3. and also with the frequently used models from the popular Python machine learning library scikit-learn. In comparison, we included baseline classifiers (Logistic Regression, SVM, Decision Trees, k-NN) and also other ensemble models (e.g., Adaboost). As the proposed ensemble model combines different ensemble members, trained on different feature subsets, or expanded set of attributes, we compared the ensemble with other machine learning models trained on both, TF-IDF representation and on TF-IDF extended with expanded attributes. Following Table 14 summarizes the performance of the ensemble and other ML models. The results represent the averaged values of the 10-fold cross-validated models on the testing set. Inclusion of the extended set of features to TF-IDF representation brings a slight improvement to some of the models. In general, the performance of the base models is rather poor, in comparison to the ensemble model.
Table 14.
Comparison of the ensemble model with other machine learning (ML) models.
6. Experiments with Humanoid Robot NAO
We propose scenarios with humanoid robot NAO and humans (either kids, or adults). The controlled group was the same for each experiment. The group consisted of 8 participants (7 adults and 1 child). The age of the participants ranged from 3 to 50 years. In these experiments, we focused on the creation of the small, yet diverse group of subjects, represented by participants within different age groups. The participant was interacting with a robot alone; thus, it was one-on-one interaction. They were not accustomed with humanoid robot, thus it was their first interaction. All except one were educated people. The experimenter was behind the wall. During the experiments, we paid attention to two variables: length of the interaction, number of fables red.
Throughout the experiments, we used NAO robot v.5. NAO is a humanoid robot often utilized in HRI experiments. He can move with hands, walk, talk, listen. Taking into account its’ very limited facial expression, he can make use of his eye’s led lights to signal to blink, even changing color can suggest different emotional states (e.g., red led = anger). A pre-trained classifier was running on a server (standard desktop PC configuration) connected to the NAO robot. During the run-time, the classifier processed the sentences/fables. A computer was used to invoke the scripts for speech and moves to NAO.
6.1. Experiment 1A—Basic Setup
Setup of the first experiments is straightforward (Figure 9). NAO is presented as a “Narrator”. He greets the participant of the experiment and asked him to sit down, facing him. Subsequently, he offers to tell a story. He starts narrating as soon as he hears “yes”. Input to NAO is the fable without any emotional markup; thus, NAO is reading the fable without any expression (either movement or vocal). The recipient is facing NAO and listening to the story. After telling the whole story, NAO gives the option either to continue with another story or to finish. The number of stories is fully dependent on the participant. At the end of the experiment, we give every participant the questions shown in Table 15.
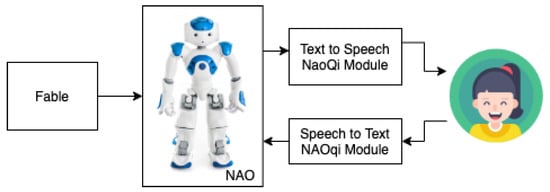
Figure 9.
Setup for the experiment 1A.
Table 15.
Survey about robot performance in the first two scenarios.
We can break down our system to the following parts:
- Fable—NAO randomly picks one fable from a given set of 145 fables. Fables are preprocessed to the sentences.
- Text to Speech NAOqi Module—converts fable to speech. Input are sentences. Robot is not tracking human while telling a story.
- Speech to Text NAOqi Module—user can communicate short commands via this interface. It is used when NAO asks whether he can start telling the story or at the end of the story if the participant wants another story.
- Human—can request more stories.
6.2. Experiment 1B—Setup with Emotional Movements and Gestures
Setup for the second experiment (Figure 10) is the same as for the first experiment with three exceptions. Number one: The input to the NAO is Aesop’s fable marked with emotion. Second is closely connected to the first: NAO is narrating the story with movements and changes in pitch. The third difference is in case the participant wants to hear another story. After requesting a second story, NAO is telling that he is tired and asks if the participator really wants to hear another story. If he gets a positive response, he continues, otherwise he thanks, and the experiment is finished. At the end of the experiment, the participant fills in the survey with the same question as before (Table 15).
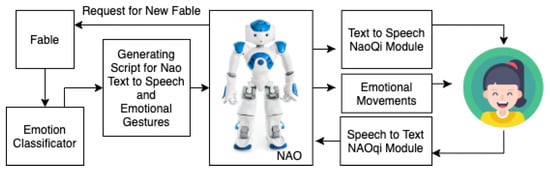
Figure 10.
Setup for the experiment 1B.
We can break down our system to the parts similar to experiment 1. On top of the used block we added:
- Emotion classifier—used to automatically annotate sentences with their appertaining emotions.
- Generating script for NAO text-to-speech and emotional gestures—input to this block is fable annotated with emotions. The output of this block is a script for NAO to tell the story as well as add emotional cues to his behavior such as pitch change and gestures. Gestures are chosen randomly from a predefined set.
6.3. Experiment 1C—Setup with Random Movements
We took setup from experiment 2, removed classification block and modified block Generating script for NAO text-to-speech and emotional gestures to generate any gestures, incongruent to the emotions in written text (Figure 11).
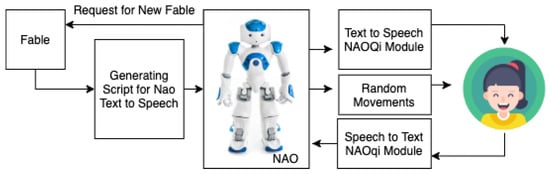
Figure 11.
Setup for the experiment 1C.
6.4. Results of the Experiment 1
The results of the experiments are shown in Table 16. For responses we used a five-point Likert scale with options: 5—I agree extremely; 4—I agree very; 3—I agree moderately; 2—I agree slightly; 1—I do not agree. We took an average of scores for each question. The average length of the interaction was measured from the point where NAO robot greeted the person until he finished narrating his last fable rounded to the minutes. The average number of fables read indicates how many fables were read during one session.
Table 16.
Results from the experiment 1.
From the results above, we can conclude that robot with emotional/random cues (experiments 1B, 1C) achieved better overall rating in comparison to the robot without emotional cues (experiment 1A). We demonstrate that there is a difference in perceiving text from robot to human by adding emotional/random manners to the robot. However, now the question is if it is really necessary to add emotional cues to the robot or any cues would be sufficient, i.e., randomly generated movements. Hence, we adjust the experiment 1B, where gesture generated by the robot were assigned randomly. Experiments 1B and 1C show that the difference between emotional movements and random gestures is not marginal; however, emotional movements are giving slightly better results. Only in (Q4) random gestures topped emotional. We assume, the reason for it was the randomness of generating movements. Participants were surprised by sudden movements and thus saw the robot as interesting.
6.5. Experiment 2—Robot Interaction to Human Spoken Words
Setup for the second experiment (Figure 12) is as follows: the participant is greeted by NAO and asked to sit down. After that, he tells the participant to tell him a story. The participant is given beforehand the story to read. While reading a story to the robot, Google Cloud Speech to Text Service is used to transcribe the text into a written format. Afterwards, our emotion classifier detects emotion in a given text. Text is processed into sentences; emotional gestures are automatically annotated to the text based on present emotion. NAO executes the script and makes emotional gestures. After reading the fable, the robot asks if you would like to read him another story. If he gets a negative response, he says thanks and says that he is looking forward to the next session. At the end of the experiment, participants fill in the survey (Table 17).
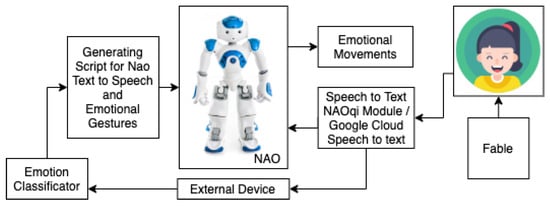
Figure 12.
Setup for experiment 2.
Table 17.
Results from experiment 2.
6.6. Results of the Experiment 2
Results from Table 17 suggest that the robot reacting to the human spoken words had positive impact of robot perception (Q5). The robot even appeared as he was capable to understand what he was told (Q2). What surprised us was the low score of Q3, but it can be explained in two ways: either participant did not see the point in reading to the robot or they would like to tell the robot their text Q4. Despite this, in the current scenario, participants enjoyed reading to the robot. Q3 was also reflected in average numbers of read fables outcome and length of the interaction.
7. Conclusions
The presented work connects two big areas of research namely sentiment analysis and human–robot interaction. We saw a gap in HRI years ago that SA could fulfill. Usually, there is no automation in HRI whatsoever while processing texts spoken by a robot. If a robot is able to speak, everything a robot says is scripted beforehand. Two problems arise from this. Firstly, script making is tedious work and you can not handle every possibility. Secondly, robot can not react adequately if surprised unexpectedly, thus it lowers its positive perception by humans. As a result that we are heading to the era of socially assistive robotics (such as artificial companions), we need to incorporate emotion detection from text in comparison to other modalities (face, voice, gestures) that get more attention from the scientific community.
To demonstrate our claim for emotion detection in text within HRI, we conducted experiments with humanoid robot NAO. We proposed quantitative research with surveys and trackable variables during the experiment (length of interaction and number of fables read) and qualitative research by asking our participants about the experiment to measure improved robot to human interaction. The results of the experiments show there is indeed positive feedback on the human side. From the questionnaire results, it is obvious adding gestures to robot increase positivity in interaction.
We used a lexicon approach and a machine learning approach for the emotion detection. Models for emotion classification were trained using various machine learning methods, as Naïve Bayes classifier, ConceptNet Numberbatch and feed-forward neural network using various data representations as Bag-of-Words, TF-IDF and sentence embeddings. Finally, the ensemble classifier, which consisted of the nine best models for each emotion, was used in scenarios with the humanoid robot NAO.
The results from emotion detection in text using machine learning approaches show an increase in precision and accuracy for each label. Adding additional features from emotional dictionary raised accuracy in some classes more, in some classes less. The biggest increase of accuracy can be seen in class Disgust = 90%, followed by Joy = 83%, Anger = 80%, No emotion = 71%, Anticipation = 67%, Sadness = 67%. The rest of the classes have accuracy equal to or lower than 50%. In comparison to baseline, it is negligible, but still present. Lastly, we observed a change in testing precision and accuracy when we added new data, annotated by K-means algorithm.
We see potential based on the obtained results in utilization of automatic emotion detection from text in human–robot interaction. As experiment 1C showed, the system did not have to be 100% accurate to arouse a positive response from the human. We can take a look from another angle as well: not showing happy gestures when the perceived emotion should be sad and vice-versa. That can transform into a classification as a problem where no occurrence of emotion should be observed.
Author Contributions
Conceptualization, M.S. (Martina Szabóová) and K.M.; methodology, M.S. (Martina Szabóová); software, M.S. (Martina Szabóová) and V.M.K.; validation, M.S. (Martina Szabóová) and V.M.K.; formal analysis, M.S. (Martina Szabóová) and M.S. (Martin Sarnovský); investigation, M.S. (Martina Szabóová), M.S. (Martin Sarnovský) and K.M.; resources, M.S. (Martina Szabóová) and M.S. (Martin Sarnovský); data curation, M.S. (Martina Szabóová); writing—original draft preparation, M.S. (Martina Szabóová), M.S. (Martin Sarnovský) and V.M.K.; writing—review and editing, M.S. (Martina Szabóová), K.M., M.S. (Martin Sarnovský) and V.M.K.; visualization, M.S. (Martina Szabóová); supervision, K.M.; project administration, K.M.; funding acquisition, K.M. All authors have read and agreed to the published version of the manuscript.
Funding
The work was supported by the Slovak Research and Development Agency under the contract No. APVV-16-0213 Knowledge-based approaches for intelligent analysis of big data and No. APVV-17-0267 Automated Recognition of Antisocial Behaviour in Online Communities.
Conflicts of Interest
The authors declare no conflict of interest.
References
- Chivarov, N.; Chikurtev, D.; Chivarov, S.; Pleva, M.; Ondas, S.; Juhar, J.; Yovchev, K. Case Study on Human-Robot Interaction of the Remote-Controlled Service Robot for Elderly and Disabled Care. Comput. Inform. 2020, 38, 1210–1236. [Google Scholar] [CrossRef]
- Wada, K.; Shibata, T.; Saito, T.; Tanie, K. Analysis of factors that bring mental effects to elderly people in robot assisted activity. IEEE Int. Conf. Intell. Robot. Syst. 2002, 2, 1152–1157. [Google Scholar] [CrossRef]
- Šabanovic, S.; Bennett, C.C.; Chang, W.L.; Huber, L. PARO robot affects diverse interaction modalities in group sensory therapy for older adults with dementia. IEEE Int. Conf. Rehabil. Robot. 2013. [Google Scholar] [CrossRef]
- Huang, T.; Huang, C. Elderly’s acceptance of companion robots from the perspective of user factors. Univers. Access Inf. Soc. 2019. [Google Scholar] [CrossRef]
- De Albornoz, J.C.; Plaza, L.; Gervás, P. SentiSense: An easily scalable concept-based affective lexicon for sentiment analysis. In Proceedings of the Eight International Conference on Language Resources and Evaluation (LREC’12); European Language Resources Association (ELRA): Istanbul, Turkey, 2012; pp. 23–25. [Google Scholar]
- Taboada, M.; Brooke, J.; Tofiloski, M.; Voll, K.; Stede, M. Lexicon-Based Methods for Sentiment Analysis. Comput. Linguist. 2011, 37, 1–41. [Google Scholar] [CrossRef]
- Szabo, P.; Machova, K. Various approaches to the opinion classification problems solving. In Proceedings of the 2012 IEEE 10th International Symposium on Applied Machine Intelligence and Informatics (SAMI), Herl’any, Slovakia, 26–28 January 2012; pp. 59–62. [Google Scholar] [CrossRef]
- Mohammad, S.; Bravo-Marquez, F. WASSA-2017 Shared Task on Emotion Intensity. arXiv 2018, arXiv:1708.03700. [Google Scholar] [CrossRef]
- Gui, L.; Xu, R.; Lu, Q.; Wu, D.; Zhou, Y. Emotion cause extraction, a challenging task with corpus construction. In Communications in Computer and Information Science; Springer: Singapore, 2016; Volume 669, pp. 98–109. [Google Scholar] [CrossRef]
- Ekman, P. Expression and the nature of emotion. Approaches Emot. 1984, 3, 344. [Google Scholar]
- Amado-Boccara, I.; Donnet, D.; Olié, J.P. The concept of mood in psychology. L’Encephale 1993, 19, 117–122. [Google Scholar]
- Grandjean, D.; Sander, D.; Scherer, K.R. Conscious emotional experience emerges as a function of multilevel, appraisal-driven response synchronization. Conscious. Cogn. 2008, 17, 484–495. [Google Scholar] [CrossRef]
- Ortony, A.; Clore, G.L.; Collins, A. The Cognitive Structure of Emotions; Cambridge University Press: Cambridge, MA, USA, 1988. [Google Scholar] [CrossRef]
- Russell, J.A. A circumplex model of affect. J. Personal. Soc. Psychol. 1980, 39, 1161–1178. [Google Scholar] [CrossRef]
- Lövheim, H. A new three-dimensional model for emotions and monoamine neurotransmitters. Med. Hypotheses 2012, 78, 341–348. [Google Scholar] [CrossRef]
- Shuman, V.; Schlegel, K.; Scherer, K. Geneva Emotion Wheel Rating Study PROPEREMO View Project A Developmental Perspective of Emotion Regulation View Project; Technical Report; University of Geneva, Swiss Center for Affective Sciences: Geneva, Switzerland, 2016. [Google Scholar]
- Ekman, P. What Scientists Who Study Emotion Agree About. Perspect. Psychol. Sci. 2016, 11, 31–34. [Google Scholar] [CrossRef]
- Darwin, C. The Expression of the Emotions in Man and Animals. J. Nerv. Ment. Dis. 1956, 123, 90. [Google Scholar] [CrossRef]
- Wundt, W. Grundriss der Psychologie. In Grundriss der Psychologie, 13; Leipzig, G., Ed.; Engelmann: Leipzig, Germany, 1896. [Google Scholar] [CrossRef]
- Feil-seifer, D.; Mataric, M.J. Human-Robot Interaction. In Encyclopedia of Complexity and Systems Science; Springer: Berlin/Heidelberg, Germany, 2009; pp. 4643–4659. [Google Scholar]
- Fink, J. Anthropomorphism and human likeness in the design of robots and human-robot interaction. In Lecture Notes in Computer Science (Including Subseries Lecture Notes in Artificial Intelligence and Lecture Notes in Bioinformatics); Springer: Berlin/Heidelberg, Germany, 2012; Volume 7621 LNAI, pp. 199–208. [Google Scholar] [CrossRef]
- Goodrich, M.A.; Schultz, A.C. Human-robot interaction: A survey. Found. Trends Hum. 2007, 1, 203–275. [Google Scholar] [CrossRef]
- Zheng, X. Four memory categories to support socially-appropriate conversations in long-term HRI. In Proceedings of the Workshop on Personalization in Long-Term Human–Robot Interaction (14th Annual ACM/IEEE International Conference on Human–Robot Interaction), Daegu, Korea, 11–14 March 2019. [Google Scholar]
- Richards, D.; Bransky, K. ForgetMeNot: What and how users expect intelligent virtual agents to recall and forget personal conversational content. Int. J. Hum. Comput. Stud. 2014, 72, 460–476. [Google Scholar] [CrossRef]
- Lee, M.K.; Forlizzi, J.; Kiesler, S.; Rybski, P.; Antanitis, J.; Savetsila, S. Personalization in HRI: A longitudinal field experiment. In Proceedings of the 7th Annual ACM/IEEE International Conference on Human-Robot Interaction, Boston, MA, USA, 5–8 March 2012; pp. 319–326. [Google Scholar] [CrossRef]
- Cao, H.L.; Van de Perre, G.; Kennedy, J.; Senft, E.; Esteban, P.G.; De Beir, A.; Simut, R.; Belpaeme, T.; Lefeber, D.; Vanderborght, B. A personalized and platform-independent behavior control system for social robots in therapy: Development and applications. IEEE Trans. Cogn. Dev. Syst. 2018. [Google Scholar] [CrossRef]
- Churamani, N.; Anton, P.; Brügger, M.; Fliebwasser, E.; Hummel, T.; Mayer, J.; Mustafa, W.; Ng, H.G.; Nguyen, T.L.C.; Nguyen, Q.; et al. The impact of personalisation on human-robot interaction in learning scenarios. In Proceedings of the 5th International Conference on Human Agent Interaction, Bielefeld, Germany, 17 October 2017; pp. 171–180. [Google Scholar] [CrossRef]
- Iio, T.; Satake, S.; Kanda, T.; Hayashi, K.; Ferreri, F.; Hagita, N. Human-Like Guide Robot that Proactively Explains Exhibits. Int. J. Soc. Robot. 2019. [Google Scholar] [CrossRef]
- Kumagai, K.; Lin, D.; Mizuuchi, I.; Meng, L.; Blidaru, A.; Beesley, P.; Kulić, D. Towards Individualized Affective Human-Machine Interaction. In Proceedings of the 27th IEEE International Symposium on Robot and Human Interactive Communication, Nanjing, China, 27–31 August 2018; pp. 678–685. [Google Scholar] [CrossRef]
- Kennedy, J.; Baxter, P.; Belpaeme, T. The Robot Who Tried Too Hard: Social Behaviour of a Robot Tutor Can Negatively Affect Child Learning. In Proceedings of the ACM/IEEE International Conference on Human-Robot Interaction, Portland, OR, USA, 2–5 March 2015; pp. 67–74. [Google Scholar] [CrossRef]
- Gao, Y.; Barendregt, W.; Obaid, M.; Castellano, G. When Robot Personalisation Does Not Help: Insights from a Robot-Supported Learning Study. In Proceedings of the 27th IEEE International Symposium on Robot and Human Interactive Communication, Nanjing, China, 27–31 August 2018; pp. 705–712. [Google Scholar] [CrossRef]
- Castellano, G.; Leite, I.; Pereira, A.; Martinho, C.; Paiva, A.; McOwan, P.W. Affect recognition for interactive companions: Challenges and design in real world scenarios. J. Multimodal User Interfaces 2010, 3, 89–98. [Google Scholar] [CrossRef]
- Höök, K. Affective loop experiences: Designing for interactional embodiment. Philos. Trans. R. Soc. Biol. Sci. 2009, 364, 3585–3595. [Google Scholar] [CrossRef]
- Paiva, A.; Leite, I.; Ribeiro, T. Emotion Modelling for Social Robots. In The Oxford Handbook of Affective Computing; Oxford University Press: Oxford, UK, 2014. [Google Scholar] [CrossRef]
- Picard, R.W. Affective Computing; MIT Press: Cambridge, MA, USA, 1997; Volume 73, p. 304. [Google Scholar] [CrossRef]
- Mehrabian, A. Nonverbal Communication; Aldine Transaction: New Brunswick, NJ, USA, 1972. [Google Scholar]
- Mehta, D.; Siddiqui, M.F.H.; Javaid, A.Y. Facial emotion recognition: A survey and real-world user experiences in mixed reality. Sensors (Switzerland) 2018, 18, 416. [Google Scholar] [CrossRef]
- Sariyanidi, E.; Gunes, H.; Cavallaro, A. Automatic analysis of facial affect: A survey of registration, representation, and recognition. IEEE Trans. Pattern Anal. Mach. Intell. 2015, 37, 1113. [Google Scholar] [CrossRef]
- Goulart, C.; Valadão, C.; Delisle-Rodriguez, D.; Funayama, D.; Favarato, A.; Baldo, G.; Binotte, V.; Caldeira, E.; Bastos-Filho, T. Visual and thermal image processing for facial specific landmark detection to infer emotions in a child-robot interaction. Sensors (Switzerland) 2019, 19, 2844. [Google Scholar] [CrossRef]
- Liliana, D.Y.; Basaruddin, T.; Widyanto, M.R.; Oriza, I.I.D. Fuzzy emotion: A natural approach to automatic facial expression recognition from psychological perspective using fuzzy system. Cogn. Process. 2019, 20, 391–403. [Google Scholar] [CrossRef]
- Kleinsmith, A.; Bianchi-Berthouze, N. Affective body expression perception and recognition: A survey. IEEE Trans. Affect. Comput. 2013, 4, 15–33. [Google Scholar] [CrossRef]
- Dael, N.; Mortillaro, M.; Scherer, K.R. Emotion expression in body action and posture. Emotion 2012, 12, 1085–1101. [Google Scholar] [CrossRef] [PubMed]
- Witkower, Z.; Tracy, J.L. Bodily Communication of Emotion: Evidence for Extrafacial Behavioral Expressions and Available Coding Systems. Emot. Rev. 2018. [Google Scholar] [CrossRef]
- Bijlstra, G.; Holland, R.W.; Dotsch, R.; Wigboldus, D.H. Stereotypes and Prejudice Affect the Recognition of Emotional Body Postures. Emotion 2019, 19, 189–199. [Google Scholar] [CrossRef] [PubMed]
- Vinciarelli, A.; Pantic, M.; Bourlard, H.; Pentland, A. Social signal processing: State-of-the-art and future perspectives of an emerging domain. In Proceedings of the 2008 ACM International Conference on Multimedia, with Co-Located Symposium and Workshops, Vancouver, BC, Canada, 12 October 2008; pp. 1061–1070. [Google Scholar] [CrossRef]
- Swain, M.; Routray, A.; Kabisatpathy, P. Databases, features and classifiers for speech emotion recognition: A review. Int. J. Speech Technol. 2018, 21, 93–120. [Google Scholar] [CrossRef]
- Mahani, M.A.N.; Sheybani, S.; Bausenhart, K.M.; Ulrich, R.; Ahmadabadi, M.N. Multisensory Perception of Contradictory Information in an Environment of Varying Reliability: Evidence for Conscious Perception and Optimal Causal Inference. Sci. Rep. 2017, 7. [Google Scholar] [CrossRef] [PubMed]
- Desmet, B.; Hoste, V. Emotion Detection in Suicide Notes. Expert Syst. Appl. 2013, 40, 6351–6358. [Google Scholar] [CrossRef]
- Wicentowski, R.; Sydes, M.R. Emotion Detection in Suicide Notes using Maximum Entropy Classification. Biomed. Inform. Insights 2012, 5, 51–60. [Google Scholar] [CrossRef] [PubMed]
- Luyckx, K.; Vaassen, F.; Peersman, C.; Daelemans, W. Fine-grained emotion detection in suicide notes: A thresholding approach to multi-label classification. Biomed. Inform. Insights 2012, 5, 61–69. [Google Scholar] [CrossRef] [PubMed][Green Version]
- Pak, A.; Bernhard, D.; Paroubek, P.; Grouin, C. A combined approach to emotion detection in suicide notes. Biomed. Inform. Insights 2012, 5, 105–114. [Google Scholar] [CrossRef] [PubMed]
- Bandhakavi, A.; Wiratunga, N.; Massie, S.; Padmanabhan, D. Lexicon Generation for Emotion Detection from Text. IEEE Intell. Syst. 2017, 32, 102–108. [Google Scholar] [CrossRef]
- Alm, C.O.; Roth, D.; Sproat, R. Emotions from Text; Association for Computational Linguistics (ACL): Stroudsburg, PA, USA, 2005; pp. 579–586. [Google Scholar] [CrossRef]
- Carlson, A.; Cumby, C.; Rosen, J.; Roth, D. The SNoW Learning Architecture; Technical Report UIUCDCS-R-99-2101; UIUC Computer Science Department: Champaign, IL, USA, 1999; p. 24. [Google Scholar]
- Kratzwald, B.; Ilić, S.; Kraus, M.; Feuerriegel, S.; Prendinger, H. Deep learning for affective computing: Text-based emotion recognition in decision support. Decis. Support Syst. 2018, 115, 24–35. [Google Scholar] [CrossRef]
- Khanpour, H.; Caragea, C. Fine-Grained Emotion Detection in Health-Related Online Posts. In Proceedings of the 2018 Conference on Empirical Methods in Natural Language Processing; Association for Computational Linguistics: Stroudsburg, PA, USA, 2019; pp. 1160–1166. [Google Scholar] [CrossRef]
- Kim, E.; Klinger, R. Who Feels What and Why ? Annotation of a Literature Corpus with Semantic Roles of Emotions. In Proceedings of the 27th International Conference on Computational Linguistics, Santa Fe, NM, USA, 20–26 August 2018; pp. 1345–1359. [Google Scholar]
- Gupta, U.; Chatterjee, A.; Srikanth, R.; Agrawal, P. A Sentiment-and-Semantics-Based Approach for Emotion Detection in Textual Conversations. arXiv 2017, arXiv:1707.06996. [Google Scholar]
- Chatterjee, A.; Gupta, U.; Chinnakotla, M.K.; Srikanth, R.; Galley, M.; Agrawal, P. Understanding Emotions in Text Using Deep Learning and Big Data. Comput. Hum. Behav. 2019, 93, 309–317. [Google Scholar] [CrossRef]
- Strapparava, C.; Mihalcea, R. Learning to identify emotions in text. In Proceedings of the ACM Symposium on Applied Computing, Pau, France, 9–13 April 2008; pp. 1556–1560. [Google Scholar] [CrossRef]
- Mohammad, S. #Emotional Tweets. In *SEM 2012: The First Joint Conference on Lexical and Computational Semantics – Volume 1: Proceedings of the main conference and the shared task, and Volume 2: Proceedings of the Sixth International Workshop on Semantic Evaluation (SemEval 2012); Association for Computational Linguistics: Montreal, QC, Canada, 2012; pp. 246–255. [Google Scholar]
- Buechel, S.; Hahn, U. EmoBank: Studying the Impact of Annotation Perspective and Representation Format on Dimensional Emotion Analysis. In Proceedings of the 15th Conference of the {E}uropean Chapter of the Association for Computational Linguistics: Volume 2, Short Papers; Association for Computational Linguistics: Valencia, Spain, 2017; pp. 578–585. [Google Scholar]
- Buechel, S.; Hahn, U. Readers vs. Writers vs. Texts: Coping with Different Perspectives of Text Understanding in Emotion Annotation. In Proceedings of the 11th Linguistic Annotation Workshop, Valencia, Spain, 3 April 2017; pp. 1–12. [Google Scholar] [CrossRef]
- Mohammad, S.M.; Bravo-Marquez, F. Emotion intensities in tweets. In Proceedings of the SEM 2017—6th Joint Conference on Lexical and Computational Semantics, Proceedings, Vancouver, QC, Canada, 3–4 August 2017; pp. 65–77. [Google Scholar] [CrossRef]
- Ben-Hur, A.; Weston, J. A user’s guide to support vector machines. Methods Mol. Biol. 2010. [Google Scholar] [CrossRef]
- Ting, S.L.; Ip, W.H.; Tsang, A.H. Is Naïve bayes a good classifier for document classification? Int. J. Softw. Eng. Appl. 2011, 5, 37–46. [Google Scholar]
- Sarnovský, M.; Butka, P.; Bednár, P.; Babič, F.; Paralič, J. Analytical platform based on Jbowl library providing text-mining services in distributed environment. In Lecture Notes in Computer Science (Including Subseries Lecture Notes in Artificial Intelligence and Lecture Notes in Bioinformatics); Springer: Berlin/Heidelberg, Germany, 2015. [Google Scholar] [CrossRef]
- Krešňáková, V.M.; Sarnovský, M.; Butka, P. Deep learning methods for Fake News detection. In Proceedings of the 2019 IEEE 19th International Symposium on Computational Intelligence and Informatics and 7th IEEE International Conference on Recent Achievements in Mechatronics, Automation, Computer Sciences and Robotics (CINTI-MACRo), Szeged, Hungary, 14–16 November 2019; pp. 000143–000148. [Google Scholar]
- Goodfellow, I.; Bengio, Y.; Courville, A. Deep Learning; MIT Press: Cambridge, MA, USA, 2016. [Google Scholar]
- Nair, V.; Hinton, G.E. Rectified linear units improve restricted boltzmann machines. In Proceedings of the 27th International Conference on International Conference on Machine Learning, Haifa, Israel, 21–24 June 2010; pp. 807–814. [Google Scholar]
- Leshno, M.; Lin, V.Y.; Pinkus, A.; Schocken, S. Multilayer feedforward networks with a nonpolynomial activation function can approximate any function. Neural Netw. 1993, 6, 861–867. [Google Scholar] [CrossRef]
- Kingma, D.P.; Ba, J. Adam: A method for stochastic optimization. arXiv 2014, arXiv:1412.6980. [Google Scholar]
- Hinton, G.E.; Srivastava, N.; Krizhevsky, A.; Sutskever, I.; Salakhutdinov, R.R. Improving neural networks by preventing co-adaptation of feature detectors. arXiv 2012, arXiv:1207.0580. [Google Scholar]
- Polyak, B.T. Some methods of speeding up the convergence of iteration methods. USSR Comput. Math. Math. Phys. 1964, 4, 1–17. [Google Scholar] [CrossRef]
- Rumelhart, D.E.; Hinton, G.E.; Williams, R.J. Learning representations by back-propagating errors. Nature 1986, 323, 533–536. [Google Scholar] [CrossRef]
- Chicco, D.; Jurman, G. The advantages of the Matthews correlation coefficient (MCC) over F1 score and accuracy in binary classification evaluation. BMC Genom. 2020, 21, 6. [Google Scholar] [CrossRef] [PubMed]
Publisher’s Note: MDPI stays neutral with regard to jurisdictional claims in published maps and institutional affiliations. |
© 2020 by the authors. Licensee MDPI, Basel, Switzerland. This article is an open access article distributed under the terms and conditions of the Creative Commons Attribution (CC BY) license (http://creativecommons.org/licenses/by/4.0/).