Article

A New Approach to Determining Liquid Concentration Using Multiband Annular Ring Microwave Sensor and Polarity Correlator

1
KACST-TIC in Radio Frequency and Photonics (RFTONICS), King Saud University, Riyadh 11421, Saudi Arabia
2
Electrical Engineering Department, King Saud University, Riyadh 11421, Saudi Arabia
*
Author to whom correspondence should be addressed.
Electronics 2020, 9(10), 1616; https://doi.org/10.3390/electronics9101616
Submission received: 18 August 2020 / Revised: 2 September 2020 / Accepted: 23 September 2020 / Published: 1 October 2020
(This article belongs to the Section Microwave and Wireless Communications)

Abstract

:
This article presents a new approach to determining liquid concentration using a new microwave sensor and polarity correlator. The sensor design incorporates an annular ring resonator having inside three parallel lines, a trapezoid ground plane and a co-planar waveguide (CPW) tapered feeder, which altogether achieve multiple frequency bands. Multiple bands of interest are obtained at the lower end of the microwave spectrum, i.e., from 1–6 GHz, as this region is widely accepted in analyzing various liquid samples. The sensor size is 71 × 40 × 1.6 mm3 with material selection based on an economically available FR4 substrate. The sensor is realized and experimentally validated for its sensitivity by utilizing in-lab prepared aqueous solution samples. Further, liquid concentration is determined by adopting a polarity correlator, which is applied to the sensor’s responses obtained at different values.

1. Introduction

Industrial interest in distinguishing properties of various materials has persuaded the research community to invest time and knowledge into the design of various sensors, especially in characterizing material properties. Usually, any material can be classified by its electric and/or magnetic behavior [1]. Each distinct behavior can be analyzed from excitation by an electromagnetic (EM) wave. The nature and behavior of materials are determined by analyzing their electric and magnetic properties. In the domain of microwave engineering, various studies have been conducted to analyze dielectric material properties [2,3] with its applications being found in the field of cellular and biological materials, electromagnetic compatibility and detection of substances in natural minerals and rare earth metals [4,5,6,7]. Various types of sensors and their combinations have been tried and tested in the industry for characterizing material properties; however, these implemented sensor technologies have their share of challenges and cons in terms of high power consumption, inflation in maintenance costs, large size and uneconomical usage [8].
One way to alleviate the aforementioned difficulties is to make use of sensors typically operating in the (300 MHz–300 GHz) range by transmitting an EM wave through a sample or receiving an EM wave through a reflector. The analyses are mostly conducted by accumulating the data in the form of s-parameters which include the details of magnitude and phase components [9]. Typically, a wideband frequency response is desirable in any material characterization as it holds more information but a common limitation is seen as higher frequencies tend to lead to high expenses. To keep the cost low and to obtain vast information, microwave sensors serve as an inexpensive option and offer low power consumption and easy fabrication traits [10,11].
Liquid sensing has gained attention due to technological advancements [12,13]. A major component in any liquid is the presence of water content. It is one of the major factors for the existence of a lifecycle and to detect any changes in its form or purity can directly affect human life. Water is mostly applied in various liquid detecting and monitoring applications, such as biomedical applications, where monitoring at the cellular activity can lead to the presence of bacteria growth and its effects. Similarly, often direct heating or cooling of a cell or substance is not possible, and water is therefore used in the form of microfluidic circuits to heat or cool the environment indirectly for live tissues. Similarly, sensors can be used to detect any oil leakage that may have spilled in pipes passing through lakes or ponds.
Various planar microwave sensors have been reported in the literature that are used for liquid sensing [14,15,16]. Waveguide cavity resonators are another type that is used as liquid detecting sensors as they offer high quality factor and sensitivity. The only downside is that they are often too bulky and non-useable as a compact mobile option. An alternative option that is gaining popularity among researchers is the utilization of a complementary split ring resonator for liquid dielectric characterization, as reported in [17]. Specifically, dual bands are used to identify the bi-liquid impurity of the material under test placed onto the sensor surface. Another technique described in [18] makes use of the electric field distribution of the Substrate Integrated Waveguide (SIW) design. The idea is explored and experimentally verified by testing different chemicals sensitivity via two different microfluidic channels. Similarly, a single chemical detecting sensor is researched using a circular SIW cavity model in [19]. Dual-mode resonators utilizing a folded microstrip line are utilized for dual chemical sensing [20]. A number of studies have also been carried out for ethanol liquid sensing using SIW [21,22]. An inject-printed microstrip patch antenna is used as a sensor for liquid identification in [23]. In all these cases, whatever the liquid sample, water is always involved and the viable sensor is mostly based on microwave planar resonator technology.
In this work, we present a new approach for characterizing liquid samples in terms of their concentration levels. Determination of liquid concentration is of potential value in many applications, including blood glucose monitoring; see [24] and the references therein. Here, we introduce a novel approach to characterizing dielectric materials and possibly materials in general, and we do so by analyzing a multi-band response. With multi-band responses, more information can be gathered about the samples under test compared to single band sensor response [25]. Specifically, we report two main contributions. The first is related to the design of a new sensor, whereas the second is related to the development of a simple algorithm to process measured signal samples. These two contributions can be summarized as follows:
  • The sensor is designed so that it incorporates an annular ring resonator having inside three parallel lines, a trapezoid ground plane and a co-planar waveguide (CPW) tapered feeder, which altogether achieve multiple frequency bands to help producing changes in the frequency responses of different materials over the entire frequency range of interest of 1–6 GHz. The sensor is designed to measure the reflection coefficients to detect complex permittivity variations which is correlated to liquid concentration. Towards this objective, we prepared liquid samples (sugar plus water) with concentrations having relatively very close permittivity values, as in [26]. The reason is to have a better evaluation of the sensor’s sensitivity, and to be a step forward for future development of non-invasive blood glucose monitoring sensors, as in [24,26,27]. However, the developed sensor can be used in other sensing applications, as well.
  • The signal processing technique is developed such that it applies a polarity correlator to the filtered sensor’s responses to determine liquid concentration. Note that the proposed signal processing approach is simple to implement and different from what exists in the literature, as liquid concentration is often determined by quantifying the number of shifts in resonances of a measured sensor’s responses at particular frequencies. To the best of the authors’ knowledge, this is the first time that the concentration value of a liquid has been determined using a microwave sensor complemented with a simple signal processing method based on a polarity correlator.
Table 1 shows a comparison with similar state-of-the-art work for determining liquid concentrations of aqueous solutions. The comparison is conducted on the basis of sensor design technology, band to be processed, concentration levels and number of ports. According to Table 1, the proposed design has a clear advantage in that it can determine relatively low and high concentrations of aqueous solutions with a higher resolution than other reported methods using a single port. The rest of the paper is organization as follows: Section 2 describes the proposed sensor design and its measured results. Section 3 details the solution preparation techniques and sensor validation by experiments. Section 4 presents the polarity correlator used to determine the concentrations of solutions. Section 5 presents concluding remarks.

2. Annular Ring Microwave Sensor: Design and Analysis

The proposed microwave sensor is depicted in Figure 1, where part (a) presents the geometric parameters and part (b) shows the realized prototype. The sensor design contains a planar structure with an annular ring patch, a trapezoidal ground plane and a tapered co-planar waveguide (CPW) feed line in the middle to excite the structure. The design is an amalgamation and extension of the discone antenna [35] and printed monopole UWB antenna [36]. The sensor design differs from its predecessors [35,36] in the introduction of three parallel rectangular resonators inside the annular ring that enable the sensor to resonate at multiple bands. These multiband resonances assist in producing variations over the entire frequency band of interest in response to many different materials. Among the three parallel resonators, the middle one is in contact with the inside circle of the annular ring while the remaining two resonators are not touching the ring but rather utilizing the mutual coupling effect from the main resonators to produce multiband resonances in the band of interest, i.e., 1–6 GHz.
The design contains various design parameters that contribute to its performance. For instance, the tapered ground plane, apart from being a radiating element, provides ground plane characteristics for the CPW feed, along with the matching properties to the annular ring patch. Similarly, the CPW feed line is tapered to match the 100 Ω impedance at the node of the annular ring patch to the port impedance of 50 Ω. The optimized dimensions of the proposed microwave sensor are given in Table 2. The substrate used for the sensor is based on an economically available and rigid substrate, i.e., FR4 with thickness and permittivity of 1.6 mm and 4.3 mm, respectively. The microwave sensor design was simulated using the commercial electromagnetic simulator Computer Simulation Technology-Microwave Studio (CST-MWS) [37].
The sensor was also fabricated and its reflection coefficient parameters were measured for the single port using Keysight PNA Microwave Network Analyzer N5227A (Keysight, Santa Rosa, CA, USA) with 1001 frequency points [38]. Figure 2 shows various curves of simulated and measured responses in the frequency range of 1–6 GHz. The results show the sensor resonance at a single band when only the annular ring is excited, and the response at multiple bands when the parallel rectangular resonators are introduced inside the annular ring. Some discrepancies in the form of minute frequency shifts are observed during the measurements which arise due to the SMA connector losses, which were not considered during the simulation process. However, the shape of the measured and simulated signatures confirms the design is appropriate and in correct working order.
Analyzing Figure 2 reveals that when the microwave sensor is excited with just an annular ring, two resonances (blue curve) were produced around 1.6 GHz and 4.5 GHz with −15 dB and −30 dB dips. When a single resonator (middle) was added inside the annular ring, the resonance (brown curve) at the lower frequency remains the same at 1.6 GHz. This occurs with an increased dip of −13 dB and an observed shift from 4.5 GHz to 3.8 GHz with a dip of −35 dB. Additionally, a new resonance at 5.3 GHz with −13 dB dip is observed. By introducing a second resonator (top) parallel to the first one inside the annular ring, the frequency response (pink curve) remains almost the same at 1.6 GHz and 5.3 GHz while two new resonances appear at 3.2 GHz and 3.9 GHz with respective dips at −13 dB and −12 dB. Finally, a third resonator (bottom) is added inside the annular ring with responses almost remaining the same for the lower and high ends of the spectrum, i.e., at 1.6 GHz and 5.3 GHz while a major shift is seen in the middle frequency ranges (black curve). The two resonances formed earlier shifted to 2.8 GHz and 3.7 GHz with respective dips at −25 dB and −15 dB. To validate the simulated sensor design with the three parallel resonators inside the annular ring, the standard etching and lithography method based on LPKF machine was used to realize the prototype. Its measured results are shown in Figure 2, as a dotted red curve with almost matching resonance. In order to understand the mechanism of the proposed microwave sensor, its surface current and electric field distribution are presented in Figure 3a–d. The distribution is obtained at the resonating frequencies of 1.6 GHz, 2.8 GHz, 3.7 GHz and 5.3 GHz from the measured response of the final prototype (Figure 2, dotted red curve). The field distributions of the annular ring sensor with three parallel resonators inside present a view on how the fields get propagated at selected resonances. From Figure 3a, which corresponds to resonance of 1.6 GHz, most of the energy is concentrated around the annular ring with a small number of currents. These currents flow in the three parallel resonators with more intensity in one particular resonator, which is also visible from its electric field distribution. Figure 3b, corresponding to resonance of 2.8 GHz, presents the same field concentration behavior for the annular ring while the remaining electric energy flows through two coupled non-contacting parallel resonators. Similarly, for the resonance of 3.7 GHz depicted in Figure 3c, most of the energy distribution is concentrated on the upper portion of the annular ring along with the top coupled parallel resonator. Finally, Figure 3d presents the field distribution of the resonance at 5.3 GHz with most of the energy concentrated on the lower portion of the annular ring and the lower parallel coupled resonator. The flow of current in the resonators and the annular ring are in the form of parallel and anti-parallel direction which correspond to the control of electric and magnetic responses, respectively. These modes have been intensively studied for the manipulating of local field, nonlinearity and sensing [39,40,41,42]. This means that the sensor is sensitive to detecting minute changes in a liquid when placed on the hotspots shown by the electric field intensity.

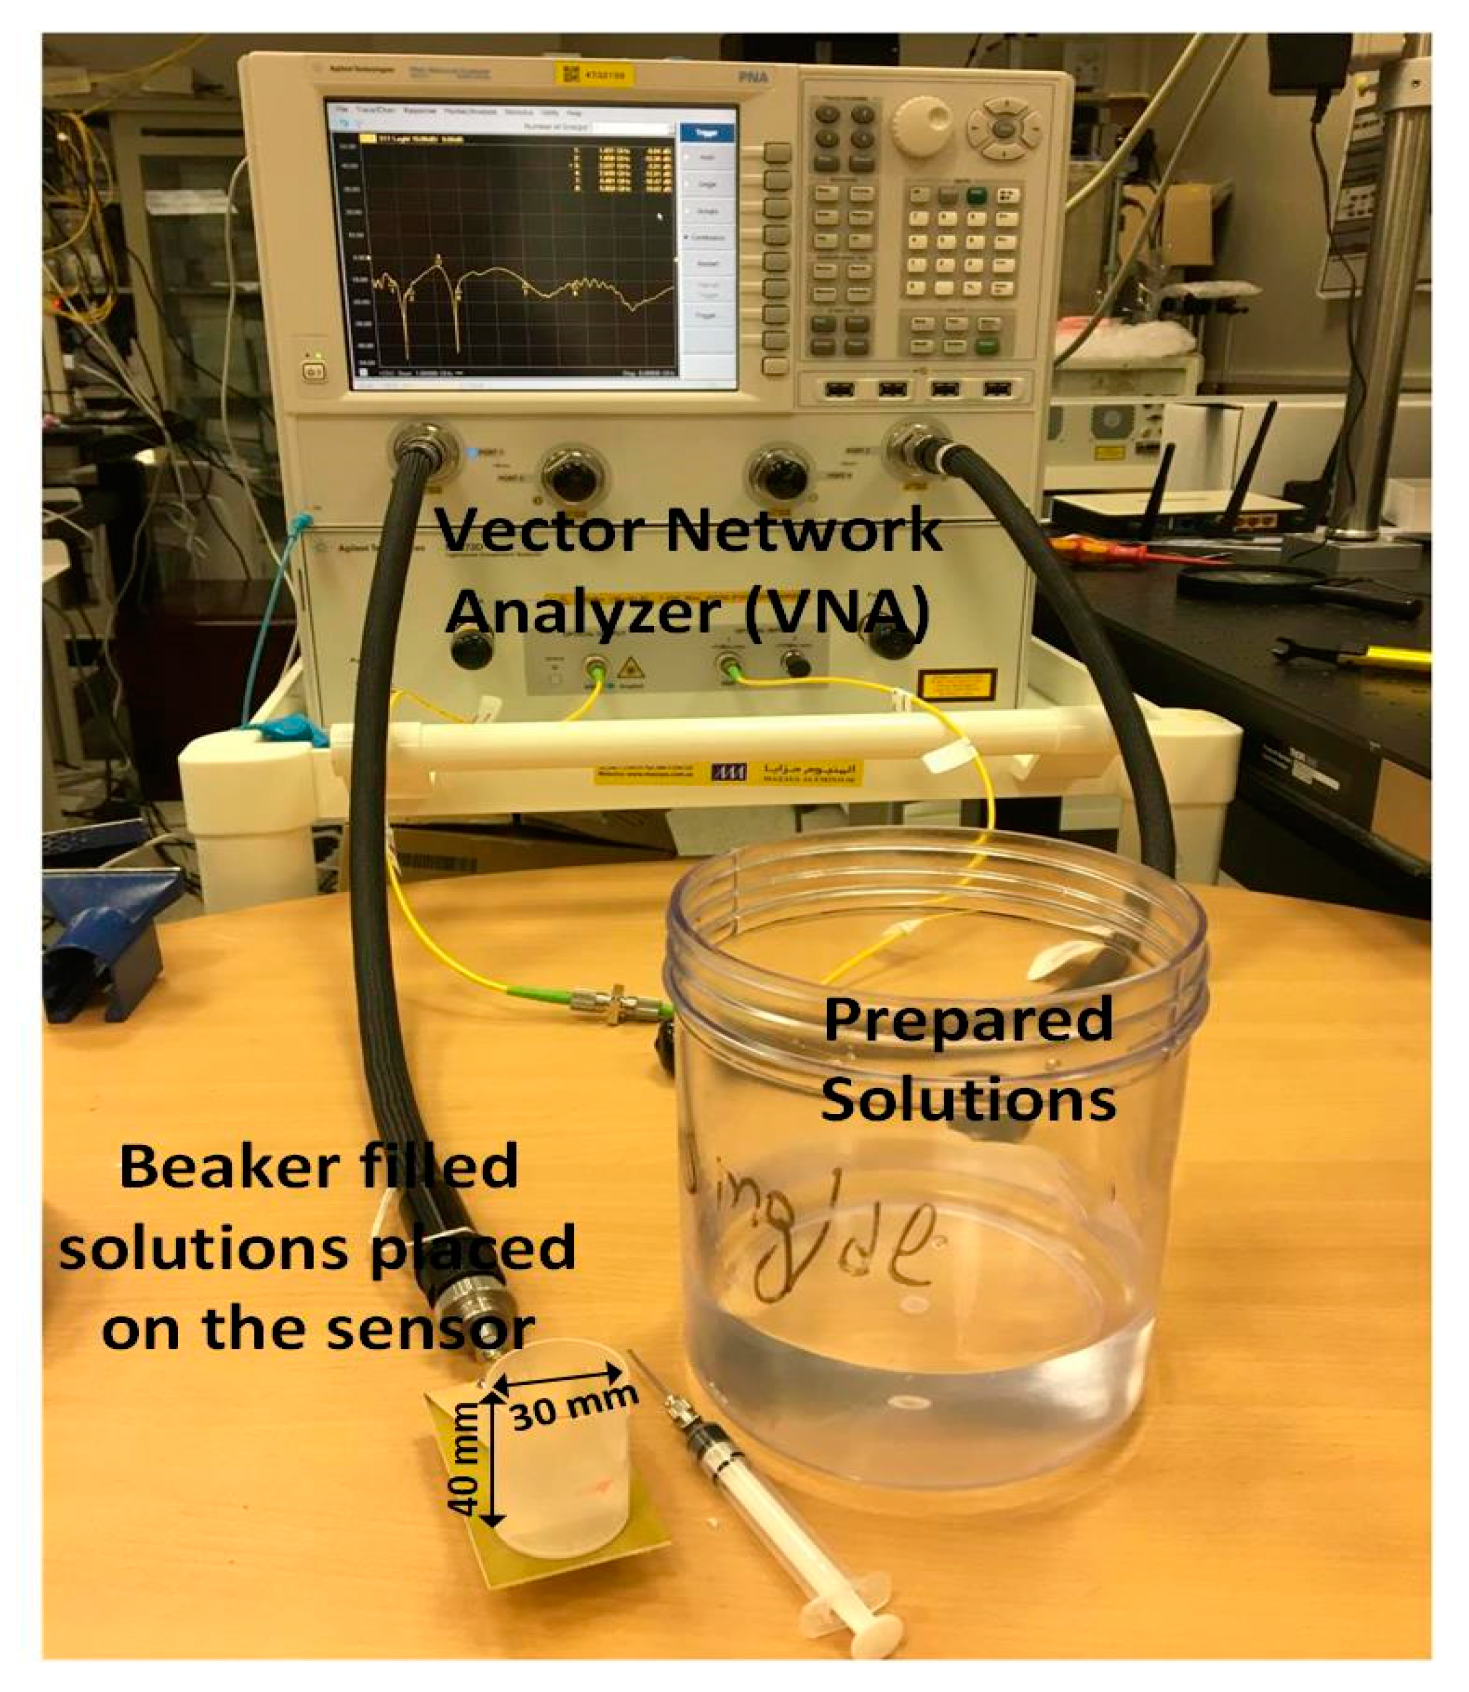
3. Sensors Experimental Validation

3.1. Sample Preparation

In order to verify the proposed sensing principle, various in-lab solutions were prepared. A decision was reached to use aqueous glucose solution as a sample for its wide usage in literature [43], and ease in preparation in terms of material and equipment acquisition. Five aqueous solutions with concentrations of 60 mg/dL, 100 mg/dL, 160 mg/dL, 180 mg/dL and 200 mg/dL were prepared as shown in Figure 4a. Obtaining different responses for these five solutions is challenging as they have very close permittivity values over the frequency range of interest, as shown in Figure 4b. The curves in Figure 4b were obtained by utilizing a known commercial dielectric characterization assessment kit (DAK) from SPEAG [44]. The aqueous glucose is prepared using anhydrous dextrose powder [45]. This highly pure powder is habitually used in some diets. Moreover, due to its dry form and its solubility compared to the fructose, dextrose is the best in its genre for testing a water-sensitive system. To ensure the homogeneity of these mixtures, the water and the powder were mixed at a specific temperature and agitated at a certain speed [46].

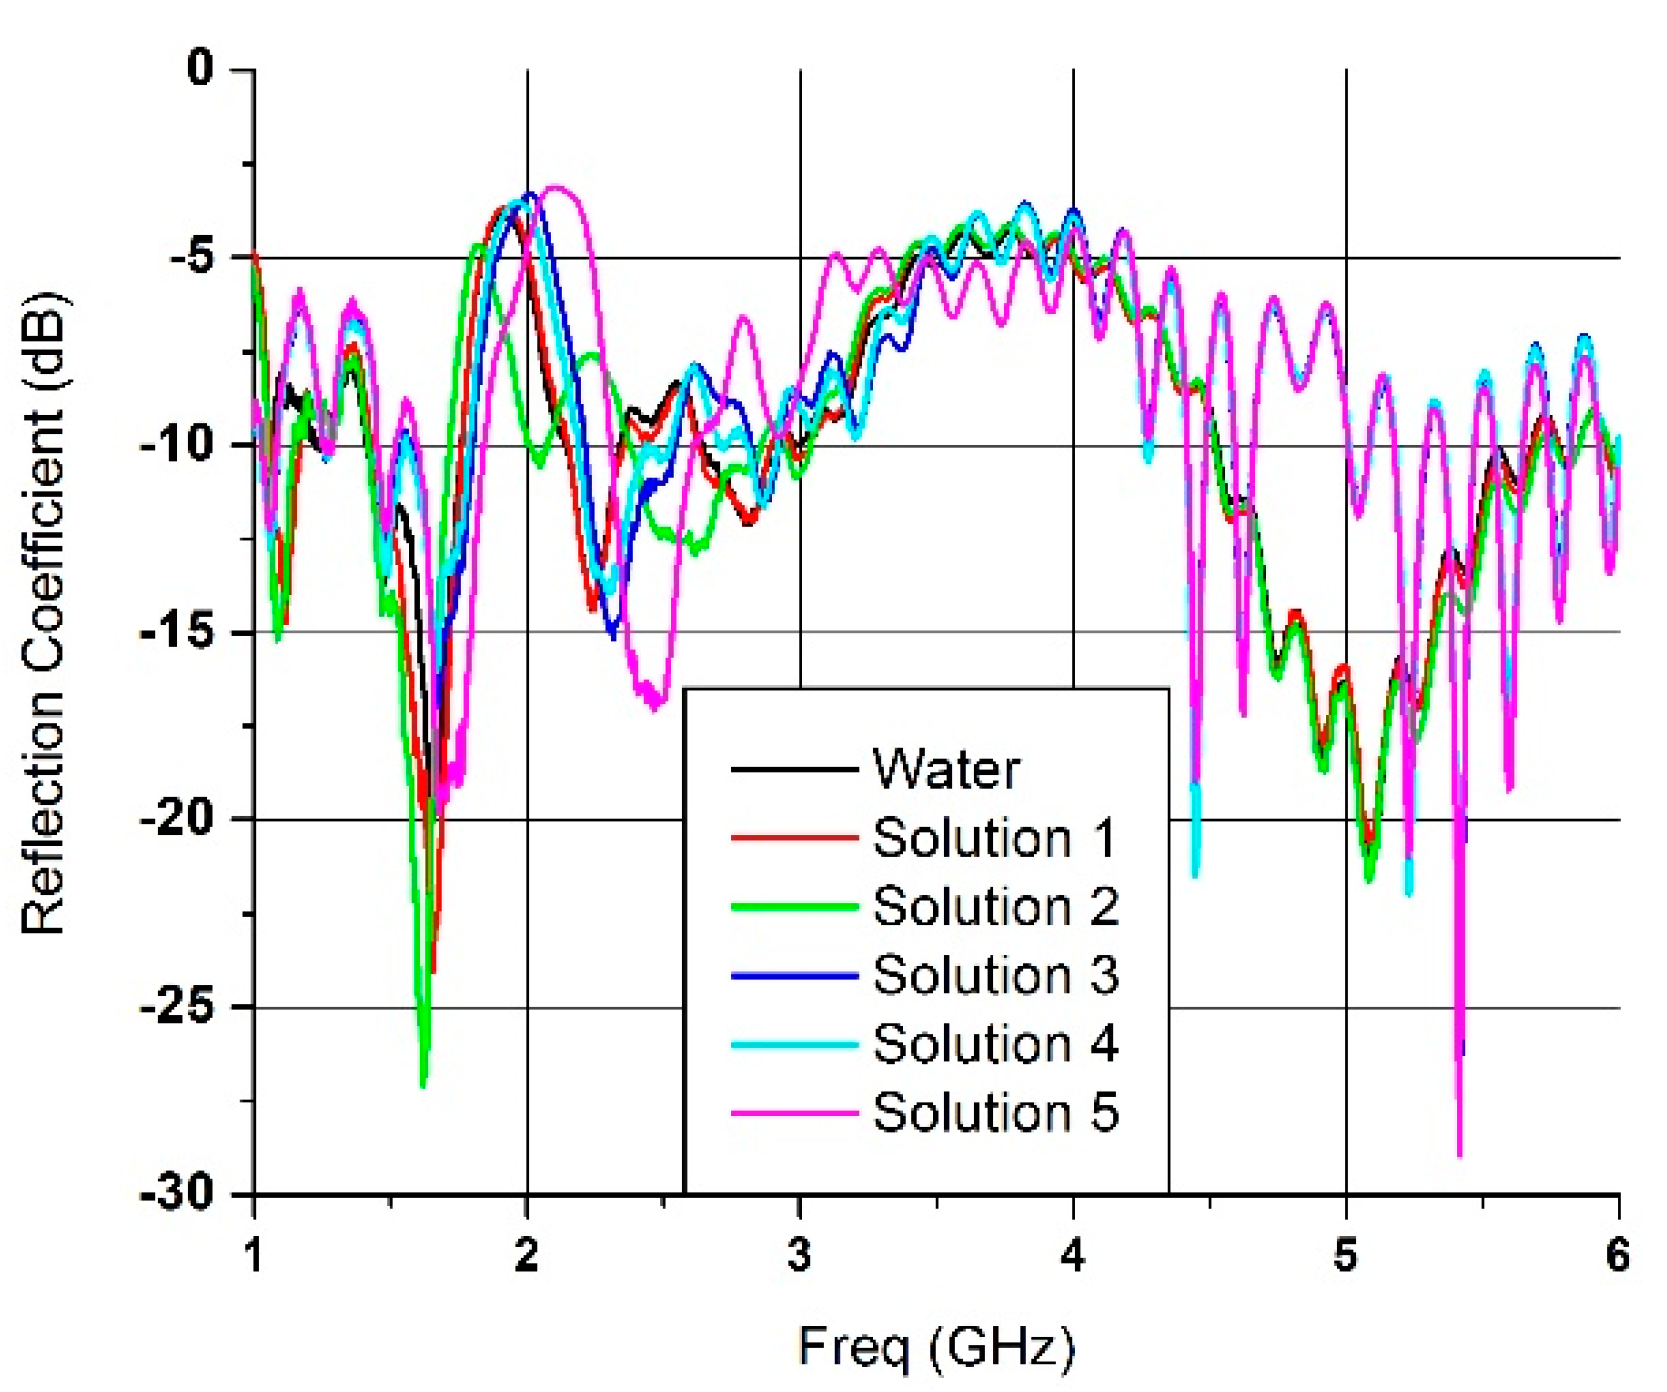
3.2. Sensor Validation

The proposed microwave sensor was realized using an LPKF Protomat E33 [47] prototyping machine. The experimental apparatus and measurements are depicted in Figure 5. Vector network Analyzer (VNA) was calibrated for a single-port network with open, short and 50 Ω load connectors to operate in the frequency range of 1–6 GHz. To start the measurement process, an empty plastic beaker with a certain height was marked and placed on the proposed microwave sensor. The beaker was used in our measurement as it facilitates gathering information about signals passing through the liquid in a reliable and convenient way. In fact, various forms and shapes of beaker can be placed on top of the sensor at any given time during the measurements, which adds flexibility and versatility to the experiment. Moreover, beakers are widely and economically available for performing experiments. The design of the ring was made in an annular shape so that it allows the beaker (or alternatively the thumb for future development of non-invasive blood glucose monitoring) to be in a place with hotspots of electric field intensity. Placement of the beaker in these hotspots enhances the sensor sensitivity to detect complex permittivity variations which is correlated with liquid concentration through measurements of reflection coefficients.
A medical syringe was used to correctly fill the beaker with various liquid samples at the appropriate height of 0.3 cm and room temperature of 25 °C. The liquids under test are the five solutions. Figure 6 shows the sensor-measured responses for the five selected solutions (Solution-1 corresponds to 60 mg/dL, and the rest are the same in order). The sensor resonates at multi-bands covering the frequency range from 1–6 GHz. These resonances are introduced to help producing different responses for different materials over the entire frequency range of interest. It should be noted that the response of empty beaker (air-filled) is not depicted in the sensor’s performance in Figure 2, as the main objective is to show the performance of liquid concentrations with close permittivity values. However, if the readers are interested, they can refer to [26], where the empty beaker effect is minimal and has been experimentally verified.

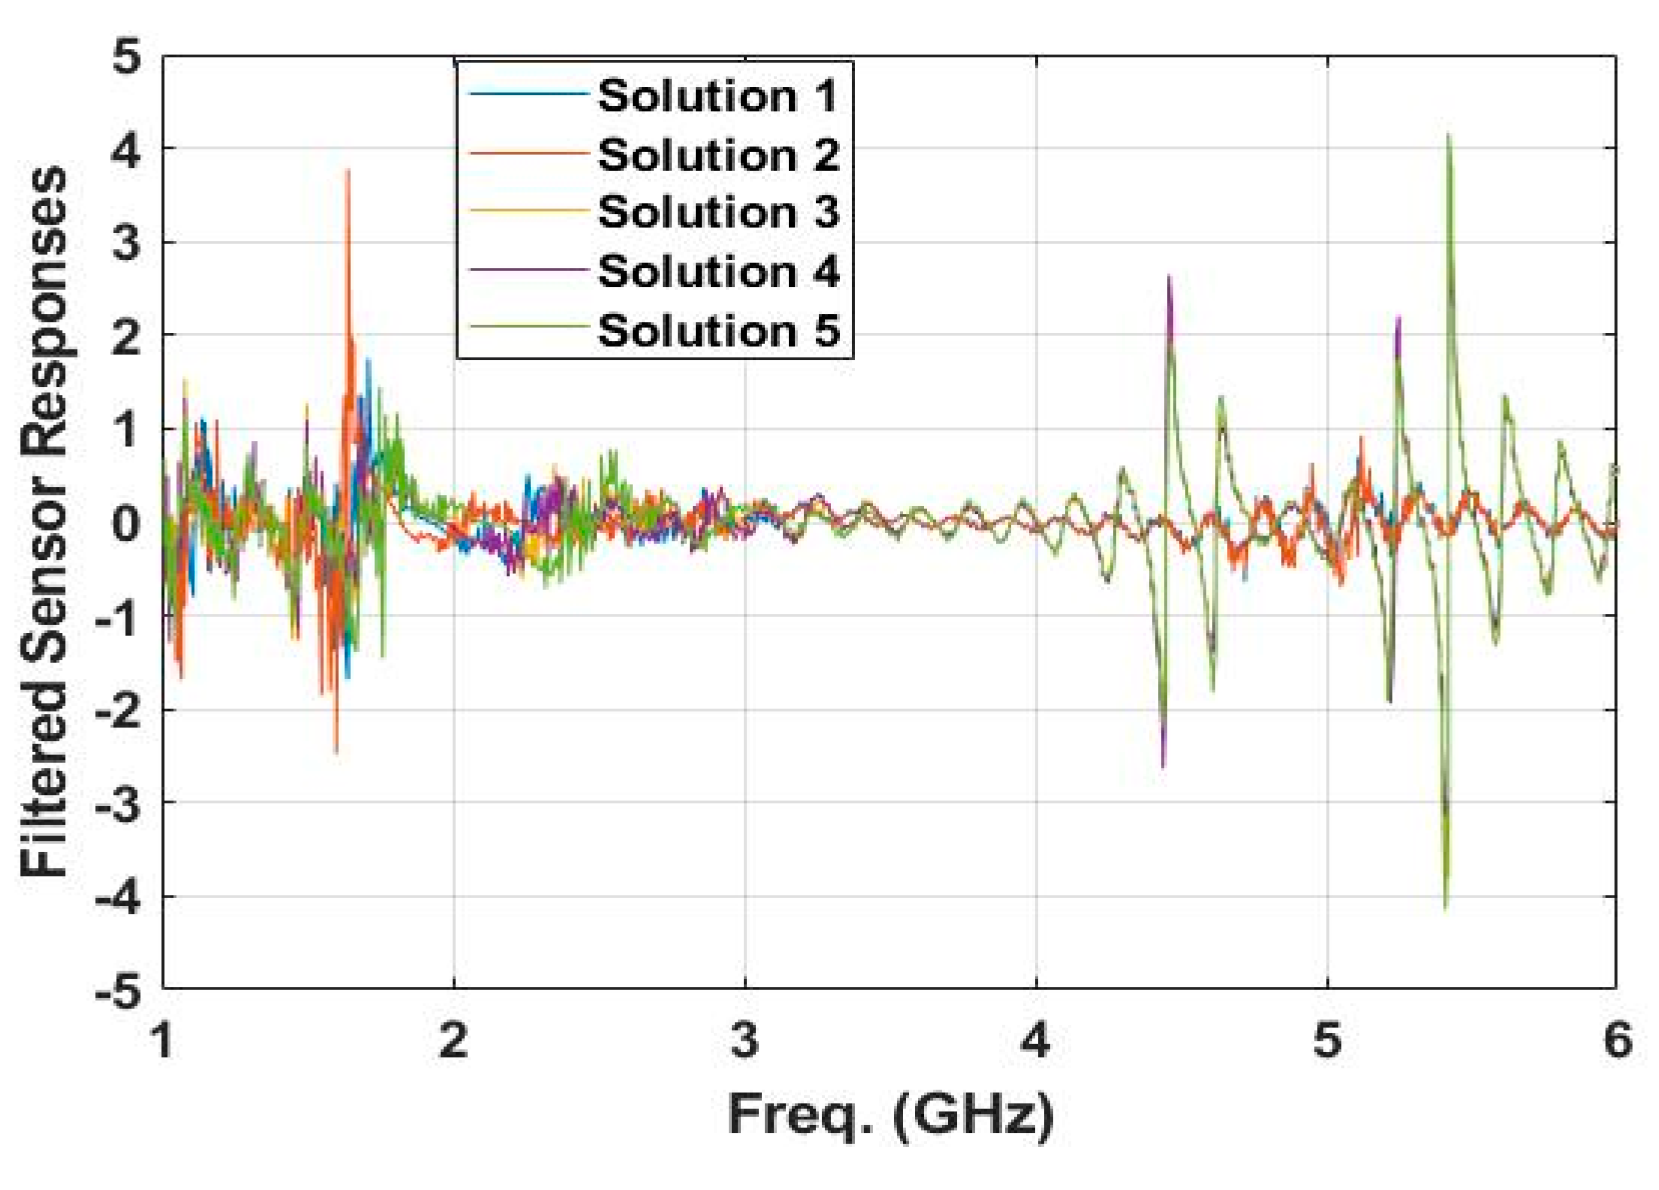
4. Proposed Polarity Correlator for Concentration Determination

The main objective in this paper is not to determine the liquid concentration from the shifts of the sensor’s response at particular frequencies, which is the common approach often followed in the literature. The basic idea here is to exploit the changes in frequency responses of different solutions, over the entire spectrum band (1–6 GHz), to determine their concentration values.
Let r i ( f ) be the sensor’s frequency response corresponding to a liquid of a certain consideration value where I = 1, 2, ..., N. We assume that we have pre-measured the measurements of responses of N solution samples with different concentration values. Therefore, we can consider the determination of a concentration value as a classification problem, where the unknown concentration of a given solution is determined by quantifying the similarity of a sensor’s response of the given solution to the pre-measured sensor responses (over the spectrum band of 1–6 GHz) stored in a library with the corresponding concentration values. Note that the library is created once and is of size N × M where M (=1001) is the number of measured frequency points of reflection coefficients of a given solution.
Signal processing methods, such as frequency analysis and dynamic time warping [48,49], can be investigated for the purpose of measuring the similarity, or equivalently, the correlation between two signals. In this study, we choose to use the pulse fidelity factor due to its effectiveness and lower computational complexity. In fact, this measure has been widely used in the literature to quantify the similarity between wirelessly transmitted and received pulses. For two sensors’ responses, r i ( f ) and r j ( f ) , the pulse fidelity factor, pij, is defined as follows [50]
p i j = m a x f o   r i ( f ) r j ( f f o ) d f | r i ( f ) | 2 d f   | r j ( f f o ) | 2 d f  
Note that the values of pij range from 0 to 1, where higher values mean the two signals under consideration are more correlated (i.e., less distinguishable from each other), and vice versa. For sampled responses, r i ( k Δ f ) and r j ( k Δ f ) , where k denotes the kth sample and Δf is the sampling interval in the frequency range, the pulse fidelity factor can be written as
p i j =   m a x k o k r i ( k Δ f ) r j ( ( k k o ) Δ f ) k | r i ( k Δ f ) | 2 k | r j ( k Δ f ) | 2
For the problem at hand, pij should be as close as possible to 1 when i = j, and as close as possible to 0 when ij.
In Table 3, we compute pij for the sensor’s responses of the five different solutions. It is seen from the table that pij has values greater than 0.9, which makes the distinction between the sensor’s responses in practical settings difficult. In what follows, we propose computing pij after passing the two signals, r i ( k Δ f ) and r j ( k Δ f ) , through a first-order differencing filter whose transfer function is given by
H ( z ) = 1 z 1    
The reason for this pre-processing step is to make the variations in the sensor’s response more pronounced. Figure 7 shows the frequency response of the filter, where it suppresses the DC component, attenuates the low frequencies, and reasonably passes the high frequency components which carry the fine details of the sensor’s responses. Figure 8 shows the outputs of the filter when the sensor’s responses are applied to its input. The figure clearly shows that the filtered responses have more distinguishable features compared to the non-filtered ones. Table 4 assesses this assertion by displaying the values of pij for the responses of the five different solutions. We observe that the values of pij (i = 1, 2) are less than 0.533, but the values of p34, p35 and p45 are quite high at 0.9728, 0.9240 and 0.9010, respectively. This is because the filter is performing a differencing operation, which is equivalent to the differentiation operation applied to continuous-time signals. These types of operations introduce spikes when there is an abrupt change in a sensor’s response. These spikes may bias the computation of fidelity factor.
Figure 9 shows the filtered signals for the measured responses of 3rd, 4th and 5th solutions. These filtered signals not only have spikes of relatively high amplitudes but also overlap after 3.5 GHz. Therefore, it is advisable that the differencing filter is followed by a polarity device to limit the amplitudes of its output to values of ±1, while maintaining the zero-crossing locations of filtered responses. Zero-crossing locations carry valuable information that can be exploited to distinguish between different responses. The system that has a polarity device followed by a pulse fidelity factor computation is often termed a polarity correlator. Table 4 shows the values of pij when the filtered responses are applied to a polarity correlator. It is evident from the table that the usage of a polarity correlator has significantly reduced pij for ij to a value less than 0.85 as compared to value of 0.9728 in Table 5. In our development, the pulse fidelity factor is computed between the sensor’s response of a solution of an unknown concentration and all other pre-measured responses of solutions of known concentrations (stored in a library) using the polarity correlator. This approach has advantages in comparison with the methods based on the computation of exact values of resonance shifts. In particular, uncertainties often present in practical measurements. While these uncertainties greatly influence the determination of exact values of resonance frequencies, the precise value of the fidelity factor is not needed. This is because the concentration of a pre-measured response with the highest fidelity factor (regardless of its precise value) is considered the unknown concentration of the solution under measurement. Moreover, the methods based on resonance shifts rely on a few points in the spectrum (depending on the number of resonance frequencies) to estimate the concentration of an unknown liquid, while our proposed method determines the concentration by exploiting the changes in all points of the sensor’s frequency response over the entire spectrum band (1–6 GHz). Statistically, the utilization of more frequency points in the estimation of concentration will most likely lead to more accurate results. However, the proposed method employs Equations (2) and (3), which add slight computations in comparison with the methods relying on computations to determine the locations of resonances in a given spectrum. In addition, the proposed method requires storing all pre-measured responses of solutions of known concentrations in a library.

5. Conclusions

In this work, a novel microwave sensor based on an annular ring structure with three parallel resonators inside and polarity correlator were proposed to determine the concentration of different liquid samples. The microwave sensor design simulations were carried out using the CST-MWS, an electromagnetic simulator, and the results were confirmed via prototyping and lab measurements. Five in-lab aqueous solutions were prepared, which have very close permittivity values, in the frequency range of 1–6 GHz. Experimental results show that the sensor was capable of producing different responses corresponding to the five solutions. A polarity correlator was then exploited to make use of the sensor’s responses in the determination of the concentration of a given solution. The results generated by the polarity correlator, in terms of the pulse fidelity factor, are very exciting as it can enable measuring the similarity of a sensor’s response of unknown concentration with pre-stored sensor responses with known concentrations.
It is relevant here to mention that the liquid mixtures studied in this work have relaxations in the frequency spectrum at quite distinct frequencies. Therefore, a sensor that would have multiple single bands or be more broadband, such as covering the relaxation of water at 20 GHz at the high end and extending to the kHz/MHz range at the lower frequency end, may give better sensing results. Therefore, this observation can be a guide for future work.

Author Contributions

Conceptualization, W.S., A.I., K.I., A.A. and S.A.; methodology, W.S. and S.A.; software, W.S.; validation, W.S., A.I. and S.A.; formal analysis, K.I., A.A.; investigation, W.S. and K.I.; resources, S.A.; data curation, A.I.; writing—original draft preparation, W.S.; writing—review and editing, W.S. and S.A.; visualization, W.S.; supervision, S.A.; project administration, S.A.; funding acquisition, S.A. All authors have read and agreed to the published version of the manuscript.

Funding

This work was supported by the Researchers Supporting Project number (RSP-2020/46), King Saud University, Riyadh, Saudi Arabia.

Conflicts of Interest

The authors declare no conflict of interest.

References

  1. Ozturk, T. Characterization of Liquids Using Electrical Properties in Microwave and Millimeter Wave Frequency Bands. J. Nondestruct. Eval. 2019, 38, 11. [Google Scholar] [CrossRef]
  2. Schermer, R.T.; Stievater, T.H. Millimeter-Wave Dielectric Properties of Highly Refractive Single Crystals Characterized by Waveguide Cavity Resonance. IEEE Trans. Microw. Theory Tech. 2019, 67, 1078–1087. [Google Scholar] [CrossRef]
  3. Saadat-Safa, M.; Nayyeri, V.; Khanjarian, M.; Soleimani, M.; Ramahi, O.M. A CSRR-Based Sensor for Full Characterization of Magneto-Dielectric Materials. IEEE Trans. Microw. Theory Tech. 2019, 67, 806–814. [Google Scholar] [CrossRef]
  4. Bao, X.; Ocket, I.; Zheng, J.; Bao, J.; Zhang, M.; Kil, D.; Franssens, V.; Puers, B.; Schreurs, D.M.; Nauwelaers, B.K. Yeast Cell Growth Monitoring Using Microwave Measurements Correlated to Optical Absorbance. In Proceedings of the 2018 IEEE/MTT-S International Microwave Symposium—IMS, Philadelphia, PA, USA, 10–15 June 2018; pp. 903–906. [Google Scholar]
  5. Liu, W.; Xu, L.; Yang, X.; Shi, Y.; Zhan, H. Complex permittivity determination based on a radio frequency device. Sensors Actuators A Phys. 2018, 272, 75–82. [Google Scholar] [CrossRef]
  6. Szypłowska, A.; Lewandowski, A.; Jones, S.B.; Sabouroux, P.; Szerement, J.; Kafarski, M.; Wilczek, A.; Skierucha, W. Impact of soil salinity, texture and measurement frequency on the relations between soil moisture and 20 MHz–3 GHz dielectric permittivity spectrum for soils of medium texture. J. Hydrol. 2019, 579, 124155. [Google Scholar] [CrossRef]
  7. Rydosz, A.; Brudnik, A.; Staszek, K. Metal Oxide Thin Films Prepared by Magnetron Sputtering Technology for Volatile Organic Compound Detection in the Microwave Frequency Range. Materials 2019, 12, 877. [Google Scholar] [CrossRef] [Green Version]
  8. Duan, Z.; Zhao, Q.; Wang, S.; Yuan, Z.; Zhang, Y.; Li, X.; Wu, Y.; Jiang, Y.; Tai, H. Novel application of attapulgite on high performance and low-cost humidity sensors. Sens. Actuators B Chem. 2020, 305, 127534. [Google Scholar] [CrossRef]
  9. Goyal, R. S-parameter output from the SPICE program. IEEE Circuits Devices Mag. 1988, 4, 28–29. [Google Scholar] [CrossRef]
  10. Mehrotra, P.; Chatterjee, B.; Sen, S. EM-Wave Biosensors: A Review of RF, Microwave, mm-Wave and Optical Sensing. Sensors 2019, 19, 1013. [Google Scholar] [CrossRef] [Green Version]
  11. Harnsoongnoen, S. Microwave sensors based on coplanar waveguide loaded with split ring resonators: A review. Appl. Sci. Eng. Prog. 2019, 12, 224–234. [Google Scholar] [CrossRef] [Green Version]
  12. Zhang, X.; Yu, M.; Ma, Z.; Ouyang, H.; Zou, Y.; Zhang, S.L.; Niu, H.; Pan, X.; Xu, M.; Li, Z.; et al. Self-Powered Distributed Water Level Sensors Based on Liquid–Solid Triboelectric Nanogenerators for Ship Draft Detecting. Adv. Funct. Mater. 2019, 29, 1900327. [Google Scholar] [CrossRef]
  13. Lee, C.S.; Bai, B.; Song, Q.R.; Wang, Z.Q.; Li, G.F. Open Complementary Split-Ring Resonator Sensor for Dropping-Based Liquid Dielectric Characterization. IEEE Sens. J. 2019, 19, 11880–11890. [Google Scholar] [CrossRef]
  14. Zhai, L.; Liu, R.; Zhang, H.; Jin, N. Complex Admittance Detection of Horizontal Oil-Water Two-Phase Flows Using a Capacitance Sensor. IEEE Sens. J. 2019, 19, 7489–7498. [Google Scholar] [CrossRef]
  15. Kakani, P.N.; Chandu, D.S.; Karthikeyan, S.S. Open Complementary Split Ring Resonator Based RF Sensor with Improved Sensitivity for Detection and Estimation of Adulteration in Edible Oils. In Proceedings of the 2019 TEQIP III Sponsored International Conference on Microwave Integrated Circuits, Photonics and Wireless Networks (IMICPW), Tiruchirappalli, India, 22–24 May 2019; pp. 479–482. [Google Scholar]
  16. Ejaz, T.; Sami, A.; Mughal, M.A.; Rahman, H.U. Volume Fraction Extraction for Binary Mixture of Ethanol and Methanol Using Optimized Microwave Microfluidic Sensor. Prog. Electromagn. Res. M 2019, 87, 43–52. [Google Scholar] [CrossRef] [Green Version]
  17. Khanna, Y.; Awasthi, Y.K. Dual-Band Microwave Sensor for Investigation of Liquid Impurity Concentration Using a Metamaterial Complementary Split-Ring Resonator. J. Electron. Mater. 2020, 49, 385–394. [Google Scholar] [CrossRef]
  18. Iqbal, A.; Smida, A.; Saraereh, O.A.; Alsafasfeh, Q.H.; Mallat, N.K.; Lee, B.M. Cylindrical dielectric resonator antenna-based sensors for liquid chemical detection. Sensors 2019, 19, 1200. [Google Scholar] [CrossRef] [Green Version]
  19. Aloui, R.; Houaneb, Z.; Zairi, H. Substrate Integrated Waveguide Circular Antenna for Terahertz Application. Prog. Electromagn. Res. C 2019, 96, 229–242. [Google Scholar] [CrossRef] [Green Version]
  20. Jankovic, N.; Radonic, V. A microwave microfluidic sensor based on a dual-mode resonator for dual-sensing applications. Sensors 2017, 17, 2713. [Google Scholar] [CrossRef] [Green Version]
  21. Seo, Y.; Memon, M.U.; Lim, S. Microfluidic Eighth-Mode Substrate-Integrated-Waveguide Antenna for Compact Ethanol Chemical Sensor Application. IEEE Trans. Antennas Propag. 2016, 64, 3218–3222. [Google Scholar] [CrossRef]
  22. Gholamian, M.; Shabanpour, J.; Cheldavi, A. Highly sensitive quarter-mode spoof localized plasmonic resonator for dual-detection RF microfluidic chemical sensor. J. Phys. D Appl. Phys. 2020, 53, 145401. [Google Scholar] [CrossRef]
  23. George, J.; Abdelghani, A.; Bahoumina, P.; Tantot, O.; Baillargeat, D.; Frigui, K.; Dejous, C. CNT-Based Inkjet-Printed RF Gas Sensor: Modification of Substrate Properties during the Fabrication Process. Sensors 2019, 19, 1768. [Google Scholar] [CrossRef] [PubMed] [Green Version]
  24. Villena Gonzales, W.; Mobashsher, A.T.; Abbosh, A. The progress of glucose monitoring—A review of invasive to minimally and non-invasive techniques. Devices Sens. 2019, 19, 800. [Google Scholar] [CrossRef] [PubMed] [Green Version]
  25. Kiani, S.; Rezaei, P.; Navaei, M. Dual-sensing and dual-frequency microwave SRR sensor for liquid samples permittivity detection. Measurement 2020, 160, 107805. [Google Scholar] [CrossRef]
  26. Sethi, W.T.; Issa, K.; Ashraf, M.A.; Alshebeili, S. In vitro analysis of a microwave sensor for noninvasive glucose monitoring. Microw Opt. Technol. Lett. 2019, 61, 599–604. [Google Scholar] [CrossRef]
  27. Cappon, G.; Vettoretti, M.; Sparacino, G.; Facchinetti, A. Continuous glucose monitoring sensors for diabetes management: A review of technologies and applications. Diabetes Metab. J. 2019, 43, 383–397. [Google Scholar] [CrossRef]
  28. Ebrahimi, A.; Scott, J.; Ghorbani, K. Microwave reflective biosensor for glucose level detection in aqueous solutions. Sens. Actuators A Phys. 2020, 301, 111662. [Google Scholar] [CrossRef]
  29. Govind, G.; Akhtar, M.J. Metamaterial-Inspired Microwave Microfluidic Sensor for Glucose Monitoring in Aqueous Solutions. IEEE Sens. J. 2019, 19, 11900–11907. [Google Scholar] [CrossRef]
  30. Odabashyan, L.; Babajanyan, A.; Baghdasaryan, Z.; Kim, S.; Kim, J.; Friedman, B.; Lee, J.H.; Lee, K. Real-Time Noninvasive Measurement of Glucose Concentration Using a Modified Hilbert Shaped Microwave Sensor. Sensors 2019, 19, 5525. [Google Scholar] [CrossRef] [Green Version]
  31. Abedeen, Z.; Poonam, A. Microwave sensing technique based label-free and real-time planar glucose analyzer fabricated on FR4. Sens. Actuators A Phys. 2018, 279, 132–139. [Google Scholar] [CrossRef]
  32. Vélez, P.; Muñoz, J.; Mata-Contreras, J.; Dubuc, D.; Grenier, K.; Martin, F. Measuring Glucose Content in Aqueous Solutions by means of Split Ring Resonator (SRR) Loaded Transmission Lines. In Proceedings of the 12th International Congress on Artificial Materials for Novel Wave Phenomena (Metamaterials), Espoo, Finland, 27 August–1 September 2018; pp. 418–420. [Google Scholar] [CrossRef]
  33. Omkar; Yu, W.; Huang, S.Y. T-Shaped Patterned Microstrip Line for Noninvasive Continuous Glucose Sensing. IEEE Microw. Wirel. Compon. Lett. 2018, 28, 942–944. [Google Scholar] [CrossRef]
  34. Harnsoongnoen, S.; Wanthong, A. Coplanar waveguide transmission line loaded with electric-LC resonator for determination of glucose concentration sensing. IEEE Sens. J. 2017, 17, 1635–1640. [Google Scholar] [CrossRef]
  35. Kandoian, A.G. Broad Band Antenna. U.S. Patent No. 2,368,663, 6 February 1945. [Google Scholar]
  36. Agrawall, N.P.; Kumar, G.; Ray, K.P. Wide-band planar monopole antennas. IEEE Trans. Antennas Propag. 1998, 46, 294–295. [Google Scholar] [CrossRef]
  37. Computer Simulation Technology Version 2019. Available online: https://www.3ds.com/products-services/simulia/products/cst-studio-suite/ (accessed on 10 October 2019).
  38. Microwave Network Analyzer N5227A. Available online: https://www.keysight.com/en/pdx-x201878-pn-N5227A/pna-microwave-network-analyzer-67-ghz?cc=PK&lc=eng (accessed on 25 May 2020).
  39. Park, S.J.; Cunningham, J. Determination of Permittivity of Dielectric Analytes in the Terahertz Frequency Range Using Split Ring Resonator Elements Integrated with On-Chip Waveguide. Sensors 2020, 20, 4264. [Google Scholar] [CrossRef] [PubMed]
  40. Rechberger, W.; Hohenau, A.; Leitner, A.; Krenn, J.R.; Lamprecht, B.; Aussenegg, F.R. Optical properties of two interacting gold nanoparticles. Opt. Commun. 2003, 220, 137–141. [Google Scholar] [CrossRef]
  41. Gubbiotti, G.; Malagò, P.; Fin, S.; Tacchi, S.; Giovannini, L.; Bisero, D.; Madami, M.; Carlotti, G.; Ding, J.; Adeyeye, A.O.; et al. Magnetic normal modes of bicomponent permalloy/cobalt structures in the parallel and antiparallel ground state. Phys. Rev. B 2014, 90, 024419. [Google Scholar] [CrossRef]
  42. Sun, Y.; Tong, Y.W.; Xue, C.H.; Ding, Y.Q.; Li, Y.H.; Jiang, H.; Chen, H. Electromagnetic diode based on nonlinear electromagnetically induced transparency in metamaterials. Appl. Phys. Lett. 2013, 103, 091904. [Google Scholar] [CrossRef]
  43. Vashist, S.; Luong, J.H. Non-invasive analytics for point-of-care testing of glucose. In Point-of-Care Glucose Detection for Diabetic Monitoring and Management; CRC Press: Boca Raton, FL, USA, 2017; pp. 59–84. [Google Scholar]
  44. Dielectric Assessment Kit from Speag. Available online: https://www.speag.com/products/dak/dielectric-measurements/ (accessed on 10 July 2020).
  45. Loba Chemie: Laboratory Chemicals, Laboratory Reagents, Dextrose Organic Reagents. 2018. Available online: https://www.lobachemie.com/Carbohydrates-03169/DEXTROSE-ANHYDROUS-CASNO-50-99-7.aspx?search=dextrose (accessed on 11 June 2020).
  46. RCT Basic. IKA. 2018. Available online: https://www.ika.com (accessed on 15 June 2020).
  47. LPKF E33 Prototyping and Etching Machine. Available online: https://www.lpkfusa.com/products/pcb_prototyping/machines/protomat_e33/ (accessed on 25 May 2020).
  48. Boashash, B. Time-Frequency Signal Analysis and Processing: A Comprehensive Reference; Academic: San Francisco, CA, USA, 2015. [Google Scholar]
  49. Koohestani, M.; Moreira, A.A.; Skrivervik, A.K. Fidelity concepts used in UWB systems. In Proceedings of the 2014 IEEE Antennas and Propagation Society International Symposium (APSURSI), Memphis, TN, USA, 6–11 July 2014; pp. 824–825. [Google Scholar]
  50. Hu, S.; Law, C.L.; Dou, W. A balloon-shaped monopole antenna for passive UWB-RFID tag applications. IEEE Antennas Wirel. Propag. Lett. 2008, 7, 366–368. [Google Scholar]
Figure 1. Microwave sensor: (a) Geometric design; (b) realized prototype.
Electronics 09 01616 g001
Figure 2. Simulated and measured responses in terms of reflection coefficients of the proposed microwave sensor.
Electronics 09 01616 g002
Figure 3. Surface currents and electric field distributions of the proposed microwave sensor: (a) 1.6 GHz, (b) 2.8 GHz, (c) 3.7 GHz and (d) 5.3 GHz.
Electronics 09 01616 g003
Figure 4. Lab solution preparations: (a) Prepared samples along-with measuring apparatus. (b) Dielectric constant of five aquous solutions.
Electronics 09 01616 g004
Figure 5. Experimental measurement setup including a plastic beaker containig liquid sample, prepared liquid samples for measurement and a Vector network Analyzer (VNA) to measure the sensor resonance.
Electronics 09 01616 g005
Figure 6. Proposed microwave sensor measurements for five solutions and water.
Electronics 09 01616 g006
Figure 7. Frequency response of the filter.
Electronics 09 01616 g007
Figure 8. Filtered sensor’s responses for the five solutions.
Electronics 09 01616 g008
Figure 9. Measured filtered responses of the 3rd, 4th and 5th solutions’ measured filtered responses.
Electronics 09 01616 g009
Table 1. Comparison with similar state-of-the-art designs detecting liquid concentrations.
ReferenceSensor StructureFrequency Bands (GHz)Concentrations mg/dLNo. of Ports
[28]CSRRSingle (2.5)500, 2000, 4000, 6000, 80001
[29]SRRSingle (4.2)0, 1250, 2083, 3571, 50002
[30]Hilbert shaped resonatorSingle (6)50, 100, 150, 200, 2502
[31]CPW IDTSingle (4)10,000, 20,000, 100,0002
[32]SRR-loaded linesSingle (0.95)250, 500, 1000, 2000, 4000, 60002
[33]Microstrip LineWideband (6–7.8)100–6001
[34]CPW T-Line loaded with LC resonatorWideband (2.5–6 GHz)4000, 8000, 12,000, 16,000, 20,0002
This workAnnular ring resonatorWideband (1–6)60, 100, 160, 180, 2001
Table 2. Geometric parameters of the proposed microwave sensor.
ParameterValue (mm)
Inner Diameter, Di28
Outer Diameter, Do30
Resonator Length, Lc128
Resonator Length, Lc227
Resonators Width, Wc2
Feed Width Lower, Wfl2.38
Feed Width Upper, Wfu1
Feed Length, Lf40
Ground Length, Lg40
Ground Width Upper, Wgu4
Ground Width Lower, Wgl18.8
Gap Lower, gl0.3
Gap Upper, gu1
Substrate Length, Lsub71
Substrate Width, Wsub40
Substrate Height1.6
Table 3. Pulse fidelity factor, ρij, values computed from the sensor’s responses.
Fidelity Factor (pij)i
j 12345
110.98710.93750.94120.9160
20.987110.91910.92330.9056
30.93750.919110.99830.9781
40.94120.92330.998310.9705
50.91600.90560.97810.97051
Table 4. Pulse fidelity factor, ρij, values computed from the filtered sensor’s responses.
Fidelity Factor (pij)i
j 12345
110.53300.23320.22900.2414
20.533010.22510.21320.2429
30.23320.225110.97280.9240
40.22900.21310.972810.9010
50.24140.24290.92400.90101
Table 5. Pulse fidelity factor; ρij, values computed from the sensor’s responses obtained after the polarity correlator.
Fidelity Factor (pij)i
j 12345
110.49830.27220.29130.2925
20.498310.30480.28460.2790
30.27220.304810.84250.7030
40.29130.28460.842510.6715
50.29250.27900.70300.67151

