Article

Brain-Inspired Self-Organization with Cellular Neuromorphic Computing for Multimodal Unsupervised Learning

Université Côte d’Azur, CNRS, LEAT, 06903 Sophia Antipolis, France
*
Author to whom correspondence should be addressed.
Electronics 2020, 9(10), 1605; https://doi.org/10.3390/electronics9101605
Submission received: 2 September 2020 / Revised: 21 September 2020 / Accepted: 25 September 2020 / Published: 1 October 2020
(This article belongs to the Special Issue Bio-Inspired Architectures: From Neuroscience to Embedded AI)

Abstract

:
Cortical plasticity is one of the main features that enable our ability to learn and adapt in our environment. Indeed, the cerebral cortex self-organizes itself through structural and synaptic plasticity mechanisms that are very likely at the basis of an extremely interesting characteristic of the human brain development: the multimodal association. In spite of the diversity of the sensory modalities, like sight, sound and touch, the brain arrives at the same concepts (convergence). Moreover, biological observations show that one modality can activate the internal representation of another modality when both are correlated (divergence). In this work, we propose the Reentrant Self-Organizing Map (ReSOM), a brain-inspired neural system based on the reentry theory using Self-Organizing Maps and Hebbian-like learning. We propose and compare different computational methods for unsupervised learning and inference, then quantify the gain of the ReSOM in a multimodal classification task. The divergence mechanism is used to label one modality based on the other, while the convergence mechanism is used to improve the overall accuracy of the system. We perform our experiments on a constructed written/spoken digits database and a Dynamic Vision Sensor (DVS)/EletroMyoGraphy (EMG) hand gestures database. The proposed model is implemented on a cellular neuromorphic architecture that enables distributed computing with local connectivity. We show the gain of the so-called hardware plasticity induced by the ReSOM, where the system’s topology is not fixed by the user but learned along the system’s experience through self-organization.

1. Introduction

Intelligence is often defined as the ability to adapt to the environment through learning. “A person possesses intelligence insofar as he has learned, or can learn, to adjust himself to his environment”, S. S. Colvin quoted in Reference [1]. The same definition could be applied to machines and artificial systems in general. Hence, a stronger relationship with the environment is a key challenge for future intelligent artificial systems that interact in the real-world environment for diverse applications like object detection and recognition, tracking, navigation, and so forth. The system becomes an “agent” in which the so-called intelligence would emerge from the interaction it has with the environment, as defined in the embodiement hypothesis that is widely adopted in both developmental psychology [2] and developmental robotics [3]. In this work, we tackle the first of the six fundamental principles for the development of embodied intelligence as defined in Reference [2]: the multimodality.
Indeed, biological systems perceive their environment through diverse sensory channels: vision, audition, touch, smell, proprioception, and so forth. The fundamental reason lies in the concept of degeneracy in neural structures [4], which is defined by Edelman as the ability of biological elements that are structurally different to perform the same function or yield the same output [5]. In other words, it means that any single function can be carried out by more than one configuration of neural signals, so that the system still functions with the loss of one component. It also means that sensory systems can educate each other, without an external teacher [2]. The same principles can be applied for artificial systems, as information about the same phenomenon in the environment can be acquired from various types of sensors: cameras, microphones, accelerometers, and so forth. Each sensory-information can be considered as a modality. Due to the rich characteristics of natural phenomena, it is rare that a single modality provides a complete representation of the phenomenon of interest [6].
Multimodal data fusion is thus a direct consequence of the well-accepted paradigm that certain natural processes and phenomena are expressed under completely different physical guises [6]. Recent works show a growing interest toward multimodal association in several applicative areas such as developmental robotics [3], audio-visual signal processing [7,8], spatial perception [9,10], attention-driven selection [11] and tracking [12], memory encoding [13], emotion recognition [14], human-machine interaction [15], remote sensing and earth observation [16], medical diagnosis [17], understanding brain functionality [18], and so forth. Interestingly, the last mentioned application is our starting bloc: how does the brain handle multimodal learning in the natural environment? In fact, it is most likely the emergent result of one of the most impressive abilities of the embodied brain: the cortical plasticity which enables self-organization.
In this work, we propose the Reentrent Self-Organizing Map (ReSOM), a new brain-inspired computational model of self-organization for multimodal unsupervised learning in neuromorphic systems. Section 2 describes the Reentry framework of Edelman [19] and the Convergence Divergence Zone framework of Damasio [20], two different theories in neuroscience for modeling multimodal association in the brain, and then review some of their recent computational models and applications. Section 3 details the proposed ReSOM multimodal learning and inference algorithms, while Section 4 presents an extension of the Iterative Grid (IG) [21] which is applied to distribute the systems’s computation in a cellular neuromorphic architecture for FPGA implementations. Then, Section 5 presents the databases, experiments and results with the different case studies. Finally, Section 6 discusses the results and quantifies the gain of the so-called hardware plasticity through self-organization.

2. Multimodal Learning: State of the Art

2.1. Brain-Inspired Approaches: Reentry and Convergence Divergence Zone (CDZ)

Brain’s plasticity, also known as neuroplasticity, is the key to humans capability to learn and adapt their behaviour. The plastic changes happen in neural pathways as a result of the multimodal sensori-motor interaction in the environment [22]. In other words, the cortical plasticity enables the self-organization in the brain, that in turn enables the emergence of consistent representations of the world [23]. But since most of the stimuli are processed by the brain in more than one sensory modality [24], how do the multimodal information converge in the brain? Indeed, we can recognize a dog by seeing its picture, hearing its bark or rubbing its fur. These features are different patterns of energy at our sensory organs (eyes, ears and skin) that are represented in specialized regions of the brain. However, we arrive at the same concept of the “dog” regardless of which sensory modality was used [25]. Furthermore, modalities can diverge and activate one another when they are correlated. Recent studies have demonstrated cross-modal activation amongst various sensory modalities, like reading words with auditory and olfactory meanings that evokes activity in auditory and olfactory cortices [26,27], or trying to discriminate the orientation of a tactile grid pattern with eyes closed that induces activity in the visual cortex [28]. Both mechanisms rely on the cerebral cortex as a substrate. But even though recent works have tried to study the human brain’s ability to integrate inputs from multiple modalities [29,30], it is not clear how the different cortical areas connect and communicate with each other.
To answer this question, Edelman proposed in 1982 the Reentry [19,31]: the ongoing bidirectional exchange of signals linking two or more brain areas, one of the most important integrative mechanisms in vertebrate brains [19]. In a recent review [32], Edelman defines reentry as a process which involves a localized population of excitatory neurons that simultaneously stimulates and is stimulated by another population, as shown in Figure 1. It has been shown that reentrant neuronal circuits self-organize early during the embryonic development of vertebrate brains [33,34], and can give rise to patterns of activity with Winner-Takes-All (WTA) properties [35,36]. When combined with appropriate mechanisms for synaptic plasticity, the mutual exchange of signals amongst neural networks in distributed cortical areas results in the spatio-temporal integration of patterns of neural network activity. It allows the brain to categorize sensory inputs, remember and manipulate mental constructs, and generate motor commands [32]. Thus, reentry would be the key to multimodal integration in the brain.
Damasio proposed another answer in 1989 with the Convergence Divergence Zone (CDZ) [20,37], another biologically plausible framework for multimodal association. In a nutshell, the CDZ theory states that particular cortical areas act as sets of pointers to other areas, with a hierarchical construction: the CDZ merges low level cortical areas with high level amodal constructs, which connects multiple cortical networks to each other and therefore solves the problem of multimodal integration. The CDZ convergence process integrates unimodal information into multimodal areas, while the CDZ divergence process propagates the multimodal information to the unimodal areas, as shown in Figure 1. For example, when someone talks to us in person, we simultaneously hear the speaker’s voice and see the speaker’s lips move. As the visual movement and the sound co-occur, the CDZ would associate (convergence) the respective neural representations of the two events in early visual and auditory cortices into a higher cortical map. Then, when we only watch a specific lip movement without any sound, the activity pattern induced in the early visual cortices would trigger the CDZ and the CDZ would retro-activate (divergence) in early auditory cortices the representation of the sound that usually accompanied the lip movement [24].
The bidirectionality of the connections is therefore a fundamental characteristic of both reentry and CDZ frameworks, that are likewise in many aspects. Indeed, we find computational models of both paradigms in the literature. We review the most significant ones to our work in Section 2.2.

2.2. Models and Applications

In this section, we review the recent works that explore brain-inspired multimodal learning for two main applications: sensori-motor mapping and multi-sensory classification.

2.2.1. Sensori-Motor Mapping

Lallee and Dominey [38] proposed the MultiModal Convergence Map (MMCM) that applies the Self-Organizing Map (SOM) [39] to model the CDZ framework. The MMCM was applied to encode the sensori-motor experience of a robot based on the language, vision and motor modalities. This “knowledge” was used in return to control the robot behaviour, and increase its performance in the recognition of its hand in different postures. A quite similar approach is followed Escobar-Juarez et al. [22] who proposed the Self-Organized Internal Models Architecture (SOIMA) that models the CDZ framework based on internal models [40]. The necessary property of bidirectionality is pointed out by the authors. SOIMA relies on two main learning mechanisms: the first one consists in SOMs that create clusters of unimodal information coming from the environment, and the second one codes the internal models by means of connections between the first maps using Hebbian learning [41] that generates sensory–motor patterns. A different approach is used by Droniou et al. [3] where the authors proposed a CDZ model based on Deep Neural Neteworks (DNNs), which is used in a robotic platform to learn a task from proprioception, vision and audition. Following the reentry paradigm, Zahra et al. [42] proposed the Varying Density SOM (VDSOM) for characterizing sensorimotor relations in robotic systems with direct bidirectional connections. The proposed method relies on SOMs and associative properties through Oja’s learning [43] that enables it to autonomously obtain sensori-motor relations without prior knowledge of either the motor (e.g., mechanical structure) or perceptual (e.g., sensor calibration) models.

2.2.2. Multi-Sensory Classification

Parisi et al. [44] proposed a hierarchical architecture with Growing When Required (GWR) networks [45] for learning human actions from audiovisual inputs. The neural architecture consists of a self-organizing hierarchy with four layers of GWR for the unsupervised processing of visual action features. The fourth layer of the network implements a semi-supervised algorithm where action–word mappings are developed via the direct bidirectional connections, following the reentry paradigm. With the same paradigm, Jayaratne et al. [46] proposed a multisensory neural architecture of multiple layers of Growing SOMs (GSOM) [47] and inter-sensory associative connections representing the co-occurrence probabilities of the modalities. The system’s principle is to supplement the information on a single modality with the corresponding information on other modalities for a better classification accuracy. Using spike coding, Rathi and Roy [48] proposed an STDP-based multimodal unsupervised learning for Spiking Neural Networks (SNNs), where the goal is to learn the cross-modal connections between areas of single modality in SNNs to improve the classification accuracy and make the system robust to noisy inputs. Each modality is represented by a specific SNN trained with its own data following the learning framework proposed in Reference [49], and cross-modal connections between the two SNNs are trained along with the unimodal connections. The proposed method was experimented with a written/spoken digits classification task, and the collaborative learning results in an accuracy improvement of 2 % . The work of Rathi and Roy [48] is the closest to our work, we threfore confront it in Section 5.4.1. Finally, Cholet et al. [50] proposed a modular architecture for multimodal fusion using Bidirectional Associative Memories (BAMs). First, unimodal data are processed by as many independent Incremental Neural Networks (INNs) [51] as the number of modalities, then multiple BAMs learn pairs of unimodal prototypes. Finally, a INN performs supervised classification.

2.2.3. Summary

Overall, the reentry and CDZ frameworks share two key aspects: the multimodal associative learning based on the temporal co-occurrence of the modalities, and the bidirectionality of the associative connections. We summarize the most relevant papers to our work in Table 1, where we classify each paper with respect to the application, the brain-inspired paradigm, the learning type and the computing nature. We notice that sensori-mapping is based on unsupervised learning, which is natural as no label is necessary to map two modalities together. However, classification is based on either supervised or semi-supervised learning, as mapping multi-sensory modalities is not sufficient: we need to know the corresponding class to each activation pattern. We proposed in Reference [52] a labeling method summarized in Section 3.1.2 based on very few labeled data, so that we do not use any label in the learning process as explained in Section 3.1. The same approach is used in Reference [48], but the authors rely on the complete labeled dataset, as further discussed in Section 5.4.1. Finally, all previous works rely on the centralized Von Neumann computing paradigm, except Reference [46], which attempts a partially distributed computing with respect to data, that is, using the MapReduce computing paradigm to speed up computation. It is based on Apache Spark [53], mainly used for cloud computing. Also, STDP learning in Reference [48] is distributed, but the inference for classification requires a central unit, as discussed in Section 5.4.1. We propose a completely distributed computing on the edge with respect to the system, that is, the neurons computing itself to improve the SOMs scalability for hardware implementation as presented in Section 4.
Consequently, we chose to follow the reentry paradigm where multimodal processing is distributed in all cortical maps without dedicated associative maps for two reasons. First, from the brain-inspired computing perspective, more biological evidences tend to confirm the hypothesis of reentry as reviewed by References [54,55,56]. Indeed, biological observations highlight a multimodal processing in the whole cortex including sensory areas [57], which contain multimodal neurons that are activated by multimodal stimuli [54,58]. Moreover, it has been shown that there are direct connections between sensory cortices [59,60], and neural activities in one sensory area may be influenced by stimuli from other modalities [55,61]. Second, from a pragmatical and functional perspective, the reentry paradigm fits better to the cellular architecture detailed in Section 4, and thus increases the scalability and fault tolerance thanks to the completely distributed processing [56]. Nevertheless, we keep the convergence and divergence terminology to distinguish between, respectively, the integration of two modalities and the activation of one modality based on the other.

3. Proposed Model: Reentrant Self-Organizing Map (ReSOM)

In this section, we summarise our previous work on SOM post-labeled unsupervised learning [52], then propose the Reentrant Self-Organizing Map (ReSOM) shown in Figure 2 for learning multimodal associations, labeling one modality based on the other and converge the two modalities with cooperation and competition for a better classification accuracy. We use SOMs and Hebbian-like learning sequentially to perform multimodal learning: first, unimodal representations are obtained with SOMs and, second, multimodal representations develop through the association of unimodal maps via bidirectional synapses. Indeed, the development of associations between co-occurring stimuli for multimodal binding has been strongly supported by neurophysiological evidence [62], and follow the reentry paradigm [32].

3.1. Unimodal Post-Labeled Unsupervised Learning with Self-Organizing Maps (SOMs)

With the increasing amount of unlabeled data gathered everyday through Internet of Things (IoT) devices and the difficult task of labeling each sample, DNNs are slowly reaching the limits of supervised learning [3,63]. Hence, unsupervised learning is becoming one of the most important and challenging topics in Machine Learning (ML) and AI. The Self-Organizing Map (SOM) proposed by Kohonen [39] is one of the most popular Artificial Neural Networks (ANNs) in the unsupervised learning category [64], inspired from the cortical synaptic plasticity and used in a large range of applications [65] going from high-dimensional data analysis to more recent developments such as identification of social media trends [66], incremental change detection [67] and energy consumption minimization on sensor networks [68]. We introduced in Reference [52] the problem of post-labeled unsupervised learning: no label is available during SOM training then very few labels are available for assigning each neuron the class it represents. The latter is called the labeling phase, which is to distinguish from the fine-tuning process in semi-supervised learning where a labeled subset is used to re-adjust the synaptic weights.

3.1.1. SOM Learning

The original Kohonen SOM algorithm [39] is described in Algorithm 1. It is to note that t f is the number of epochs, that is, the number of times the whole training dataset is presented. The α hyper-parameter value in Equation (1) is not important for the SOM training, since it does not change the neuron with the maximum activity. It can be set to 1 in Algorithm 1. All unimodal trainings were performed over 10 epochs with the same hyper-parameters as in our previous work [52]: ϵ i = 1.0 , ϵ f = 0.01 , σ i = 5.0 and σ f = 0.01 .
Algorithm 1: SOM unimodal learning
1:
Initialize the network as a two-dimensional array of k neurons, where each neuron n with m inputs is defined by a two-dimensional position p n and a randomly initialized m-dimensional weight vector w n .
2:
fort from 0 to t f do
3:
for every input vector v do
4:
  for every neuron n in the SOM network do
5:
   Compute the afferent activity a n :
a n = e v w n α
6:
  end for
7:
  Compute the winner s such that:
a s = max n = 0 k 1 a n
8:
  for every neuron n in the SOM network do
9:
   Compute the neighborhood function h σ ( t , n , s ) with respect to the neuron’s position p:
h σ ( t , n , s ) = e p n p s 2 2 σ ( t ) 2
10:
   Update the weight w n of the neuron n:
w n = w n + ϵ ( t ) × h σ ( t , n , s ) × ( v w n )
11:
  end for
12:
end for
13:
Update the learning rate ϵ ( t ) :
ϵ ( t ) = ϵ i ϵ f ϵ i t / t f
14:
Update the width of the neighborhood σ ( t ) :
σ ( t ) = σ i σ f σ i t / t f
15:
end for

3.1.2. SOM Labeling

The labeling is the step between training and test where we assign each neuron the class it represents in the training dataset. We proposed in Reference [52] a labeling algorithm based on few labeled samples. We randomly took a labeled subset of the training dataset, and we tried to minimize its size while keeping the best classification accuracy. Our study showed that we only need 1 % of randomly taken labeled samples from the training dataset for MNIST [69] classification.
The labeling algorithm detailed in Reference [52] can be summarized in five steps. First, we calculate the neurons activations based on the labeled input samples from the euclidean distance following Equation (1), where v is the input vector, w n and a n are respectively the weights vector and the activity of the neuron n. The parameter α is the width of the Gaussian kernel that becomes a hyper-parameter for the method, as further discussed in Section 5. Second, the Best Matching Unit (BMU), that is, the neuron with the maximum activity is elected. Third, each neuron accumulates its normalized activation (simple division) with respect to the BMU activity in the corresponding class accumulator, and the three steps are repeated for every sample of the labeling subset. Fourth, each class accumulator is normalized over the number of samples per class. Fifth and finally, the label of each neuron is chosen according to the class accumulator that has the maximum activity.

3.2. ReSOM Multimodal Association: Sprouting, Hebbian-Like Learning and Pruning

Brain’s plasticity can be divided into two distinct forms of plasticity: the (1) structural plasticity that changes the neurons connectivity by sprouting (creating) or pruning (deleting) synaptic connections, and (2) the synaptic plasticity that modifies (increasing or decreasing) the existing synapses strength [70]. We explore both mechanisms for multimodal association through Hebbian-like learning. The original Hebbian learning principle [41] proposed by Hebb in 1949 states that “when an axon of cell A is near enough to excite a cell B and repeatedly or persistently takes part in firing it, some growth process or metabolic change takes place in one or both cells such that A’s efficiency, as one of the cells firing B, is increased.” In other words, any two neurons that are repeatedly active at the same time will tend to become “associated” so that activity in one facilitates activity in the other. The learning rule is expressed by Equation (7).
However, Hebb’s rule is limited in terms of stability for online learning, as synaptic weights tend to infinity with a positive learning rate. This could be resolved by normalizing each weight over the sum of all the corresponding neuron weights, which guarantees the sum of each neuron weights to be equal to 1. The effects of weights normalization are explained in Reference [71]. However, this solution breaks up with the locality of the synaptic learning rule, and that is not biologically plausible. In 1982, Oja proposed a Hebbian-like rule [43] that adds a “forgetting” parameter, and solves the stability problem with a form of local multiplicative normalization for the neurons weights, as expressed in Equation (8). In addition, Oja’s learning performs an on-line Principal Component Analysis (PCA) of the data in the neural network [72], which is a very interesting property in the context of unsupervised learning.
Nevertheless, Hebb’s and Oja’s rules were both used in recent works with good results, respectively in References [22,42]. Hence, we applied and compared both rules. The proposed ReSOM multimodal association model is detailed in Algorithm 2, where η is a learning rate that we fix to 1 in our experiments, and γ is deduced according to the number or the percentage of synapses to prune, as discussed in Section 5. The neurons activities computing in the line 3 of Algorithm 2 are calculated following Equation (1).
Algorithm 2: ReSOM multimodal association learning
1:
Learn neurons afferent weights for S O M x and S O M y corresponding to modalities x and y respectively.
2:
for every multimodal input vectors v x and v y do
3:
Compute the S O M x and S O M y neurons activities.
4:
Compute the unimodal BMUs n x and n y with activities a x and a y respectively.
5:
if Lateral connection w x y between n x and n y does not exist then
6:
  Sprout (create) the connection w x y = 0 .
7:
end if
8:
Update lateral connection w x y :
9:
if Hebb’s learning then
10:
w x y = w x y + η × a x × a y
11:
else if Oja’s learning then
12:
w x y = w x y + η × ( a x × a y w x y × a y 2 )
13:
end if
14:
end for
15:
for every neuron x in the S O M x network do
16:
Sort the lateral synapses w x y and deduce the pruning threshold γ .
17:
for every lateral synapse w x y do
18:
  if   w x y < γ then
19:
   Prune (delete) the connection w x y .
20:
  end if
21:
end for
22:
end for

3.3. ReSOM Divergence for Labeling

As explained in Section 3.1.2, neurons labeling is based on a labeled subset from the training database. We tried in Reference [52] to minimize its size, and used the fewest labeled samples while keeping the best accuracy. We will see in Section 5 that depending on the database, we sometimes need a considerable number of labeled samples, up to 10 % of the training set. In this work, we propose an original method based on the divergence mechanism of the multimodal association: for two modalities x and y, since we can activate one modality based on the other, we propose to label the S O M y neurons from the activity and the labels induced from the S O M x neurons, which are based on the labeling subset of modality x. Therefore, we only need one labeled subset of a single modality which needs the fewest labels to label both modalities, taking profit of the bidirectional aspect of reentry. A good analogy to biological observations would be the retro-activation of the auditory cortical areas from the visual cortex, if we take the example of written/spoken digits presented in Section 5. It is similar to how infants respond to sound symbolism by associating shapes with sounds [73]. The proposed ReSOM divergence method for labeling is detailed in Algorithm 3.
Algorithm 3: ReSOM divergence for labeling
1:
Initialize c l a s s a c t as a two-dimentionnal array of accumulators: the first dimension is the neurons and the second dimension is the classes.
2:
for every input vector v x of the x-modality labeling set with label l do
3:
for every neuron x in the S O M x network do
4:
  Compute the afferent activity a x :
a x = e v x w x α
5:
end for
6:
for every neuron y in the S O M y network do
7:
  Compute the divergent activity a y from the S O M x :
a y = max x = 0 n 1 w x y × a x
8:
  Add the normalized activity with respect to the max activity to the corresponding accumulator:
c l a s s a c t [ y ] [ l ] + = a y
9:
end for
10:
end for
11:
Normalize the accumulators c l a s s a c t with respect to the number of samples per class.
12:
for every neuron y in the S O M y network do
13:
 Assign the neuron label n e u r o n l a b :
n e u r o n l a b = a r g m a x ( c l a s s a c t [ y ] )
14:
end for

3.4. ReSOM Convergence for Classification

Once the multimodal learning is done and all neurons from both SOMs are labeled, we need to converge the information of the two modalities to achieve a better representation of the multi-sensory input. Since we use the reentry paradigm, there is no hierarchy in the processing, and the neurons computing is completely distributed based on the Iterative Grid detailed in Section 4. We propose an original cellular convergence method in the ReSOM, as detailed in Algorithm 4. We can summarize it in three main steps:
  • First, there is an independent activity computation (Equation (13)): each neuron of the two SOMs computes its activity based on the afferent activity from the input.
  • Second, there is a cooperation amongst neurons from different modalities (Equations (14) and (15)): each neuron updates its afferent activity via a multiplication with the lateral activity from the neurons of the other modality.
  • Third and finally, there is a global competition amongst all neurons (line 19 in Algorithm 4): they all compete to elect a winner, that is, a global BMU with respect to the two SOMs.
We explore different variants of the proposed convergence method regarding two aspects. First, both afferent and lateral activities can be taken as raw values or normalized values. We used min-max normalization that is therefore done with respect to the BMU and the Worst Matching Unit (WMU) activities. These activities are found in a completely distributed fashion as explained in Section 4.2. Second, the afferent activities update could be done for all neurons or only the two BMUs. In the second case, the global BMU cannot be another neuron but one of the two local BMUs, and if there is a normalization then it is only done for lateral activities (otherwise, the BMUs activities would be 1, and the lateral map activity would be the only relevant one). The results of our comparative study are presented and discussed in Section 5.
Algorithm 4: ReSOM convergence for classification
1:
for every multimodal input vectors v x and v y do
2:
Do in parallel every following step inter-changing modality x with modality y and vice-versa:
3:
Compute the afferent activities a x and a y :
4:
for every neuron x in the S O M x network do
5:
  Compute the afferent activity a x :
a x = e v x w x β
6:
end for
7:
Normalize (min-max) the afferent activities a x and a y .
8:
Update the afferent activities a x and a y with the lateral activities based on the associative synapses weights w x y :
9:
if Update with m a x u p d a t e then
10:
  for every neuron x in the S O M x network connected to n neurons from the S O M y network do
11:
a x = a x × max x = 0 n 1 w x y × a y
12:
  end for
13:
else if Update with s u m u p d a t e then
14:
 
15:
  for every neuron x in the S O M x network connected to n neurons from the S O M y network do
16:
a x = a x × x = 0 n 1 w x y × a y n
17:
  end for
18:
end if
19:
Compute the global BMU with the maximum activity between the S O M x and the S O M y .
20:
end for

4. Cellular Neuromorphic Architecture

The centralized neural models that run on classical computers suffer from the Von-Neumann bottleneck due to the overload of communications between computing memory components, leading to a an over-consumption of time and energy. One attempt to overcome this limitation is to distribute the computing amongst neurons as done in Reference [49], but it implies an all-to-all connectivity to calculate the global information, for example, the BMU. Therefore, this solution does not completely solve the initial problem of scalability.
An alternative approach to solve the scalability problem can be derived from the Cellular Automata (CA) which was originally proposed by John von Neumann [74] then formally defined by Stephen Wolfram [75]. The CA paradigm relies on locally connected cells with local computing rules which define the new state of a cell depending on its own state and the states of its neighbors. All cells can then compute in parallel as no global information is needed. Therefore, the model is massively parallel and is an ideal candidate for hardware implementations [76]. A recent FPGA implementation to simulate CA in real time has been proposed in Reference [77], where authors show a speed-up of 51 × compared to a high-end CPU (Intel Core i7-7700HQ) and a comparable performance with recent GPUs with a gain of 10 × in power consumption. With a low development cost, low cost of migration to future devices and a good performance, FPGAs are suited to the design of cellular processors [78]. Cellular architectures for ANNs were common in early neuromorphic implementations and have recently seen a resurgence [79]. Such implementation is also refered as near-memory computing where one embeds dedicated coprocessors in close proximity to the memory unit, thus getting closer to the Parallel and Distributed Processing (PDP) paradigm [80] formalized in the theory of ANNs.
An FPGA distributed implementation model for SOMs was proposed in Reference [81], where the local computation and the information exchange among neighboring neurons enable a global self-organization of the entire network. Similarly, we proposed in Reference [21] a cellular formulation of the related neural models which would be able to tackle the full connectivity limitation by iterating the propagation of the information in the network. This particular cellular implementation, named the Iterative Grid (IG), reaches the same behavior as the centralized models but drastically reduces their computing complexity when deployed on hardware. Indeed, we have shown in Reference [21] that the time complexity of the IG is O ( n ) with respect to the number of neurons n in a squared map, while the time complexity of a centralized implementation is O ( n ) . In addition, the connectivity complexity of the IG is O ( n ) with respect to the number of of neurons n, while the connectivity complexity of a distributed implementation with all-to-all connectivity [49] is O ( n 2 ) . The principles of the IG are summarized in this section followed by a new SOM implementation over the IG substrata which takes in account the needs of the multimodal association learning and inference.

4.1. The Iterative Grid (IG) Substrata

Let’s consider a 2-dimensional grid shaped Network-on-Chip (NoC). This means that each node (neuron) of the network is physically connected (only) to its four closest neighbors. At each clock edge, each node reads the data provided by its neighbors and relays it to its own neighbors on the next one. The data is propagated (or broadcasted) in a certain amount of time to all the nodes. The maximum amount of time T p which is needed to cover all the NoC (worst case reference) depends on its size: for a N × M grid, T p = N + M 2 . After T p clock edges, new data can be sent. A set of T p iterations can be seen as a wave of propagation.
For the SOM afferent weights learning, the data to be propagated is the maximum activity for the BMU election, plus its distance with respect to every neuron in the map. The maximum activity is transmitted through the wave of propagation, and the distance to the BMU is computed in the same wave thanks to this finding: “When a data is iteratively propagated through a grid network, the propagation time is equivalent to the Manhattan distance between the source and each receiver” [21].

4.2. Iterative Grid for SOM Model

The SOM implementation on the IG proposed in Reference [21] has to be adapted to fit the needs of the multimodal association: (1) we add the WMU activity needed for the activities min-max normalization in the convergence step, and (2) we use the Gaussian kernel in Equation (1) to transform the euclidean distances into activities. Therefore, the BMU is the neuron with the maximum activity and the WMU the neuron with the minimum one. The BMU/WMU search wave called the “winner wave” is described as a flowchart in Figure 3a. When the BMU/WMU are elected, the next step is the learning wave. From the winner propagation wave, every useful data is present in each neuron to compute the learning equation. No propagation wave is necessary at this step.

4.3. Hardware Support for the Iterative Grid

The multi-FPGA implementation of the IG is a work in progress based on our previously implemented Neural Processing Unit (NPU) [82,83]. As shown in Figure 3b, the NPU is made of two main parts: the computation core and the communication engine. The computation core is a lightweight Harvard-like accumulator-based micro-processor where a central dual-port RAM memory stores the instructions and the data, both separately accessible from its two ports. A Finite State Machine (FSM) controls the two independent ports of the memory and the Arithmetic and Logic Unit (ALU), which implements the needed operations to perform the equations presented in Section 4.2. The aim of the communication engine is to bring the input stimuli vector and the neighbors activities to the computation core at each iteration. The values of the input vector flow across the NPUs through their x i n and x o u t ports which are connected as a broadcast tree. The output activity ports of each NPU are connected to the four cardinal neighbors through a dedicated hard-wired channel.
Implemented on an Altera Stratix V GXEA7 FPGA, the resources (LUT, Registers, DSP and memory blocks) consumption is indeed scalable as it increases linearly as a function of the size of the NPU network [82,83]. We are currently working on configuring the new model in the NPU and implementing it on a more recent and adapted FPGA device, particularly for the communication part between multiple FPGA boards that will be based on SCALP [84].
The cellular approach for implementing SOM models proposed by Sousa et al. [81] is an FPGA implementation that shares the same approach as the IG with distributed cellular computing and local connectivity. However, the IG has two main advantages over the cellular model in Reference [81]:
  • Waves complexity: The “smallest of 5” and “neighborhood” waves in Reference [81] have been coupled into one wave called the “winner wave”, as the iterative grid is based on time to distance transformation to find the Manhattan distance between the BMU and each neuron. We have therefore a gain of about 2 × in the time complexity of the SOM training.
  • Sequential vs. combinatory architecture: The processes of calculating the neuron distances to the input vector, searching for the BMU and updating the weight vectors are performed in a single clock cycle. This assumption goes against the iterative computing paradigm in the SOM grid to propagate the neurons information. Hence, the hardware implementation in Reference [81] is almost fully combinatory. It explains why the maximum operating frequency is low and decreases when increasing the number of neurons, thus being not scalable in terms of both hardware resources and latency.

4.4. Hardware Support for Multimodal Association

For the multimodal association learning in Algorithm 2, the local BMU in each of the two SOMs needs both the activity and the position of the local BMU of the other SOM to perform the Hebbian-like learning in the corresponding lateral synapse. This communication problem has not been experimented in this work. However, this suppose a simple communication mechanism between the two maps that would be implemented in two FPGAs where only the BMUs of each map send a message to each other in a bidirectional way. The message could go through the routers of the IG thanks to an XY-protocol to reach an inter-map communication port in order to avoid the multiplication of communication wires.
For the divergence and convergence methods in Algorithms 3 and 4 respectively, the local BMU in each of the two SOMs needs the activity of all the connected neurons from the other SOM after pruning, that is, around 20 connections per neuron. Because the number of remaining synapses is statistically bounded to 20 % , the number of communication remains low in front of the number of neurons. Here again, we did not experiment on this communication mechanism but the same communication support could be used. Each BMU can send a request that contains a list of connected neurons. This request can be transmitted to the other map through the IG routers to an inter-map communication channel. Once on the other map, the message could be broadcasted to each neuron using again the routers of the IG. Only the requested neurons send back their activity coupled to their position in the BMU request. This simple mechanism supposes a low amount of communication thanks to the pruning that has been done previously. This inter-map communication can be possible if the IG routers support XY or equivalent routing techniques and broadcast in addition to the one of the propagation wave.

5. Experiments and Results

In this section, we present the databases and the results from our experiments with each modality alone, then with the multimodal association convergence and divergence, and we finally compare our model to three different approaches. All the results presented in this section have been averaged over a minimum of 10 runs, with shuffled datasets and randomly initialized neurons afferent weights.

5.1. Databases

The most important hypothesis that we want to confirm through this work is that the multimodal association of two modalities leads to a better accuracy than the best of the two modalities alone. For this purpose, we worked on two databases that we present in this section.

5.1.1. Written/Spoken Digits Database

The MNIST database [69] is a database of 70,000 handwritten digits (60,000 for training and 10,000 for test) proposed in 1998. Even if the database is quite old, it is still commonly used as a reference for training, testing and comparing various ML systems for image classification. In Reference [52], we applied Kohonen-based SOMs for MNIST classification with post-labeled unsupervised learning, and achieved state-of-art performance with the same number of neurons (100) and only 1 % of labeled samples for the neurons labeling. However, the obtained accuracy of 87.36 % is not comparable to supervised DNNs, and only two approaches have been used in the literature to bridge the gap: either use a huge number of neurons (6400 neurons in Reference [49]) with exponential increase in size for linear increase in accuracy [48] which is not scalable for complex databases, or use unsupervised feature extraction followed by a supervised classifier (Support Vector Machine in Reference [85]) which relies on the complete labeled dataset. We propose the multimodal association as a way to bridge the gap while keeping a small number of neurons and an unsupervised learning method from end to end. For this purpose, we use the classical MNIST as a visual modality that we associate to an auditory modality: Spoken-MNIST (S-MNIST).
We extracted S-MNIST from Google Speech Commands (GSC) [86], an audio dataset of spoken words that was proposed in 2018 to train and evaluate keyword spotting systems. It was therefore captured in real-world environments though phone or laptop microphones. The dataset consists of 105,829 utterances of 35 words, amongst which 38,908 utterances (34,801 for training and 4107 for test) of the 10 digits from 0 to 9. We constructed S-MNIST associating written and spoken digits of the same class, respecting the initial partitioning in References [69,86] for the training and test databases. Since we have less samples in S-MNIST than in MNIST, we duplicated some random spoken digits to match the number of written digits and have a multimodal-MNIST database of 70,000 samples. The whole pre-processed dataset is available in Supplementary materials [87].

5.1.2. DVS/EMG Hand Gestures Database

To validate our results, we experimented our model on a second database that was originally recorded with multiple sensors: the DVS/EMG hand gestures database Supplementary materials [88]. Indeed, the discrimination of human gestures using wearable solutions is extremely important as a supporting technique for assisted living, healthcare of the elderly and neuro-rehabilitation. For this purpose, we proposed in References [89,90] a framework that allows the integration of multi-sensory data to perform sensor fusion based on supervised learning. The framework was applied for the hand gestures recognition task with five hand gestures: Pinky (P), Elle (E), Yo (Y), Index (I) and Thumb (T).
The dataset consists of 6750 samples (5400 for training and 1350 for test) of muscle activities via EletroMyoGraphy (EMG) signals recorded by a Myo armband (Thalmic Labs Inc) from the forearm, and video recordings from a Dynamic Vision Sensor (DVS) using the computational resources of a mobile phone. The DVS is an event-based camera inspired by the mammalian retina [91], such that each pixel responds asynchronously to changes in brightness with the generation of events. Only the active pixels transfer information and the static background is directly removed on hardware at the front-end. The asynchronous nature of the DVS makes the sensor low power, low latency and low-bandwidth, as the amount of data transmitted is very small. It is therefore a promising solution for mobile applications [92] as well as neuromorphic chips, where energy efficiency is one of the most important characteristics.

5.2. SOM Unimodal Classification

5.2.1. Written Digits

MNIST classification with a SOM was already performed in Reference [52], achieving around 87 % of classification accuracy using 1 % of labeled images from the training dataset for the neurons labeling. The only difference is the computation of the α hyper-parameter in Equation (1) for the labeling process. We proposed in Reference [52] a centralized method for computing an approximated value of α , but we consider it as a simple hyper-parameter for this work. We therefore calculate the best value off-line with a grid search since we do not want to include any centralized computation, and because we can find a closer value to the optimum, as summarized in Table 2. The same procedure with the same hyper-parameters defined above is applied for each of the remaining unimodal classifications. Finally, we obtain 87.04 % ± 0.64 of accuracy. Figure 4 shows the neurons weights that represent the learned digits prototypes with the corresponding labels, and the confusion matrix that highlights the most frequent misclassifications between the digits whose representations are close: 23.12 % of the digits 4 are classified as 9 and 12.69 % of the digits 9 are classified as a 4. We find the same mistakes with a lower percentage between the digits 3, 5 and 8, because of their proximity in the 784-dimensional vector space. That’s what we aim to compensate when we add the auditory modality.

5.2.2. Spoken Digits

The most commonly used acoustic feature in speech recognition is the Mel Frequency Cepstral Coefficients (MFCC) [93,94,95]. MFCC was first proposed in Reference [96], which has since become the standard algorithm for representing speech features. It is a representation of the short-term power spectrum of a speech signal, based on a linear cosine transform of a log power spectrum on a nonlinear Mel scale of frequency. We first extracted the MFCC features from the S-MNIST data, using the hyper-parameters from Reference [95]: framing window size = 50 ms and frame shift size = 25 ms . Since the S-MNIST samples are approximately 1 s long, we end up with 39 dimensions. However, it’s not clear how many coefficients one has to take. Thus, we compared three methods: Reference [97] proposed to use 13 weighted MFCC coefficients, Reference [98] proposed to use 40 log-mel filterbank features, and Reference [95] proposed to use 12 MFCC coefficients with an additional energy coefficient, making it 13 coefficients in total. The classification accuracy is respectively 61.79 % ± 1.19 , 50.33 % ± 0.59 and 75.14 % ± 0.57 . We therefore chose to work with a 39 × 13 dimensional features that are standardized (each feature is transformed by subtracting the mean value and dividing by the standard deviation of the training dataset, also called Z-score normalization) then min-max normalized (each feature is re-scaled to 0 1 based on the minimum and maximum values of the training dataset). The confusion matrix in Figure 4 shows that the confusion between the digits 4 and 9 is almost zero, which strengthens our hypothesis that the auditory modality can complement the visual modality for a better overall accuracy.

5.2.3. DVS Hand Gestures

In order to use the DVS events with the ReSOM, we converted the stream of events into frames. The frames were generated by counting the events occurring in a fixed time window for each of the pixels separately, followed by a min-max normalization to get gray scale frames. The time window was fixed to 200 ms so that the DVS frames can be synchronized with the EMG signal, as further detailed in Reference [89]. The event frames obtained from the DVS camera have a resolution of 128 × 128 pixels. Since the region with the hand gestures does not fill the full frame, we extract a 60 × 60 pixels patch that allows us to significantly decrease the amount of computation needed during learning and inference.
Even though unimodal classification accuracies are not the first goal in this chapter, we need to reach a satisfactory performance before going to the multimodal association. Since the dataset is small and the DVS frames are of high complexity with a lot of noise from the data acquisition, we either have to significantly increase the number of neurons for the SOM or use feature extraction. We decided to use the second method with a CNN-based feature extraction as described in Reference [99]. We use supervised feature extraction to demonstrate that the ReSOM multimodal association is possible using features, then future works will focus on the transition to unsupervised feature extraction with commplex datasets based on the works of References [85,100]. Thus, we use a supervised CNN feature extractor with the LeNet-5 topology [101] except for the last convolution layer which has only 12 filters instead of 120. Hence, we extract CNN-based features of 972 dimensions that we standardize and normalize. We obtain an accuracy of 70.06 % ± 1.15 .

5.2.4. EMG Hand Gestures

For the EMG signal, we selected two time domain features that are commonly used in the literature [102]: the Mean Absolute Value (MAV) and the Root Mean Square (RMS) which are calculated over the same window of length 20 ms , as detailed in Reference [89]. With the same strategy as for DVS frames, we extract CNN-based features of 192 dimensions. The SOM reaches a classification accuracy of 66.89 % ± 0.84 .

5.3. ReSOM Multimodal Classification

After inter-SOM sprouting (Figure 5), training and pruning (Figure 6), we move to the inference for two different tasks: (1) labeling one SOM based on the activity of the other (divergence), and (2) classifying multimodal data with cooperation and competition between the two SOMs (convergence).

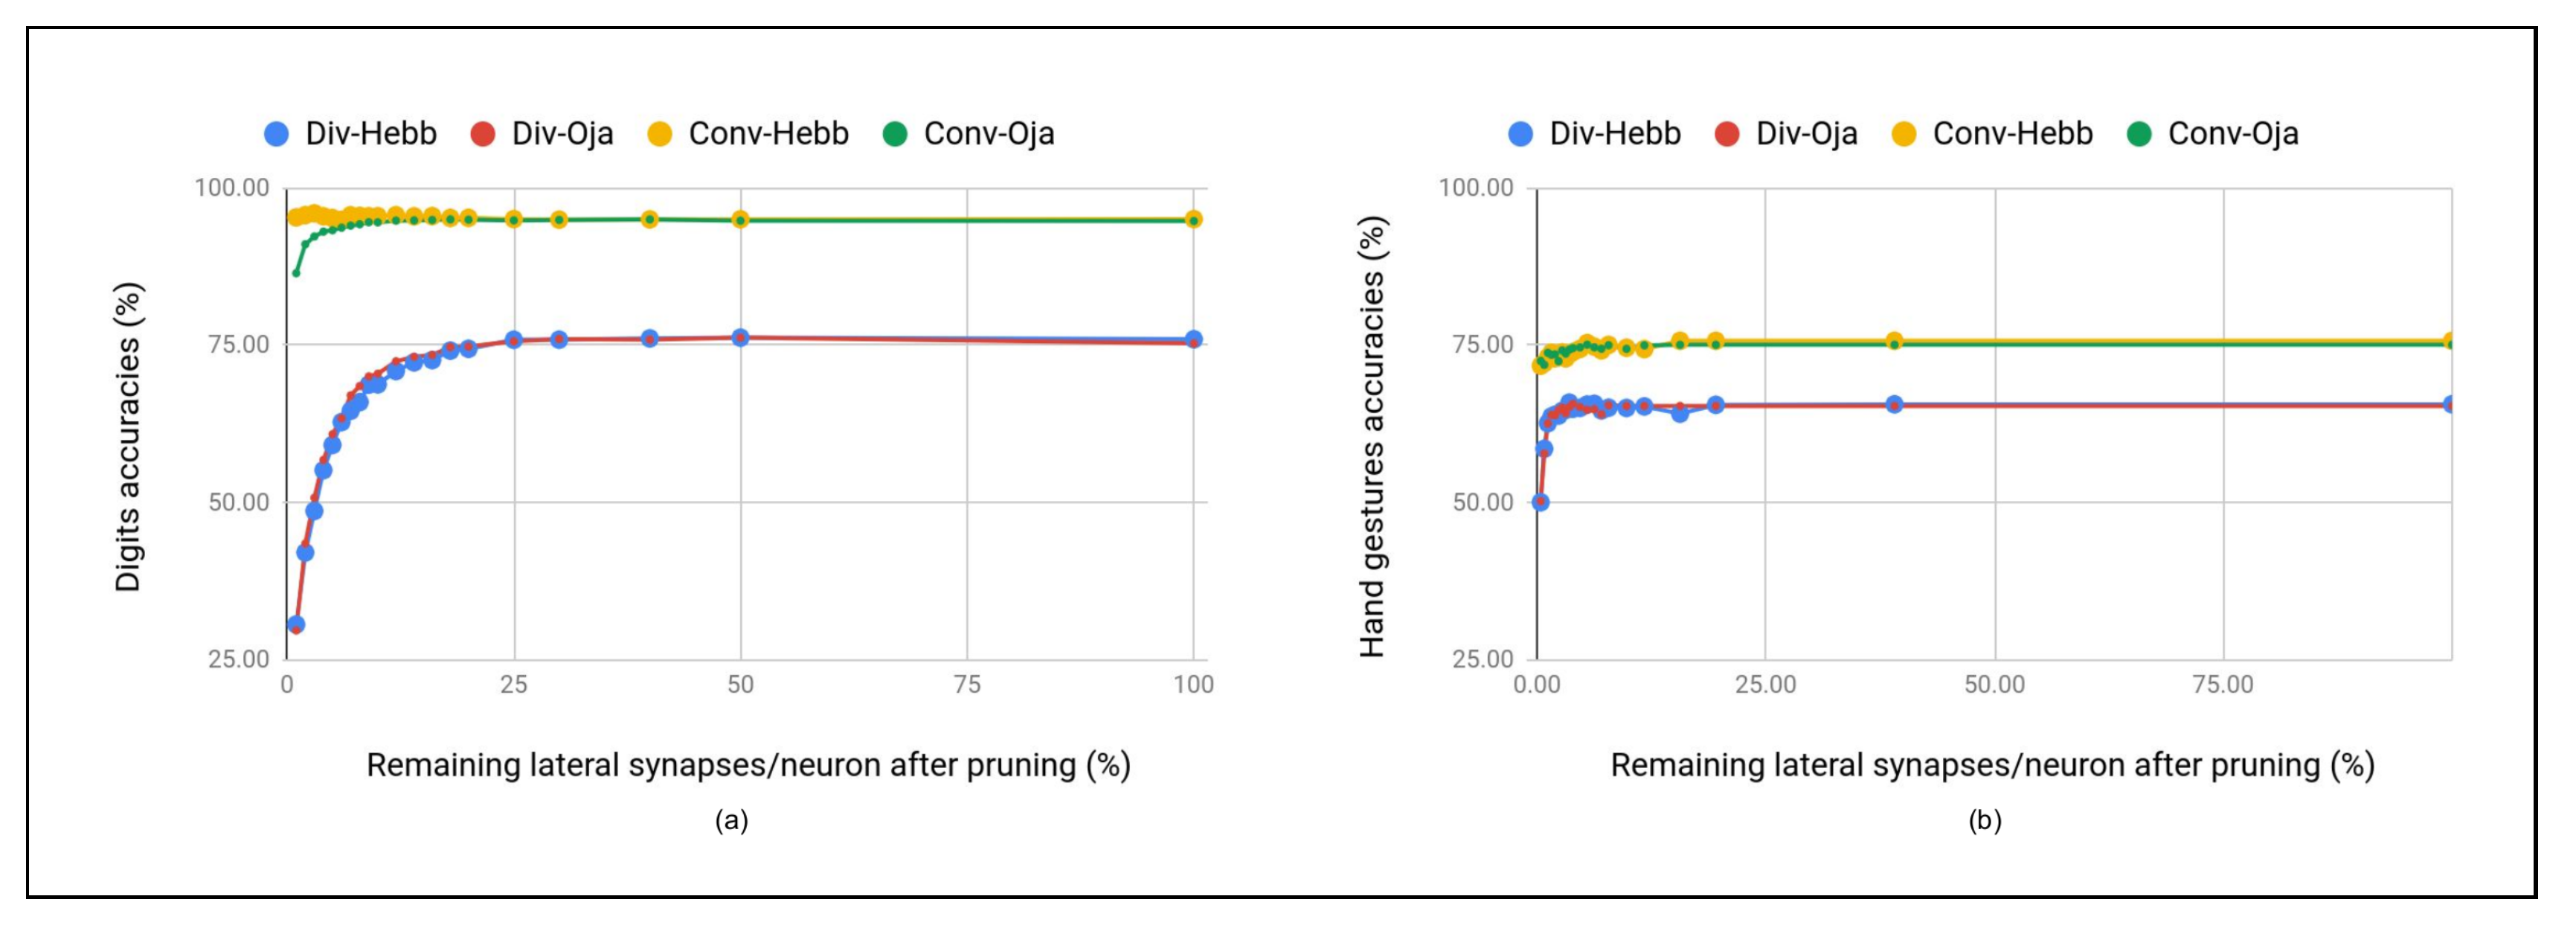
5.3.1. ReSOM Divergence Results

Table 2 shows unimodal classification accuracies using the divergence mechanism for labeling, with 75.9 % ± 0.2 for S-MNIST classification and 65.56 % ± 0.25 for EMG classification. As shown in Figure 6, we reach this performance using respectively 20 % and 25 % of the potential synapses for digits and hand gestures. Since the pruning is performed by the neurons of the source SOMs, that is, the MNIST-SOM and DVS-SOM, pruning too much synapses causes some neurons of the S-MNIST-SOM and EMG-SOM to be completely disconnected from the source map, and therefore do not get any activity for the labeling process. Hence, the labeling is incorrect, with the disconnected neurons stuck with the default label 0. In comparison to the classical labeling process with 10 % of labeled samples, we have a loss of only −1.33% for EMG and even a small gain of 0.76 % for S-MNIST even though we only use 1 % of labeled digits images. The choice of which modality to use to label the other is made according to two criteria: the source map must (1) achieve the best unimodal accuracy so that we maximize the separability of the transmitted activity to the other map, and it must (2) require the least number of labeled data for its own labeling so that we minimize the number of samples to label during data acquisition. Overall, the divergence mechanism for labeling leads to approximately the same accuracy than the classical labeling. Therefore, we perform the unimodal classification of S-MNIST and EMG with no labels from end to end.

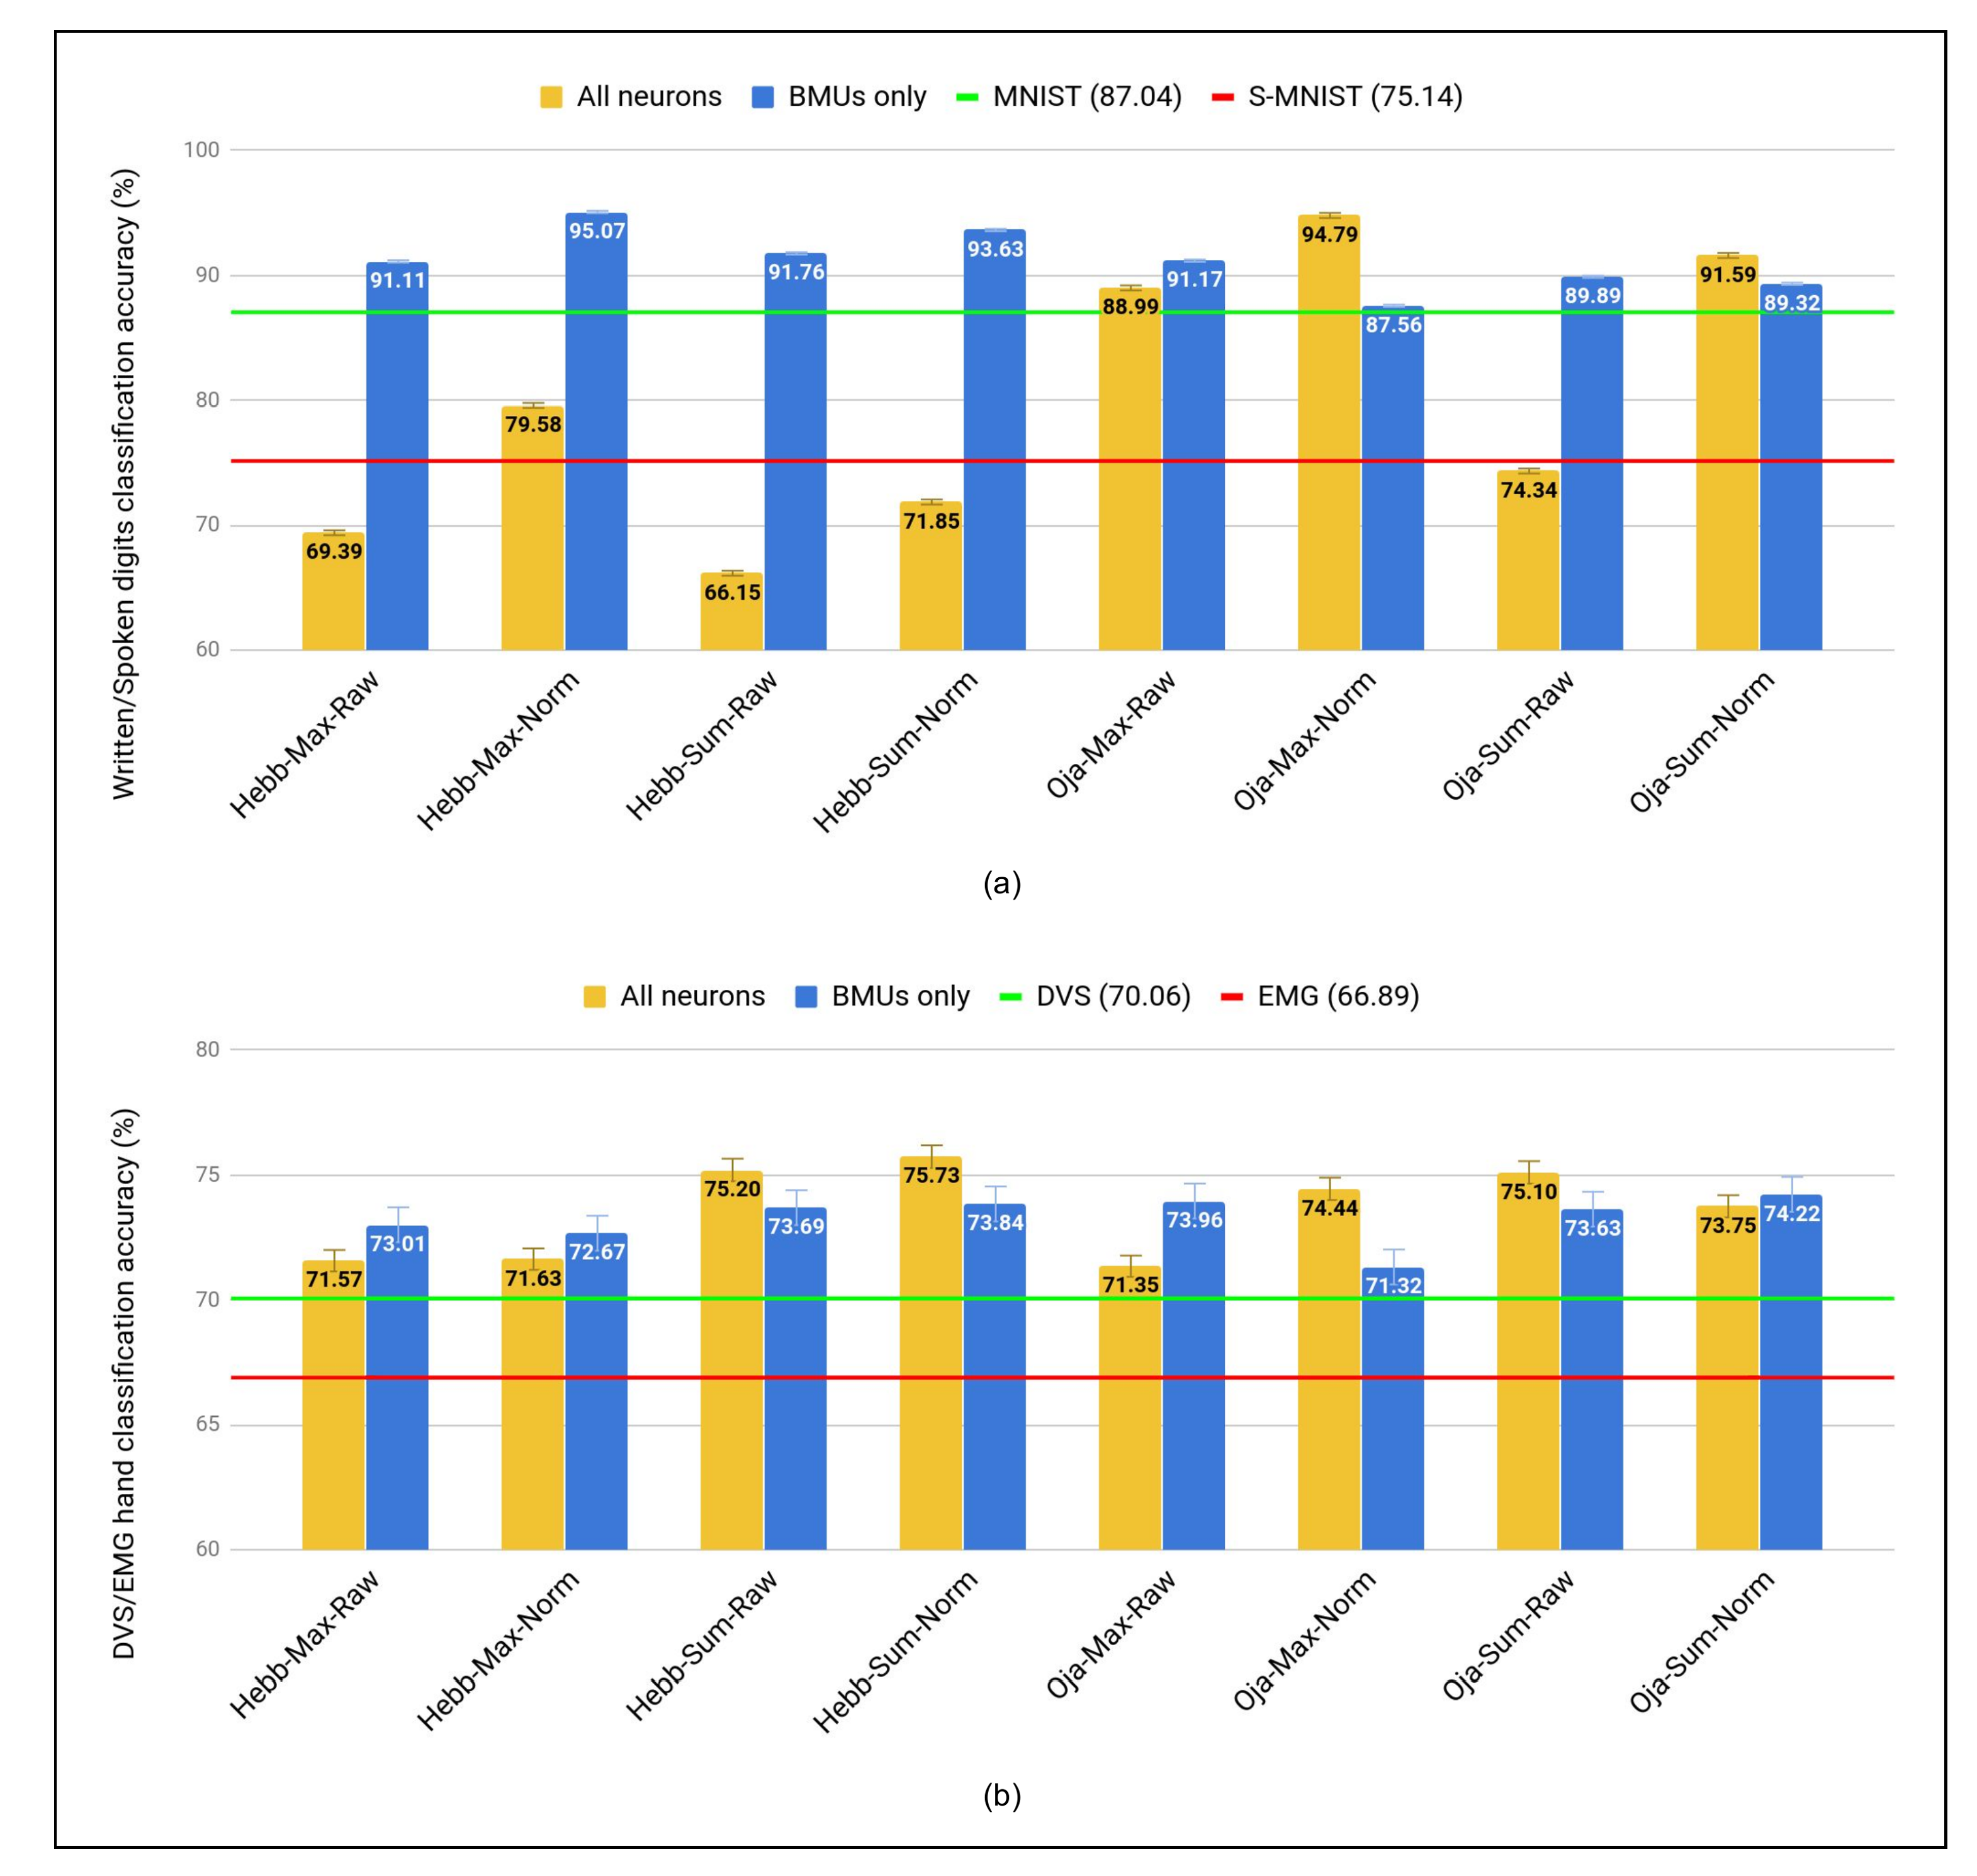
5.3.2. ReSOM Convergence Results

We proposed eight variants of the convergence algorithm for each the two learning methods. For the discussion, we denote them as follow: L e a r n i n g U p d a t e N o r m a l i z a t i o n N e u r o n s such that L e a r n i n g can be H e b b or O j a , U p d a t e can be M a x or S u m , N o r m a l i z a t i o n can be R a w (the activites are taken as initially computed by the SOM) or N o r m (all activities are normalized with a min-max normalization thanks to the WMU and BMU activities of each SOM), and finally N e u r o n s can be B M U (only the two BMUs update each other and all other neurons activities are reset to zero) or A l l (all neurons update their activities and therefore the global BMU can be different from the two local BMUs). It is important to note that since we constructed the written/spoken digits dataset, we maximized the cases where the two local BMUs have different labels such as one of them is correct. This choice was made in order to better asses the accuracies of the methods based on BMUs update only, as both cases when the two BMUs are correct or incorrect at the same time lead to the same global results regardless of the update method. The convergence accuracies for each of the eight method applied on the two databases are summarized in Table 3 and Figure 7.
For the digits, we first notice that the Hebb’s learning with all neurons update leads to very poor performance, worse than the unimodal classification accuracies. To explain this behavior, we have to look at the neurons BMU counters during learning in Figure 8. We notice that some neurons, labeled as 1 in Figure 4, are winners much more often than other neurons. Hence, their respective lateral synapses weights increase disproportionately compared to other synapses, and lead those neurons to be winners most of the time after the update, as their activity is higher than other neurons very often during convergence. This behavior is due to two factors: first, the neurons that are active most of the time are those that are the fewest to represent a class. Indeed, there are less neurons prototypes for the digit 1 compared to other classes, because the digit 1 have less sub-classes. In other words, the digit 1 has less variants and therefore can be represented by less prototype neurons. Consequently, those neurons representing the digit 1 are active more often than other neurons, because the number of samples for each class in the dataset is approximately equal. Second, Hebb’s learning is unbounded, leading to an indefinite increase in lateral synaptic weights. Thus, this problem occurs less when we use Oja’s rule, as shown in Figure 7. We notice that Oja’s learning leads to more homogenous results, and normalization often leads to a better accuracy. The best method using Hebb’s learning is H e b b M a x N o r m B M U with 95.07 % ± 0.08 , while the best method using Oja’s learning is O j a M a x N o r m A l l with 94.79 % ± 0.11 .
For the hand gestures, all convergence methods lead to a gain in accuracy even though the best gain is smaller than for digits, as summarized in Table 2. It can be explained by the absence of neurons that would be BMUs much more often than other neurons, as shown in Figure 9. The best method using Hebb’s learning is H e b b S u m N o r m A l l with 75.73 % ± 0.91 , while the best method using Oja’s learning is O j a S u m R a w A l l with 75.10 % ± 0.9 . In contrast with the digits database, here the most accurate methods are based on the S u m update. Thus, each neuron takes in account the activities of all the neurons that it is connected to. A plausible reason is the fact that the digits database was constructed whereas the hand gestures database was initially recorded with multimodal sensors, which gives it a more natural correlation between the two modalities.
Overall, the best methods for both digits and hand gestures databases are based on Hebb’s learning, even though the difference with the best methods based on Oja’s learning is very small, and Oja’s rule has the interesting property of bounding the synaptic weights. For hardware implementation, the synaptic weights of the Hebb’s learning can be normalized after a certain threshold without affecting the model’s behavior, since the strongest synapse stays the same when we divide all the synapses by the same value. However, the problem is more complex in the context of on-line learning as discussed in Section 6. Quantitatively, we have a gain of + 8.03 % and + 5.67 % for the digits and the hand gestures databases respectively, compared to the best unimodal accuracies. The proposed convergence mechanism leads to the election of a global BMU between the two unimodal SOMs: it is one of the local BMUs for the H e b b M a x N o r m B M U method used for digits, whereas it can be a completely different neuron for the H e b b S u m N o r m A l l used for hand gestures. In the first case, since the convergence process can only elect one of the two local BMUs, we can compute the absolute accuracy in the cases where the two BMUs are different with one of them being correct. We find that the correct choice between the two local BMUs is made in about 87 % of the cases. However, in both cases, the convergence leads to the election a global BMU that is indeed spread in the two maps, as shown in Figure 8 and Figure 9. Nevertheless, the neurons of the hand gestures SOMs are less active in the inference process, because we only have 1350 samples in the test database.
The best accuracy for both methods is reached using a sub-part of the lateral synapses, as we prune a big percentage of the potential synapses as shown in Figure 6. We say potential synapses, because the pruning is performed with respect to a percentage (or number) of synapses for each neuron, and the neuron does not have the information of other neurons due to the cellular architecture. Thus, the percentage is calculated with respect to the maximum number of potential lateral synapses, that is equal to the number of neurons in the other SOM, and not the actual number of synapses. In fact, at the end of the Hebbian-like learning, each neuron is only connected to the neurons where there is at least one co-occurrence of BMUs, as shown in Figure 5. Especially for the hand gestures database, the sprouting leads to a small total number of lateral synapses even before pruning, because of the small number of samples in the training dataset. Finally, we need at most 10 % of the total lateral synapses to achieve the best performance in convergence as shown in Figure 6. However, if we want to maintain the unimodal classification with the divergence method for labeling, then we have to keep 20 % and 25 % of the potential synapses for digits and hand gestures, respectively.
One interesting aspect of the multimodal fusion is the explainability of the better accuracy results. To do so, we plot the confusion matrices with the best convergence methods for the digits and hand gestures datasets in Figure 10. The gain matrices mean an improvement over the unimodal performance when they have positive values in the diagonal and negative values elsewhere. If we look at the gain matrix of the convergence method compared to the image modality, we notice two main characteristics: first, all the values in the diagonal are positive, meaning that there is a total accuracy improvement for all the classes. Second and more interestingly, the biggest absolute values outside the diagonal lie where there is the biggest confusion for the images, that is, between the digits 4 and 9, and between the digits 3, 5 and 8, as previously pointed out in Section 5.2.1. It confirms our initial hypothesis, which means that the auditory modality brings a complementary information that leads to a greater separability for the classes which have the most confusion in the visual modality. Indeed, the similarity between written 4 and 9 is compensated by the dissimilarity of spoken 4 and 9. The same phenomenon can be observed for the auditory modality, where there is an important gain for the digit 9 that is often misclassified as 1 or 5 in the speech SOM, due to the similarity of their sounds. Similar remarks are applicable for the hand gestures database with more confusion in some cases, which leads to a smaller gain.
Our results confirm that multimodal association is interesting because the strengths and weaknesses of each modality can be complementary. Indeed, Rathi and Roy [48] state that if the non-idealities in the unimodal datasets are independent, then the probability of misclassification is the product of the misclassification probability of each modality. Since the product of two probabilities is always lower than each probability, then each modality helps to overcome and compensate for the weaknesses of the other modality. Furthermore, multimodal association improves the robustness of the overall system to noise [48], and in the extreme case of losing one modality, the system could rely on the other one which links back to the concept of degeneracy in neural structures [4].

5.4. Comparative Study

First, we compare our results with STDP approaches to assess the classification accuracy with a comparable number of neurons. Next, we confront our results with two different approaches: we try early data fusion using one SOM, then we use supervised perceptrons to learn the multimodal representations based on the two unimodal SOMs activities.

5.4.1. SOMs vs. SNNs Approaches for Unsupervised Learning

Table 4 summarizes the digits classification accuracy achieved using brain-inspired unsupervised approaches, namely SOMs with self-organization (Hebb, Oja and Kohonen principles) and SNNs with STDP. We achieve the best accuracy with a gain of about 6 % over Rathi and Roy [48], which is to the best of our knowledge the only work that explores brain-inspired multimodal learning for written/spoken digits classification. It is to note that we do not use the TI46 spoken digits database [103] (not freely available), but a subpart of Google Speech Google Speech Commands [86] as presented in Section 5.1.1. We notice that all other works use the complete training dataset to label the neurons, which is incoherent with the goal of not using labels, as explained in Reference [52]. Moreover, the work of Rathi and Roy [48] differs from our work in the following points:
  • The cross-modal connections are formed randomly and initialized with random weights. The multimodal STDP learning is therefore limited to connections that have been randomly decided, which induces an important variation in the network performance.
  • The cross-modal connections are not bi-directional, thus breaking with the biological foundations of reentry and CDZ. Half the connections carry spikes from image to audio neurons and the other half carry spikes from audio to image neurons, otherwise making the system unstable.
  • The accuracy goes down beyond 26 % connections. When the number of random cross-modal connections is increased, the neurons that have learned different label gets connected. We do not observe such a behavior in the ReSOM, as shown in Figure 6.
  • The SNN computation is distributed, but requires an all-to-all connectivity amongst neurons. This full connectivity goes against the scalability of the network as discussed in Section 4.
  • The decision of the multimodal network is computed by observing the spiking activity in both ensembles, thus requiring a central unit.
Nevertheless, the STDP-based multimodal learning is still a promising approach for the hardware efficiency of SNNs [104], and because of the alternative they offer for using event-based sensors with asynchronous computation [105].

5.4.2. SOM Early Data Fusion

We find in the literature two main different strategies for multimodal fusion [50,107]: (1) score-level fusion where data modalities are learned by distinct models then their predictions are fused with another model that provides a final decision, and (2) data-level fusion where modalities are concatenated then learned by a unique model. Our approach can be classified as a classifier-level fusion which is closer to score-level fusion and usually produces better results than feature-level or data-level fusion for classification tasks [108,109,110]. However, it is worth trying to learn the concatenated modalities with one SOM having as much neurons as the two uni-modal SOMs, for a fair comparison. We use 361 and 529 neurons for digits and hand gestures respectively. We have few neurons more compared to the sum of the two uni-modal SOMs, as we want to keep the same square grid topology. We train the SOMs with the same hyper-parameters as for the uni-modal SOMs, and reach 90.68 % ± 0.29 and 75.6 % ± 0.32 accuracy for digits and hand gestures, respectively. We still have a gain compared to the uni-modal SOMs, but we have an important loss of 4.39 % for digits and a negligible loss of 0.13 % for hand gestures compared to the proposed ReSOM multimodal association. The incremental aspect of the ReSOM from simple (unimodal) to more complex (multimodal) representations improves the system’s accuracy, which is coherent with the literature findings. Furthermore, the accuracy is not the only metric, as the memory footprint is an important factor to take in consideration when choosing a fusion strategy [111], especially for embedded systems. Indeed, since we target a hardware implementation on FPGA, the total number of afferent and lateral synaptic weights are parameters that require on-chip memory, which is very limited. With a simple calculation using the number of neurons and input dimensions, we find that we have a gain of 49.84 % and 40.96 % for digits and hand gestures respectively using the multimodal association compared to a data-level fusion strategy.

5.4.3. SOMs Coupled to Supervised Fusion

In order to have an approximation of the best accuracy that we could obtain with multimodal association, we used a number of perceptrons equal to the number of classes on top of the two uni-modal SOMs of the two databases, and performed supervised learning for the same number of epochs (10) using gradient descent (Adadelta algorithm). We obtain 91.29 % ± 0.82 and 80.19 % ± 0.63 of accuracy for the digits and hand gestures respectively. Surprisingly, we have a loss of 3.78 % for the digits. However, we have a gain of 4.43 % for the hand gestures. We argue that the hand gestures dataset is too small to construct robust multimodal representations through unsupervised learning, and that could explain the smaller overall gain compared to the digits dataset.

6. Discussion

6.1. A Universal Multimodal Association Model?

The development of associations between co-occurring stimuli for multimodal binding has been strongly supported by neurophysiological evidence [62,112]. Similar to References [44,113,114] and based on our experimental results, we argue that the co-occurrence of sensory inputs is a sufficient source of information to create robust multimodal representations with the use of associative links between unimodal representations that can be incrementally learned in an unsupervised fashion.
In terms of learning, the best methods are based on H e b b ’s learning with a slightly better accuracy over O j a ’s learning, but the overall results are more homogeneous using O j a ’s learning that prevents the synaptic weights from growing indefinitely. The best results are obtained using H e b b M a x N o r m B M U with 95.07 % ± 0.08 and H e b b S u m N o r m A l l with 75.73 % ± 0.91 for the digits and hand gestures datatabases, respectively. We notice that the B M U method is coupled with the M a x update while the A l l neurons method is coupled with the S u m update, and the N o r m activities usually perform better than R a w activities. However, we cannot have a final conclusion on the best method, especially since it depends on the nature of the dataset.
Moreover, the experimental results depend on the β hyper-parameter in Equation (13), the Gaussian kernel width that has to be tuned for every database and every method. Thanks to the multiplicative update, the values of both SOMs are brought into the same scale which gives the possibility to elect the correct global BMU, and we get rid of a second hyper-parameter that would arise with a sum update method like in Reference [46]. However, it is still time-taking in the exploration of the proposed methods for future works, even if it is a common limit when dealing with any ANN. Finding a more efficient approach for computing β is part of our ongoing works.
Finally, multimodal association bridges the gap between unsupervised and supervised learning, as we obtain approximately the same results compared to MNIST using a supervised Multi-Layer Perceptron (MLP) with 95.73 % [104] and S-MNIST using a supervised attention Recurent Neural Network (RNN) with 94.5 % [115] (even though this results was obtained on 20 commands). Multimodal association can also be seen as way to reach the same accuracy of about 95 % as Reference [49] with much less neurons, going from 6400 neurons to 356 neurons, that is, a gain of 94 % in the total number of neurons. It is therefore a very promising approach to deeper explore, as we have in most cases the possibility to include multiple sensory modalities when dealing with the real-world environment.

6.2. SOMA: Toward Hardware Plasticity

This work is part of the Self-Organizing Machine Architecture (SOMA) project [116], where the objective is to study neural-based self-organization in computing systems and to prove the feasibility of a self-organizing multi-FPGA hardware structure based on the IG cellular neuromorphic architectures. In fact, the concept of the IG is supported in Reference [117] as it states that “changes initially are local: components only interact with their immediate neighbors. They are virtually independent of components farther away. But self-organization is often defined as global order emerging from local interactions”. Moreover, it states that “a self-organizing system not only regulates or adapts its behavior, it creates its own organization. In that respect it differs fundamentally from our present systems, which are created by their designer”.
Indeed, the multimodal association through Hebbian-like learning is a self-organization that defines the inter-SOMs structure, where neurons are only connected to each other when there is a strong correlation between them. That’s a form of hardware plasticity. The hardware gain of the ReSOM self-organization is therefore the gain in communication support, which is proportional to the percentage of remaining synapses for each neuron after learning and pruning that reduces the number of connections, thus the number of communications and therefore the overall energy consumption. Hence, the system is more energy-efficient as only relevant communications are performed without any control by an external expert.

7. Conclusions and Further Works

We proposed in this work a new brain-inspired computational model for multimodal unsupervised learning called the ReSOM. Based on the reentry paradigm proposed by Edelman, it is a generic model regardless of the number of maps and the number of neurons per map. The ReSOM learns unimodal representations with Kohonen-based SOMs, then creates and reinforces the multimodal association via sprouting, Hebbian-like learning and pruning. It enables both structural and synaptic plasticities that are the core of neural self-organization. We exploited both convergence and divergence that are highlighted by Damasio thanks to the bi-directional property of the multimodal representation in a classification task: the divergence mechanism is used to label one modality based on the other, and the convergence is used to introduce cooperation and competition between the modalities and reach a better accuracy than the best of the two unimodal accuracies. Indeed, our experiments show that the divergence labeling leads to approximately the same unimodal accuracy as when using labels, and we reach a gain in the multimodal accuracy of + 8.03 % for the written/spoken digits database and + 5.67 % for the DVS/EMG hand gestures database. Our model exploits the natural complementarity between different modalities like sight and sound as shown by the confusion matrices, so that they complete each other and improve the multimodal classes separability. Implemented on the IG cellular neuromorphic architecture, the ReSOM’s inter-map structure is learned along the system’s experience through self-organization and not fixed by the user. It leads to a gain in the communication time which is proportional to the number of pruned lateral synapses for each neuron, which is about 80 % of the possible connections. In addition to the convergence and divergence gains, the ReSOM self-organization induces a form of hardware plasticity which has an impact on the hardware efficiency of the system, and that’s a first result that opens very interesting perspectives for future designs and implementations of self-organizing architectures inspired from the brain’s plasticity.

Supplementary Materials

The datasets for this study can be found in https://zenodo.org/record/3515935 [87] and https://zenodo.org/record/3663616 [88].

Author Contributions

Conceptualization, L.K., L.R. and B.M.; Formal analysis, L.K.; Funding acquisition, B.M.; Investigation, L.K.; Methodology, L.K., L.R. and B.M.; Project administration, B.M.; Resources, B.M.; Software, L.K.; Supervision, L.R. and B.M.; Validation, L.K.; Visualization, L.K.; Writing—original draft, L.K.; Writing—review & editing, L.R. and B.M. All authors have read and agreed to the published version of the manuscript.

Funding

This material is based upon work supported by the French Research Agency (ANR) and the Swiss National Science Foundation (SNSF) through SOMA project ANR-17-CE24-0036.

Acknowledgments

This manuscript has been released as a pre-print at https://arxiv.org/abs/2004.05488 [118]. The authors would like to acknowledge the 2019 Capocaccia Neuromorphic Workshop and all its participants for the fruitful discussions.

Conflicts of Interest

The authors declare that the research was conducted in the absence of any commercial or financial relationships that could be construed as a potential conflict of interest.

References

  1. Sternberg, R.J. Handbook of Intelligence; Cambridge University Press: Cambridge, UK, 2000. [Google Scholar] [CrossRef]
  2. Smith, L.; Gasser, M. The Development of Embodied Cognition: Six Lessons from Babies. Artif. Life 2005, 11, 13–29. [Google Scholar] [CrossRef]
  3. Droniou, A.; Ivaldi, S.; Sigaud, O. Deep unsupervised network for multimodal perception, representation and classification. Robot. Auton. Syst. 2015, 71, 83–98. [Google Scholar] [CrossRef] [Green Version]
  4. Edelman, G.M. Neural Darwinism: The Theory of Neuronal Group Selection; Basic Books: New York, NY, USA, 1987. [Google Scholar]
  5. Edelman, G.M.; Gally, J.A. Degeneracy and complexity in biological systems. Proc. Natl. Acad. Sci. USA 2001, 98, 13763–13768. [Google Scholar] [CrossRef] [PubMed] [Green Version]
  6. Lahat, D.; Adali, T.; Jutten, C. Multimodal Data Fusion: An Overview of Methods, Challenges, and Prospects. Proc. IEEE 2015, 103, 1449–1477. [Google Scholar] [CrossRef] [Green Version]
  7. Shivappa, S.T.; Trivedi, M.M.; Rao, B.D. Audiovisual Information Fusion in Human–Computer Interfaces and Intelligent Environments: A Survey. Proc. IEEE 2010, 98, 1692–1715. [Google Scholar] [CrossRef] [Green Version]
  8. Rivet, B.; Wang, W.; Naqvi, S.M.; Chambers, J.A. Audiovisual Speech Source Separation: An overview of key methodologies. IEEE Signal Process. Mag. 2014, 31, 125–134. [Google Scholar] [CrossRef] [Green Version]
  9. Pitti, A.; Blanchard, A.; Cardinaux, M.; Gaussier, P. Gain-field modulation mechanism in multimodal networks for spatial perception. In Proceedings of the 2012 12th IEEE-RAS International Conference on Humanoid Robots (Humanoids 2012), Osaka, Japan, 29 November–1 December 2012; pp. 297–302. [Google Scholar] [CrossRef] [Green Version]
  10. Fiack, L.; Cuperlier, N.; Miramond, B. Embedded and Real-Time Architecture for Bio-Inspired Vision-Based Robot Navigation. J. Real-Time Image Process. 2015, 10, 699–722. [Google Scholar] [CrossRef]
  11. Braun, S.; Neil, D.; Anumula, J.; Ceolini, E.; Liu, S. Attention-driven Multi-sensor Selection. In Proceedings of the 2019 International Joint Conference on Neural Networks (IJCNN), Budapest, Hungary, 14–19 July 2019; pp. 1–8. [Google Scholar] [CrossRef]
  12. Zhao, D.; Zeng, Y. Dynamic Fusion of Convolutional Features based on Spatial and Temporal Attention for Visual Tracking. In Proceedings of the 2019 International Joint Conference on Neural Networks (IJCNN), Budapest, Hungary, 14–19 July 2019; pp. 1–8. [Google Scholar] [CrossRef]
  13. Tan, A.H.; Subagdja, B.; Wang, D.; Meng, L. Self-organizing neural networks for universal learning and multimodal memory encoding. Neural Netw. 2019. [Google Scholar] [CrossRef]
  14. Zhang, Y.; Wang, Z.; Du, J. Deep Fusion: An Attention Guided Factorized Bilinear Pooling for Audio-video Emotion Recognition. In Proceedings of the 2019 International Joint Conference on Neural Networks (IJCNN), Budapest, Hungary, 14–19 July 2019; pp. 1–8. [Google Scholar] [CrossRef] [Green Version]
  15. Turk, M. Multimodal interaction: A review. Pattern Recognit. Lett. 2014, 36, 189–195. [Google Scholar] [CrossRef]
  16. Debes, C.; Merentitis, A.; Heremans, R.; Hahn, J.; Frangiadakis, N.; van Kasteren, T.; Liao, W.; Bellens, R.; Pizurica, A.; Gautama, S.; et al. Hyperspectral and LiDAR data fusion: Outcome of the 2013 GRSS data fusion contest. IEEE J. Sel. Top. Appl. Earth Obs. Remote Sens. 2014, 7. [Google Scholar] [CrossRef]
  17. Hoeks, C.; Barentsz, J.; Hambrock, T.; Yakar, D.; Somford, D.; Heijmink, S.; Scheenen, T.; Vos, P.; Huisman, H.; van Oort, I.; et al. Prostate Cancer: Multiparametric MR Imaging for Detection, Localization, and Staging. Radiology 2011, 261, 46–66. [Google Scholar] [CrossRef] [PubMed]
  18. Horwitz, B.; Poeppel, D. How can EEG/MEG and fMRI/PET data be combined? Hum. Brain Mapp. 2002, 17, 1–3. [Google Scholar] [CrossRef] [PubMed]
  19. Edelman, G.M. Group selection and phasic reentrant signaling: A theory of higher brain function. In Proceedings of the 4th Intensive Study Program of the Neurosciences Research Program, Boston, MA, USA, 1982. [Google Scholar]
  20. Damasio, A.R. Time-locked multiregional retroactivation: A systems-level proposal for the neural substrates of recall and recognition. Cognition 1989, 33, 25–62. [Google Scholar] [CrossRef]
  21. Rodriguez, L.; Khacef, L.; Miramond, B. A distributed cellular approach of large scale SOM models for hardware implementation. In Proceedings of the IEEE International Conference on Image Processing, Applications and Systems (IPAS), Sophia Antipolis, France, 12–14 December 2018. [Google Scholar]
  22. Escobar-Juárez, E.; Schillaci, G.; Hermosillo-Valadez, J.; Lara-Guzmán, B. A Self-Organized Internal Models Architecture for Coding Sensory–Motor Schemes. Front. Robot. AI 2016, 3, 22. [Google Scholar] [CrossRef]
  23. Varela, F.J.; Thompson, E.T.; Rosch, E. The Embodied Mind: Cognitive Science and Human Experience; new edition; The MIT Press: Cambridge, MA, USA, 1992. [Google Scholar]
  24. Meyer, K.; Damasio, A. Convergence and divergence in a neural architecture for recognition and memory. Trends Neurosci. 2009, 32, 376–382. [Google Scholar] [CrossRef] [PubMed]
  25. Man, K.; Damasio, A.; Meyer, K.; Kaplan, J.T. Convergent and invariant object representations for sight, sound, and touch. Hum. Brain Mapp. 2015, 36, 3629–3640. [Google Scholar] [CrossRef]
  26. Kiefer, M.; Sim, E.J.; Herrnberger, B.; Grothe, J.; Hoenig, K. The Sound of Concepts: Four Markers for a Link between Auditory and Conceptual Brain Systems. J. Neurosci. Off. J. Soc. Neurosci. 2008, 28, 12224–12230. [Google Scholar] [CrossRef]
  27. González, J.; Barrós-Loscertales, A.; Pulvermüller, F.; Meseguer, V.; Sanjuán, A.; Belloch, V.; Avila, C. Reading cinnamon activates olfactory brain regions. NeuroImage 2006, 32, 906–912. [Google Scholar] [CrossRef]
  28. Sathian, K.; Zangaladze, A. Feeling with the mind’s eye: Contribution of visual cortex to tactile perception. Behav. Brain Res. 2002, 135, 127–132. [Google Scholar] [CrossRef]
  29. Calvert, G.A. Crossmodal Processing in the Human Brain: Insights from Functional Neuroimaging Studies. Cereb. Cortex 2001, 11, 1110–1123. [Google Scholar] [CrossRef]
  30. Kriegstein, K.; Giraud, A.L. Implicit Multisensory Associations Influence Voice Recognition. PLoS Biol. 2006, 4, e326. [Google Scholar] [CrossRef]
  31. Edelman, G.M. Neural Darwinism: Selection and reentrant signaling in higher brain function. Neuron 1993, 10, 115–125. [Google Scholar] [CrossRef]
  32. Edelman, G.; Gally, J. Reentry: A Key Mechanism for Integration of Brain Function. Front. Integr. Neurosci. 2013, 7, 63. [Google Scholar] [CrossRef] [PubMed] [Green Version]
  33. Singer, W. The formation of cooperative cell assemblies in the visual cortex. J. Exp. Biol. 1990, 153, 177–197. [Google Scholar]
  34. Shatz, C.J. How are specific connections formed between thalamus and cortex? Curr. Opin. Neurobiol. 1992, 2, 78–82. [Google Scholar] [CrossRef]
  35. Douglas, R.J.; Martin, K.A. Neuronal Circuits of the Neocortex. Annu. Rev. Neurosci. 2004, 27, 419–451. [Google Scholar] [CrossRef] [Green Version]
  36. Rutishauser, U.; Douglas, R.J. State-Dependent Computation Using Coupled Recurrent Networks. Neural Comput. 2009, 21, 478–509. [Google Scholar] [CrossRef] [Green Version]
  37. Damasio, A.R.; Damasio, H. Cortical Systems for Retrieval of Concrete Knowledge: The Convergence Zone Framework. In Large-Scale Neuronal Theories of the Brain; Koch, C., Davis, J., Eds.; MIT Press: Cambridge, MA, USA, 1994; pp. 61–74. [Google Scholar]
  38. Lallee, S.; Dominey, P.F. Multi-modal convergence maps: From body schema and self-representation to mental imagery. Adapt. Behav. 2013, 21, 274–285. [Google Scholar] [CrossRef]
  39. Kohonen, T. The self-organizing map. Proc. IEEE 1990, 78, 1464–1480. [Google Scholar] [CrossRef]
  40. Wolpert, D.; Kawato, M. Multiple paired forward and inverse models for motor control. Neural Netw. 1998, 11, 1317–1329. [Google Scholar] [CrossRef]
  41. Hebb, D.O. The Organization of Behavior: A Neuropsychological Theory; Wiley: New York, NY, USA, 1949. [Google Scholar]
  42. Zahra, O.; Navarro-Alarcon, D. A Self-organizing Network with Varying Density Structure for Characterizing Sensorimotor Transformations in Robotic Systems. In Annual Conference Towards Autonomous Robotic Systems; Althoefer, K., Konstantinova, J., Zhang, K., Eds.; Springer International Publishing: Cham, Switzerland, 2019; pp. 167–178. [Google Scholar]
  43. Oja, E. Simplified neuron model as a principal component analyzer. J. Math. Biol. 1982, 15, 267–273. [Google Scholar] [CrossRef] [PubMed]
  44. Parisi, G.I.; Tani, J.; Weber, C.; Wermter, S. Emergence of multimodal action representations from neural network self-organization. Cogn. Syst. Res. 2017, 43, 208–221. [Google Scholar] [CrossRef] [Green Version]
  45. Marsland, S.; Shapiro, J.; Nehmzow, U. A Self-organising Network That Grows when Required. Neural Netw. 2002, 15, 1041–1058. [Google Scholar] [CrossRef]
  46. Jayaratne, M.; Alahakoon, D.; Silva, D.D.; Yu, X. Bio-Inspired Multisensory Fusion for Autonomous Robots. In Proceedings of the IECON 2018-44th Annual Conference of the IEEE Industrial Electronics Society, Washington, DC, USA, 21–23 October 2018; pp. 3090–3095. [Google Scholar]
  47. Alahakoon, D.; Halgamuge, S.K.; Srinivasan, B. Dynamic self-organizing maps with controlled growth for knowledge discovery. IEEE Trans. Neural Netw. 2000, 11, 601–614. [Google Scholar] [CrossRef]
  48. Rathi, N.; Roy, K. STDP-Based Unsupervised Multimodal Learning With Cross-Modal Processing in Spiking Neural Network. IEEE Trans. Emerg. Top. Comput. Intell. 2018, 1–11. [Google Scholar] [CrossRef]
  49. Diehl, P.; Cook, M. Unsupervised learning of digit recognition using spike-timing-dependent plasticity. Front. Comput. Neurosci. 2015, 9, 99. [Google Scholar] [CrossRef] [Green Version]
  50. Cholet, S.; Paugam-Moisy, H.; Regis, S. Bidirectional Associative Memory for Multimodal Fusion: A Depression Evaluation Case Study. In Proceedings of the 2019 International Joint Conference on Neural Networks (IJCNN), Budapest, Hungary, 14–19 July 2019; pp. 1–6. [Google Scholar] [CrossRef]
  51. Azcarraga, A.; Giacometti, A. A prototype-based incremental network model for classification tasks. In Proceedings of the Fourth International Conference on Neural Networks and their Applications, Nimes, France, 4–8 November 1991; pp. 121–134. [Google Scholar]
  52. Khacef, L.; Miramond, B.; Barrientos, D.; Upegui, A. Self-organizing neurons: Toward brain-inspired unsupervised learning. In Proceedings of the 2019 International Joint Conference on Neural Networks (IJCNN), Budapest, Hungary, 14–19 July 2019; pp. 1–9. [Google Scholar] [CrossRef]
  53. Gu, L.; Li, H. Memory or Time: Performance Evaluation for Iterative Operation on Hadoop and Spark. In Proceedings of the 2013 IEEE 10th International Conference on High Performance Computing and Communications 2013 IEEE International Conference on Embedded and Ubiquitous Computing, Zhangjiajie, China, 13–15 November 2013; pp. 721–727. [Google Scholar] [CrossRef]
  54. Barth, D.S.; Goldberg, N.; Brett, B.; Di, S. The spatiotemporal organization of auditory, visual, and auditory-visual evoked potentials in rat cortex. Brain Res. 1995, 678, 177–190. [Google Scholar] [CrossRef]
  55. Allman, B.L.; Keniston, L.P.; Meredith, M.A. Not Just for Bimodal Neurons Anymore: The Contribution of Unimodal Neurons to Cortical Multisensory Processing. Brain Topogr. 2009, 21, 157–167. [Google Scholar] [CrossRef] [Green Version]
  56. Lefort, M.; Boniface, Y.; Girau, B. SOMMA: Cortically Inspired Paradigms for Multimodal Processing. In Proceedings of the International Joint Conference on Neural Networks, Dallas, TX, USA, 4–9 August 2013; pp. 1–8. [Google Scholar] [CrossRef]
  57. Calvert, G.; Spence, C.; Stein, B. The Handbook of Multisensory Processing; MIT Press: Cambridge, MA, USA, 2004. [Google Scholar]
  58. Bizley, J.K.; King, A.J. Visual–auditory spatial processing in auditory cortical neurons. Brain Res. 2008, 1242, 24–36. [Google Scholar] [CrossRef] [Green Version]
  59. Cappe, C.; Rouiller, E.M.; Barone, P. Multisensory anatomical pathways. Hear. Res. 2009, 258, 28–36. [Google Scholar] [CrossRef] [Green Version]
  60. Schroeder, C.; Foxe, J. Multisensory contributions to low-level, ‘unisensory’ processing. Curr. Opin. Neurobiol. 2005, 15, 454–458. [Google Scholar] [CrossRef] [PubMed]
  61. Dehner, L.R.; Keniston, L.P.; Clemo, H.R.; Meredith, M.A. Cross-modal Circuitry Between Auditory and Somatosensory Areas of the Cat Anterior Ectosylvian Sulcal Cortex: A ‘New’ Inhibitory Form of Multisensory Convergence. Cereb. Cortex 2004, 14, 387–403. [Google Scholar] [CrossRef] [PubMed]
  62. Fiebelkorn, I.C.; Foxe, J.J.; Molholm, S. Dual mechanisms for the cross-sensory spread of attention: How much do learned associations matter? Cereb. Cortex 2010, 20, 109–120. [Google Scholar] [CrossRef] [PubMed] [Green Version]
  63. Chum, L.; Subramanian, A.; Balasubramanian, V.N.; Jawahar, C.V. Beyond Supervised Learning: A Computer Vision Perspective. J. Indian Inst. Sci. 2019, 99, 177–199. [Google Scholar] [CrossRef]
  64. Kohonen, T.; Schroeder, M.R.; Huang, T.S. (Eds.) Self-Organizing Maps, 3rd ed.; Springer: Berlin/Heidelberg, Germany, 2001. [Google Scholar]
  65. Kohonen, T.; Oja, E.; Simula, O.; Visa, A.; Kangas, J. Engineering applications of the self-organizing map. Proc. IEEE 1996, 84, 1358–1384. [Google Scholar] [CrossRef]
  66. Silva, D.D.; Ranasinghe, W.K.B.; Bandaragoda, T.R.; Adikari, A.; Mills, N.; Iddamalgoda, L.; Alahakoon, D.; Lawrentschuk, N.L.; Persad, R.; Osipov, E.; et al. Machine learning to support social media empowered patients in cancer care and cancer treatment decisions. PLoS ONE 2018, 13, e0205855. [Google Scholar] [CrossRef] [Green Version]
  67. Nallaperuma, D.; Silva, D.D.; Alahakoon, D.; Yu, X. Intelligent Detection of Driver Behavior Changes for Effective Coordination Between Autonomous and Human Driven Vehicles. In Proceedings of the IECON 2018-44th Annual Conference of the IEEE Industrial Electronics Society, Washington, DC, USA, 21–23 October 2018; pp. 3120–3125. [Google Scholar]
  68. Kromes, R.; Russo, A.; Miramond, B.; Verdier, F. Energy consumption minimization on LoRaWAN sensor network by using an Artificial Neural Network based application. In Proceedings of the 2019 IEEE Sensors Applications Symposium (SAS), Sophia Antipolis, France, 11–13 March 2019; pp. 1–6. [Google Scholar] [CrossRef]
  69. LeCun, Y.; Cortes, C. MNIST Handwritten Digit Database. 1998. Available online: http://yann.lecun.com/exdb/mnist/.
  70. Fauth, M.; Tetzlaff, C. Opposing Effects of Neuronal Activity on Structural Plasticity. Front. Neuroanat. 2016, 10, 75. [Google Scholar] [CrossRef] [Green Version]
  71. Goodhill, G.J.; Barrow, H.G. The Role of Weight Normalization in Competitive Learning. Neural Comput. 1994, 6, 255–269. [Google Scholar] [CrossRef]
  72. Fyfe, C. A Neural Network for PCA and Beyond. Neural Process. Lett. 1997, 6, 33–41. [Google Scholar] [CrossRef]
  73. Asano, M.; Imai, M.; Kita, S.; Kitajo, K.; Okada, H.; Thierry, G. Sound symbolism scaffolds language development in preverbal infants. Cortex 2015, 63, 196–205. [Google Scholar] [CrossRef] [Green Version]
  74. Kemeny, J.G. Theory of Self-Reproducing Automata. John von Neumann. Edited by Arthur W. Burks. University of Illinois Press, Urbana, 1966. 408 pp., illus. 10. Science 1967, 157, 180. [Google Scholar] [CrossRef]
  75. Wolfram, S. Universality and complexity in cellular automata. Phys. D Nonlinear Phenom. 1984, 10, 1–35. [Google Scholar] [CrossRef]
  76. Halbach, M.; Hoffmann, R. Implementing cellular automata in FPGA logic. In Proceedings of the 18th International Parallel and Distributed Processing Symposium, Santa Fe, NM, USA, 26–30 April 2004; p. 258. [Google Scholar] [CrossRef]
  77. Kyparissas, N.; Dollas, A. An FPGA-Based Architecture to Simulate Cellular Automata with Large Neighborhoods in Real Time. In Proceedings of the 2019 29th International Conference on Field Programmable Logic and Applications (FPL), Barcelona, Spain, 8–12 September 2019; pp. 95–99. [Google Scholar] [CrossRef]
  78. Walsh, D.; Dudek, P. A compact FPGA implementation of a bit-serial SIMD cellular processor array. In Proceedings of the 2012 13th International Workshop on Cellular Nanoscale Networks and their Applications, Turin, Italy, 29–31 August 2012; pp. 1–6. [Google Scholar] [CrossRef] [Green Version]
  79. Schuman, C.D.; Potok, T.E.; Patton, R.M.; Birdwell, J.D.; Dean, M.E.; Rose, G.S.; Plank, J.S. A Survey of Neuromorphic Computing and Neural Networks in Hardware. arXiv 2017, arXiv:1705.06963. [Google Scholar]
  80. Blazewicz, J.; Ecker, K.; Plateau, B.; Trystram, D. Handbook on Parallel and Distributed Processing; Springer: Berlin/Heidelberg, Germany, 2000. [Google Scholar] [CrossRef]
  81. de Abreu de Sousa, M.A.; Del-Moral-Hernandez, E. An FPGA distributed implementation model for embedded SOM with on-line learning. In Proceedings of the 2017 International Joint Conference on Neural Networks, Anchorage, AK, USA, 14–19 May 2017. [Google Scholar] [CrossRef]
  82. Fiack, L.; Rodriguez, L.; Miramond, B. Hardware design of a neural processing unit for bio-inspired computing. In Proceedings of the 2015 IEEE 13th International New Circuits and Systems Conference (NEWCAS), Grenoble, France, 7–10 June 2015; pp. 1–4. [Google Scholar] [CrossRef]
  83. Rodriguez, L.; Fiack, L.; Miramond, B. A neural model for hardware plasticity in artificial vision systems. In Proceedings of the Conference on Design and Architectures for Signal and Image Processing, Cagliari, Italy, 8–10 October 2013. [Google Scholar]
  84. Vannel, F.; Barrientos, D.; Schmidt, J.; Abegg, C.; Buhlmann, D.; Upegui, A. SCALP: Self-configurable 3-D Cellular Adaptive Platform. In Proceedings of the 2018 IEEE Symposium Series on Computational Intelligence (SSCI), Bangalore, India, 18–21 November 2018; pp. 1307–1312. [Google Scholar] [CrossRef]
  85. Kheradpisheh, S.R.; Ganjtabesh, M.; Thorpe, S.J.; Masquelier, T. STDP-based spiking deep convolutional neural networks for object recognition. Neural Netw. 2018, 99, 56–67. [Google Scholar] [CrossRef] [PubMed] [Green Version]
  86. Warden, P. Speech Commands: A Dataset for Limited-Vocabulary Speech Recognition. arXiv 2018, arXiv:1804.03209. [Google Scholar]
  87. Khacef, L.; Rodriguez, L.; Miramond, B. Written and spoken digits database for multimodal learning. 2019. [Google Scholar] [CrossRef]
  88. Ceolini, E.; Taverni, G.; Payvand, M.; Donati, E. EMG and Video Dataset for Sensor Fusion Based Hand Gestures Recognition; European Commission: Brussels, Belgium, 2019. [Google Scholar] [CrossRef]
  89. Ceolini, E.; Taverni, G.; Khacef, L.; Payvand, M.; Donati, E. Sensor fusion using EMG and vision for hand gesture classification in mobile applications. In Proceedings of the 2019 IEEE Biomedical Circuits and Systems Conference (BioCAS), Nara, Japan, 17–19 October 2019; pp. 1–4. [Google Scholar] [CrossRef] [Green Version]
  90. Ceolini, E.; Frenkel, C.; Shrestha, S.B.; Taverni, G.; Khacef, L.; Payvand, M.; Donati, E. Hand-Gesture Recognition Based on EMG and Event-Based Camera Sensor Fusion: A Benchmark in Neuromorphic Computing. Front. Neurosci. 2020, 14, 637. [Google Scholar] [CrossRef]
  91. Lichtsteiner, P.; Posch, C.; Delbruck, T. A 128 X 128 120db 30mw asynchronous vision sensor that responds to relative intensity change. In Proceedings of the 2006 IEEE International Solid State Circuits Conference-Digest of Technical Papers, San Francisco, CA, USA, 6–9 February 2006; pp. 2060–2069. [Google Scholar]
  92. Ceolini, E.; Taverni, G.; Khacef, L.; Payvand, M.; Donati, E. Live Demostration: Sensor fusion using EMG and vision for hand gesture classification in mobile applications. In Proceedings of the 2019 IEEE Biomedical Circuits and Systems Conference (BioCAS), Nara, Japan, 17–19 October 2019; p. 1. [Google Scholar] [CrossRef]
  93. Luque, A.; Romero-Lemos, J.; Carrasco, A.; Barbancho, J. Non-sequential automatic classification of anuran sounds for the estimation of climate-change indicators. Expert Syst. Appl. 2018, 95, 248–260. [Google Scholar] [CrossRef]
  94. Darabkh, K.A.; Haddad, L.; Sweidan, S.; Hawa, M.; Saifan, R.R.; Alnabelsi, S.H. An efficient speech recognition system for arm-disabled students based on isolated words. Comp. Applic. Eng. Educ. 2018, 26, 285–301. [Google Scholar] [CrossRef]
  95. Pan, Z.; Li, H.; Wu, J.; Chua, Y. An Event-Based Cochlear Filter Temporal Encoding Scheme for Speech Signals. In Proceedings of the 2018 International Joint Conference on Neural Networks (IJCNN), Rio de Janeiro, Brazil, 8–13 July 2018; pp. 1–8. [Google Scholar] [CrossRef]
  96. Mermelstein, P. Distance measures for speech recognition, psychological and instrumental. In Pattern Recognition and Artificial Intelligence; Chen, R., Ed.; Academic Press: New York, NY, USA, 1976; pp. 374–388. [Google Scholar]
  97. Chapaneri, S. Spoken Digits Recognition using Weighted MFCC and Improved Features for Dynamic Time Warping. Int. J. Comput. Appl. 2012, 40, 6–12. [Google Scholar] [CrossRef]
  98. Sainath, T.; Parada, C. Convolutional Neural Networks for Small-Footprint Keyword Spotting. In Proceedings of the Interspeech, Dresden, Germany, 6–10 September 2015. [Google Scholar]
  99. Khacef, L.; Rodriguez, L.; Miramond, B. Improving Self-Organizing Maps with Unsupervised Feature Extraction. In Proceedings of the 2020 International Conference on Neural Information Processing (ICONIP), Bangkok, Thailand, 18–22 November 2020. [Google Scholar]
  100. Falez, P.; Tirilly, P.; Bilasco, I.M.; Devienne, P.; Boulet, P. Unsupervised visual feature learning with spike-timing-dependent plasticity: How far are we from traditional feature learning approaches? Pattern Recognit. 2019, 93, 418–429. [Google Scholar] [CrossRef] [Green Version]
  101. Lecun, Y.; Bottou, L.; Bengio, Y.; Haffner, P. Gradient-based learning applied to document recognition. Proc. IEEE 1998, 86, 2278–2324. [Google Scholar] [CrossRef] [Green Version]
  102. Phinyomark, A.; N Khushaba, R.; Scheme, E. Feature Extraction and Selection for Myoelectric Control Based on Wearable EMG Sensors. Sensors 2018, 18, 1615. [Google Scholar] [CrossRef] [PubMed] [Green Version]
  103. Liberman, M.; Amsler, R.; Church, K.; Fox, E.; Hafner, C.; Klavans, J.; Marcus, M.; Mercer, B.; Pedersen, J.; Roossin, P.; et al. TI 46-Word LDC93S9 Database. 1991. Available online: https://catalog.ldc.upenn.edu/LDC93S9.
  104. Khacef, L.; Abderrahmane, N.; Miramond, B. Confronting machine-learning with neuroscience for neuromorphic architectures design. In Proceedings of the 2018 International Joint Conference on Neural Networks (IJCNN), Rio de Janeiro, Brazil, 8–13 July 2018. [Google Scholar] [CrossRef]
  105. O’Connor, P.; Neil, D.; Liu, S.C.; Delbruck, T.; Pfeiffer, M. Real-time classification and sensor fusion with a spiking deep belief network. Front. Neurosci. 2013, 7, 178. [Google Scholar] [CrossRef] [Green Version]
  106. Hazan, H.; Saunders, D.; Sanghavi, D.T.; Siegelmann, H.; Kozma, R. Unsupervised Learning with Self-Organizing Spiking Neural Networks. In Proceedings of the 2018 International Joint Conference on Neural Networks, Rio de Janeiro, Brazil, 8–13 July 2018. [Google Scholar] [CrossRef] [Green Version]
  107. Baltrusaitis, T.; Ahuja, C.; Morency, L.P. Multimodal Machine Learning: A Survey and Taxonomy. IEEE Trans. Pattern Anal. Mach. Intell. 2019, 41, 423–443. [Google Scholar] [CrossRef] [PubMed] [Green Version]
  108. Guo, H.; Chen, L.; Shen, Y.; Chen, G. Activity recognition exploiting classifier level fusion of acceleration and physiological signals. In Proceedings of the UbiComp 2014-Adjunct Proceedings of the 2014 ACM International Joint Conference on Pervasive and Ubiquitous Computing, Seattle, WA, USA, 13–17 September 2014; pp. 63–66. [Google Scholar] [CrossRef]
  109. Peng, L.; Chen, L.; Wu, X.; Guo, H.; Chen, G. Hierarchical complex activity representation and recognition using topic model and classifier level fusion. IEEE Trans. Biomed. Eng. 2016, 64, 1369–1379. [Google Scholar] [CrossRef] [PubMed]
  110. Biagetti, G.; Crippa, P.; Falaschetti, L. Classifier Level Fusion of Accelerometer and sEMG Signals for Automatic Fitness Activity Diarization. Sensors 2018, 18, 2850. [Google Scholar] [CrossRef] [Green Version]
  111. Castanedo, F. A Review of Data Fusion Techniques. Sci. World J. 2013, 2013, 704504. [Google Scholar] [CrossRef]
  112. Ursino, M.; Cuppini, C.; Magosso, E. Neurocomputational approaches to modelling multisensory integration in the brain: A review. Neural Netw. Off. J. Int. Neural Netw. Soc. 2014, 60, 141–165. [Google Scholar] [CrossRef]
  113. Vavrecka, M.; Farkas, I. A Multimodal Connectionist Architecture for Unsupervised Grounding of Spatial Language. Cogn. Comput. 2013, 6, 101–112. [Google Scholar] [CrossRef]
  114. Morse, A.F.; Benitez, V.L.; Belpaeme, T.; Cangelosi, A.; Smith, L.B. Posture Affects How Robots and Infants Map Words to Objects. PLoS ONE 2015, 10, e0116012. [Google Scholar] [CrossRef] [Green Version]
  115. de Andrade, D.C.; Leo, S.; Viana, M.L.D.S.; Bernkopf, C. A neural attention model for speech command recognition. arXiv 2018, arXiv:1808.08929. [Google Scholar]
  116. Khacef, L.; Girau, B.; Rougier, N.P.; Upegui, A.; Miramond, B. Neuromorphic hardware as a self-organizing computing system. In Proceedings of the IJCNN 2018 Neuromorphic Hardware in Practice and Use Workshop, Rio de Janeiro, Brazil, 8–13 July 2018. [Google Scholar]
  117. Heylighen, F.; Gershenson, C. The Meaning of Self-Organization in Computing. IEEE Intell. Syst. 2003, 18, 72–75. [Google Scholar] [CrossRef]
  118. Khacef, L.; Rodriguez, L.; Miramond, B. Brain-inspired self-organization with cellular neuromorphic computing for multimodal unsupervised learning. arXiv 2020, arXiv:2004.05488. [Google Scholar]
Figure 1. Schematic representation of (a) Convergence Divergence Zone (CDZ) and (b) reentry frameworks. The reentry paradigm states that unimodal neurons connect to each other through direct connections, while the CDZ paradigm implies hierarchical neurons that connect unimodal neurons.
Electronics 09 01605 g001
Figure 2. Schematic representation of the proposed Reentrent Self-Organizing Map (ReSOM) for multimodal association. For clarity, the lateral connections of only two neurons from each map are represented.
Electronics 09 01605 g002
Figure 3. (a) Best Matching Unit (BMU) and Worst Matching Unit (WMU) distributed computing flowchart for each neuron. This flowchart describes the Self-Organizing Map (SOM) learning, but the winner wave is applied the same way for all steps of the multimodal learning while the learning part can be replaced by Hebbian-like learning or inference; (b) Neural Processing Units (NPUs) grid on FPGA [82].
Electronics 09 01605 g003
Figure 4. MNIST learning with SOM: (a) neurons afferent weights; (b) neurons labels; (c) confusion matrix; we can visually assess the good labeling from (a) and (b), while (c) shows that some classes like 4 and 9 are easier to confuse than others, and that’s due to their proximity in the 784-dimensional space; (d) S-MNIST divergence confusion matrix; (e) Dynamic Vision Sensor (DVS) confusion matrix; (f) EletroMyoGraphy (EMG) divergence confusion matrix; the interesting characteristic is that the confusion between the same classes is not the same for the different modalities, and that’s why they can complement each other.
Electronics 09 01605 g004
Figure 5. SOMs lateral sprouting in the multimodal association process: (a) Written/Spoken digits maps; (b) DVS/EMG hand gestures maps. We notice that less than half of the possible lateral connections are created at the end of the Hebbian-like learning, because only meaningful connections between correlated neurons are created. For (b), the even smaller number of connections is also related to the small size of the training dataset.
Electronics 09 01605 g005
Figure 6. Divergence and convergence classification accuracies VS. the remaining percentage of lateral synapses after pruning: (a) Written/Spoken digits maps; (b) DVS/EMG hand gestures maps. We see that we need more connections per neuron for the divergence process, because the pruning is done by the neurons of one of the two maps, and a small number of connections results in some disconnected neurons in the other map.
Electronics 09 01605 g006
Figure 7. Multimodal convergence classification: (a) Written/Spoken digits; (b) DVS/EMG hand gestures. The red and green lines are respectively the lowest and highest unimodal accuracies. Hence, there is an overall gain whenever the convergence accuracy is above the green line.
Electronics 09 01605 g007
Figure 8. Written/Spoken digits neurons BMU counters during multimodal learning and inference using H e b b M a x N o r m B M U method: (a) MNIST SOM in learning; (b) S-MNIST SOM neurons during learning; (c) MNIST SOM neurons during inference; (d) S-MNIST SOM neurons during inference.
Electronics 09 01605 g008
Figure 9. DVS/EMG hand gestures neurons BMU counters during multimodal learning and inference using H e b b S u m N o r m A l l method: (a) DVS SOM in learning; (b) EMG SOM neurons during learning; (c) DVS SOM neurons during inference; (d) EMG SOM neurons during inference.
Electronics 09 01605 g009
Figure 10. Written/Spoken digits confusion matrices using H e b b M a x N o r m B M U method: (a) convergence; (b) convergence gain with respect to MNIST; (c) convergence gain with respect to S-MNIST; DVS/EMG hand gestures confusion matrices using H e b b S u m N o r m A l l method: (d) convergence; (e) convergence gain with respect to DVS; (f) convergence gain with respect to EMG.
Electronics 09 01605 g010
Table 1. Models and applications of brains-inspired multimodal learning.
ApplicationWorkParadigmLearningComputing
Sensori-motor
mapping
Lallee et al. [38] (2013)CDZUnsupervisedCentralized
Droniou et al. [3] (2015)CDZUnsupervisedCentralized
Escobar-Juarez et al. [22] (2016)CDZUnsupervisedCentralized
Zahra et al. [42] (2019)ReentryUnsupervisedCentralized
Multi-sensory
classification
Parisi et al. [44] (2017)ReentrySemi-supervisedCentralized
Jayaratne et al. [46] (2018)ReentrySemi-supervisedDistributed (data level)
Rathi et al. [48] (2018)ReentryUnsupervisedCentralized **
Cholet et al. [50] (2019)Reentry *SupervisedCentralized
Khacef et al. [this work] (2020)ReentryUnsupervisedDistributed (system level)
* With an extra layer for classification. ** Learning is distributed but inference for classification is centralized.
Table 2. Classification accuracies and convergence/divergence gains (bold number represent the best results in the table).
DatabaseDigitsHand Gestures
MNISTS-MNISTDVSEMG
SOMsDimensions784507972192
Neurons100256256256
Labeled data (%)1101010
Accuracy (%) α 87.04 1.0 75.14 0.1 70.06 2.0 66.89 1.0
ReSOM DivergenceLabeled data (%)10100
Gain (%)/+0.76/-1.33
Accuracy (%)/75.90/65.56
ReSOM ConvergenceGain (%)+8.03+19.17+5.67+10.17
Accuracy (%)95.0775.73
Table 3. Multimodal classification accuracies (bold number represent the best results in the table).
LearningReSOM Convergence Method and Accuracy (%) β
Update
Algorithm
Neurons
Activities
DigitsHand Gestures
All NeuronsBMUs OnlyAll NeuronsBMUs Only
HebbMaxRaw69.39 1 91.11 1 71.57 5 73.01 5
Norm79.58 20 95.07 10 71.63 3 72.67 20
SumRaw66.15 1 91.76 10 75.20 4 73.69 4
Norm71.85 1 93.63 20 75.73 4 73.84 20
OjaMaxRaw88.99 4 91.17 1 71.35 3 73.96 10
Norm94.79 4 87.56 3 74.44 30 71.32 10
SumRaw74.34 2 89.89 3 75.10 4 73.63 10
Norm91.59 15 89.32 30 73.75 4 74.22 30
Table 4. Digits classification comparison (bold number represent the best results in the table).
ANNModelNeuronsLabels (%) *ModalityDatasetAccuracy (%)
SNNDiehl et al. [49] (2015)400100UnimodalMNIST88.74
Hazan et al. [106] (2018)400100UnimodalMNIST92.56
Rathi et al. [48] (2018)400100UnimodalMNIST86.00
Rathi et al. [48] (2018)400100MultimodalMNIST +
TI46
89.00
SOMKhacef et al. [this work] (2020)3561MultimodalMNIST +
SMNIST
95.07
* Labeled data are only used for the neurons labeling after unsupervised training.

