Abstract
In community networks, users access the web using a proxy selected from a list, normally without regard to its performance. Knowing which proxies offer good response times for each client would improve the user experience when navigating, but would involve intensive probing that would in turn cause performance degradation of both proxies and the network. This paper explores the feasibility of estimating the response times for each client/proxy pair by probing only a few of the existing pairs and then using matrix factorization. To do so, response times are collected in a community network emulated on a testbed platform, then a small part of these measurements are used to estimate the remaining ones through matrix factorization. Several algorithms are tested; one of them achieves estimation accuracy with low computational cost, which renders its use feasible in real networks.
1. Introduction
Community networks [1] are distributed, decentralized, large scale communication networks, often set up by citizen organizations to provide users with cheap Internet access, in both urban and rural areas. In Europe there are some significant community networks, like Ninux (Italy) [2], Funkfeuer (Austria) [3] or Guifi.net (Spain) [4], with tens of thousands of users.
In these networks, users typically access the Web through proxies contributed by other users of the network; thus they are in different locations and having different computational resources and varying bandwidth in their outbound links (from the high speed connection of a public library to the remaining capacity of an ADSL domestic service contributed by a user [5]). Besides, the actual response time of a proxy to a client’s request depends also on the path (i.e., the series of links) from the client to the proxy, which in a community network can vary wildly [6], as wireless ad hoc links coexist with more stable and faster links contributed by institutions or leased to operators. As it is the end users who must select their preferred proxy, all these factors are generally ignored, and they tend to pick one random proxy, or at most one that is geographically near [7]. This pattern of behavior, however, causes some proxies to tend to be saturated, while others are idle, and the performance perceived by end users degrades.
In the literature, some attempts [7,8] have been made to automatically select the proxy for each client using information from the proxy performance, measured for example by the latency (or ‘time to first byte’ or the response) or response time (time until a requested document is completely retrieved, or ‘time to last byte’). Both metrics take into account many factors that determine the best proxy for the client: The round trip time to arrive, determined by the delays of the links in the path, the performance and load of the node acting as proxy and the quality of its outbound link (the last two issues reflect better in the response time [9]). It should be noted that a client who wants to automatically select a proxy must probe all of them or, in suboptimistic approaches, a subset of them [7]. However, in large networks with many clients and proxies, probing traffic is not neglectable and affects the overall network carrying capacity [8], as well as proxy performance, as they spend a significant time answering probes.
One way to overcome this would be that each client probes a reduced set of proxies, and then shares this information with other clients. In this way, a given client would have a sparse view of the performance associated to client/proxy pairs, but could use this information to estimate the response times that each of the proxies would give to its own requests. Therefore, each client should be able to select the best proxy according to the response times that were either measured or estimated.
For this approach to work, estimations must be accurate. In the literature, works like [10,11,12] have tried matrix factorization algorithms to estimate different quality of service (QoS) measures in communication networks using a similar approach (i.e., the relevant metrics are measured only for a few of the client/server pairs, the rest being estimated from these few measurements). For example, reference [12] estimates both response times and transfer rates offered by web services from sparse probes made by clients and shared among them. To the best of our knowledge, these ideas have not been tested yet to estimate any QoS metric in the context of community networks.
The goal of this paper is thus to evaluate the feasibility of using matrix factorization algorithms to estimate the response times offered by web proxies in community networks. To do so, a community network is recreated using a testbed, and all clients are set to probe all proxies every 10 s for two days. This dataset is then used in our experiments to replicate a situation in which only a small percentage of the client/proxy response times are measured, and the rest estimated. Three different matrix factorization algorithms, of different computational complexity, are evaluated to discuss the feasibility of the approach.
The structure of the paper is as follows. Section 2 discusses some relevant related work concerning the estimation of QoS metrics and in particular web proxy response times. Then, Section 3 presents the matrix factorization algorithms that are tested. In Section 4, the experimental approach followed in this research is detailed, while Section 5 presents and discusses the results before the conclusions close the paper.
2. Related Work
Monitoring has always been key to ensure the correct performance of a complex, distributed system, like a community network. It is a first step to control the quality of service, detect anomalies or decide on resource assignment. It is particularly relevant in the problem of web proxy selection in a community network, as clients can select the one that optimizes a certain QoS metric.
There are some interesting works on informed proxy selection for wireless networks. However, most of these works have some important limitations: Despite proposing interesting solutions, they tend to fail in considering heterogeneity, monitoring overhead and lack practical testing in a real-world environment. For example, proposals such as [13] fail in heterogeneous environments because they are based on solutions that operate at the routing layer and require modifications to the infrastructure routers. In the rest of this section we discuss works directly related to ours, summarizing their main features in Table 1.

Table 1.
Monitoring approaches for proxy selection.
In monitoring for selection, one basic approach is to have a ‘full visibility matrix’, i.e., a matrix with as many rows as monitoring elements (e.g., clients) and as many columns as monitored items (e.g., proxies), with all the QoS metric values actually measured. A full visibility matrix can be obtained following a standalone brute force approach in which each client probes each proxy [14]. While applicable in small networks, this solution does not scale well to large ones because of the additional traffic and workload on the proxies introduced by the probes. This problem can be tackled with the reduction of the number of measured proxies by a client.
The full visibility can also be achieved with the cooperation of clients that measure just a subset of items and share the results among them. In this case, ’centralized cooperation’ can be an approach to achieve full visibility. In [15], all the nodes, not only clients, collect statistics about network usage and send them to the central monitoring module. This approach fails in scalability as all collected information must be sent, stored and computed in the SDN controller, and fails in heterogeneous environments as they are based on solutions that require modifications to infrastructure routers. Furthermore, they challenge the governance philosophy of community networks [18,19] because they would introduce single points of failure and control of the network performance. To achieve the full visibility, some works use a distributed cooperation [7,16]. An approach for distributed cooperation in monitoring the QoS offered by proxies is reusing probes, for example a piggyback strategy. In [16], intermediate nodes capture probes issued by other clients in order to estimate their own information without issuing a new probe. The obvious limitation to this comes from the fact that a node should be in the way to many proxies, which is seldom the case in a community network, where clients are at the edges of the topology [4]. Again, this problem can be tackled with the reduction of the number of measured proxies by client. In [7], each client only probes one proxy and shares the information in a gossiping way on an overlay network of clients. It uses distributed cooperation among clients to probe all the proxies without using brute-force. The limitation of this work is the information freshness, the time elapsed since the last probe of a proxy. Both the low probe redundancy (one per client) and the gossiping protocol can have an important impact on the information freshness, especially in large networks.
In proxy selection, some works do not aim to achieve a complete visibility matrix, they consider that partial visibility is sufficient. Again, the reason is the reduction in the number of measured proxies per client to scale well in large networks. For example, testing only those which are geographically near, topologically near or selecting a random set. In [8], clients follow a standalone strategy probing only a few randomly selected proxies. In [17], a distributed cooperative strategy is proposed, but clients only probe their currently selected proxy and two randomly selected proxies. Then they share the results with nearby proxies and assume that what their ’similar’ neighbors have measured is also valid for them. In these cases, solutions are scalable but clients have a very reduced visibility of available proxies, a sparse visibility matrix, that may lead to inadequate informed proxy selection.
In this monitoring for the proxy selection problem, some simple estimation techniques are used to address the issue of information freshness. In [7], a stochastic history-based approach is used to update the information, and in [17] an approach based on similarity with other clients. However, none of these real implementation and practical testing works use prediction techniques to deal with the missing values. The missing values is a major problem in proposals with partial visibility and in distributed systems with problems in disseminating the monitored samples.
In other related research problems and use cases (e.g., the prediction of the QoS of web services or the IP traffic), some interesting works propose to use prediction techniques to forecast future values. For example in [20], deep learning (specifically a deep belief network) is applied to predict IP traffic. While the results are accurate, the computational cost is such that predictions cannot be carried out in the client nodes, but in dedicated and centralized equipment that needs to be accessed also through the network, adding additional traffic and delays. Zhang et al. [21] uses a Radial Basis Function Neural Network to predict the response time of web services. An interesting feature of this work is online learning, in other words, the model is dynamically updated during use. These works use a time series prediction approach, but they do not address the limitations of the partial visibility and also the missing values.
Collaborative filtering is another estimation technique that is computationally much lighter, feasible to be carried out in regular devices like the user computers running the web clients. Collaborative filtering has already been applied in a number of similar problems, yet not to monitor and select the best proxy to access the web in a community network. It is used to overcome the limitations of the partial visibility and the missing values. In [22], a collaborative filtering algorithm is proposed to recommend cloud services. It is based in Spearman correlation coefficient among the vectors of probing results from each client. Additionally, to carry out the estimations, each client only considers those other clients that are geographically near. [23] uses a mixed method in which the actual QoS measurements are combined with user preferences (e.g., price) to select the best web service provider for each user. It is based in Pearson correlation coefficient. Finally, to recommend IoT services in a large scale industrial environment, [24] uses another mechanism based on the Kernel Least Mean Square (KLMS), which is computationally very demanding. In general, these works have limited applicability because they tend to fail in considering computing overhead, require dedicated equipment and/or lack of accuracy.
Matrix factorization is a subset of techniques for collaborative filtering that has been successfully employed to estimate the full visibility matrix from sparse measurements (partial visibility), predicting the missing values. Here we review some proposal that have been applied to estimate QoS metrics of certain types of web services. A first proposal, reference [10] does not meet the restriction to be carried out only in the client side, since it uses matrix factorization on an aggregation of both client and proxy values, thus requiring modifications to the infrastructure, unadvisable in community networks. Zheng et al. [22] proposes a modified collaborative filter so that the prediction considers measurements by both other similar clients and other nearby ones (in the topological sense). Chen et al. [25] uses the same dataset as [12], complementing QoS information with coarse-level location data, like country or Internet Autonomous System (AS) Number. While it is interesting to select a web service provider at a worldwide scale, this information is not helpful in a community network in which all nodes will likely belong to the same country and a very few, closely located ASs. Furthermore, the encoding used is computationally demanding. Zhang et al. [26] propose another modified collaborative filter to take advantage of the temporal evolution of the values in the visibility matrix to predict the missing values. Finally, Zhu et al. [12] proposes a matrix factorization algorithm that also considers the temporal evolution of the QoS metric. This proposal features two relevant contributions: The algorithm is prepared for online learning (i.e., each time a new measurement is made, the model is updated with that measurement only), which makes it computationally very affordable, and it takes into consideration the time evolution (i.e., recent similarities with other clients are more relevant than past similarities).
To the best of our knowledge, there are no works in the literature where the visibility matrix is estimated with matrix factorization algorithms in the problem of monitoring and selecting the best proxy to access the web in community networks.
3. Matrix Factorization Algorithms to Estimate Unknown Proxy Response Times
Let us consider a set of c clients and p proxies in a community network. If, periodically, each client probed a subset of proxies (i.e., less than p) and shared the collected results with the rest of clients, each client could create a visibility matrix of measurements . Each item in the matrix would be the collected metric value (in our case, the response time) between client and proxy . This item will be known if client has successfully probed proxy , or an unknown value otherwise. It can be reasonably assumed that there will be a significant correlation between certain parts of the matrix, as clients that have similar connection conditions will likely experience similar response times from a given proxy (e.g., if clients share most of the path to the proxy). This can be exploited by matrix factorization algorithms by detecting similarities from actual measurements that can be used to estimate the missing values of matrix M. For example, the simple matrix factorization method [27] searches for matrices and so that matrix with rank d minimizes the euclidean distance to the target matrix (M), computed using only known values in the latter. Therefore, each item with unknown value will be estimated by . The main steps of this process are illustrated graphically in Figure 1a, which shows how some response time measurements are taken by issuing HTTP probes and waiting for the full response, and Figure 1b, which uses a partial matrix to apply the factorization algorithm in order to obtain a full, estimated matrix for the metric. In the factoring matrices, denote the latent factors.
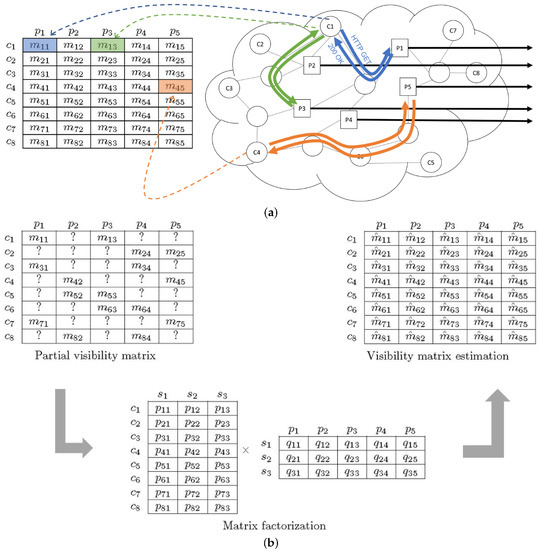
Figure 1.
Illustrative representation of the estimation process: (a) Response time measurement for some client/proxy pairs, and (b) estimation of the full matrix using matrix factorization.
This paper evaluates three different algorithms in order to estimate, in a community network, the response times offered by web proxies to clients, from just a subset of actual measurements of client/proxy response times. The evaluated algorithms are the following:
- PMF (probabilistic matrix factorization) [28] is a widely-employed matrix factorization algorithm that performs well on large, sparse and very imbalanced datasets. This algorithm can be used to estimate the unknown values of the visibility matrix at a given time using only the measures that are present in the matrix at that time (i.e., the metric values collected by clients in the last round of probes). Estimations are thus made without taking into account the past temporal evolution of values in the visibility matrix (i.e., the metric values collected by clients in previous rounds of probes).
- NTF (non-negative tensor factorization) [26] can leverage the past temporal evolution of values in the visibility matrix to estimate the unknown values at a given time. This algorithm uses three-dimensional tensors (i.e., arrays) to represent the evolution of matrix values over time and follows a tensor factorization model with non-negative constraints to obtain estimations. This approach makes NTF a computationally demanding algorithm.
- AMF (adaptive matrix factorization) [12] can also make estimations of unknown values of the visibility matrix at a given time taking into account the past temporal evolution of matrix values. This algorithm generates an estimation model for the visibility matrix obtained after the last round of probes based on the model that was generated for the visibility matrix corresponding to the previous round of probes, which is updated using a Box-Cox transformation [29] of the metric values obtained in the last round of probes. In this way, AMF can be seen as an iterative version of matrix factorization algorithms that is less computationally demanding than NTF.
The implementation of AMF used in this paper is taken from [30], while those for NTF and PMF are available in [31].
4. Experimental Design
4.1. Dataset Generation
In order to test the feasibility of matrix factorization for the estimation of response times offered by web proxies, a community network was emulated over the PlanetLab testbed [32]. To do so, several virtual nodes where deployed in Planetlab servers distributed across Europe and the Middle East, 8 of them acting as web clients and 5 others with simple web proxy software [33] that allowed them to act as web proxies. The location of the different nodes is described in Table 2, where it can be seen that there are three (somewhat vague) geographical clusters (around western, northern and eastern Europe) that might cause that a given client perceives better response times from some proxies than others, though of course that can depend more on the quality of links than the distance or number of hops, as it also happens in community networks. It is true that community networks have a larger number of both clients and proxies, and thus the size of this dataset is small in those dimensions, but large in the number of time slices, which would allow to reflect on the benefits of matrix factorization methods that take into account the evolution of past measurements. The dataset is not large, yet is generated in realistic, non-manipulated conditions, and thus we consider it is valid to study the feasibility and potential of matrix factorization to estimate proxy response times.
Table 2.
Client and proxy distribution in PlanetLab nodes.
Each client probed all proxies every 10 s during two days. In all cases, all probes requested the same document [34]. Every time the download was completed, the response time was registered (in milliseconds), considering the time elapsed from the moment the client sends the request until the last byte of the response is received. Response time can be considered an adequate performance metric for web proxy selection in community networks since it is strongly correlated to the proxy performance [8]. Moreover, it is able to detect three different types of bottlenecks: Congested network path between the client and the proxy, high load of the web proxy, and saturated Internet access [8].
Table 3 collects the actual number of response time measurements taken by each client from each proxy, which were included in the dataset available at [35]. In all cases it can be observed that not all the 17,280 requests were successful, as it could be expected. Most of the failures are due to communication problems between the client and the proxy (e.g., TCP connection times out or HTTP response is not 200-OK). In some other cases, the proxy had problems in retrieving the requested document from the original server. This type of problem is also present in community networks, so it is fine that they get reflected in the dataset as missing measurements. It should be noted that a failure in taking one measurement does not stop clients to continue probing and registering subsequent time response measurements.
Table 3.
Number of measurements of response time actually collected for each client/proxy pair.
Figure 2 shows the distribution of measurements for each client/proxy pair. All values of these boxplots are listed in the Appendix A Clearly, they are not normally distributed in most of the cases. It can also be seen that dispersion is significant. In principle, this suggests that the estimation of response times will not be a trivial task.
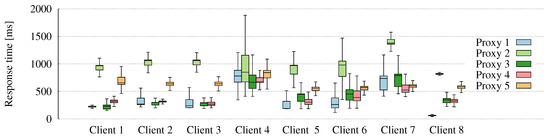
Figure 2.
Boxplots describing the distribution of response time measurements collected for each client/proxy pair.
This dataset can be seen as a series of 17,280 matrices of response time values (though some may be missing). The purpose of this research is to show that if, at a give time slice only a subset of the matrix values were measured, the others could be estimated. The dataset could also be seen as a set of 40 time series (one for each client-proxy pair) of 17,280 values each (some may miss). While the aim of this research is not employing time series to do forecasting, we performed some analysis of these series to better understand the underlying phenomena. Dickey–Fuller tests confirmed all time series are stationary, and a seasonal decomposition found no seasonal component in them.
4.2. Baseline Algorithm and Estimation Accuracy Metric
The evaluated matrix factorization algorithms should be compared to a simple algorithm with negligible computational cost, in order to assess the potential benefit of introducing them. In this paper, we propose that each client that wants to estimate the response time offered by proxy , i.e., to have a value for , will simply average all the known measurements taken by other clients of the same proxy . This algorithm is simple, it makes sense as some of the measurements taken by other clients will be very good estimators, yet it ignores the information that not all other clients will be equally similar to client . Therefore, if matrix factorization algorithms exploit well the existing information, it is expected that they will achieve superior accuracy than the baseline.
Accuracy will be measured using the mean average error (MAE) between estimations and actual values. This metric is commonly used in the literature (e.g., [10,11]) to compare estimation algorithms in problems similar to the one dealt with in this paper.
4.3. Experiments Carried Out
In this paper, we want to explore how the number of known values in the visibility matrix affects the estimation. As our dataset is not generated from a very large network, we have carried out three sets of experiments. In the first one, each client probes every 10 s two randomly chosen proxies out of the five existing ones. It should be noted that the same client may probe different proxies in the next probing round, 10 s later. In the second and third sets of experiments, clients probe three and four (out of five) proxies, respectively. This design allows us to test estimations using visibility matrix with 40%, 60% and 80% of known values (densities), while the rest of the items are estimated and compared to the actual values to compute the accuracy.
Besides, to eliminate the variance introduced by the random selection of the proxies that each client should probe, experiments have been repeated five times for each density. Results reported will show the average and standard deviation of MAE across these five experiments. If the latter is low it will allow us to conclude that the selection of which particular proxies to probe at each time slice has no significant impact.
Finally, it should be noted that each of the evaluated algorithms has some parameters that control their behavior. As this study focuses on exploring the feasibility of the approach, only a limited heuristic optimization of them was carried out. The values for these parameters were: For AMF, the dimensionality of latent factors was 10, the learning rate was 0.8, the regularization factor was 0.0003, the maximum number of iterations was 50, convergence rate was 0.006 and the weight of exponential moving average was 0.3; for NTF, the dimensionality of latent factors was 10, the regularization factor was 40 and the maximum number of iterations was 300; finally, for PMF, the dimensionality of latent factors was 10, the learning rate was 0.8, the regularization factor was 0, the initial learning rate was 0.01 and the maximum number of iterations was 600.
5. Results
Table 4 shows the results obtained after applying the methods described in Section 3 and Section 4.2 on the dataset described in Section 4.1. For each method and density, the average and standard deviation are shown, with low standard deviations showing no significant impact of the particular choice of proxies to probe at each time slice. It can be seen that AMF performs best, with a small error and low variability, which shows the potential of matrix factorization algorithms to estimate the response times of unknown proxies from a given client using some available measurements of other client/proxy pairs that have been shared by other clients. The fact that this method performs a pre- and post-transformation of the data to accommodate data coming from a largely asymmetric distribution to methods better suited to normally distributed sources is probably the main reason why AMF beats the competitors. Furthermore, the result is noticeably better than the baseline, justifying the larger computational cost (it should be noted that the cost of probing and distributing measurements among neighbors is the same for any of the evaluated methods, including the baseline).
Table 4.
Average and standard deviation of the mean average error (MAE) for the baseline algorithm as well as probabilistic matrix factorization (PMF), non-negative tensor factorization (NTF) and adaptive matrix factorization (AMF), with different densities of sampling of the dataset. Values are in milliseconds.
It is also worth noting how the results of PMF are not very good. This is probably due to the fact that discovering latent factors of similarity between clients and between proxies with such a small number of them is better performed when considering past data and its evolution over time, as both AMF and NTF do.
Table 4 also allows to observe how increasing proxy sampling density slightly improves the performance of all the methods. With a larger number of client/proxy pairs that would allow to evaluate density starting from small values (around 5%), it is expected that the first increments would have a clearer impact on the estimation results [12]. Figure 3 shows a small interval of the estimations made at a client of the response time that would be obtained using a given proxy, illustrating AMF makes very accurate estimations and detects well the most relevant changes in response time.
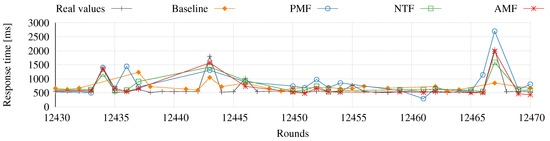
Figure 3.
Illustrative interval of estimation of response time of proxy 5 from client 6, using the matrix factorization and baseline algorithms, with 60% density.
In order to better understand the results, Table 5 and Table 6 detail the performance of AMF and the baseline algorithm for each client/proxy pair, for a 40% density (each time a client has to probe the proxies, it measures the response time of two of them out of the five, shares the measured results and estimates the response time of the remaining three). The observations made here are also valid for 60% and 80% densities. First of all, it can be observed that in all cases AMF is better than the baseline, justifying its choice. Searching more in detail, it can be seen from Figure 2 that clients 1–3 and 8 obtain more stable measurements from their probes. Besides, the measured response times have low values for proxies 1, 3 and 4. Observing the results of both methods, it can be seen that AMF makes very accurate estimations for these client/proxy pairs, while the baseline makes worse estimations. This is due to the fact that AMF is learning the relative importance of the information shared by neighbor clients, taking into account only those which are similar to the one making the estimation.
Table 5.
Average MAE obtained by AMF for each client/proxy pair, with a 40% density. Values are in milliseconds.
Table 6.
Average MAE obtained by the baseline algorithm for each client/proxy pair, with a 40% density. Values are in milliseconds.
Interestingly, a weak point of matrix factorization algorithms is the estimation of client/proxy pairs with response times in a range that hardly overlaps with the rest of the measurements. Observe in Figure 2 how proxy 2 offers client 7 response times much higher than it does to other clients, or how client 8 receives from proxy 1 extremely faster responses than other clients. As a consequence, AMF cannot estimate these pairs so accurately, yielding higher MAEs. In a similar fashion, client 4 estimations are accurate yet worse than those achieved for other clients (with both AMF and the baseline). This is because for proxies 1 and 3–5 the response times are higher than what all others clients observe, while in the case of proxy 2 the measurements are far more variable and noisy. It should be noted that this situation can always be present, but it would be less likely if the number of proxies and clients was higher.
Finally, observing the overall behavior for proxy 2 can also lead to some interesting reflections. This proxy has the highest range of response times, as seen in Figure 2. This is problematic if at a given polling time the various clients measure quite different times between them, which hinders the algorithm from learning the structure of the similarities between clients. This is the reason why AMF has here results which are closer to the baseline, with accuracy being in any case more variable for both methods. Again, with more clients and proxies, it would be more likely to detect some similarities between clients even for the most erratic proxies, thus improving the predictions.
6. Conclusions
In community networks, access to the web is normally achieved through proxies contributed by other members of the community. Workload and link quality affect the response times that these proxies may offer, and thus their selection is very relevant to the final perception of users. While each client could periodically probe all proxies to select the best one, this paper has proposed an approach in which each client probes only a (random) fraction of the available proxies, shares the measurements with other clients and builds an incomplete matrix of response times that can be used for the estimation of the remaining values.
With this aim, we have evaluated several matrix factorization algorithms, which have been successfully used in other domains. These algorithms have been compared to a simple baseline, which averages the response times offered by a target proxy to other clients, without regard to potential similarities between clients. The results obtained confirm the feasibility of the approach, as the AMF algorithm clearly outperforms the baseline, justifying its computational cost, which is nevertheless low as this algorithm is incremental and does not require to build a new model from scratch every time a new measurement is taken. The analysis of the results also points out how this type of algorithm is stronger when there is a structure (the latent factor) that reflects the similarities between clients concerning the response times they measure from the different proxies, but can perform worse when estimating client/proxy pairs that are very different from the rest. In the discussion of these findings, we mentioned that a larger dataset would allow to draw more solid conclusions on sampling density and achieve more solid generalization. Therefore, work in the near future will involve the generation of a larger dataset, with many more clients and proxies, to validate the results, and the artificial manipulation of behavior of some proxies to check if service degradation can be correctly detected by all clients. Future work also includes the evaluation of different algorithms (within the context of load balancing, reference [36] reviews some popular ones) that may be employed by each client to decide the web proxy it uses at a given time, based on the visibility matrix obtained with matrix factorization algorithms.
Author Contributions
Conceptualization, M.L.B.-L., E.G.-S., R.M.-P.; Investigation, D.B.-Q.; Formal analysis, D.B.-Q., M.L.B.-L., E.G.-S.; Supervision, M.L.B.-L., E.G.-S.; Writing—original draft preparation, E.G.-S., M.L.B.-L., R.M.-P. All authors have read and agreed to the published version of the manuscript.
Funding
This research was partially funded by European Regional Development Fund and the Spanish State Research Agency of the Spanish Ministry of Science, Innovation and Universities under project grants TIN2017-85179-C3-2-R and TIN2016-77836-C2-2-R and by the Catalan government under contract AGAUR SGR 990.
Conflicts of Interest
The authors declare no conflict of interest. The funders had no role in the design of the study; in the collection, analyses, or interpretation of data; in the writing of the manuscript, or in the decision to publish the results.
Appendix A
Boxplots are a standardized way of displaying the distribution of data based on a five number summary: Minimum, first quartile (), median (), third quartile () and maximum. maximum is defined as and minimum as where the Interquartile Range () is the range from to .
Table A1.
Numerical values of boxplots depicted in Figure 2. For each cell from top to bottom: Maximum, , , and minimum. Values are in milliseconds.
Table A1.
Numerical values of boxplots depicted in Figure 2. For each cell from top to bottom: Maximum, , , and minimum. Values are in milliseconds.
| Proxy 1 | Proxy 2 | Proxy 3 | Proxy 4 | Proxy 5 | |
|---|---|---|---|---|---|
| Client 1 | 252 | 1103 | 365 | 412 | 955 |
| 230 | 974 | 254 | 342 | 758 | |
| 216 | 967 | 230 | 320 | 656 | |
| 215 | 888 | 180 | 295 | 626 | |
| 208 | 845 | 154 | 272 | 560 | |
| Client 2 | 560 | 1211 | 378 | 359 | 755 |
| 379 | 1071 | 302 | 326 | 667 | |
| 270 | 1061 | 301 | 316 | 639 | |
| 258 | 977 | 251 | 304 | 608 | |
| 218 | 930 | 226 | 293 | 579 | |
| Client 3 | 570 | 1204 | 381 | 391 | 767 |
| 352 | 1071 | 296 | 303 | 670 | |
| 240 | 1062 | 292 | 269 | 640 | |
| 205 | 982 | 239 | 244 | 605 | |
| 203 | 938 | 211 | 215 | 573 | |
| Client 4 | 1205 | 1882 | 1162 | 881 | 1087 |
| 883 | 1157 | 797 | 749 | 882 | |
| 780 | 848 | 664 | 675 | 842 | |
| 668 | 673 | 553 | 661 | 745 | |
| 561 | 438 | 433 | 617 | 677 | |
| Client 5 | 514 | 1223 | 659 | 488 | 672 |
| 319 | 977 | 455 | 354 | 578 | |
| 191 | 970 | 446 | 305 | 555 | |
| 189 | 813 | 319 | 264 | 515 | |
| 185 | 731 | 251 | 220 | 484 | |
| Client 6 | 652 | 1469 | 823 | 781 | 686 |
| 382 | 1051 | 534 | 510 | 591 | |
| 261 | 979 | 452 | 388 | 568 | |
| 202 | 772 | 341 | 329 | 527 | |
| 117 | 633 | 245 | 239 | 496 | |
| Client 7 | 1161 | 1575 | 1151 | 814 | 696 |
| 781 | 1445 | 813 | 616 | 622 | |
| 735 | 1377 | 788 | 525 | 602 | |
| 527 | 1358 | 587 | 484 | 572 | |
| 413 | 1315 | 475 | 418 | 548 | |
| Client 8 | 81 | 846 | 484 | 438 | 679 |
| 66 | 825 | 370 | 353 | 603 | |
| 59 | 816 | 343 | 325 | 584 | |
| 56 | 811 | 294 | 296 | 552 | |
| 51 | 804 | 256 | 268 | 528 |
References
- Braem, B.; Blondia, C.; Barz, C.; Rogge, H.; Freitag, F.; Navarro, L.; Bonicioli, J.; Papathanasiou, S.; Escrich, P.; Baig Viñas, R.; et al. A case for research with and on community networks. ACM SIGCOMM Comput. Commun. Rev. 2013, 43, 68–73. [Google Scholar] [CrossRef]
- Maccari, L. An analysis of the Ninux wireless community network. In Proceedings of the 9th IEEE International Conference on Wireless and Mobile Computing, Networking and Communications (WiMob 2013), Lyon, France, 7–9 October 2013; pp. 1–7. [Google Scholar] [CrossRef]
- Initiative für Freie Netze. Available online: https://www.funkfeuer.at (accessed on 7 October 2019).
- Vega, D.; Baig, R.; Cerdà-Alabern, L.; Medina, E.; Meseguer, R.; Navarro, L. A technological overview of the guifi.net community network. Comput. Netw. 2015, 93, 260–278. [Google Scholar] [CrossRef]
- Dimogerontakis, E.; Meseguer, R.; Navarro, L. Internet Access for All: Assessing a Crowdsourced Web Proxy Service in a Community Network. In Proceedings of the 18th Passive and Active Measurement International Conference (PAM), Sydney, Australia, 30–31 March 2017; pp. 72–84. [Google Scholar] [CrossRef]
- Maccari, L.; Cigno, R.L. A week in the life of three large Wireless Community Networks. Ad Hoc Netw. 2015, 24, 175–190. [Google Scholar] [CrossRef]
- Dimogerontakis, E.; Neto, J.; Meseguer, R.; Navarro, L.; Vega, L. Client-side routing-agnostic gateway selection for heterogeneous Wireless Mesh Networks. In Proceedings of the 14th IFIP/IEEE Symposium on Integrated Network and Service Management (IM 2017), Lisbon, Portugal, 8–12 May 2017. [Google Scholar] [CrossRef]
- Batbayar, K.; Dimogerontakis, E.; Meseguer, R.; Navarro, L.; Medina, E.; Santos, R.M. The RIMO gateway selection approach for mesh networks: Towards a global Internet access for all. In Proceedings of the 12th Conference on Ubiquitous Computing and Intelligence (UCAmI 2018), Punta Cana, Dominican Republic, 4–7 December 2018. [Google Scholar] [CrossRef]
- Allman, M. On the performance of middleboxes. In Proceedings of the 3rd ACM SIGCOMM Internet Measurement Conference, IMC, Miami Beach, FL, USA, 27–29 October 2003; pp. 307–312. [Google Scholar] [CrossRef]
- Lo, W.; Yin, J.; Deng, S.; Li, Y.; Wu, Z. An extended matrix factorization approach for QoS prediction in service selection. In Proceedings of the 9th IEEE International Conference on Services Computing (SCC’12), Honolulu, HI, USA, 24–29 June 2012; pp. 162–169. [Google Scholar] [CrossRef]
- Zheng, Z.; Ma, H.; Lyu, M.R.; King, I. Collaborative web service QoS prediction via neighborhood integrated matrix factorization. IEEE Trans. Serv. Comput. 2013, 6, 289–299. [Google Scholar] [CrossRef]
- Zhu, J.; He, P.; Zheng, Z.; Lyu, M.R. Online QoS prediction for runtime service adaptation via Adaptive Matrix Factorization. IEEE Trans. Parallel Distrib. Syst. 2017, 28, 2911–2924. [Google Scholar] [CrossRef]
- Boushaba, M.; Hafid, A. Best path to best gateway scheme for multichannel multi-interface wireless mesh networks. In Proceedings of the 2011 IEEE Wireless Communications and Networking Conference (WCNC 2011), Cancun, Quintana Roo, Mexico, 28–31 March 2011; pp. 689–694. [Google Scholar] [CrossRef]
- Salsano, S.; Patriarca, F.; Presti, F.L.; Ventre, P.L.; Gentile, V.M. Accurate and Efficient Measurements of IP Level Performance to Drive Interface Selection in Heterogeneous Wireless Networks. IEEE Trans. Mob. Comput. 2018, 17, 2223–2235. [Google Scholar] [CrossRef]
- Abujoda, A.; Dietrich, D.; Papadimitriou, P.; Sathiaseelan, A. Software-defined wireless mesh networks for internet access sharing. Comput. Netw. 2015, 93, 359–372. [Google Scholar] [CrossRef]
- Ko, B.J.; Liu, S.; Zafer, M.; Wong, H.Y.S.; Lee, K.W. Gateway selection in hybrid wireless networks through cooperative probing. In Proceedings of the 2013 IFIP/IEEE International Symposium on Integrated Network Management (IM 2013), Ghent, Belgium, 27–31 May 2013; pp. 352–360. [Google Scholar]
- Batbayar, K.; Meseguer, R.; Dimogerontakis, E.; Navarro, L.; Sandre, R. Collaborative informed gateway selection in large-scale and heterogeneous networks. In Proceedings of the 16th IFIP/IEEE Symposium on Integrated Network and Service Management (IM 2019), Arlington, VA, USA, 8–12 April 2019; pp. 337–345. [Google Scholar]
- Micholia, P.; Karaliopoulos, M.; Koutsopoulos, I.; Navarro, L.; Viñas, R.B.; Boucas, D.; Michalis, M.; Antoniadis, P. Community Networks and Sustainability: A Survey of Perceptions, Practices, and Proposed Solutions. IEEE Commun. Surv. Tutor. 2018, 20, 3581–3606. [Google Scholar] [CrossRef]
- Baig, R.; Roca, R.; Freitag, F.; Navarro, L. guifi.net, a crowdsourced network infrastructure held in common. Comput. Netw. 2015, 90, 150–165. [Google Scholar] [CrossRef]
- Nie, L.; Jiang, D.; Guo, L.; Yu, S. Traffic matrix prediction and estimation based on deep learning in large-scale IP backbone networks. J. Netw. Comput. Appl. 2016, 76, 16–22. [Google Scholar] [CrossRef]
- Zhang, P.; Wang, L.; Li, W.; Leung, H.; Song, W. A Web Service QoS Forecasting Approach Based on Multivariate Time Series. In Proceedings of the 24th IEEE International Conference on Web Services (ICWS 2017), Honolulu, HI, USA, 25–30 June 2017; pp. 146–153. [Google Scholar] [CrossRef]
- Zheng, X.; Xu, L.D.; Chai, S. QoS Recommendation in Cloud Services. IEEE Access 2017, 5, 5171–5177. [Google Scholar] [CrossRef]
- Vadivelou, G. Collaborative filtering based web service recommender system using users’ satisfaction on QoS attributes. In Proceedings of the 2016 International Conference on Inventive Computation Technologies (ICICT 2016), Coimbatore, India, 26–27 August 2016; Volume 3, pp. 1–5. [Google Scholar] [CrossRef]
- Luo, X.; Liu, J.; Zhang, D.; Chang, X. A large-scale web QoS prediction scheme for the Industrial Internet of Things based on a kernel machine learning algorithm. Comput. Netw. 2016, 101, 81–89. [Google Scholar] [CrossRef]
- Chen, L.; Xie, F.; Zheng, Z.; Wu, Y. Predicting Quality of Service via Leveraging Location Information. Complexity 2019, 2019, 4932030. [Google Scholar] [CrossRef]
- Zhang, W.; Sun, H.; Liu, X.; Guo, X. Temporal QoS-aware Web Service Recommendation via Non-negative Tensor Factorization. In Proceedings of the 23rd International Conference on World Wide Web (WWW’14), Seoul, Korea, 7–11 April 2014; ACM: New York, NY, USA, 2014; pp. 585–596. [Google Scholar] [CrossRef]
- Koren, Y.; Bell, R.; Volinsky, C. Matrix Factorization Techniques for Recommender Systems. Computer 2009, 42, 30–37. [Google Scholar] [CrossRef]
- Salakhutdinov, R.; Mnih, A. Probabilistic Matrix Factorization. In Proceedings of the 20th International Conference on Neural Information Processing Systems (NIPS’07), Vancouver, BC, Canada, 3–6 December 2007; pp. 1257–1264. [Google Scholar]
- Sakia, R.M. The box-cox transformation technique: A review. J. R. Stat. Soc. Ser. D 1992, 41, 169–178. [Google Scholar] [CrossRef]
- AMF: Adaptive Matrix Factorization for Online QoS Prediction. Available online: https://github.com/wsdream/AMF (accessed on 7 October 2019).
- Towards Open Datasets and Source Code for Web Service Recommendation. Available online: https://github.com/wsdream/WS-DREAM (accessed on 7 October 2019).
- Chun, B.; Culler, D.; Roscoe, T.; Bavier, A.; Peterson, L.; Wawrzoniak, M.; Bowman, M. PlanetLab: An Overlay Testbed for Broad-coverage Services. ACM SIGCOMM Comput. Commun. Rev. 2003, 33, 3–12. [Google Scholar] [CrossRef]
- Singh, A. Lightweight HTTP, HTTPS, WebSockets Proxy Server in a Single Python file. Available online: https://github.com/abhinavsingh/proxy.py (accessed on 7 October 2019).
- OVH. 1 Mb file. Available online: http://ovh.net/files/1Mb.dat (accessed on 7 October 2019).
- Bores-Quijano, D.; Bote-Lorenzo, M.L.; Gómez-Sánchez, E.; Meseguer, R. Proxies’ Response Times Measured by Clients in an Emulated Community Network [Data Set]. Zenodo. Available online: http://dx.doi.org/10.5281/zenodo.3457189 (accessed on 18 December 2019). [CrossRef]
- Piórkowski, A.; Kempny, A.; Hajduk, A.; Strzelczyk, J. Load Balancing for Heterogeneous Web Servers. In International Conference on Computer Networks; Springer: Berlin/Heidelberg, Germany, 2010; pp. 189–198. [Google Scholar]
© 2020 by the authors. Licensee MDPI, Basel, Switzerland. This article is an open access article distributed under the terms and conditions of the Creative Commons Attribution (CC BY) license (http://creativecommons.org/licenses/by/4.0/).