An Automatic Diagnosis of Arrhythmias Using a Combination of CNN and LSTM Technology

 , and
, and
Abstract
1. Introduction
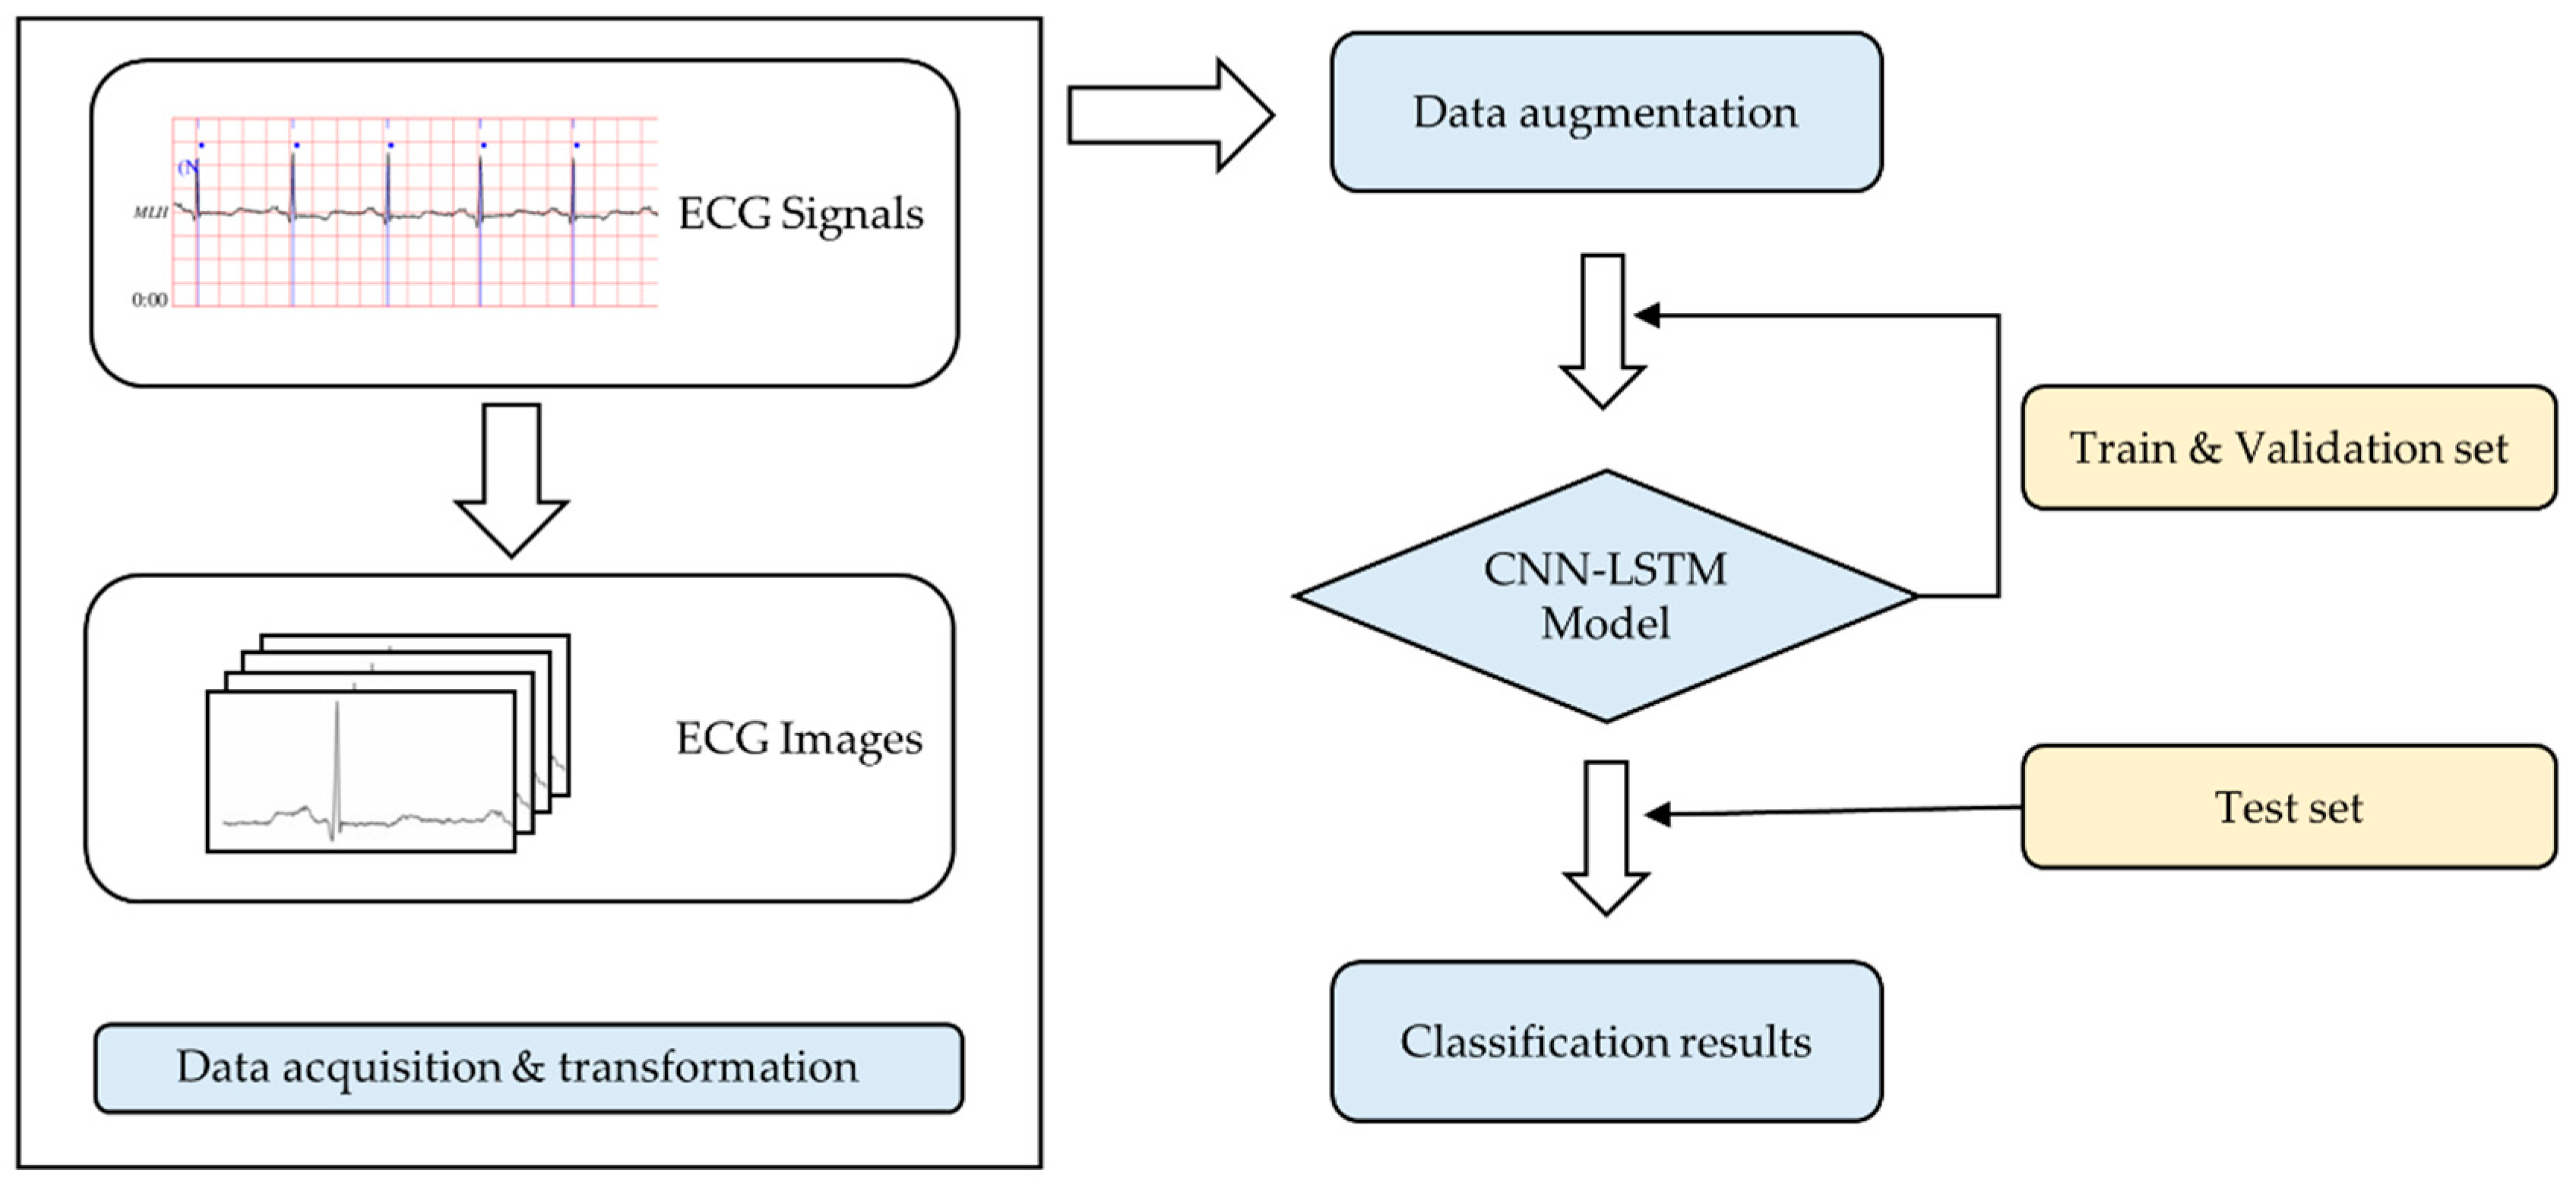
2. Materials and Methods
2.1. Data Preprocessing
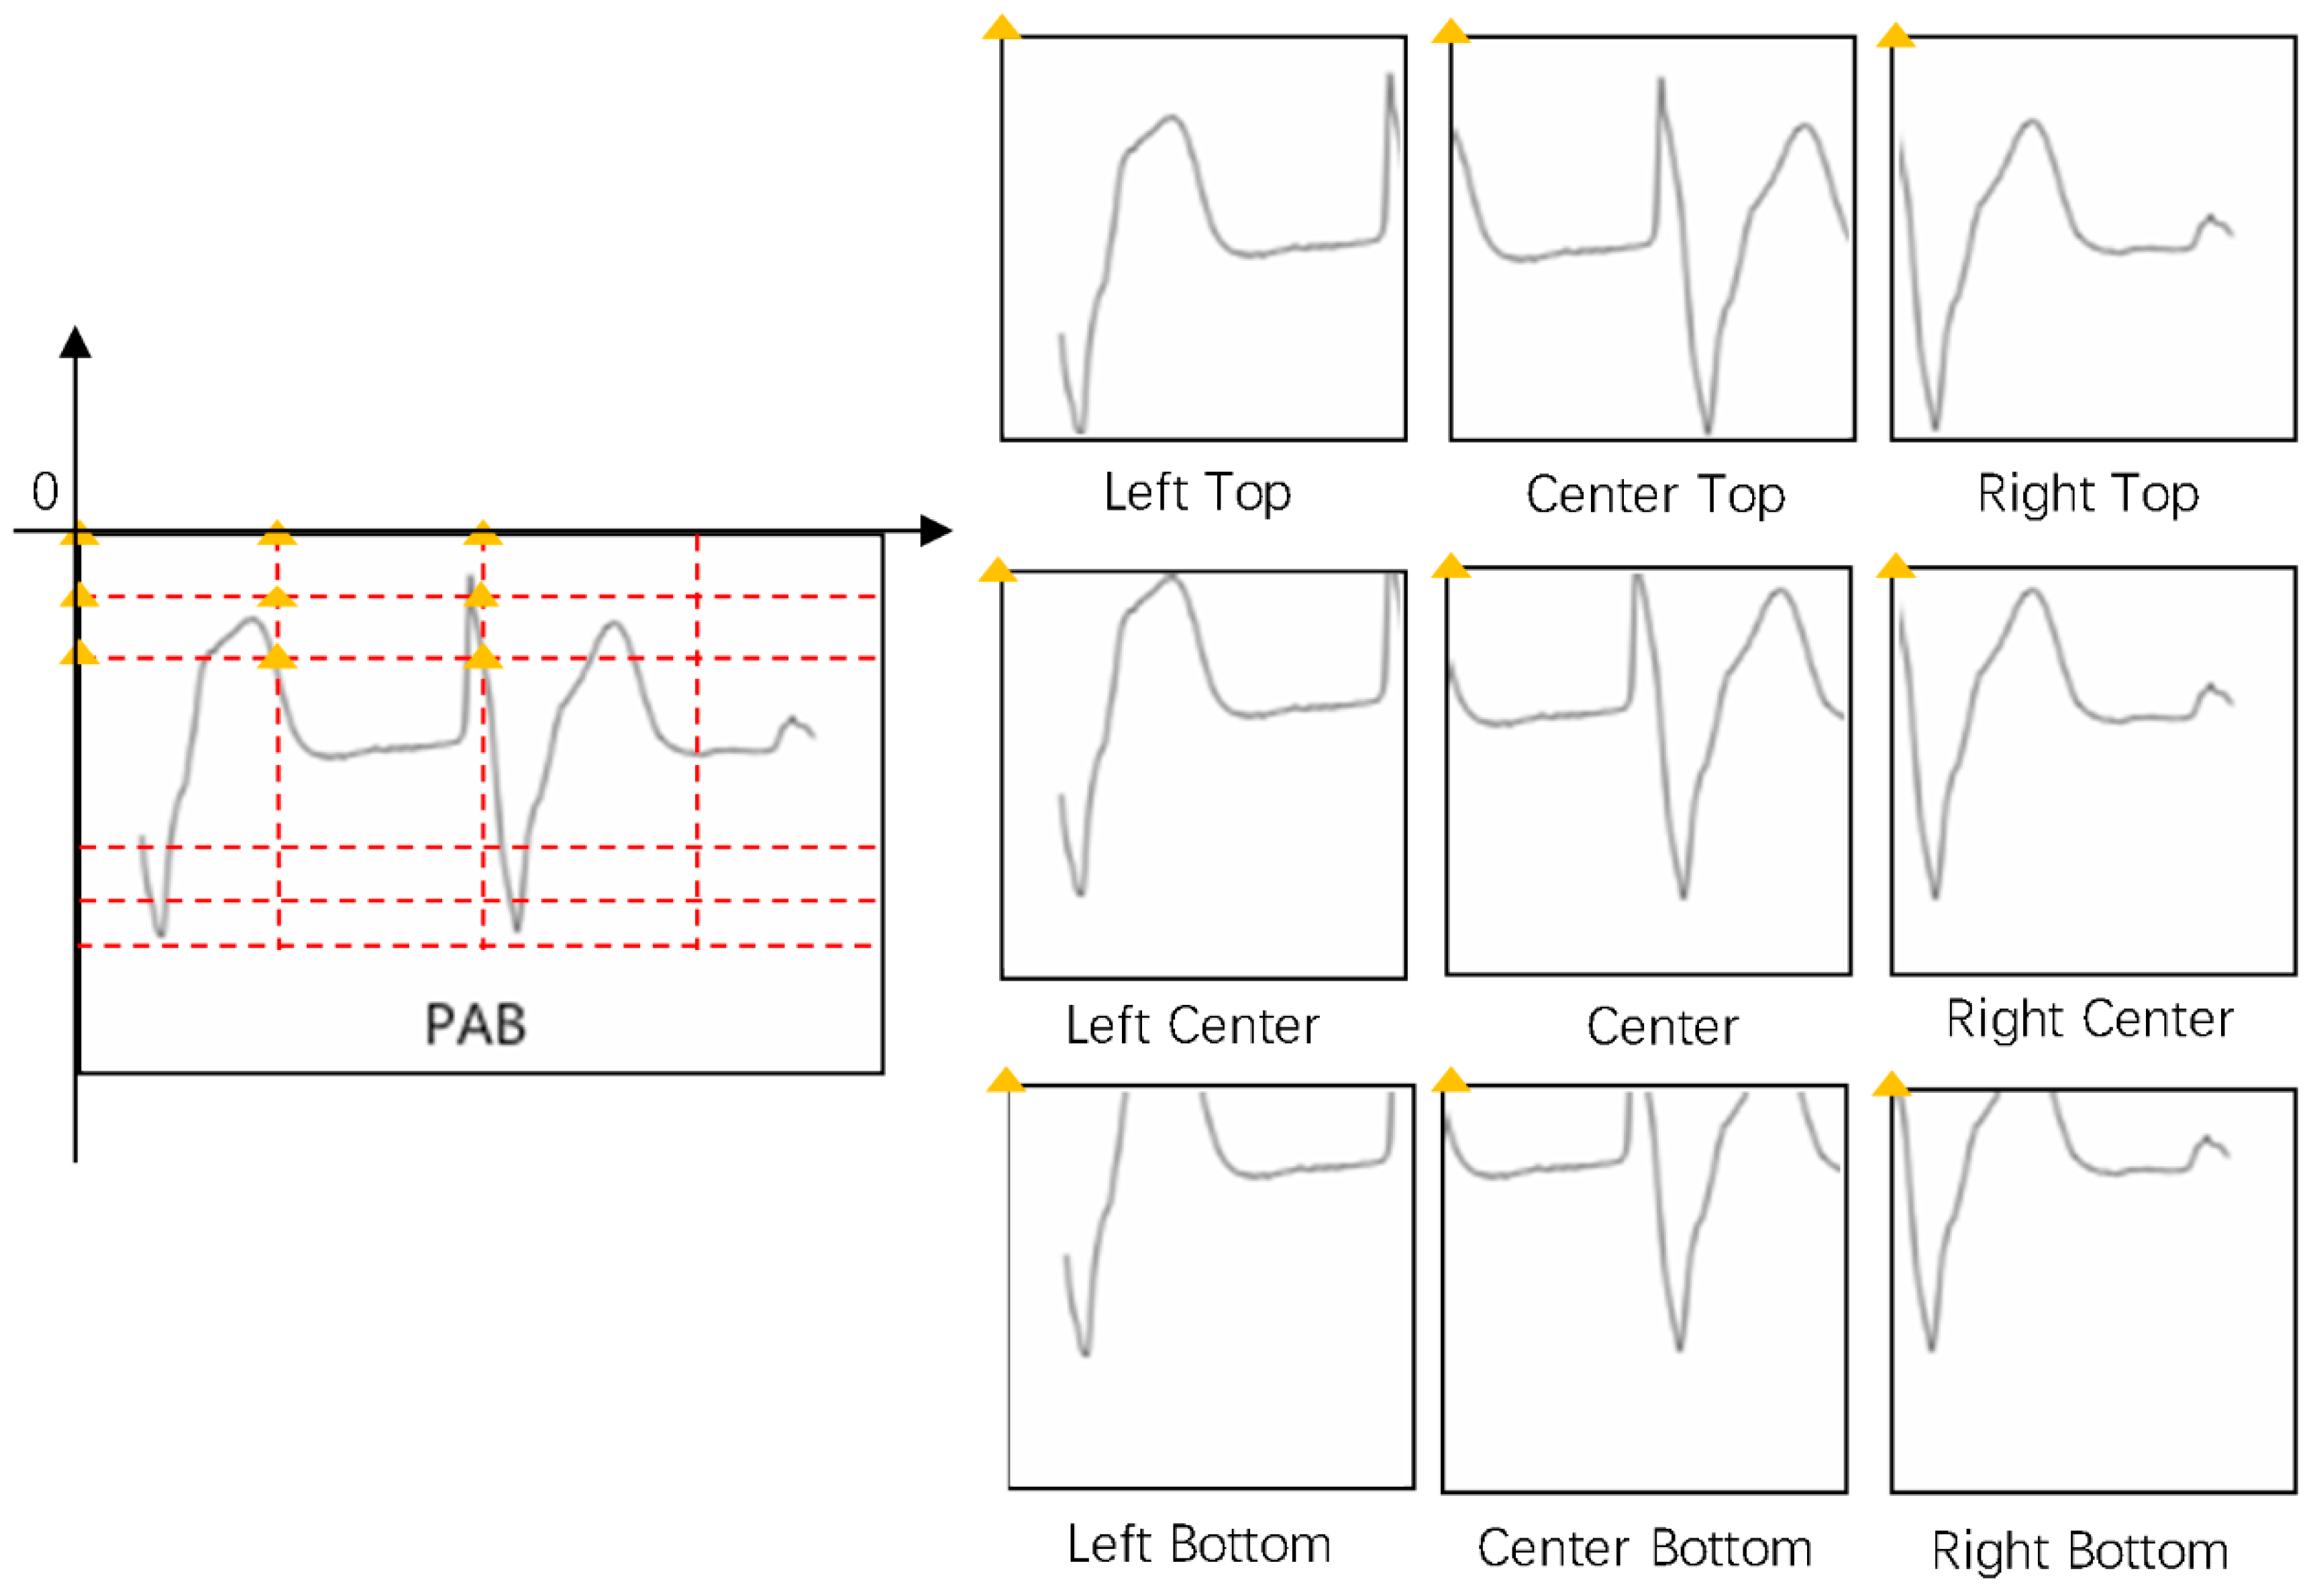
2.2. Data Augmentation
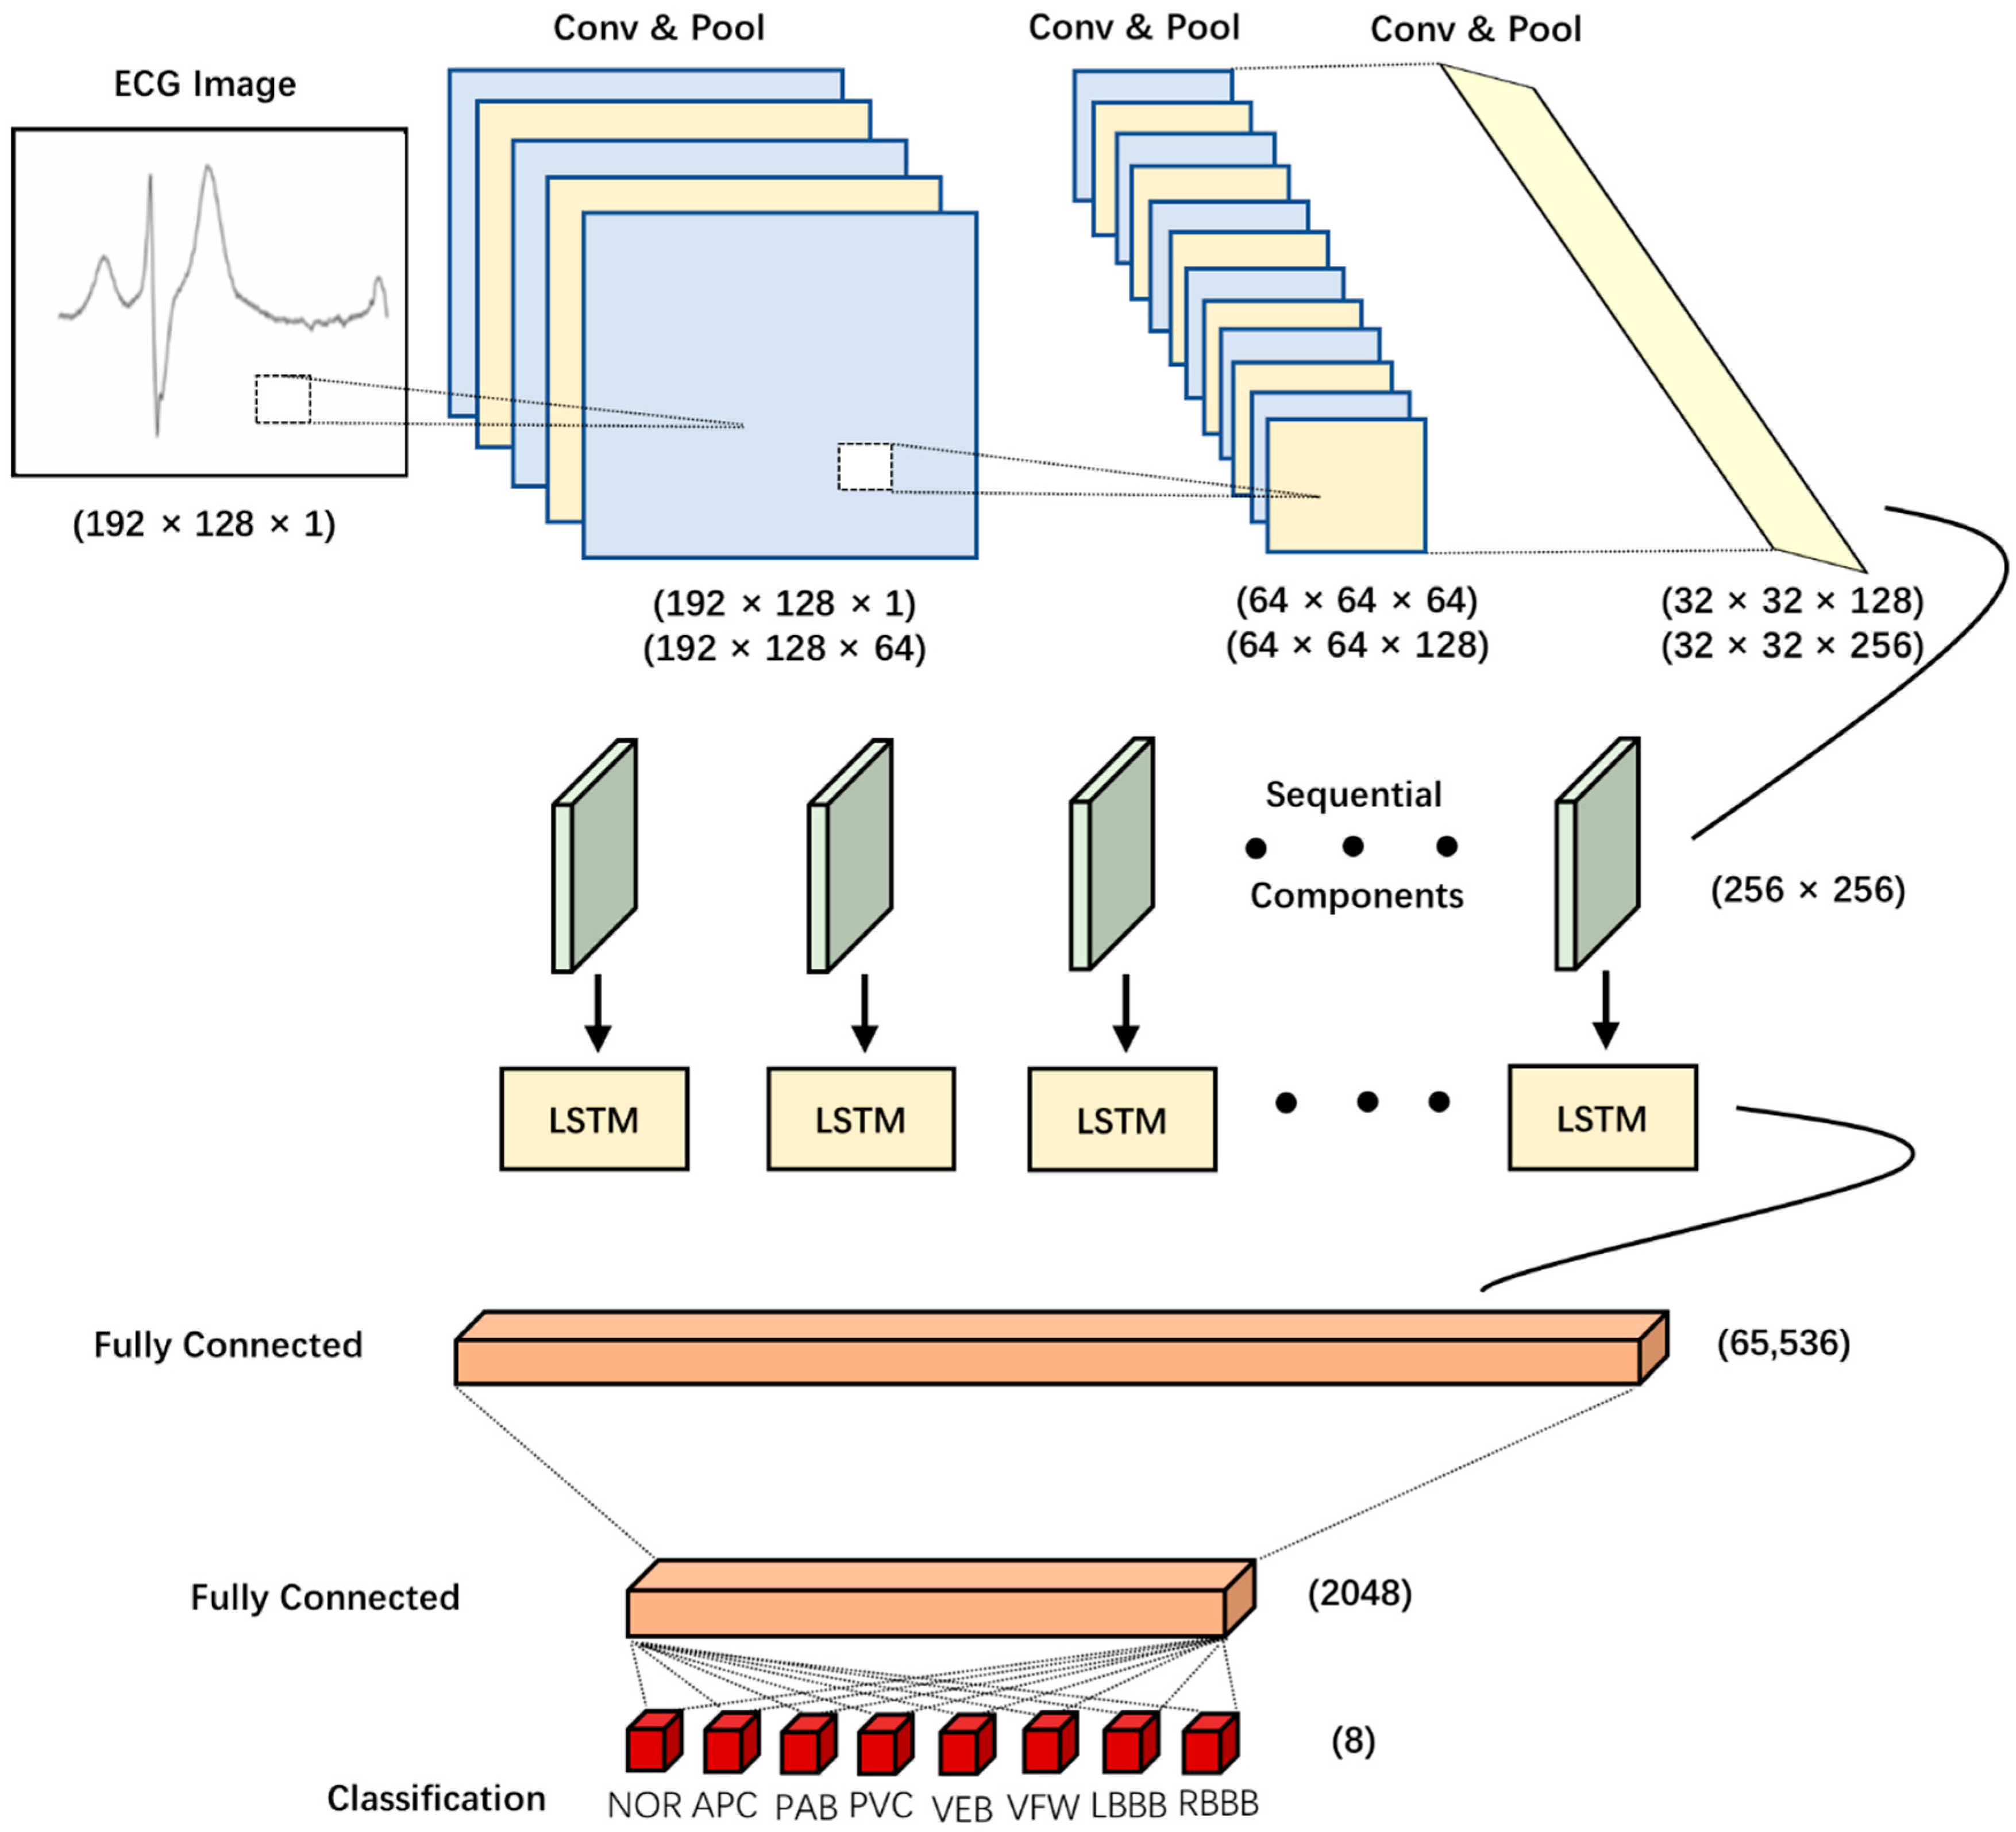
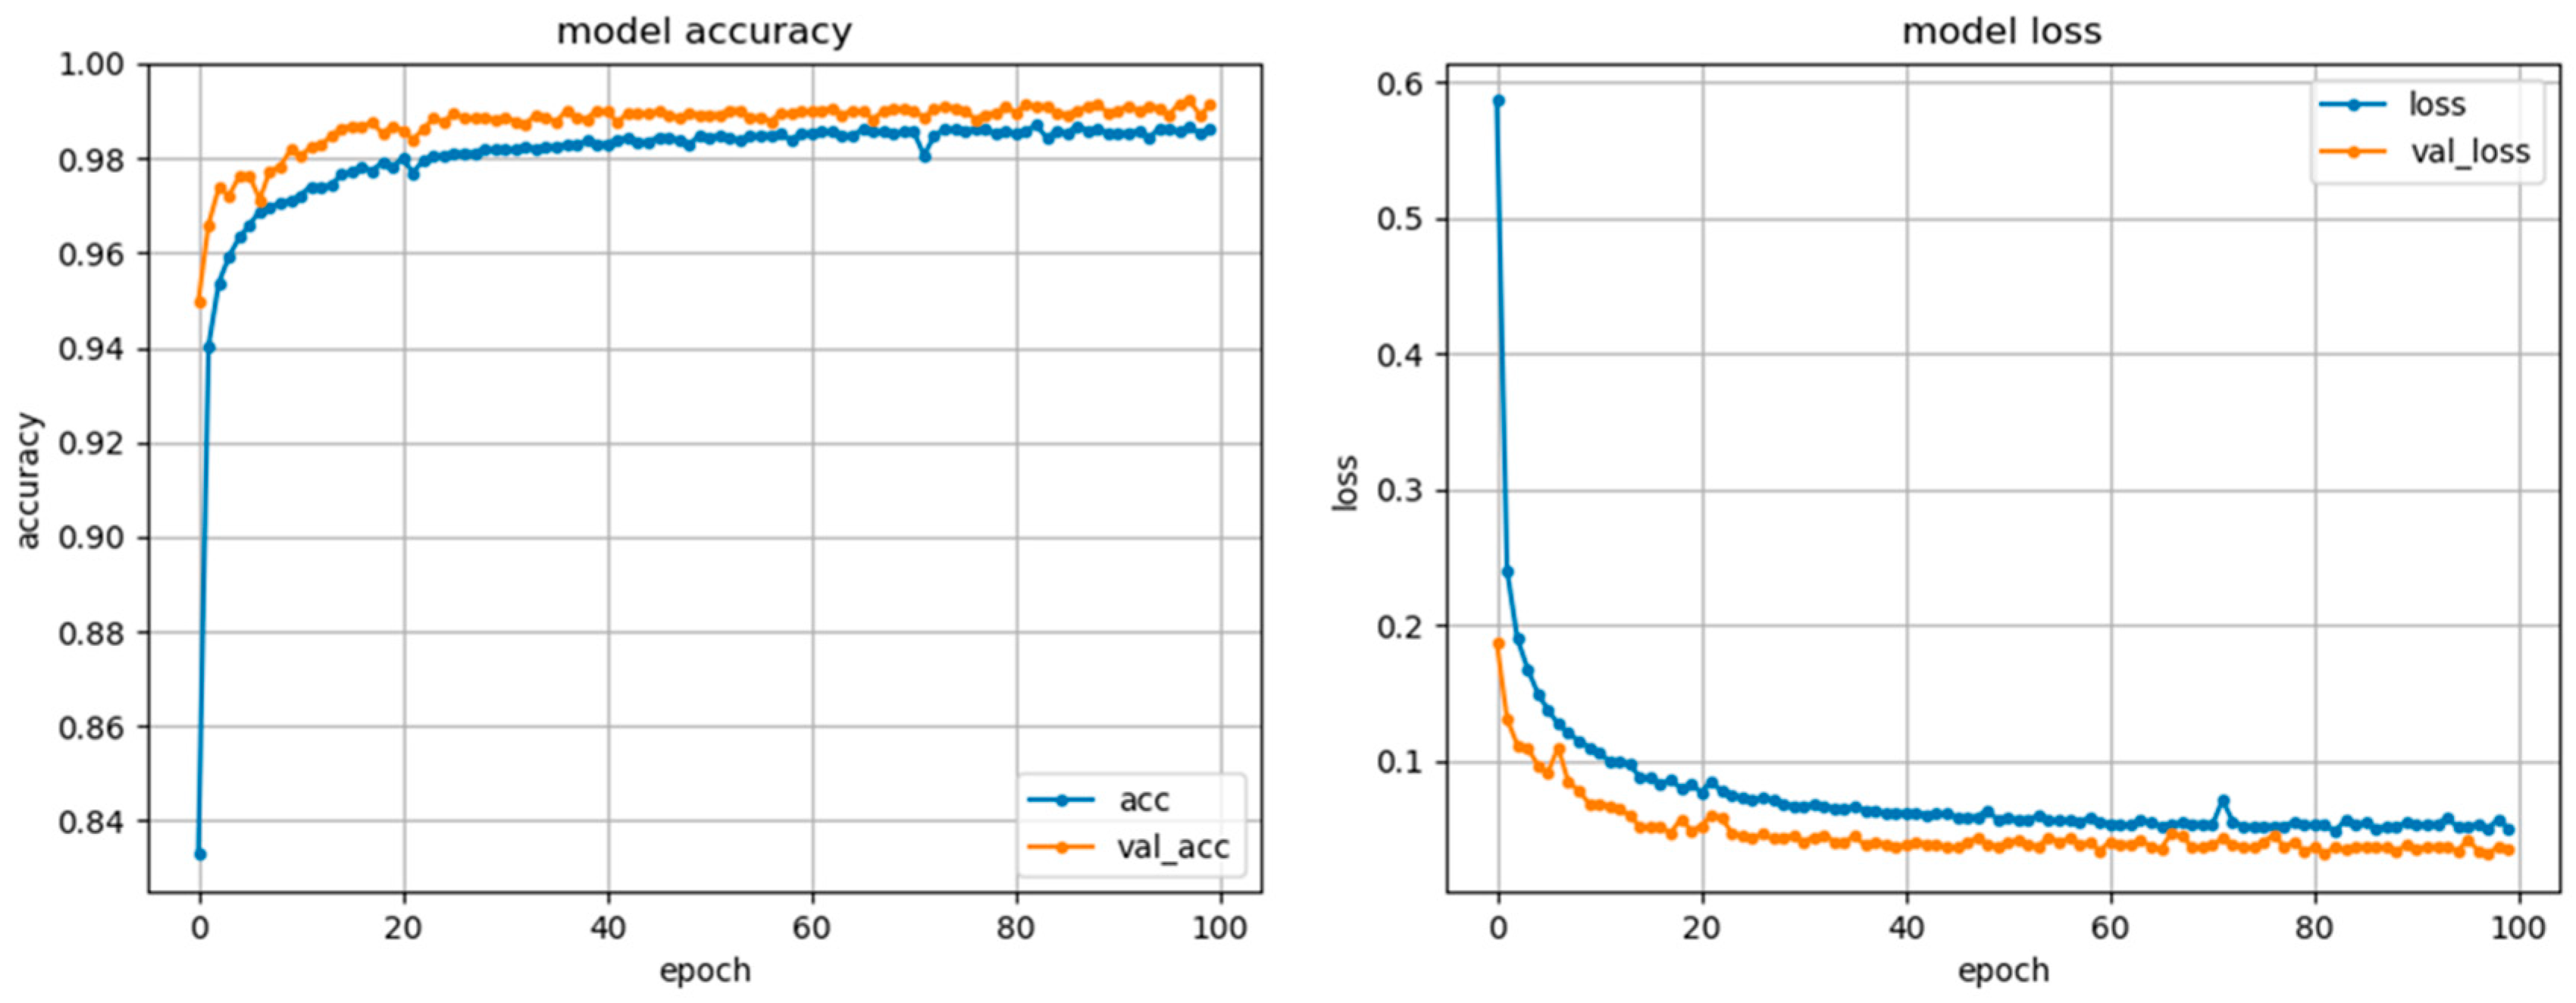
2.3. CNN-LSTM Model
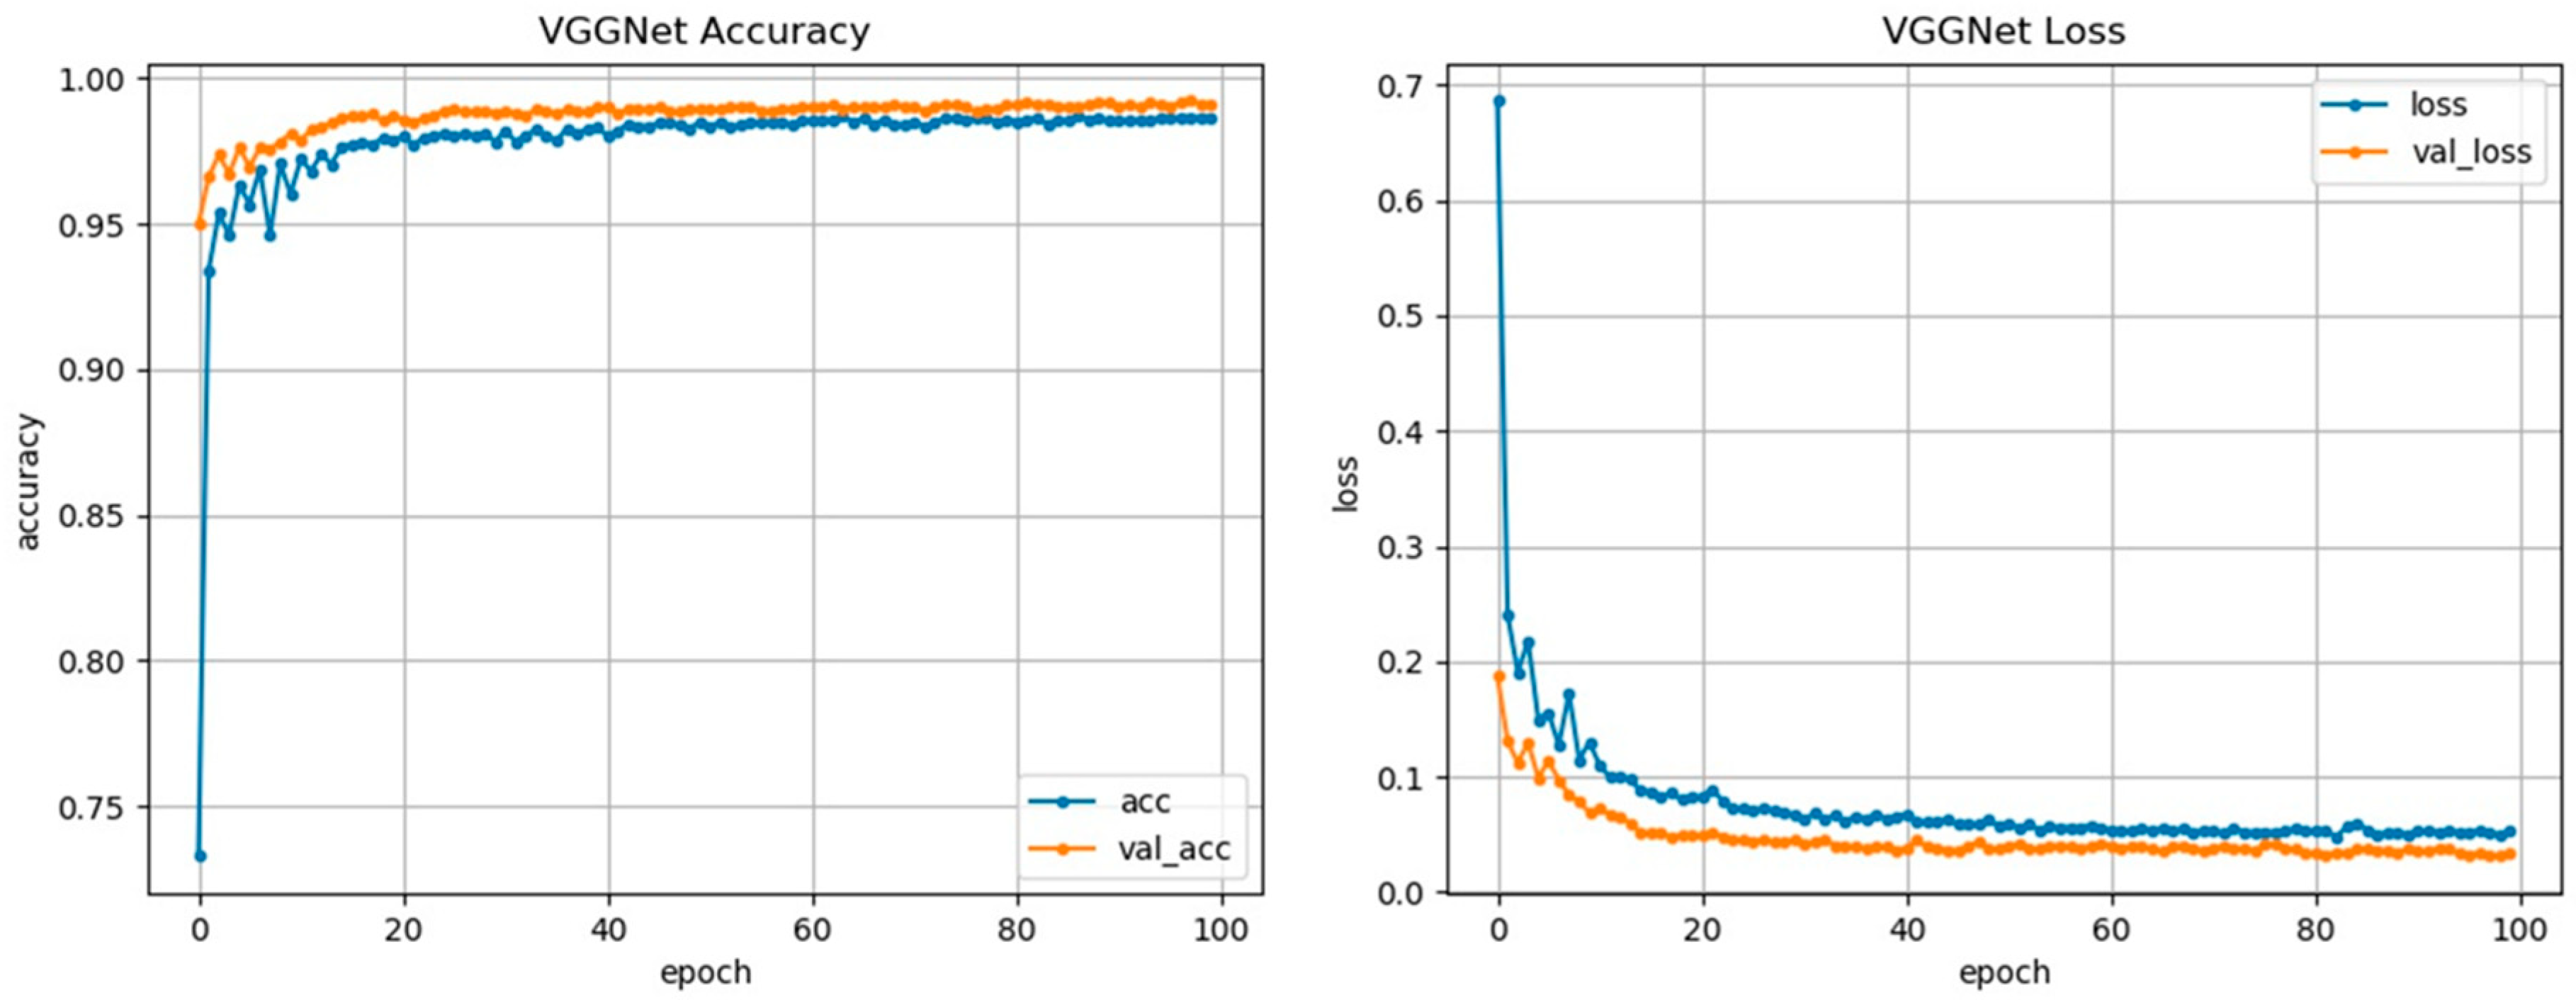
2.4. VGGNet Model
2.5. Model Architecture and Details
2.5.1. Activation Function
2.5.2. Batch Normalization
2.5.3. Dropout Regularization
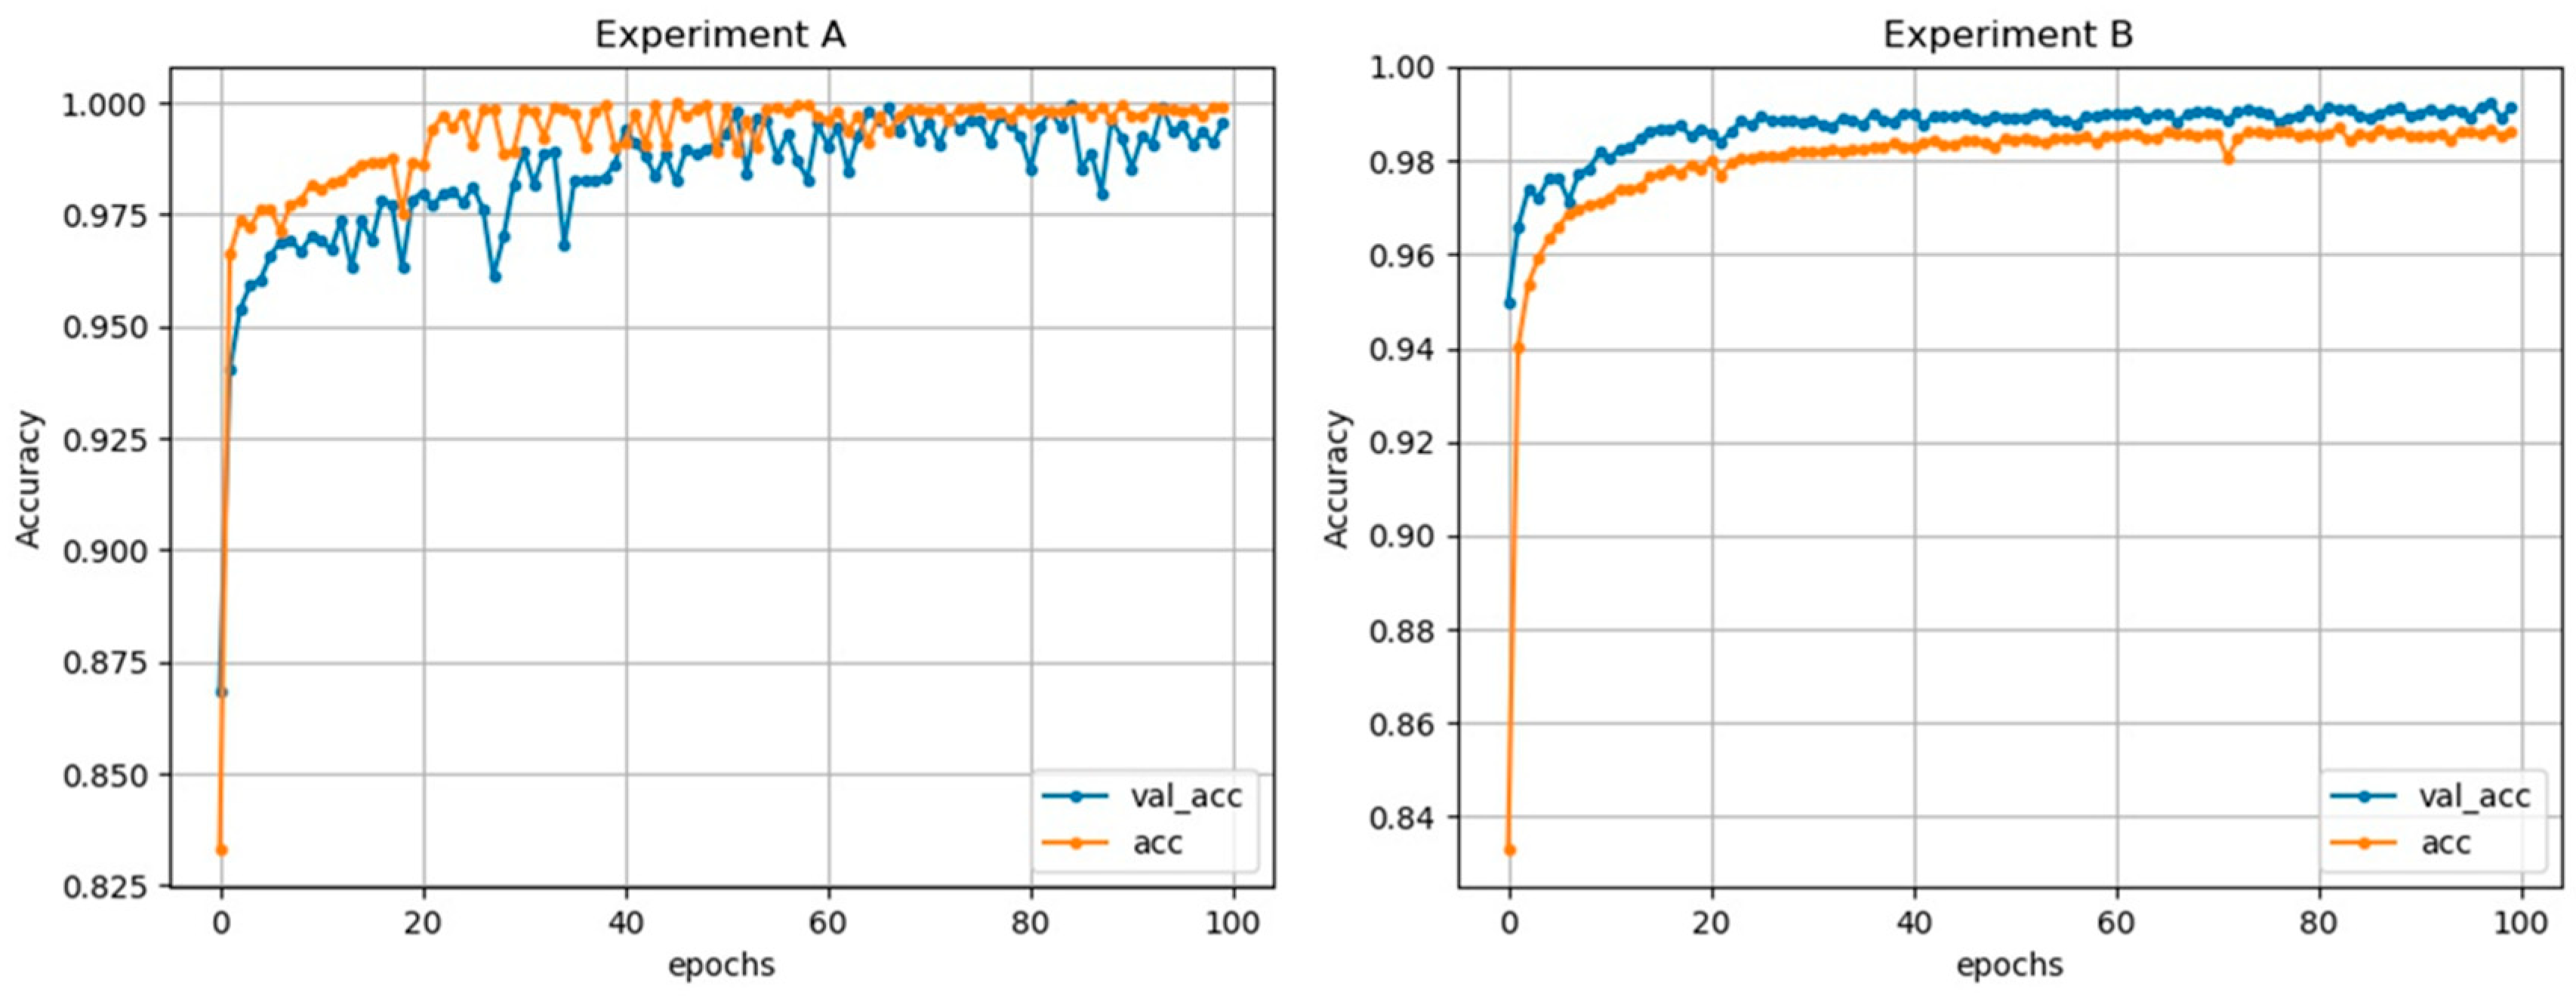
3. Results
4. Discussion
5. Conclusions
Author Contributions
Funding
Conflicts of Interest
References
- Ye, C.; Coimbra, M.T.; Kumar, B.V. Arrhythmia detection and classification using morphological and dynamic features of ECG signals. In Proceedings of the Annual International Conference of the IEEE Engineering in Medicine Biology Society, Buenos Aires, Argentina, 31 August–4 September 2010. [Google Scholar]
- De Chazal, P.; O’Dwyer, M.; Reilly, R.B. Automatic classification of heartbeats using ECG morphology and heartbeat interval features. IEEE Trans. Biomed. Eng. 2004, 51, 1196–1206. [Google Scholar] [CrossRef] [PubMed]
- Mar, T.; Zaunseder, S.; Martinez, J.P.; Llamedo, M.; Poll, R. Optimization of ECG classification by means of feature selection. IEEE Trans. Biomed. Eng. 2011, 58, 2168–2177. [Google Scholar] [CrossRef] [PubMed]
- Shadmand, S.; Mashoufi, B. A new personalized ECG signal classification algorithm using Block-based Neural Network and Particle Swarm Optimization. Biomed. Signal Process. Control 2016, 25, 12–23. [Google Scholar] [CrossRef]
- Hu, Y.H.; Palreddy, S.; Tompkins, W.J. A Patient-adaptable ECG Beat Classifier Using a Mixture of Experts Approach–Biomedical Engineering. IEEE Trans. Biomed. Eng. 1997, 44, 891–900. [Google Scholar]
- El-Saadawy, H.; Tantawi, M.; Shedeed, H.A.; Tolba, M.F. Electrocardiogram (ECG) Classification Based On Dynamic Beats Segmentation. In Proceedings of the 10th International Conference on Informatics and Systems, Giza, Egypt, 9–11 May 2016. [Google Scholar]
- He, H.; Tan, Y.; Xing, J. Unsupervised classification of 12-lead ECG signals using wavelet tensor decomposition and two-dimensional Gaussian spectral clustering. Knowl. Based Syst. 2019, 163, 392–403. [Google Scholar] [CrossRef]
- Ye, C.; Kumar, B.V.; Coimbra, M.T. Heartbeat classification using morphological and dynamic features of ECG signals. IEEE Trans. Biomed. Eng. 2012, 59, 2930–2941. [Google Scholar]
- Osowski, S.; Hoai, L.T.; Markiewicz, T. Support vector machine-based expert system for reliable heartbeat recognition. IEEE Trans. Biomed. Eng. 2004, 51, 582–589. [Google Scholar] [CrossRef]
- Rodriguez, J.; Goni, A.; Illarramendi, A. Real-Time Classification of ECGs on a PDA. IEEE Trans. Inf. Technol. Biomed. 2005, 9, 23–34. [Google Scholar] [CrossRef]
- Singh, R.; Mehta, R.; Rajpal, N. Efficient wavelet families for ECG classification using neural classifiers. Procedia Comput. Sci. 2018, 132, 11–21. [Google Scholar] [CrossRef]
- D’Aloia, M.; Longo, A.; Rizzi, M. Noisy ECG Signal Analysis for Automatic Peak Detection. Information 2019, 10, 35. [Google Scholar] [CrossRef]
- Pourbabaee, B.; Roshtkhari, M.J.; Khorasani, K. Deep Convolutional Neural Networks and Learning ECG Features for Screening Paroxysmal Atrial Fibrillation Patients. IEEE Trans. Syst. Man Cybern. Syst. 2018, 48, 2095–2104. [Google Scholar] [CrossRef]
- Kiranyaz, S.; Ince, T.; Gabbouj, M. Real-Time Patient-Specific ECG Classification by 1-D Convolutional Neural Networks. IEEE Trans. Biomed. Eng. 2016, 63, 664–675. [Google Scholar] [CrossRef] [PubMed]
- Yildirim, O.; Plawiak, P.; Tan, R.S.; Acharya, U.R. Arrhythmia detection using deep convolutional neural network with long duration ECG signals. Comput. Biol. Med. 2018, 102, 411–420. [Google Scholar] [CrossRef] [PubMed]
- Jun, T.J.; Nguyen, H.M.; Kang, D.; Kim, D.; Kim, D.; Kim, Y.-H. ECG arrhythmia classification using a 2-D convolutional neural network. arXiv 2018, arXiv:1804.06812. [Google Scholar]
- Yildirim, O.; Talo, M.; Ay, B.; Baloglu, U.B.; Aydin, G.; Acharya, U.R. Automated detection of diabetic subject using pre-trained 2D-CNN models with frequency spectrum images extracted from heart rate signals. Comput. Biol. Med. 2019, 113, 103387. [Google Scholar] [CrossRef] [PubMed]
- Oh, S.L.; Ng, E.Y.K.; Tan, R.S.; Acharya, U.R. Automated diagnosis of arrhythmia using combination of CNN and LSTM techniques with variable length heart beats. Comput. Biol. Med. 2018, 102, 278–287. [Google Scholar] [CrossRef] [PubMed]
- Moody, G.B.; Mark, R.G. The impact of the MIT-BIH Arrhythmia Database. IEEE Eng. Med. Biol. Mag. 2001, 20, 45–50. [Google Scholar] [CrossRef] [PubMed]
- Bakkouri, I.; Afdel, K. Multi-scale CNN based on region proposals for efficient breast abnormality recognition. Multimed. Tools Appl. 2018, 78, 12939–12960. [Google Scholar] [CrossRef]
- Jiménez-Serrano, S.; Yagüe-Mayans, J.; Simarro-Mondéjar, E.; Calvo, C.J.; Castells, F.; Millet, J. Atrial Fibrillation Detection Using Feedforward Neural Networks and Automatically Extracted Signal Features. In Proceedings of the 2017 Computing in Cardiology Conference (CinC), Rennes, France, 24–27 September 2017. [Google Scholar]
- Giorgio, A.; Rizzi, M.; Guaragnella, C. Efficient Detection of Ventricular Late Potentials on ECG Signals Based on Wavelet Denoising and SVM Classification. Information 2019, 10, 328. [Google Scholar] [CrossRef]
- Zeiler, M.D.; Fergus, R. Visualizing and Understanding convolutional networks. In Proceedings of the European Conference on Computer Vision, Zurich, Switzerland, 6–12 September 2014. [Google Scholar]
- Taigman, Y.; Yang, M.; Ranzato, M.A.; Wolf, L. DeepFace: Closing the Gap to Human-Level Performance in Face Verification. In Proceedings of the 2014 IEEE Conference on Computer Vision and Pattern Recognition, Columbus, OH, USA, 23–28 June 2014. [Google Scholar]
- Deng, L.; Abdel-Hamid, O.; Yu, D. A deep convolutional neural network using heterogeneous pooling for trading acoustic invariance. In Proceedings of the IEEE International Conference on Acoustics, Speech and Signal Processing (ICASSP), Vancouver, BC, Canada, 26–31 May 2013. [Google Scholar]
- Khalifa, M.; Shaalan, K. Character convolutions for Arabic Named Entity Recognition with Long Short-Term Memory Networks. Comput. Speech Lang. 2019, 58, 335–346. [Google Scholar] [CrossRef]
- Yao, Q.; Wang, R.; Fan, X.; Liu, J.; Li, Y. Multi-class Arrhythmia detection from 12-lead varied-length ECG using Attention-based Time-Incremental Convolutional Neural Network. Inf. Fusion 2020, 53, 174–182. [Google Scholar] [CrossRef]
- Urtnasan, E.; Park, J.U.; Joo, E.Y.; Lee, K.J. Automated Detection of Obstructive Sleep Apnea Events from a Single-Lead Electrocardiogram Using a Convolutional Neural Network. J. Med. Syst. 2018, 42, 104. [Google Scholar] [CrossRef] [PubMed]
- Yang, S.; Hao, K.; Ding, Y.; Liu, J. Vehicle Driving Direction Control Based on Compressed Network. Int. J. Pattern Recognit. Artif. Intell. 2018, 32, 27. [Google Scholar] [CrossRef]
- He, W.; Wang, G.; Hu, J.; Li, C.; Guo, B.; Li, F. Simultaneous Human Health Monitoring and Time-Frequency Sparse Representation Using EEG and ECG Signals. IEEE Access 2019, 7, 85985–85994. [Google Scholar] [CrossRef]
- Martis, R.J.; Acharya, U.R.; Mandana, K.M.; Ray, A.K.; Chakraborty, C. Cardiac decision making using higher order spectra. Biomed. Signal Process. Control 2013, 8, 193–203. [Google Scholar] [CrossRef]
- Pławiak, P. Novel methodology of cardiac health recognition based on ECG signals and evolutionary-neural system. Expert Syst. Appl. 2018, 92, 334–349. [Google Scholar] [CrossRef]
- Mondéjar-Guerra, V.; Novo, J.; Rouco, J.; Penedo, M.G.; Ortega, M. Heartbeat classification fusing temporal and morphological information of ECGs via ensemble of classifiers. Biomed. Signal Process. Control 2019, 47, 41–48. [Google Scholar] [CrossRef]
- Acharya, U.R.; Oh, S.L.; Hagiwara, Y.; Tan, J.H.; Adam, M.; Gertych, A.; Tan, R.S. A deep convolutional neural network model to classify heartbeats. Comput. Biol. Med. 2017, 89, 389–396. [Google Scholar] [CrossRef]
- Yildirim, O. A novel wavelet sequence based on deep bidirectional LSTM network model for ECG signal classification. Comput. Biol. Med. 2018, 96, 189–202. [Google Scholar] [CrossRef]


| Type | Records | Beats |
|---|---|---|
| NOR | 100,101,103,106,108,112,113,114,115,117,119,121,122,123, 203,205,219,230,234 | 75,016 |
| PVC | 105,116,200,201,202,208,210,213,215,221,228,233 | 7130 |
| PAB | 102,104,107,217 | 7024 |
| APB | 209,220,222,223,232 | 2544 |
| LBBB | 109,111,207,213 | 8072 |
| RBBB | 118,124,212,231 | 7256 |
| VEB | 207 | 106 |
| VFW | 207 | 472 |
| Total | 107,620 |
| Layer | Type | Kernel Size | Stride | Kernel | Input Size |
|---|---|---|---|---|---|
| 1 | Conv2D | 3 × 3 | 1 | 64 | 192 × 128 × 1 |
| 2 | Conv2D | 3 × 3 | 1 | 64 | 192 × 128 × 64 |
| 3 | Pool | 2 × 2 | 2 | - | 192 × 128 × 64 |
| 4 | Conv2D | 3 × 3 | 1 | 128 | 64 × 64 × 64 |
| 5 | Conv2D | 3 × 3 | 1 | 128 | 64 × 64 × 128 |
| 6 | Pool | 2 × 2 | 2 | - | 64 × 64 × 128 |
| 7 | Conv2D | 3 × 3 | 1 | 256 | 32 × 32 × 128 |
| 8 | Conv2D | 3 × 3 | 1 | 256 | 32 × 32 × 256 |
| 9 | Pool | 2 × 2 | 2 | - | 32 × 32 × 256 |
| 10 | LSTM | - | - | - | 256 × 256 |
| 11 | Fully-connected | - | - | 2048 | 65,536 |
| 12 | Fully-connected | - | - | 2048 | 2048 |
| 13 | Out | - | - | 8 | 2048 |
| Layer | Type | Kernel Size | Stride | Kernel | Input Size |
|---|---|---|---|---|---|
| 1 | Conv2D | 3 × 3 | 1 | 64 | 192 × 128 × 3 |
| 2 | Conv2D | 3 × 3 | 1 | 64 | 192 × 128 × 64 |
| 3 | Pool | 2 × 2 | 2 | - | 192 × 128 × 64 |
| 4 | Conv2D | 3 × 3 | 1 | 128 | 64 × 64 × 64 |
| 5 | Conv2D | 3 × 3 | 1 | 128 | 64 × 64 × 128 |
| 6 | Pool | 2 × 2 | 2 | - | 64 × 64 × 128 |
| 7 | Conv2D | 3 × 3 | 1 | 256 | 32 × 32 × 128 |
| 8 | Conv2D | 3 × 3 | 1 | 256 | 32 × 32 × 256 |
| 9 | Conv2D | 3 × 3 | 1 | 256 | 32 × 32 × 256 |
| 10 | Pool | 2 × 2 | 2 | - | 32 × 32 × 256 |
| 11 | Conv2D | 3 × 3 | 1 | 512 | 16 × 16 × 256 |
| 12 | Conv2D | 3 × 3 | 1 | 512 | 16 × 16 × 512 |
| 13 | Conv2D | 3 × 3 | 1 | 512 | 16 × 16 × 512 |
| 14 | Pool | 2 × 2 | 2 | - | 8 × 8 × 512 |
| 15 | Fully-connected | - | - | 4096 | 8 × 8 × 512 |
| 16 | Fully-connected | - | - | 4096 | 4096 |
| 17 | Out | - | - | 8 | 4096 |
| Experiment | Scheme | Acc | Spec | Sen |
|---|---|---|---|---|
| Experiment A | Without Dropout | 99.87% | 99.78% | 98.95% |
| Experiment B | With Dropout | 99.01% | 99.57% | 97.67% |
| Predicted | NOR | PAB | APB | PVC | LBBB | RBBB | VEB | VFW |
|---|---|---|---|---|---|---|---|---|
| NOR | 14,940 | 1 | 10 | 50 | 0 | 1 | 2 | 0 |
| PAB | 2 | 1404 | 0 | 0 | 0 | 0 | 0 | 0 |
| APB | 78 | 0 | 420 | 6 | 3 | 2 | 0 | 0 |
| PVC | 5 | 0 | 0 | 1420 | 0 | 0 | 0 | 1 |
| LBBB | 8 | 0 | 1 | 2 | 1602 | 0 | 1 | 1 |
| RBBB | 20 | 2 | 1 | 4 | 2 | 1422 | 1 | 0 |
| VEB | 1 | 0 | 0 | 0 | 0 | 0 | 21 | 0 |
| VFW | 8 | 0 | 0 | 0 | 1 | 0 | 0 | 86 |
| Predicted | NOR | PAB | APB | PVC | LBBB | RBBB | VEB | VFW |
|---|---|---|---|---|---|---|---|---|
| NOR | 14,932 | 10 | 5 | 41 | 8 | 5 | 3 | 0 |
| PAB | 1 | 1402 | 1 | 1 | 0 | 0 | 0 | 0 |
| APB | 68 | 0 | 407 | 30 | 0 | 3 | 0 | 1 |
| PVC | 29 | 2 | 6 | 1387 | 0 | 0 | 0 | 2 |
| LBBB | 9 | 0 | 1 | 2 | 1603 | 0 | 0 | 0 |
| RBBB | 30 | 10 | 0 | 10 | 1 | 1401 | 0 | 0 |
| VEB | 1 | 0 | 0 | 0 | 0 | 0 | 21 | 0 |
| VFW | 6 | 0 | 0 | 2 | 0 | 0 | 0 | 87 |
| Model | Dataset | Method | Acc | Sen | Spec |
|---|---|---|---|---|---|
| Proposed Model | This study’s dataset | CNN-LSTM | 99.01% | 97.67% | 99.57% |
| VGGNet [27] | This study’s dataset | CNN | 98.67% | 96.93% | 99.52% |
| Author | Features Set | Classes | ECG Beats | Classifier | Accuracy |
|---|---|---|---|---|---|
| Machine Learning Methods | |||||
| Osowski et al. (2008) [9] | Higher-order statistics (HOS) cumulant and Hermite coefficient of QRS complex | 13 | 12,785 | Support Vector Machine | 98.71% |
| Martis et al. (2013) [31] | Bispectrum and principal component analysis (PCA) | 5 | 34,989 | Least-Squares Support Vector Machine | 93.48% |
| Plawiak et al. (2018) [32] | The spectral power density and genetic optimization of parameters | 17 | 1000 | Support Vector Machine | 98.85% |
| Guerra et al. (2019) [33] | HOS and local binary patterns (LBPs) | 4 | 49,691 | Combination of Multiple Support Vector Machines | 94.50% |
| Deep Learning Methods | |||||
| Kiranyaz et al. (2016) [14] | End-to-end | 5 | 83,648 | CNN | 99.00% |
| Jun et al. (2018) [16] | End-to-end | 8 | 106,501 | CNN | 99.05% |
| Shu Lih Oh et al. (2018) [18] | End-to-end | 5 | 16,499 | CNN + LSTM | 98.10% |
| Acharya et al. (2017) [34] | End-to-end | 5 | 109,449 | CNN | 94.03% |
| Yildirim et al. (2018) [35] | End-to-end | 5 | 7326 | Wavelet + Bi-LSTM | 99.25% |
| This Study | End-to-end | 8 | 107,620 | CNN + LSTM | 99.01% |
© 2020 by the authors. Licensee MDPI, Basel, Switzerland. This article is an open access article distributed under the terms and conditions of the Creative Commons Attribution (CC BY) license (http://creativecommons.org/licenses/by/4.0/).
Share and Cite
Zheng, Z.; Chen, Z.; Hu, F.; Zhu, J.; Tang, Q.; Liang, Y. An Automatic Diagnosis of Arrhythmias Using a Combination of CNN and LSTM Technology. Electronics 2020, 9, 121. https://doi.org/10.3390/electronics9010121
Zheng Z, Chen Z, Hu F, Zhu J, Tang Q, Liang Y. An Automatic Diagnosis of Arrhythmias Using a Combination of CNN and LSTM Technology. Electronics. 2020; 9(1):121. https://doi.org/10.3390/electronics9010121
Chicago/Turabian StyleZheng, Zhenyu, Zhencheng Chen, Fangrong Hu, Jianming Zhu, Qunfeng Tang, and Yongbo Liang. 2020. "An Automatic Diagnosis of Arrhythmias Using a Combination of CNN and LSTM Technology" Electronics 9, no. 1: 121. https://doi.org/10.3390/electronics9010121
APA StyleZheng, Z., Chen, Z., Hu, F., Zhu, J., Tang, Q., & Liang, Y. (2020). An Automatic Diagnosis of Arrhythmias Using a Combination of CNN and LSTM Technology. Electronics, 9(1), 121. https://doi.org/10.3390/electronics9010121