Article

Energy Efficiency Based Control Strategy of a Three-Level Interleaved DC-DC Buck Converter Supplying a Proton Exchange Membrane Electrolyzer

by
Burin Yodwong
1,
Damien Guilbert
2,*,
Wattana Kaewmanee
1,3 and
Matheepot Phattanasak
1,3
1
Thai-French Innovation Institute, King Mongkut’s University of Technology North Bangkok, 1518 Bangsue, Bangkok 10800, Thailand
2
Université de Lorraine / IUT de Longwy, Group of Research in Electrical Engineering of Nancy (GREEN), 186 rue de Lorraine, 54400 Cosnes-et-Romain, France
3
Department of Teacher Training in Electrical Engineering, King Mongkut’s University of Technology North Bangkok, 1518 Bangsue, Bangkok 10800, Thailand
*
Author to whom correspondence should be addressed.
Electronics 2019, 8(9), 933; https://doi.org/10.3390/electronics8090933
Submission received: 2 August 2019 / Revised: 20 August 2019 / Accepted: 23 August 2019 / Published: 25 August 2019

Abstract

:
To face the intensive use of natural gas and other fossil fuels to generate hydrogen, water electrolysis based on renewable energy sources (RES) seems to be a viable solution. Due to their fast response times, and high efficiency, proton exchange membrane electrolyzer (PEM EL) is the most suitable technology for long-term energy storage, combined with RES. Like fuel cells, the development of fit DC-DC converters is mandatory to interface the EL to the DC grid. Given that PEM EL operating voltages are quite low and to meet requirements in terms of output current ripples, new emerging interleaved DC-DC converter topologies seem to be the best candidates. In this work, a three-level interleaved DC-DC buck converter has been chosen to supply a PEM EL from a DC grid. Therefore, the main objective of this paper is to develop a suitable control strategy of this interleaved topology connected to a PEM EL emulator. To design the control strategy, investigations have been carried out on energy efficiency, hydrogen flow rate, and specific energy consumption. The obtained experimental results validate the performance of the converter in protecting the PEM EL during transient operations while guaranteeing correct specific energy consumption.

1. Introduction

Currently, multi-source systems based on a DC configuration suffer from their use to low power applications because of the use of basic DC-DC converters (boost converter for fuel cells, and buck converter for electrolyzers (ELs)) [1,2,3]. These topologies present limited voltage conversion ability and are not fit for medium and high power applications [4]. Furthermore, they suffer from having high current ripples and low energy efficiency. Besides, due to the presence of a single power switch, they are not able to operate following a power switch failure [4]. Other step-down DC-DC converter topologies have been reported to interface DC grid and ELs. Indeed, isolated step-down DC-DC converters (e.g., half-bridge, full-bridge) are considered to be the most attractive candidates in terms of voltage conversion ratio, since a high-frequency transformer is usually used [4]. However, the reported topologies in the literature [5,6,7,8,9,10,11,12,13,14] only feature energy efficiency improvement because of the use of soft-switching techniques at the expense of the output current ripple, reliability, and power level issues for high-power multi-source systems. Hence, to intending to increase the power level of these multi-source systems, new emerging interleaved DC-DC converter topologies have much to offer.
Recently, several interleaved step-down DC-DC converters have been reported in the literature and are considered as possible candidates to interface DC bus grid and ELs [15]. Among those possible candidates, a three-level interleaved DC-DC buck converter has been selected to realize this work. Indeed, this topology presents several benefits compared to the other reported topologies from the voltage ratio, efficiency, current ripples, and availability (in case of power switch failures) point of view [16,17]. For this reason, based on its features, this topology is particularly suitable for high-power multi-source systems, including renewable energy sources and hydrogen technologies. Furthermore, among the three existing types of ELs, the study is particularly focused on proton exchange membrane (PEM) technologies because of its advantages over the alkaline technology from current density, energy efficiency, and dynamic operation (mandatory when coupling with renewable energy sources (RES) due to their intermittent features) point of view [18,19].
Compared to previous works reported in references [16,17] introducing the studied converter, the main objective of this work is to develop a suitable PI controller of the three-level interleaved DC-DC buck converter connected to a PEM EL emulator. This emulator is realized through an equivalent electrical circuit developed in a previous research work [20]; able to accurately replicate the dynamic operation of the EL. Since the developed controller is based on the PEM EL voltage, thorough investigations have been carried out on energy efficiency of the system, hydrogen flow rate, and specific energy consumption. This study aims at determining accurately the PEM EL voltage reference value. The obtained and reported experimental results allow validating the performance of the converter in protecting the PEM EL against additional stresses during transient operations while guaranteeing a correct energy efficiency of the system.
The paper is composed of four sections. After the Introduction providing the current state-of-the-art ant the reasons to realize this work, the Section 2 is focused on the presentation of the three-level interleaved buck converter by emphasizing its benefits. Then, in Section 3, a thorough analysis of the energy efficiency of the system, hydrogen flow rate, and the specific energy consumption is reported. Moreover, the different steps of designing the control strategy are provided. Finally, the experimental test bench is described, and results are given to assess the performance of the developed control.

2. Presentation and Benefits of the Three-Level Interleaved DC-DC Buck Converter

As emphasized in previous works [21], the main drawback of current multi-source systems based on a DC configuration lies in using basic DC-DC converters (e.g., buck, boost converters) [22,23,24]. Indeed, basic DC-DC converters are set when the needed power increases or for requested higher step-down or step-up ratios. Hence, their use strongly limits the use of multi-source systems for low-power applications. Current PEM ELs available in the market need a low DC voltage to generate hydrogen (around 8 V or lower) [25]. As a result, step-down DC-DC converters are needed with a high conversion ratio ability since the met DC bus voltage in multi-source systems is a hundred volts [21]. Compared to step-up DC-DC converters needed for fuel cell systems [26,27], step-down DC-DC converters requested for PEM EL applications have received less attention from the scientific community. However, recent review works have introduced and emphasized some step-down DC-DC converters for possible interface with PEM ELs [4,15].
Based on the review reported in reference [15], it has been decided to investigate the three-level interleaved DC-DC buck converter as depicted in Figure 1 within the framework of this work. This converter consists in connecting in parallel the non-floating version (upper part) and the floating version (lower part) of the classic buck converter. As a result, the voltage conversion gain can be enhanced compared over the basic buck and interleaved topologies. Besides, at the input of the converter, the presence of two capacitors (C1, C2) allows obtaining voltage stress twice smaller at the terminal of the four power switches. Also, to achieve a zero-current transition (ZCT), two auxiliary inductors (L0/2) have been added. Hence, energy efficiency can be enhanced by minimizing losses from the power switches and diodes [16,17]. In brief, the benefits of this topology are summarized below:
  • Enhanced overall converter efficiency due to the interleaved architecture and zero-current-transition (ZCT) feature.
  • A higher step-down conversion ratio needed for multi-source systems based on DC grid configuration.
  • Minimized output current ripples which allow enhancing performance of the EL.
  • Improved system availability following power switch failures and increase the converter power rating by paralleling phases.
  • Decreased both voltage and current ratings of power switches and diodes.
  • Reduced volume of passive components.
Based on the operation of the converter described in reference [17], a lossless resistance Re, depending on the switching inductor, period (Ts), and the parasitic resistance (r) of the switching inductor can be determined:
R e = 2 L T s × ( V e l r i e l ) ( V e l r ( i L 1 i L 2 )
This resistance differs from that determined in reference [17] since it takes into consideration the parasitic resistance of the switching inductor. The currents iL1 and iL2 flow through respectively the switching inductors L1 and L2.
In this work, the dynamic electrical model of a PEM EL (Figure 2) has been taken into consideration to determine the equivalent load resistance of the studied PEM EL.
To determine the equivalent resistance of the investigated EL, this electrical scheme has been used. The equivalent resistance, Rel, is equal to:
R e l = V e l   R t o t V e l V i n t
where:
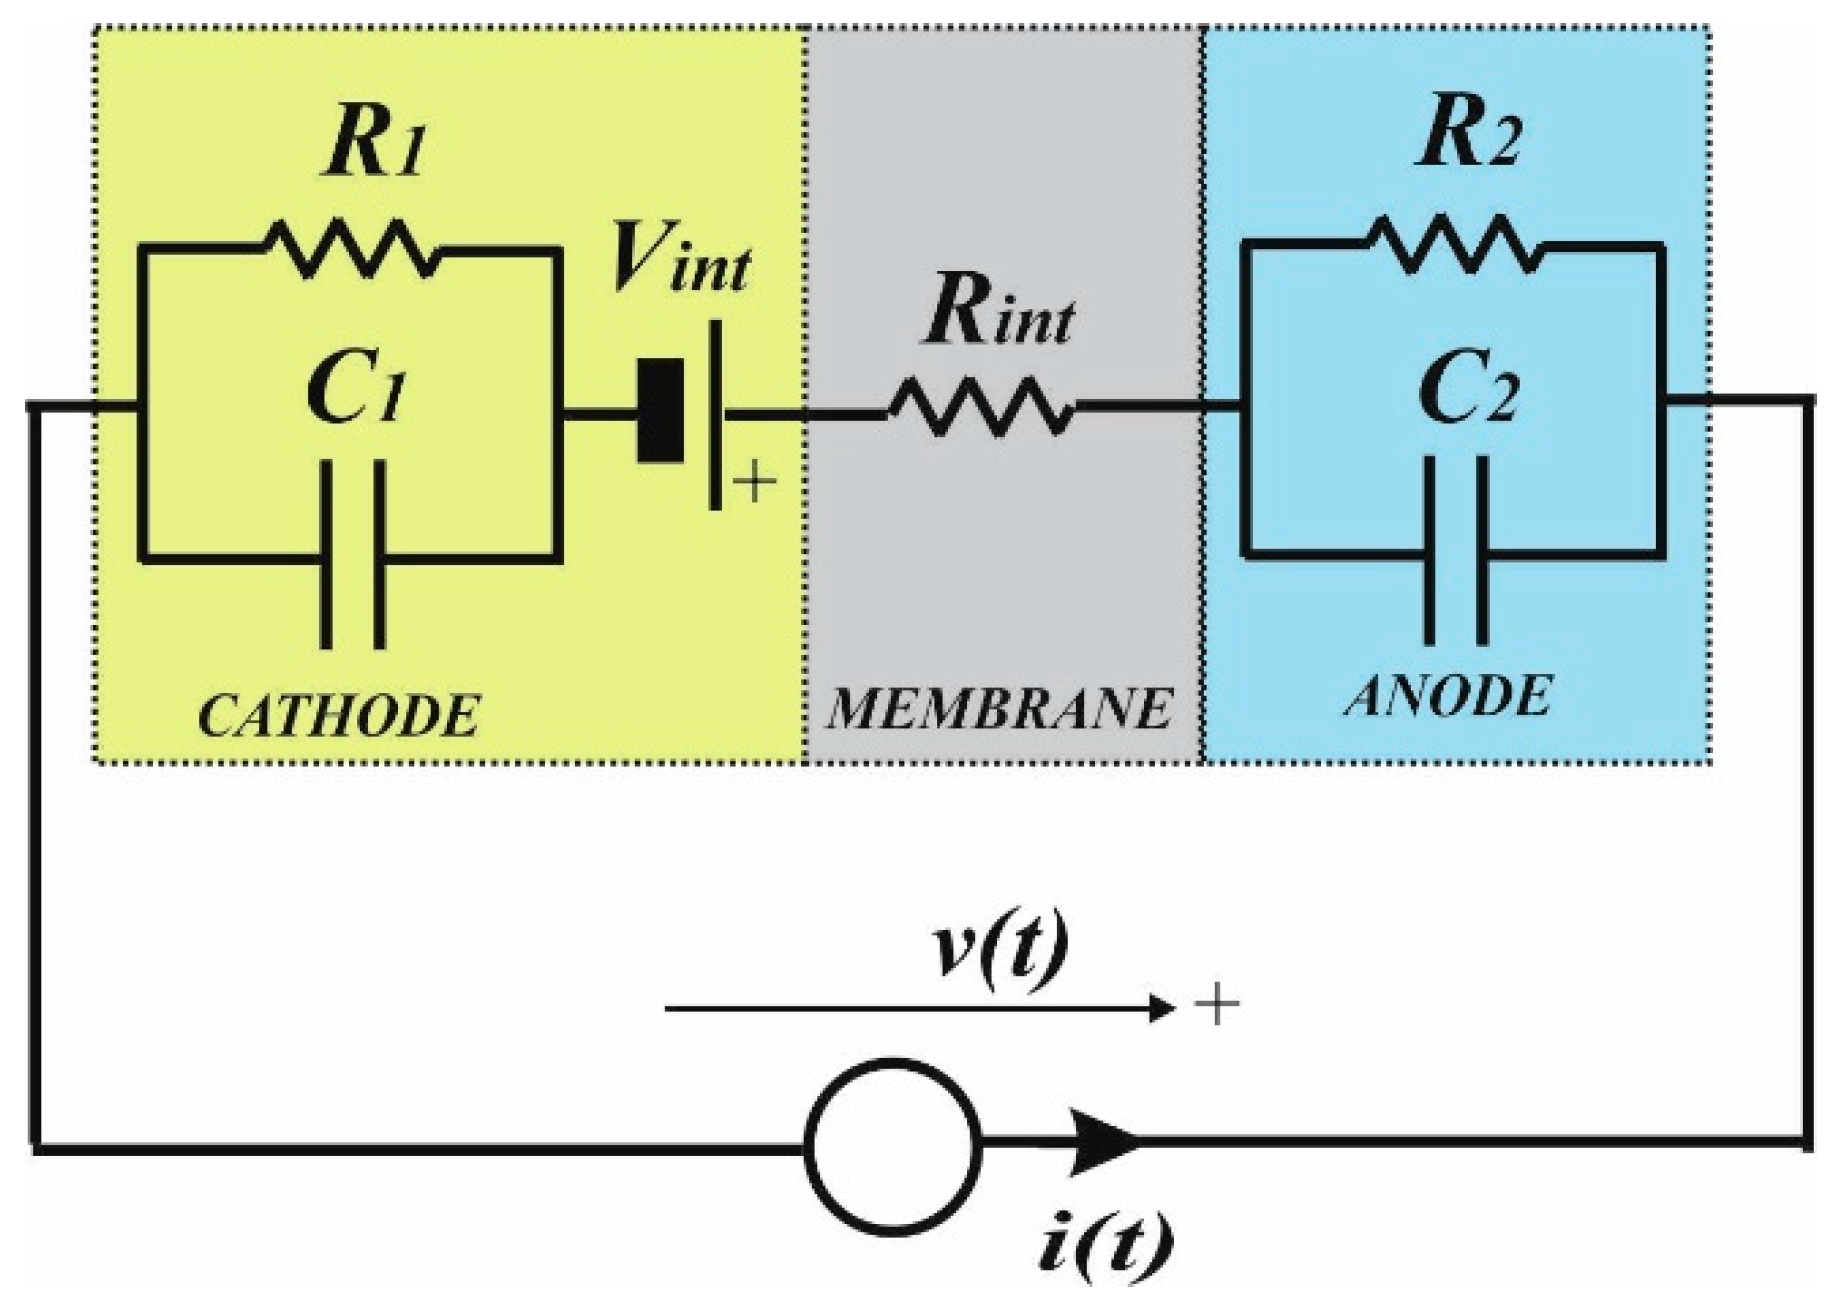
  • Rtot: sum of the resistance in the equivalent model, taking into consideration activation losses both at the anode and cathode and membrane losses. The total resistance value is equal to 0.441 Ω.
  • Vint: reversible voltage of the PEM EL, which is equal to 4.38 V.
It is important to point out that the parameters of this equivalent electrical model may change according to the operation of the EL. Indeed, as highlighted in reference [20], according to the input current range operation, the dynamic behavior is modified. The parameter Vint strongly depends on gas pressures and temperature as well; whereas the resistances of the model depend on the input current since the time constants change. However, the determined parameters in a previous work allow accurately modeling the behavior of the PEM EL for the studied current range [20].
In order to obtain the voltage ratio of the converter, the averaged PEM EL voltage has been determined based on the analysis reported in reference [17]:
V e l = 2 D V d c 2 D r i e l R e i e l
where D represents the duty cycle, Vdc the input voltage, and iel is the current of the PEM EL.
Given that i el = V el R el , the voltage ratio of this converter taking into consideration the parasitic resistance of the switching inductor is expressed by:
M ( D ) = 2 D 1 + ( 2 Dr + R e R el )
Based on this voltage ratio, the duty cycle is obtained by solving the following second-order expression:
D 2 ( 4 V e l r V d c R e l ) + D ( 2 V e l ( R e l + R e ) V d c R e l ) 1 = 0
By using the Equation (2), an equivalent resistance of 1.63 Ω can be found. In this work, the converter has to be able to operate for an input DC voltage between 75 V and 150 V, namely for a duty cycle included between 0.15 and 0.3. As a result, since the investigated PEM EL has a low equivalent resistor, the three-level interleaved buck converter fit the requirements in terms of a low conversion ratio.

3. Objective, Energy Efficiency Investigation and Design of Control Laws

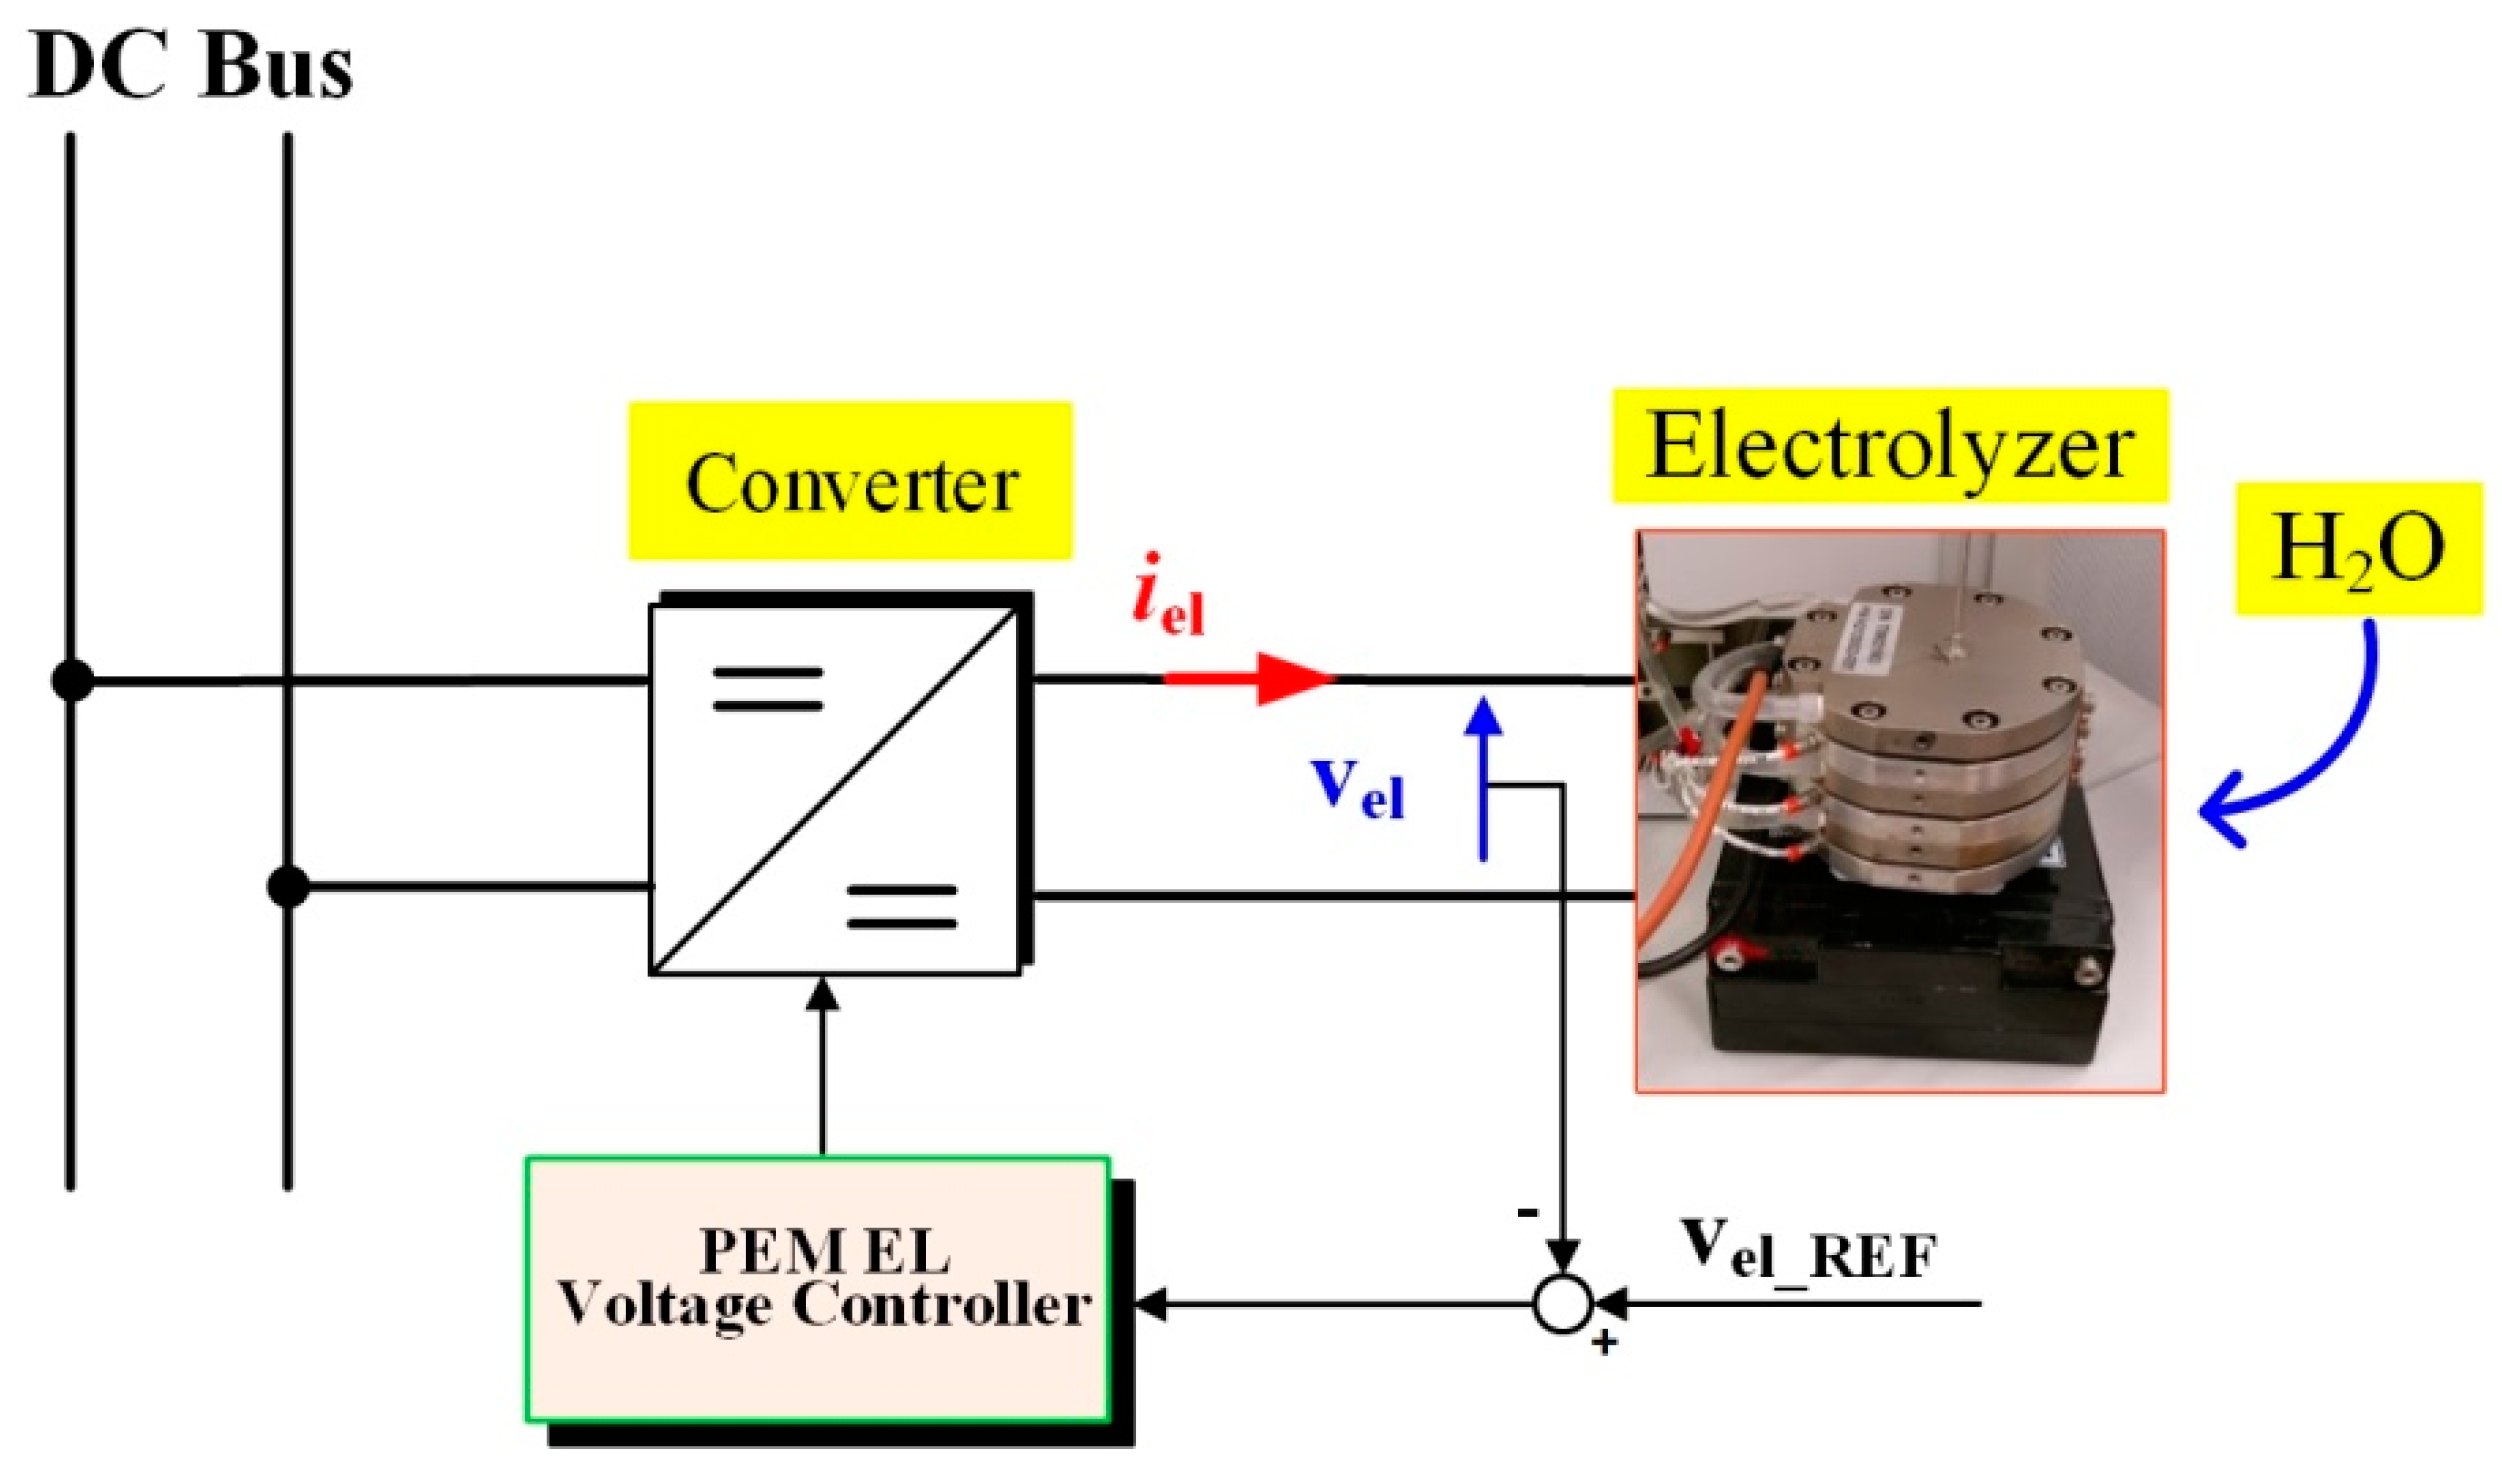
3.1. Objective of the Control

To ensure good performance of the PEM EL in case of operating condition change (i.e., input voltage) and to guarantee a correct overall energy efficiency of the system, it has been decided to control the EL voltage. Indeed, through the voltage control, the current of the EL can be handled based on the voltage, power-current characteristic shown in Figure 3. The PEM EL under study is the NMH2 1000 from the HELIOCENTRIS Company (Berlin, Germany), which is composed of three electrolysis cells connected in series. The system specifications of the PEM EL are provided in Table 1.
As it can be observed in Figure 3, when the PEM EL operates at a current value higher than 10 A (i.e., 0.2 A·cm−2), the stack voltage drops. Indeed, since the PEM EL stack voltage has reached its maximum value, this phenomenon may be explained.
This section aims at determining accurately the PEM EL voltage reference value to control so that the energy efficiency of the whole system can be optimized. In general, when the EL operates at rated current, the optimal energy efficiency cannot be reached. Indeed, as highlighted in reference [28], for a constant temperature, a rise in current (i.e., a rise in hydrogen production) leads up to an increase in the stack voltage, drastically decreasing the energy efficiency of the EL. The main benefit in operating at rated current is to maximize the hydrogen flow rate at the expense of the efficiency. For this reason, given that this important issue has not been so far investigated in the literature, the PEM voltage control is designed so that a good energy efficiency of the system can be guaranteed.

3.2. Specific energy consumption and hydrogen flow rate investigation

Energy efficiency and produced hydrogen amount (mol·s−1) strongly depend on the EL current and voltage [28]:
N ˙ H 2 = η F · n C · I el z · F
η el = P H 2 P el = Δ H 2 · N ˙ H 2 V el · I el
From Equation (6) giving the hydrogen production rate, Faraday’s efficiency is a key parameter. Indeed, it describes the ratio between the produced quantity of hydrogen (H2) and the theoretical hydrogen quantity which could be generated taking into consideration the electrical energy at the input of the PEM EL [29]. Generally, the Faraday’s efficiency is higher than the energy efficiency (7), since it only takes into consideration the losses due to the gas diffusion [30]. By comparison, energy efficiency takes into account additional losses such as membrane losses and heat losses both in the anode and cathode. These losses have been modeled as resistors in an equivalent electrical model proposed in reference [20].
In contrast to few papers and articles have been published in the literature regarding the investigation of Faraday’s efficiency [28,29,31,32,33,34,35], the Faraday’s efficiency is assumed to be equal to one in this work.
Voltage efficiency (8) has also been reported in the literature [28], and is the ratio of the thermoneutral voltage (Vt) to the cell voltage (Vcell):
η v = V t V c e l l
V t = Δ H 2 z · F = 1.482   V
Energy efficiency, Faraday’s efficiency, and voltage efficiency are linked by the following expression:
η e l = η F · η v
Since the Faraday’s efficiency is considered equal to 1, energy efficiency and voltage efficiency are equal. Besides, based on Equations (6) and (7), energy efficiency can also be expressed according to the Faraday’s efficiency and stack voltage:
η e l = ( n c · Δ H 2 z · F ) · η F V e l
By calculating the constant terms in bracket, the expression (11) becomes:
η el = 4.4463 · η F V el
In our case under study, the energy efficiency is simplified as:
η el = 4.4463 · 1 V el
From Equation (13), the higher the PEM EL stack voltage, the lower the energy efficiency.
Regarding the hydrogen flow rate (6), for a better understanding, it is generally given in standard liter per minute (slpm). By using the ideal gas law for the standard conditions (i.e., an atmospheric pressure (P = 101.3 kPa) and a temperature of 288.15 °K (T = 15 °C)) [36], the molar volume of hydrogen (Vm) can be determined:
V m = V n = R G · T p = 0.02365   m 3   mol 1
Hence, the hydrogen flow rate in (slpm) can be deduced:
V H 2 = V m · 60 · 1000 · N ˙ H 2
V H 2 = V m · 60 · 1000 · η F · n C z · F · I el
By calculating the constant terms, this final expression is obtained:
V H 2 = 0.02 · I el
Then, to better assess the performance of the PEM EL, it has been decided to investigate the specific energy consumption (kWh·kg−1) [37]. First of all, based on the previous results, the hydrogen production rate, QH2 (m3·h−1) has been determined as follows:
Q H 2 = V m · 3600 · N ˙ H 2
Q H 2 = V m · 3600 · η F · n C z · F · I el
As a result, by calculating the constant terms, the final expression can deduced:
Q H 2 = 1.3236 · 10 3 · I el
Given that the volumetric mass density of hydrogen is equal to 0.08988 kg·m−3 for the normal conditions (P = 101.3 kPa and T = 0 °C), the hydrogen production QH2 (kg·h−1) is given by the following expression:
Q H 2 = 1.189 · 10 4 · I el
Hence, the specific energy consumption (kWh·kg−1) can be deduced:
E el = P el · t 1000 · Q H 2
Finally, the efficiency of the converter (ηconv) has been investigated in order to obtain the total efficiency of the system (ηs) which is defined as:
η s = η conv · η el
The energy efficiencies of the PEM EL, the studied converter and system as well have been determined by performing experimental tests. The efficiency of the converter has been investigated according to the input DC voltage. Indeed, given the PEM EL stack voltage must be kept constant, a change in the DC bus voltage leads up to different duty cycles values. As a result, the energy efficiency of the converter changes according to the duty cycle value. The higher the duty cycle, the lower the energy efficiency of the converter. Since the converter operates at a low duty cycle, a correct efficiency can be ensured whatever the input DC voltage. In DC-DC converters, three types of losses can be found such as inductor losses (including copper and core losses), power switch losses (including conduction and switching losses), and diode losses (including conduction and reverse recovery losses). Since the converter uses interleaving techniques and has two additional inductors (L0/2 at the output of the converter), both power switch and diode losses can be minimized. Moreover, since the converter operates at low switching frequency (i.e., 10 kHz), the switching losses can be reduced. By comparison, the losses coming from the inductive components (switching and auxiliary inductors) are preponderant since the parasitic resistances are included between 0.5 and 1 Ω. As a result, the copper losses are high.
Furthermore, to better evaluate the performance of the EL from the hydrogen flow rate and specific energy consumption, they have also been determined. All the data are summarized in Table 2.
As can be seen, the maximum energy efficiency (i.e., 72%) of the system is reached for a PEM stack voltage equal to 6 V. Indeed, the maximum efficiency of the converter is obtained for a PEM EL voltage equal to 6 V. By choosing this reference value, the hydrogen flow rate and specific energy consumption can be optimized. Compared to a reference value of 8 V, the energy efficiency of the system will be lower (50%), and the hydrogen flow rate and specific energy consumption slightly higher (respectively 0.213 slpm and 69.4 kWh·kg−1). By increasing the PEM EL current, the energy efficiency of the converter decreases drastically. For this reason, the lower the current, the higher the energy efficiency. In this work, it has been chosen to guarantee an acceptable energy efficiency of the system.
After defining the PEM EL stack voltage to control, the next subsection is focused on the design of the controller.

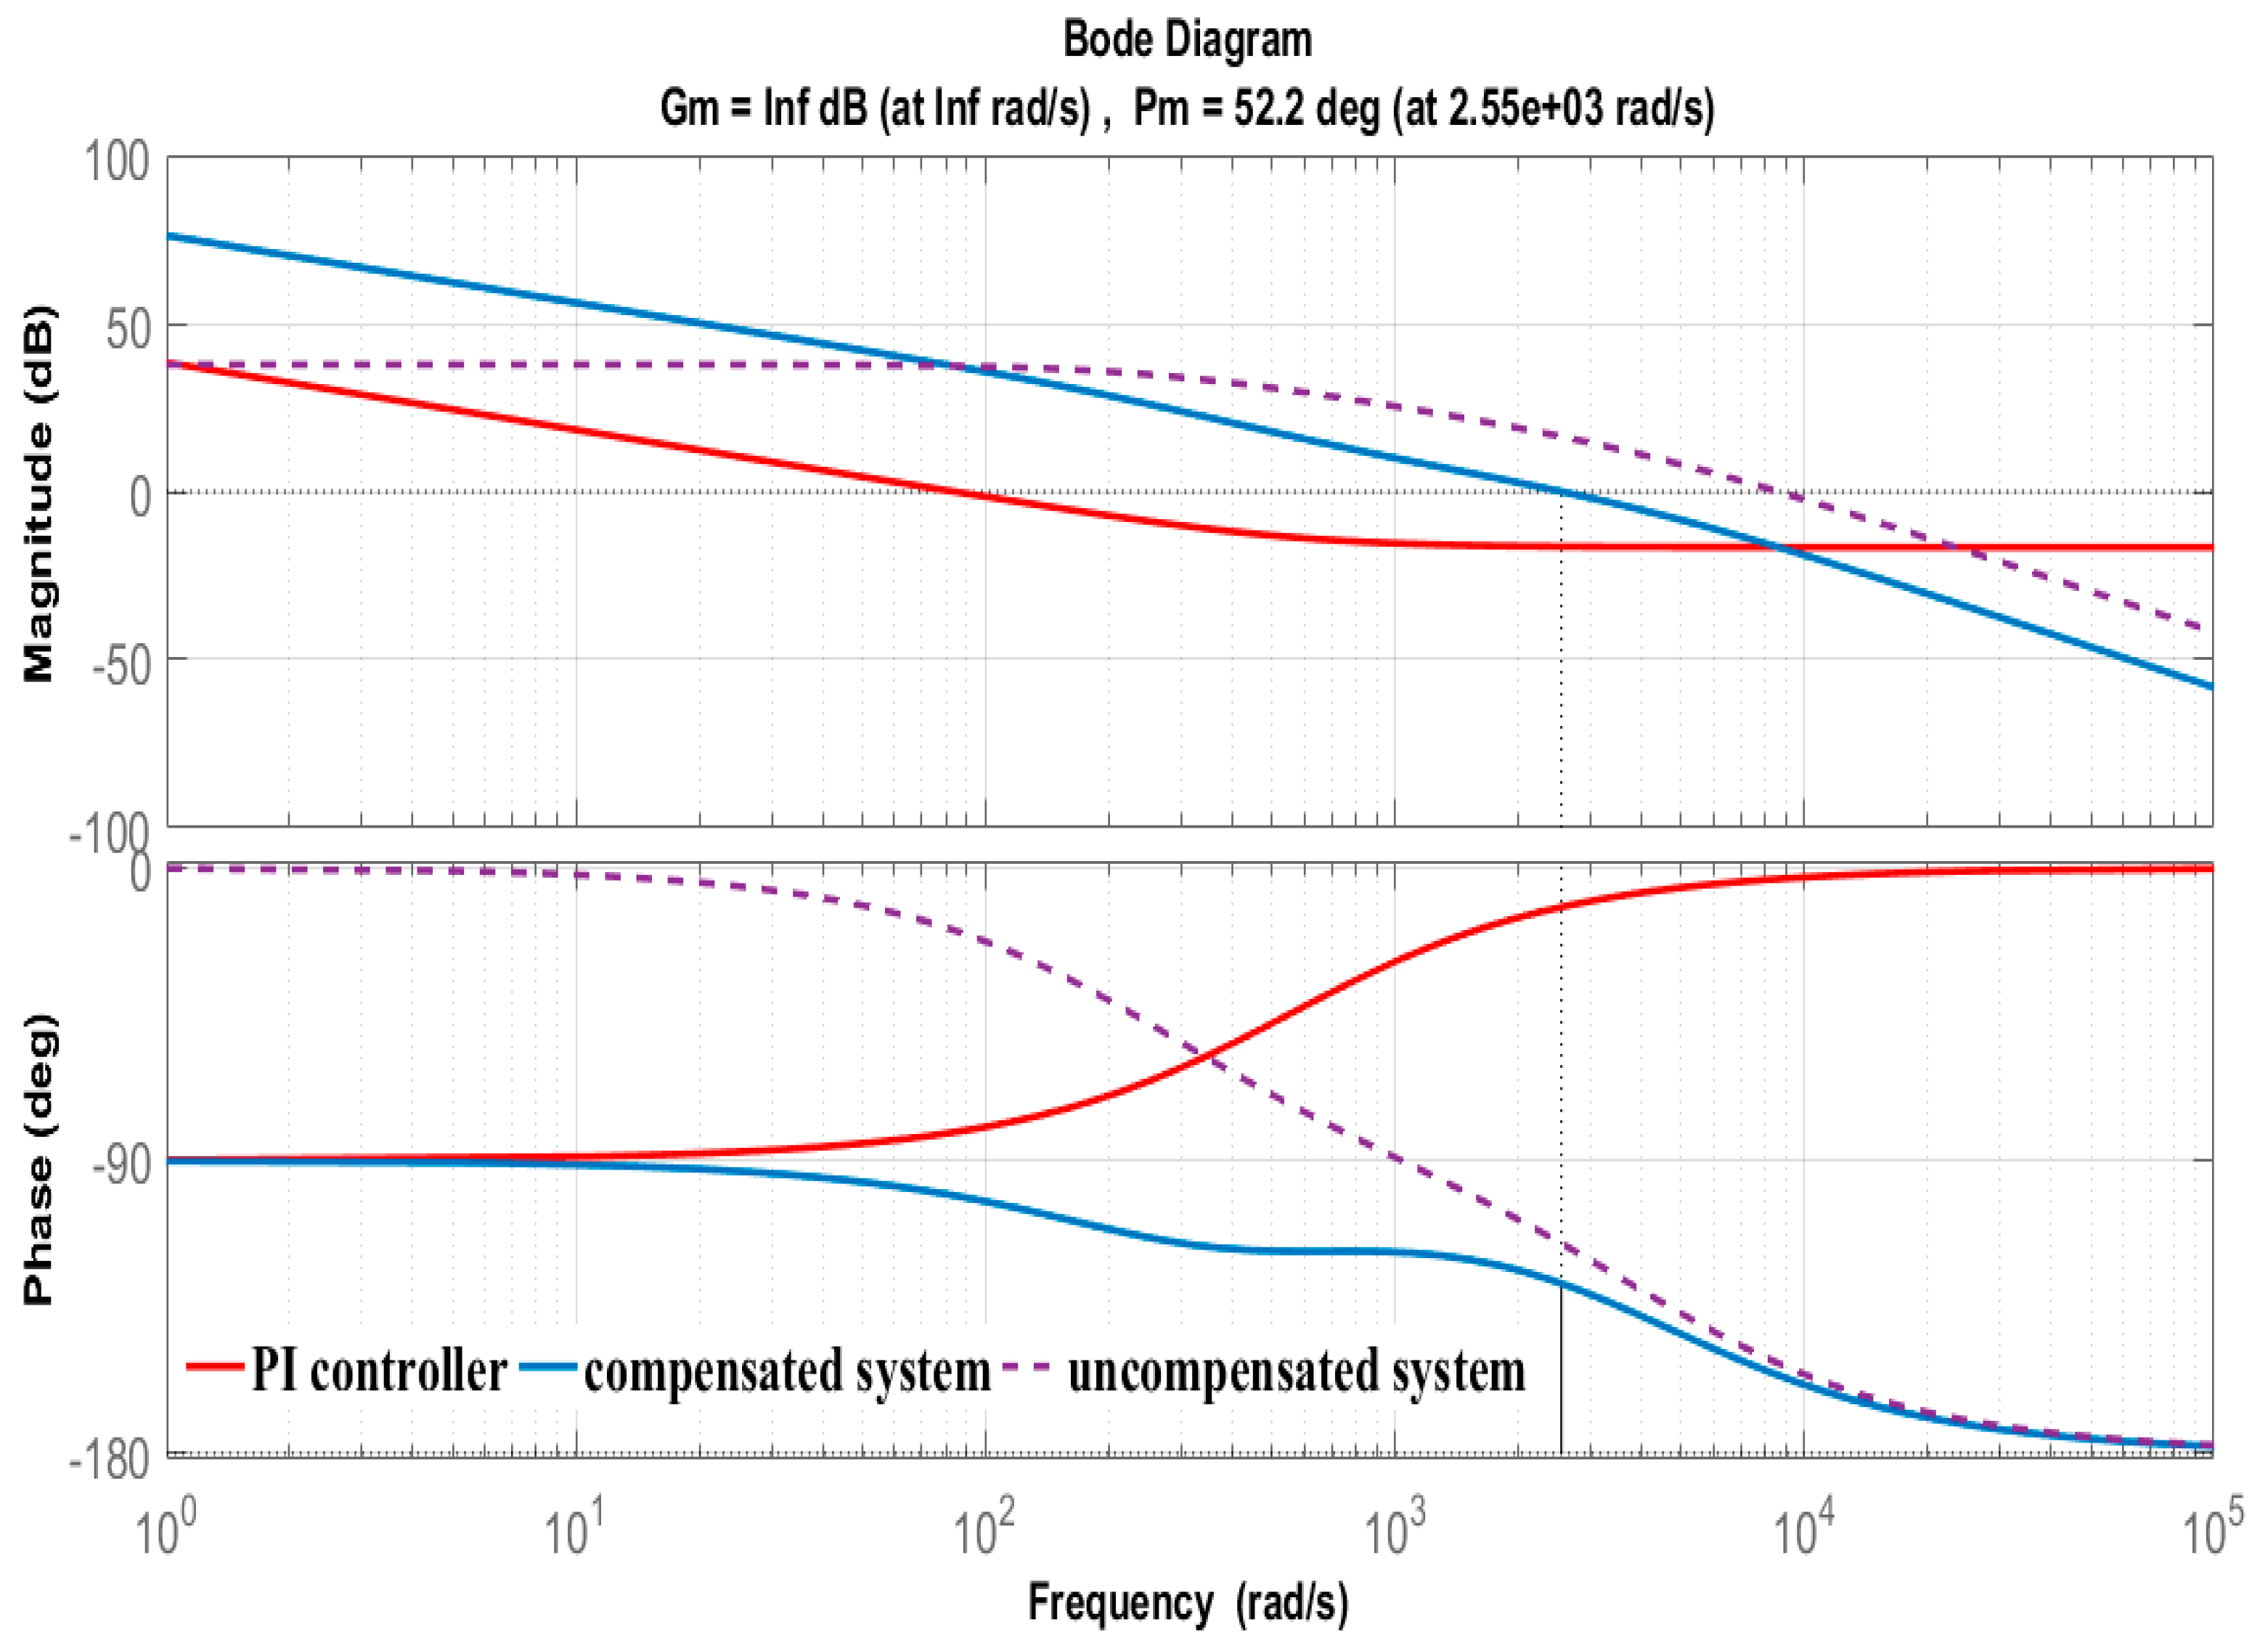
3.3. Design of the EL Voltage Control

Based on the operation of the converter [16,17], the large-signal model based on a switch averaging technique is obtained:
V 2 = 2 Dv 1 2 LI 2 T s
I 1 = 2 DI 2 + 2 LI 2 2 T s V 1
Applying the obtained model (24)–(25) with small-signal perturbation technique where the variables x are replaced by the average value (dc part) X 0 and perturbation (ac part) x ˜ , the small-signal model is found:
V 2 + v ˜ 2 = 2 ( D 0 + d ˜ ) ( V 1 + v ˜ 1 ) 2 L ( I 2 + i ˜ 2 ) T s
I 1 + i ˜ 1 = 2 ( D 0 + d ˜ ) ( I 2 + i ˜ 2 ) + 2 L ( I 2 + i ˜ 2 ) 2 T s ( V 1 + v ˜ 1 )
We define R e = 2 L T s (by neglecting the parasitic resistance of the switching inductor) then these two Equations become:
V 20 + v ˜ 2 = 2 V 1 d ˜ + 2 D 0 v ˜ 1   R e ( I 2 + i ˜ 2 )
I 1 + i ˜ 1 = 2 ( D 0 + d ˜ ) ( I 2 + i ˜ 2 ) + R e ( I 2 + i ˜ 2 ) 2 ( V 1 + v ˜ 1 )
By using the first-order approximation for McLaurin series for the last term of (29), it yields:
I 1 + i ˜ 1 = 2 ( D 0 + d ˜ ) ( I 2 + i ˜ 2 ) + R e ( I 20 + 2 I 20 i ˜ 2 ) ( 1 V 10 v ˜ 1 V 10 2 )
i ˜ 1 = 2 D 0 i ˜ 2 + 2 I 2 d ˜ + R e ( I 20 + 2 I 20 i ˜ 2 ) ( 1 V 10 v ˜ 1 V 10 2 )
Finally, considering only the ac small-signal part with R el = V 20 / I 20 and M = V 20 / V 10 , Equation (31) becomes:
i ˜ 1 = 2 D 0 i ˜ 2 + 2 I 2 d ˜ + R e R el 2 M 2 R in v ˜ 1 + 2 R e R el M C 1 i ˜ 2
The ac small-signal part of (28) can be found as:
v ˜ 2 = 2 V 1 d ˜ + 2 D 0 v ˜ 1   R e i ˜ 2
Using the obtained Equations (31) and (33), one can draw a small-signal model in Figure 4 where the output of the model is connected to the LC filter ( L 0 , C 0 ) loaded by the PEM EL resistance R el , defined in Section 2. The parasitic resistance of the inductor can be added into R e , as given in Equation (1).
To find a small signal transfer function V el ˜ d ˜ , the following Equations can be expressed using Figure 4:
v ˜ el = v ˜ 1 + 2 V 1 d ˜ R e i ˜ 2 L 0 di 2 dt
i ˜ 2 = C 0 d v el ˜ dt + v ˜ el R el
v ˜ el = v ˜ 1 + 2 V 1 d ˜ v ˜ el ( sR e C 0 + R e R el + sL 0 ( sC 0 + 1 R el )   )
v ˜ el ( 1 + ( sR e C 0 + R e R el + sL 0 ( sC 0 + 1 R el ) ) ) = v ˜ 1 + 2 V 1 d ˜
Suppose that v ˜ 1 = 0 ; and V 1 = V dc , it yields:
v ˜ el d ˜ = 2 V dc 1 + ( sR e C 0 + R e R el + sL 0 ( sC 0 + 1 R el ) )
It can be arranged in the following form:
v ˜ el d ˜ = 2 V dc s 2 L 0 C 0 + s ( R e C 0 + L 0 R el ) + 1 + R e R el
and
v ˜ el d ˜ = 2 V dc ( 1 + R e R el ) s 2 L 0 C 0 ( 1 + R e R el ) + s ( R e C 0 + L 0 R el ) ( 1 + R e R el ) + 1
Finally, the EL voltage to duty cycle small signal transfer function has been obtained:
G v 0 _ d ( j ω ) = V el ˜ D ˜ = 2 V dc R el R e + R el s 2 ( R el L 0 C o R e + R el ) + s ( R el R e C o + L 0 R e + R el ) + 1
This transfer function can be put in its standard form of a second order system:
V el ˜ D ˜ = K v s 2 ω 0 2 + s Q ω 0 + 1
where:
K v = 2 V dc R el R e + R el
ω 0 = ω 0 1 + R e R el
Q = Q 1 + R e R e l 1 + R e l R e C 0 L 0
ω 0 = 1 L 0 C 0
Q = R el C 0 L 0
The principle of the control system is shown in Figure 5.
The Bode diagram of the system for four different operation conditions (i.e., DC bus voltage change) is shown in Figure 6 and has been plotted based on the system specification provided in Table 3. In Figure 6, only the magnitudes change according to the DC bus voltage and not the phase since the denominator of the transfer function (42) does not depend on the DC bus voltage.
A summary of the harmonic response according to the DC bus voltage is provided in Table 4.
By analyzing the Bode diagram in Figure 6 and Table 4, it can be noticed that the uncompensated system has a poor phase margin (27° < PM < 39°) for a maximum cutoff frequency of 8620 rad/s and can result in voltage ringing and overshoot. Hence, it may damage the EL. By comparison, the gain margin is infinite and it means that the system will never begin to be unstable. Generally, to ensure the stability of the system, the gain margin must be as high as possible.
Moreover, the cutoff frequency has to be quite high (to ensure an acceptable bandwidth). As a result, it allows enhancing the system transient response. In this case, the minimum cutoff frequency (i.e., 5770 rad·s−1) is quite high to ensure a good system transient response.
Finally, as reported in Table 4, the current steady-state gains of the dynamic system lead up to steady-state errors. Since the PEM EL stack voltage reference needs to be tracked (i.e., Vel = 6 V) whatever the DC bus voltage change, an integral action is needed for set-point tracking. However, the addition of integral action in the dynamical process modifies the cutoff frequency and consequently the bandwidth. Hence, it makes slower the system transient response.
To enhance the performance of the converter in protecting the PEM EL during transient operations while guaranteeing a correct specific energy consumption and energy efficiency (i.e., set-point tracking), a suitable controller is needed to compensate for the low phase margin of the uncompensated system.
In this work, it has been chosen to design a PI controller according to the phase margin and cutoff frequency [38]. Since the crossover frequency in the worst case (i.e., VDC = 150 V) is quite high to ensure a good transient response, the phase margin requirement m φ at a given crossover frequency ωco is used. From the Bode plot of the transfer function (42) provided in Figure 6, the gain, m = | G v 0 _ d ( j ω ) | ω = ω c 0 , and the phase φ = G v 0 _ d ( j ω c o ) at the desired crossover frequency ω c o has been assessed. Afterward, according to the phase margin assignment control techniques, the coefficients Kp and Ki of the PI controller can be determined by using the following expressions:
K P 1 + ( 1 ω co T I ) 2 = 1 m
tan 1 ( ω c o T I ) = ϑ + π 2
where:
ϑ = ( 180 ° + m φ φ ) π 180 °
θ is the phase that the PI controller has to give.
To meet the requirements on the phase margins (a PM higher than 45°), and adopting the dynamic model in the Bode diagram, the parameters of the PI controller have been determined. The PI transfer function is provided by the following expression:
G PI ( s ) = K I . T I s + 1 s
T I =   K I K P
The PI coefficients have been tuned to obtain an overdamped response in a correct time domain to preserve the PEM EL from dangerous overshoots. Figure 7 shows the Bode diagram of the PI controller and the compensated system including the PI controller. As it can be observed, the PI controller has allowed modifying slightly the cutoff frequency, meeting the required phase margin at the desired crossover frequency. Indeed, in the worst case, the phase margin is equal to 52°; whereas for the lower DC bus voltage (i.e., VDC = 75 V), the phase margin is quite high, around 60°, keeping good bandwidth.
As a result, the PEM EL voltage ringing and overshoot can be avoided to protect the EL, which is crucial to optimizing its lifespan [39,40].

4. Presentation of the Experimental Setup and Results

4.1. Realization of the Experimental Setup

To validate the developed PI controller and the effectiveness of the converter from the voltage conversion gain and current ripples point of view, an experimental setup has been realized. The setup is given in Figure 8. It includes a laptop allowing controlling the DC power supply through a virtual control panel (1), a programmable DC power supply XR600 from MAGNA-POWER Company (Flemington, NJ, USA) (2), the PEM EL emulator (3), the developed three-level interleaved buck converter (4), a 4-channel oscilloscope (5), a voltage sensor (6), a microcontroller-based on a dsPIC33EP64GS502 (Microchip Technology Inc., Chandler, AZ, USA) (7), and driver boards (8). MOSFET power switches of the converter are controlled by four driver boards. The PEM EL emulator has been designed and realized through an equivalent electrical scheme as provided in Figure 2 [20]. Compared to a previous research work proposing a PEM EL emulator [41], the developed emulator allows reproducing the dynamic operation of the EL as a result of step supply current. The PI controller combined with an anti-windup action (to reset the controller to avoid its saturation) of the converter has been implemented into a microcontroller from MPLAB environment. During experimental tests, the two input DC capacitors voltages (i.e., C1 and C2) are acquired by two high-voltage probes P5200A from TEKTRONIX Company (Beaverton, OR, USA); while the currents (i.e., first phase current of the converter and EL current) are acquired by two current clamps 1146B from KEYSIGHT Company (Santa Rosa, CA, USA).

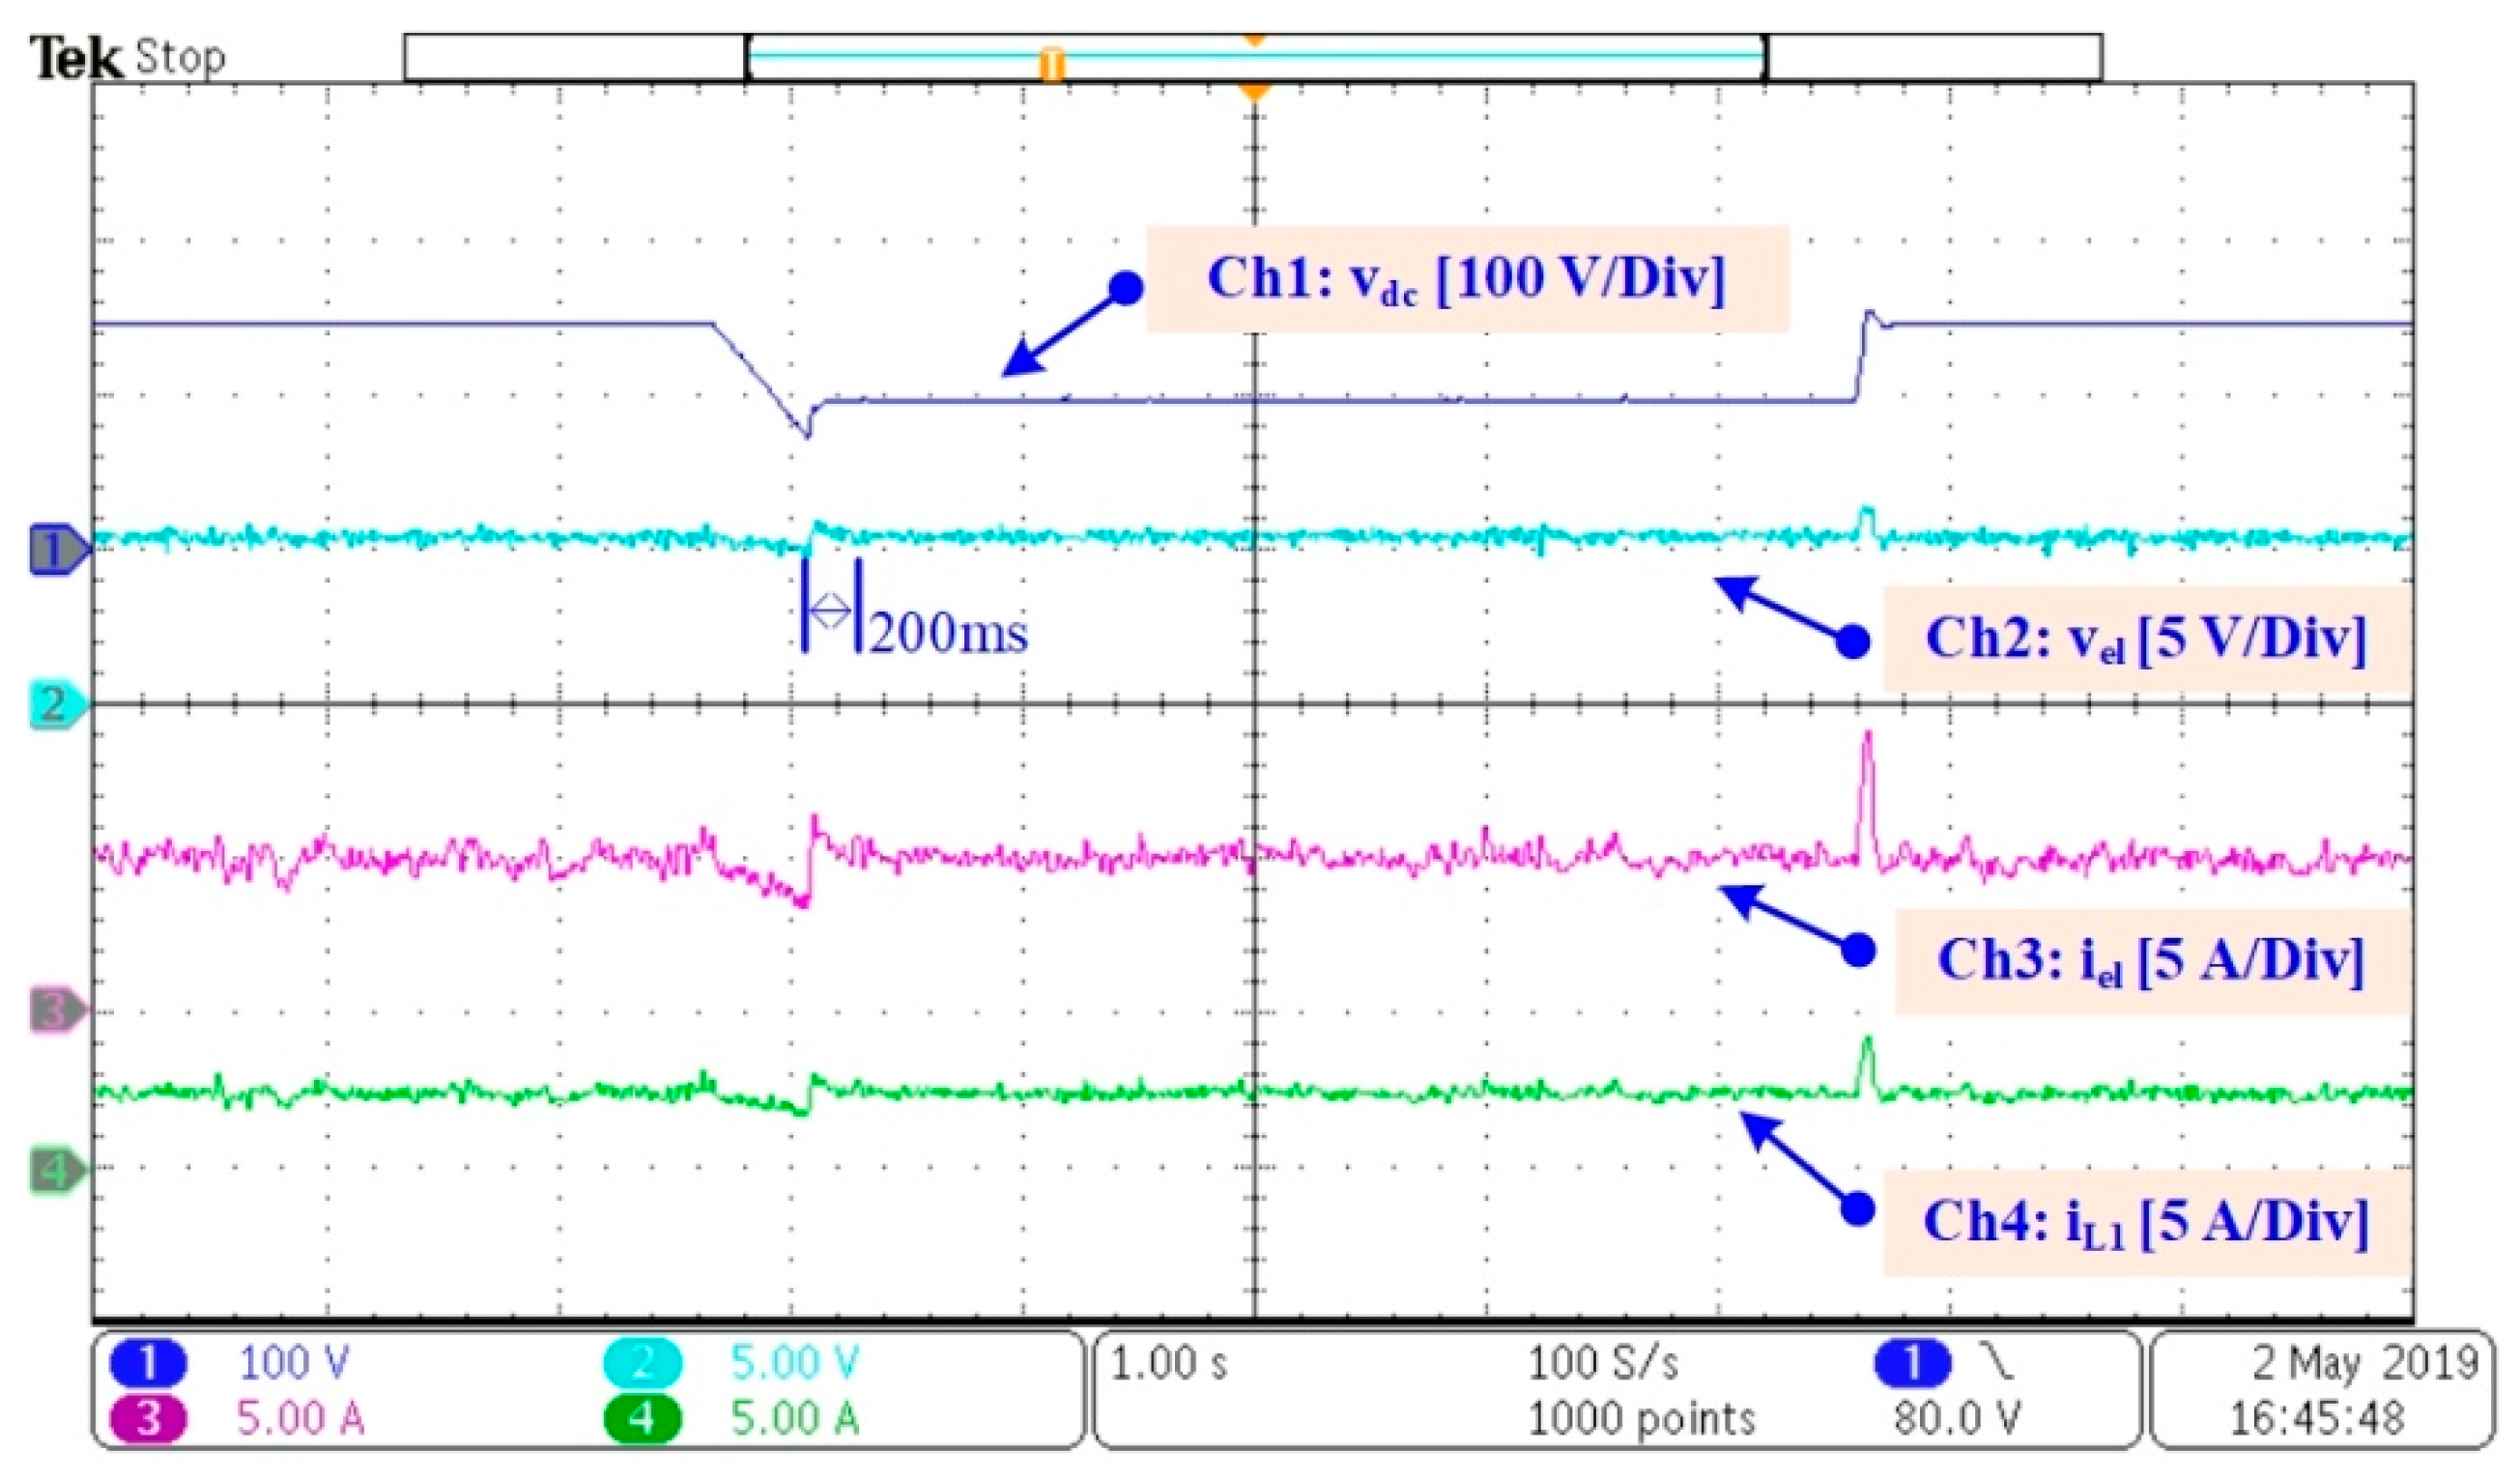
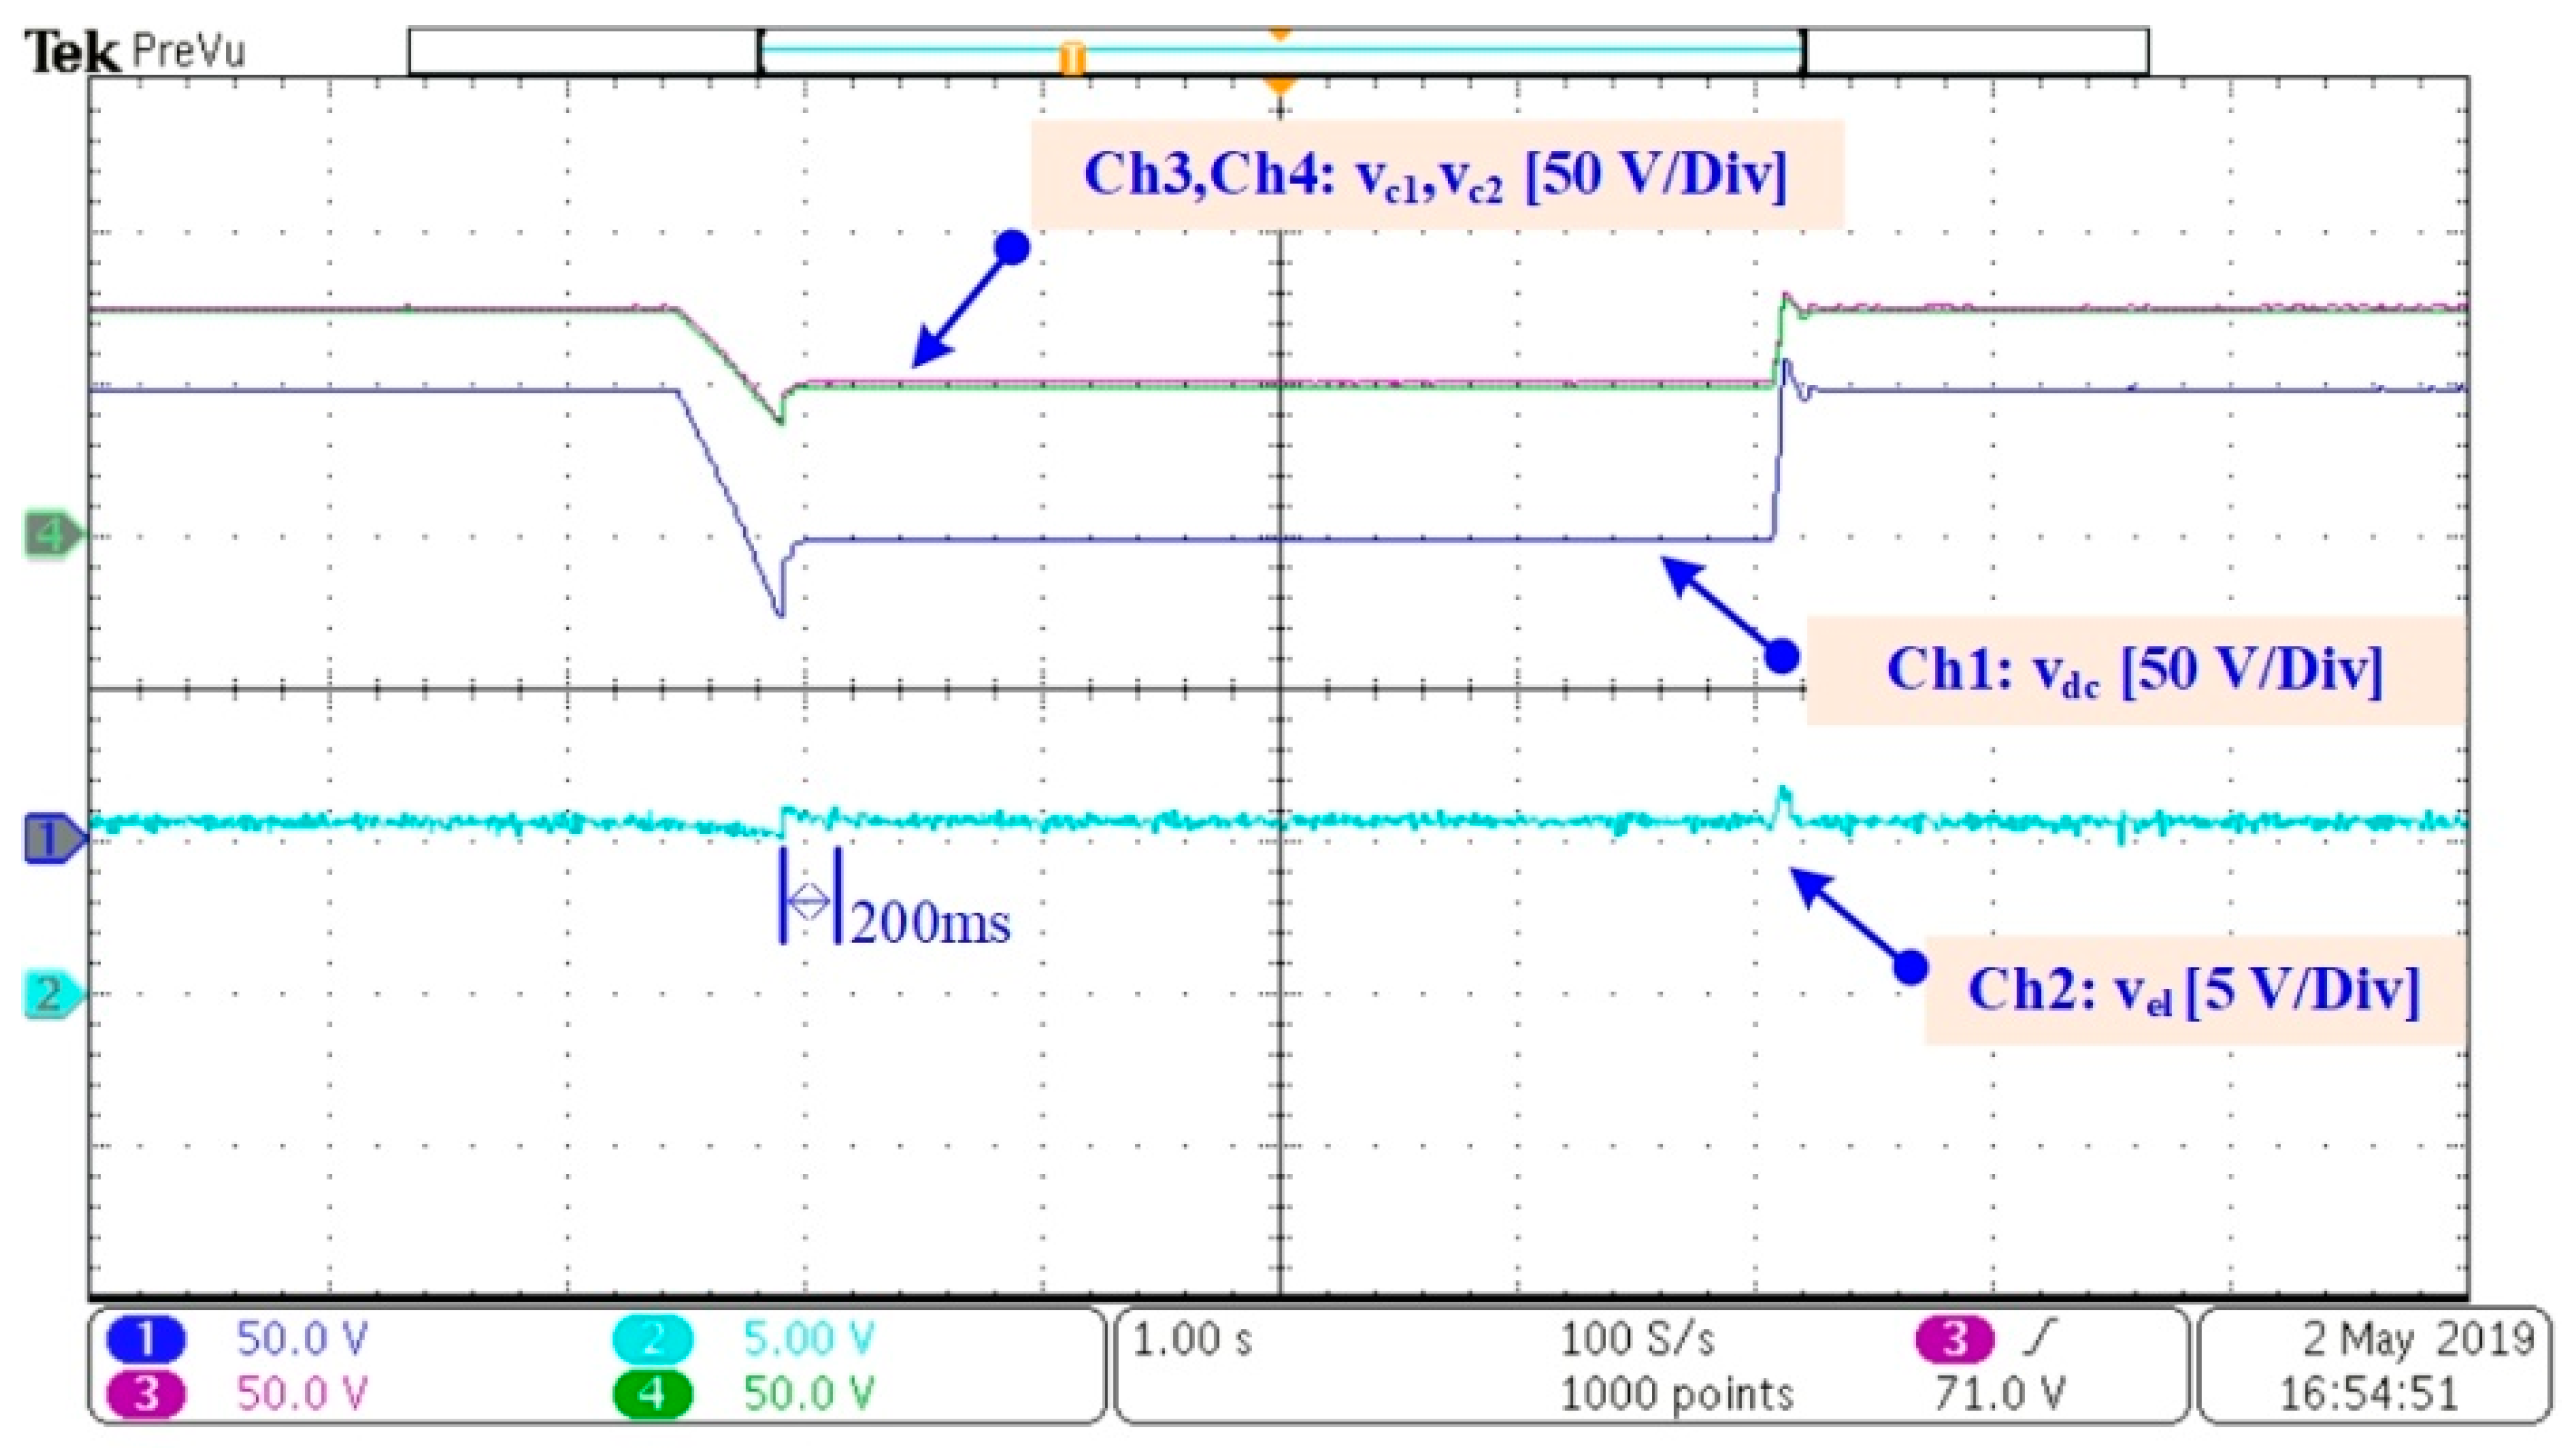
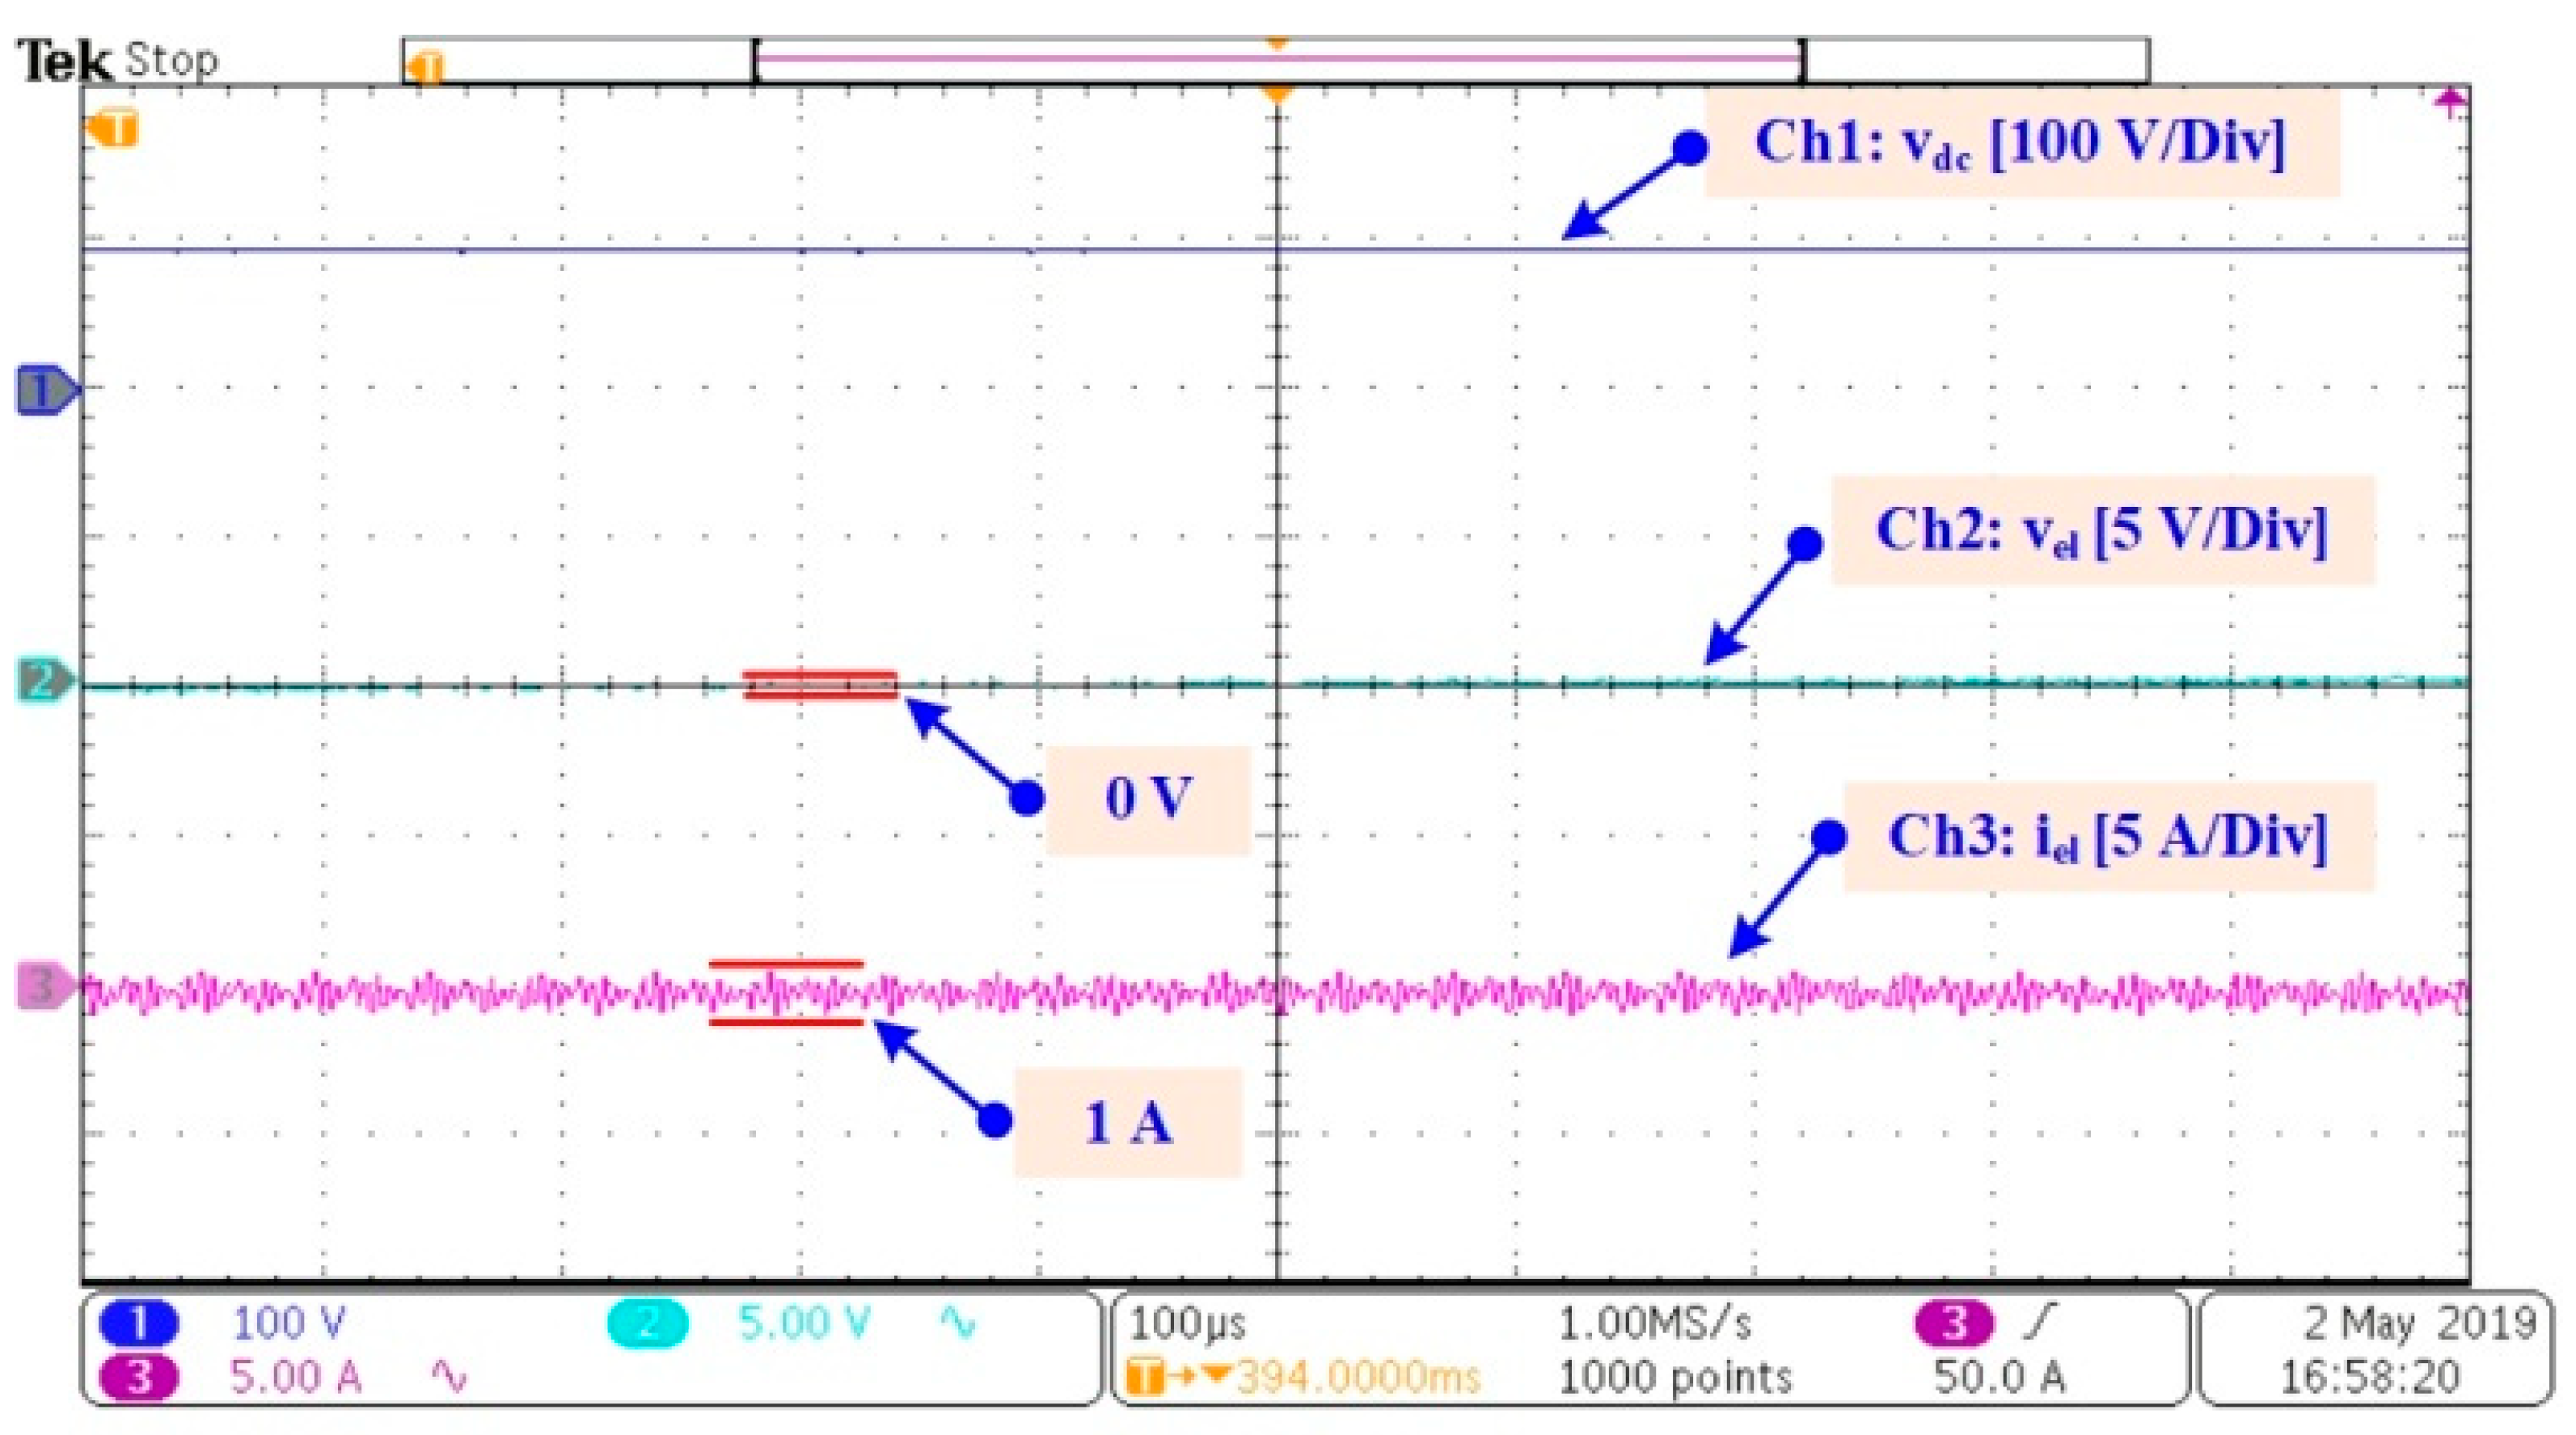
4.2. Obtained Results

To assess the effectiveness of the PI controller associated with an anti-windup action during transient states, two tests have been carried out under dynamic solicitations. The first dynamic consists of modifying the DC bus voltage from 75 V to 150 V; whereas the second dynamic test includes a first transient from 150 V to 100 V, and then from 100 V to 150 V. The obtained results are given in Figure 9 and Figure 10.
First of all, based on the results, it can be observed that the developed PI controller with the anti-windup action offers good dynamic performance from transient response and overshoot point of view. Indeed, as a result of DC bus voltage changes (both operating cases), the system allows for reaching its steady-state value in less than 0.2 s.
For the critical operating case, as given in Figure 9, the measured PEM EL voltage overshoot is equal to 3 V; whereas the overshoots for the PEM EL and phase converter currents are respectively equal to 7 A and 3 A. The PEM EL current overshoot is quite high because only one voltage single- loop control is used. To minimize this overshoot, a current loop must be added to the current control. However, since the PEM EL operates at a voltage lower than the rated voltage (i.e., 8 V), this current overshoot has no impact on the PEM EL reliability [39,40]. By comparison, for the second dynamic test (Figure 10), the PEM EL voltage overshoot is equal to 1 V; whereas the overshoots for the PEM EL and phase converter currents are respectively equal to 4 A and 2 A. These overshoots are lower compared to the first dynamic test due to the low DC bus voltage step (i.e., 50 V instead of 75 V). In brief, the PEM EL is protected against overvoltage, particularly during transient operation; consequently guaranteeing its reliability.
Then, additional dynamic tests have been carried out to analyze the input capacitors balance (C1 and C2) during transients operation. Indeed, as reported in reference [42], in DC-DC converters including several capacitors at the input or the output, the capacitors must be balanced to avoid additional stress on power electronics devices. These additional stresses may lead to failures and energy efficiency decrease. In this case, the capacitors voltage balancing must be ensured. Based on Figure 11, as a result of a DC bus voltage step, the two input capacitor voltages do not suffer from balancing issues. Hence, the reliability of the power electronics devices can be ensured and the benefits of the interleaved three-level buck converter as well.
Finally, results are reported in Figure 12 to assess the PEM EL current and voltage ripples by using AC coupling function. As emphasized in previous works [39,40], power conditioning systems play a key role in guaranteeing the reliability of the converter and optimizing EL lifespan. Indeed, voltage and current ripples lead to additional losses; while degrading the performance of the EL. For this reason, power conditioning systems must supply ELs with low voltage and current ripples. As it can be observed in Figure 12, during steady-state operation (i.e., VDC = 100 V), the PEM EL current and voltage ripples are close to zero; ensuring consequently the reliability of the PEM EL. Since the PEM EL can be modeled with an equivalent capacitor (around 37 F), the PEM current ripples can be filtered through it and consequently, the voltage ripples are cancelled.

5. Conclusions

In this article, a three-level interleaved DC-DC buck converter and its control have been developed for a proton exchange membrane electrolyzer. It has been decided to control the electrolyzer voltage to guarantee a correct system energy efficiency and hydrogen production rate. Besides, a thorough investigation of the energy efficiency of the system has allowed determining the PEM EL voltage reference. Then, to reach expectations in terms of settling time and transient response, a PI controller has been designed. To assess the features of the converter and the performance of the control, a suitable experimental test bench has been realized. Obtained results have validated the effectiveness of the control to protect the electrolyzer against overvoltage, particularly during transient operation. Moreover, the input capacitor balancing is ensured as a result of dynamic operations. The measured electrolyzer current and voltages ripples are quite low and result in ensuring a good reliability of the electrolyzer.
This work will be extended to take into account the dynamic model of the electrolyzer in designing the controller. Besides, to optimize the efficiency of the system, improvements will be brought to the studied DC-DC converter by interfacing the DC bus and the electrolyzer.

Author Contributions

conceptualization, B.Y., D.G., W.K. and M.P.; methodology, B.Y., D.G., W.K. and M.P.; validation, B.Y. and D.G.; investigation, D.G. and M.P.; writing—original draft preparation, D.G.; writing—review and editing, B.Y. and D.G.

Funding

This research received no external funding.

Acknowledgments

This research work has been supported in part by Thai-French Innovation Institute, King Mongkut’s University of Technology North Bangkok (KMUTNB) and the Group of Research in Electrical Engineering of Nancy (GREEN) of the University of Lorraine.

Conflicts of Interest

The authors declare no conflict of interest.

References

  1. Kim, J.-Y.; Kim, H.-S.; Baek, J.-W.; Jeong, D.-K. Analysis of Effective Three-Level Neutral Point Clamped Converter System for the Bipolar LVDC Distribution. Electronics 2019, 8, 691. [Google Scholar] [CrossRef]
  2. Rouzbehi, K.; Miranian, A.; Escaño, J.M.; Rakhshani, E.; Shariati, N.; Pouresmaeil, E. A Data-Driven Based Voltage Control Strategy for DC-DC Converters: Application to DC Microgrid. Electronics 2019, 8, 493. [Google Scholar] [CrossRef]
  3. Vivas, F.; Heras, A.D.L.; Segura, F.; Andújar, J. A review of energy management strategies for renewable hybrid energy systems with hydrogen backup. Renew. Sustain. Energy Rev. 2018, 82, 126–155. [Google Scholar] [CrossRef]
  4. Guilbert, D.; Collura, S.M.; Scipioni, A. DC/DC converter topologies for electrolyzers: State-of-the-art and remaining key issues. Int. J. Hydrogen Energy 2017, 42, 23966–23985. [Google Scholar] [CrossRef]
  5. Andrijanovitš, A.; Vinnikov, D.; Roasto, I.; Blinov, A. Three-Level Half-Bridge ZVS DC/DC Converter for Electrolyzer Integration with Renewable Energy Systems. In Proceedings of the 10th IEEE International Conference on Environment and Electrical Engineering (EEEIC), Rome, Italy, 8–11 May 2011; pp. 1–4. [Google Scholar]
  6. Andrijanovitsh, A.; Steiks, I.; Zakis, J.; Vinnikov, D. Analysis of State-of-the-Art Converter Topologies for Interfacing of Hydrogen Buffer with Renewable Energy Systems. Sci. J. Riga Tech. Univ. Power Electr. Eng. 2011, 29, 87–94. [Google Scholar] [CrossRef]
  7. Blinov, A.; Andrijanovits, A. New DC/DC Converter for Electrolyser Interfacing with Stand-Alone Renewable Energy System. Electr. Control. Commun. Eng. 2012, 1, 24–29. [Google Scholar] [CrossRef]
  8. Chandrasekhar, P.; Rama Reddy, S. Performance of Soft-Switched DC-DC Resonant converter for Electrolyzer. In Proceedings of the 4th IEEE International Symposium on Resilient Control Systems (ISRCS), Boise, ID, USA, 9–11 August 2011; pp. 95–100. [Google Scholar]
  9. Viswamohan, K.; Jayakrishna, G. Soft-Switching Techniques for DC-to-DC Converters in Electrolyzer Application. Int. J. Adv. Technol. Innovative Res. 2014, 6, 1021–1026. [Google Scholar]
  10. Gautam, D.S.; Bhat, A.K.S. A Comparison of Soft-Switched DC-to-DC Converters for Electrolyzer Application. IEEE Trans. Power Electron. 2013, 28, 54–63. [Google Scholar] [CrossRef]
  11. Rajesh babu, R.S.; Henry, J. A comparative Analysis of DC-DC Converters for Renewable Energy System. In Proceedings of the International MultiConference of Engineers and Computer Scientists (IMECS), Hong Kong, China, 14–16 March 2012; pp. 1–6. [Google Scholar]
  12. Pittini, R.; Zhang, Z.; Andersen, M.A.E. Isolated full-bridge boost DC-DC converter designed for bidrectional operation of fuel cells/electrolyzer cells in grid-tie applications. In Proceedings of the 15th European Conference on Power Electronics and Applications (EPE), Lille, France, 2–6 September 2013; pp. 1–10. [Google Scholar]
  13. Cavallaro, C.; Chimento, F.; Musumeci, S.; Sapuppo, C.; Santonocito, C. Electrolyser in H2 Self-Producing Systems Connected to DC Link with Dedicated Phase Shift Converter. In Proceedings of the IEEE International Conference on Clean Electrical Power (ICCEP), Capri, Italy, 21–23 May 2007; pp. 632–638. [Google Scholar]
  14. Chandrasekhar, P.; Rama Reddy, S. Design of LCL Resonant Converter for Electrolyser. Ann. “Dunarea de Jos” Univ. Galati 2010, 33, 5–11. [Google Scholar]
  15. Guida, V.; Guilbert, D.; Douine, B. Literature Survey of Interleaved DC-DC Step-Down Converters for Proton Exchange Membrane Electrolyzer Applications. Trans. Environ. Electr. Eng. 2019, 3, 33–43. [Google Scholar] [CrossRef]
  16. Ilic, M.; Hesterman, B.; Maksimovic, D. Interleaved zero current transition three-level buck converter. In Proceedings of the Twenty-First Annual IEEE Applied Power Electronics Conference and Exposition, Dallas, TX, USA, 19–23 March 2006; pp. 72–78. [Google Scholar]
  17. Ilic, M.; Maksimovic, D. Interleaved Zero-Current-Transition Buck Converter. IEEE Trans. Ind. Appl. 2007, 43, 1619–1627. [Google Scholar] [CrossRef]
  18. Mohanpurkar, M.; Luo, Y.; Terlip, D.; Dias, F.; Harrison, K.; Eichman, J.; Hovsapian, R.; Kurtz, J. Electrolyzers Enhancing Flexibility in Electric Grids. Energies 2017, 10, 1836. [Google Scholar] [CrossRef]
  19. Carmo, M.; Fritz, D.L.; Mergel, J.; Stolten, D. A comprehensive review on PEM water electrolysis. Int. J. Hydrogen Energy 2013, 38, 4901–4934. [Google Scholar] [CrossRef]
  20. Guilbert, D.; Vitale, G. Dynamic Emulation of a PEM Electrolyzer by Time Constant Based Exponential Model. Energies 2019, 12, 750. [Google Scholar] [CrossRef]
  21. Arunkumari, T.; Indragandhi, V. An overview of high voltage conversion ratio DC-DC converter configurations used in DC micro-grid architectures. Renew. Sustain. Energy Rev. 2017, 77, 670–687. [Google Scholar] [CrossRef]
  22. Şahin, M.E.; Okumuş, H.I.; Aydemir, M.T. Implementation of an electrolysis system with DC/DC synchronous buck converter. Int. J. Hydrogen Energy 2014, 39, 6802–6812. [Google Scholar] [CrossRef]
  23. Sarrias-Mena, R.; Fernández-Ramírez, L.M.; García-Vásquez, C.A.; Jurado, F. Electrolyzer models for hydrogen production from wind energy systems. Int. J. Hydrogen Energy 2015, 40, 2927–2938. [Google Scholar] [CrossRef]
  24. Zhou, T.; François, B. Modeling and control design of hydrogen production process for an active hydrogen/wind hybrid power system. Int. J. Hydrogen Energy 2009, 34, 21–30. [Google Scholar] [CrossRef]
  25. Fuel Cell Store. Available online: https://www.fuelcellstore.com/ (accessed on 24 August 2019).
  26. Kolli, A.; Gaillard, A.; De Bernardinis, A.; Bethoux, O.; Hissel, D.; Khatir, Z. A review on DC/DC converter architectures for power fuel cell applications. Energy Convers. Manage. 2015, 105, 716–730. [Google Scholar] [CrossRef]
  27. Kabalo, M.; Blunier, B.; Bouquain, D.; Miraoui, A. State-of-the-Art of DC/DC converters for fuel cell vehicles. In Proceedings of the IEEE Vehicle Power and Propulsion Conference (VPPC’10), Lille, France, 1–3 September 2010; pp. 1–6. [Google Scholar]
  28. Ulleberg, O. Stand-alone power systems for the future: optimal design, operation, & control of solar-hydrogen energy systems. Ph.D. Thesis, Norwegian University of science and Technology, Trondheim, Norway, December 1998. [Google Scholar]
  29. Khalilnejad, A.; Sundararajan, D.; Sarwat, A.I. Optimal design of hybrid wind/photovoltaic electrolyzer for maximum hydrogen production using imperialist competitive algorithm. J. Mod. Power Syst. Clean Energy 2018, 6, 40–49. [Google Scholar] [CrossRef]
  30. Rashid, M.; Al Mesfer, M.K.; Naseem, H.; Danish, M. Hydrogen Production by Water Electrolysis: A Review of Alkaline Water Electrolysis, PEM Water Electrolysis and High Temperature Water Electrolysis. Int. J. Eng. Adv. Technol. 2015, 4, 1–14. [Google Scholar]
  31. Ulleberg, Ø. Modeling of advanced alkaline electrolyzers: a system simulation approach. Int. J. Hydrogen Energy 2003, 28, 21–33. [Google Scholar] [CrossRef]
  32. Tijani, A.S.; Yusup, N.A.B.; Rahim, A.A. Mathematical Modelling and Simulation Analysis of Advanced Alkaline Electrolyzer System for Hydrogen Production. Procedia Technol. 2014, 15, 798–806. [Google Scholar] [CrossRef] [Green Version]
  33. Tijani, A.S.; Rahim, A.A. Numerical Modeling the Effect of Operating Variables on Faraday Efficiency in PEM Electrolyzer. Procedia Technol. 2016, 26, 419–427. [Google Scholar] [CrossRef] [Green Version]
  34. Tjarks, G.; Gibelhaus, A.; Lanzerath, F.; Müller, M.; Bardow, A.; Stolten, D. Energetically-optimal PEM electrolyzer pressure in power-to-gas plants. Appl. Energy 2018, 218, 192–198. [Google Scholar] [CrossRef]
  35. Schalenbach, M.; Carmo, M.; Fritz, D.L.; Mergel, J.; Stolten, D. Pressurized PEM water electrolysis: Efficiency and gas crossover. Int. J. Hydrogen Energy 2013, 38, 14921–14933. [Google Scholar] [CrossRef]
  36. Guilbert, D.; Gaillard, A.; Mohammadi, A.; N’Diaye, A.; Djerdir, A. Investigation of the interactions between proton exchange membrane fuel cell and interleaved DC/DC boost converter in case of power switch faults. Int. J. Hydrogen Energy 2015, 40, 519–537. [Google Scholar] [CrossRef]
  37. Koponen, J.; Kosonen, A.; Huoman, K.; Ahola, J.; Ahonen, T.; and Ruuskanen, V. Specific energy consumption of PEM water electrolysers in atmospheric and pressurised conditions. In Proceedings of the 18th European Conf. on Power Electron. and Applicat. (EPE ‘16–ECCE Europe), Karlsruhe, Germany, 5–9 September 2016. [Google Scholar]
  38. Bacha, S.; Munteanu, I.; Bratcu, A.I. Power Electronics Converters Modeling and Control; Springer: London, England, 2014. [Google Scholar]
  39. Dobo, Z.; Bence Palotas, Á.; Toth, P. The effect of power supply ripple on dc water electrolysis efficiency. Mater. Sci. Eng. 2016, 41, 23–31. [Google Scholar]
  40. Ursúa, A.; Marroyo, L.; Gubía, E.; Gandia, L.M.; Dieguez, P.M.; Sanchis, P. Influence of the power supply on the energy efficiency of an alkaline water electrolyser. Int. J. Hydrogen Energy 2009, 34, 3221–3233. [Google Scholar] [CrossRef]
  41. Ruuskanen, V.; Koponen, J.; Huoman, K.; Kosonen, A.; Niemelä, M.; Ahola, J. PEM water electrolyzer model for a power-hardware-in-loop simulator. Int. J. Hydrogen Energy 2017, 42, 10775–10784. [Google Scholar] [CrossRef]
  42. Pevere, A.; Petrella, R.; Mi, C.C.; Zhou, S. Novel interleaved multiphase proposal for a three level neutral point clamped buck converter. In Proceedings of the 2015 IEEE Applied Power Electronics Conference and Exposition (APEC), Charlotte, NC, USA, 15–19 March 2015; pp. 927–934. [Google Scholar]
Figure 1. interleaved buck converter connected to a PEM EL.
Electronics 08 00933 g001
Figure 2. electric scheme of the PEM EL [20].
Electronics 08 00933 g002
Figure 3. EL voltage, power vs current.
Electronics 08 00933 g003
Figure 4. signal model of the proposed converter.
Electronics 08 00933 g004
Figure 5. system of the converter connected with a PEM EL.
Electronics 08 00933 g005
Figure 6. diagram of the uncompensated system according to the input DC voltage Vdc.
Electronics 08 00933 g006
Figure 7. diagram of the PI controller and compensated system.
Electronics 08 00933 g007
Figure 8. experimental test bench.
Electronics 08 00933 g008
Figure 9. test from Vdc = 75 V to Vdc = 150 V: channel 1: DC bus voltage (Vdc), channel 2: PEM EL voltage (Vel), channel 3: PEM EL current (Iel), channel 4: first phase current (IL1).
Electronics 08 00933 g009
Figure 10. test from Vdc = 150 V to Vdc = 100 V, then from Vdc = 100 V to Vdc = 150 V: channel 1: DC bus voltage (Vdc), channel 2: PEM EL voltage (Vel), channel 3: PEM EL current (Iel), channel 4: first phase current (IL1).
Electronics 08 00933 g010
Figure 11. Input capacitors balance (dynamic test from vdc = 150 V to vdc = 100 V, then from vdc = 100 V to vdc = 150 V): channel 1: DC bus voltage (vdc), channel 2: PEM EL voltage (vel), channel 3: C1 capacitor voltage (vC1), channel 4: C2 capacitor voltage (vC2).
Electronics 08 00933 g011
Figure 12. PEM EL voltage ripple and current in steady state conditions with AC coupling (Vdc = 100 V): channel 1: DC bus voltage (vdc), channel 2: PEM EL voltage (vel), channel 3: PEM EL current (iel).
Electronics 08 00933 g012
Table 1. Main features of the investigated electrolyzer.
ParametersValueUnit
Rated electrical power120W
Stack operating voltage range7.5–8V
Stack current range0–15A
Delivery output pressure 0.1–10.5bar
Cells number3-
Active area Section50cm2
Hydrogen flow rate at STP (Standard Temperature and Pressure, 20 °C and 1 bar)0.3slpm
Table 2. Performance and operation of the PEM EL.
Vel (V)Iel (A)Pel (W)VH2 (slpm)QH2 (kg·h−1)Eel (kWh·kg1)ηs (%)
4.71.46.60.0280.000239.569
5.483.5519.50.0710.00044671
65300.10.000650.4572
6.26.137.80.1220.000752.168
6.5745.50.140.00854.6563
7.429.671.20.1920.001162.445
8.2510.6487.80.2130.001369.436
Table 3. System specifications.
ComponentsParameters
Vdc (Input voltage)75–150 V
L1,2,3,4 (phase inductors)200 μH
L0 (auxiliary inductor)1.1 mH
C1,2 (input capacitors)4.9 mF
C0 (output capacitor)3.3 mF
r (parasitic resistance of L)0.7 Ω
Re4.7 Ω
R e l = V e l   R t o t V e l V i n t (equivalent load) [20]1.63 Ω
Vel (EL voltage)6 V
Switching frequency10 kHz
Table 4. Summary of the harmonic response according to the DC bus voltage.
VDC (V)Phase margin, PM (°)Cutoff frequency (rad·s−1)DC gain (dB)Pole (×1000)
7538.6577038.7−4.2042
−0.2541
10033.7685051.6−4.2042
−0.2541
12530.3778064.5−4.2042
−0.2541
15027.7862077.4−4.2042
−0.2541

