Article

Measuring the Power Law Phase Noise of an RF Oscillator with a Novel Indirect Quantitative Scheme

1
School of Mechano-Electronic Engineering, Xidian University, Xi’an 710071, China
2
Science and Technology on Electronic Test & Measurment Laboratory, Qingdao 266555, China
*
Author to whom correspondence should be addressed.
Electronics 2019, 8(7), 767; https://doi.org/10.3390/electronics8070767
Submission received: 30 April 2019 / Revised: 23 June 2019 / Accepted: 8 July 2019 / Published: 9 July 2019
(This article belongs to the Section Microwave and Wireless Communications)

Abstract

:
In conventional phase noise metrology, the phase noise of an oscillator is measured by instruments equipped with specialized and sophisticated devices. Such hardware-based testing usually requires high-performance and costly apparatuses. In this paper, we carried out a novel phase noise measurement method based on a mathematical model. The relationship between the phase noise of a radio frequency oscillator and its power spectral density (PSD) was established, different components of the power law phase noise were analyzed in the frequency domain with their characteristic parameters. Based on the complete physical model of an oscillator, we fitted and extracted the parameters for the near-carrier Gaussian and the power law PSD with Levenberg-Marquardt optimization algorithm. The fitted parameters were used to restore the power law phase noise with considerable precision. Experimental validation showed an excellent agreement between the estimation from the proposed method and the data measured by a high-performance commercial instrument. This methodology can be potentially used to realize fast and simple phase noise measurement and reduce the overall cost of hardware.

1. Introduction

Phase noise occurs in almost all sorts of oscillators [1], ranging from radio frequency (RF) [2] to optics [3], and presents a direct impact on the performance of modern communication, radar and navigation systems in terms of reliability, detectability, and accuracy [4]. The critical step of phase noise abatement should be particularly considered in fiber-optical communication [5], and the determination of phase noise draws attention from engineers and researchers in the RF electronic community [6,7].
Modern instrumental measurement of the noise performance of an oscillator can be sorted into three methodologies, namely the direct phase detection, delay-line discrimination, and digital phase demodulation [8]. The frequency and phase demodulation are particularly important and used widely for commercial instruments [9]. However, these approaches usually adopt either a delay-line homodyne [10] or a phase-lock-loop to discriminate the phase fluctuation and measure the noise [11]. A reference source must be used, and its frequency should be maintained the same (synchronized) as the signal-under-test (SUT). Practically, the phase noise of the reference source must be at least one order lower than the SUT in order to realize reliable measurement. The accuracy of the phase noise measurement depends heavily on the performance of phase-locked loop (PLL) and other functional circuits. These requirements have technical difficulty and can inevitably increase the total cost of the measurement.
In the community of signal noise measurement, elaborate designs of testing apparatuses have been materialized in both the time-domain and frequency-domain to precisely measure the phase noise performance of an RF free oscillator. However, such straightforward measurement relies on high-performance hardware and does not consider the nature of the phase noise of a source. Recently, studies that focused on the generation mechanism of the phase noise were being carried out by many groups. The mathematical models of phase noise allowed phase noise of an oscillator to be characterized by mathematical manipulations [12]. Given substantial advantages of cost-effectiveness and simplified setup, phase noise evaluated by software-based mathematical algorithms has great potential in practical measurement. Theoretical [13] and experimental [14] works have been contributed to the fundamentals of phase noise models both in the time and frequency domain during the past decades [6]. In the frequency domain, phase noise was usually characterized by its power spectral density (PSD), which can be derived as the Fourier transform of the autocorrelation function [15]. Suggested by Leeson et al. [16,17], the spectrum of the phase noise of a free oscillator can be intuitively depicted as a power-law relation. The independent power indices indicate five sorts of phase noise which were studied by parts [17] or separately [18] in terms of their PSD where the factor of each power law term indicates the magnitude of its corresponding noise component. However, such “heuristic derived” [16] factors in the Leeson’s model, have not been determined directly, only qualitative conclusions were drawn from simulation from many of the presented works. Among these works, Chorti et al. [19] developed a comprehensive power law model with respect to the PSD of a free oscillator by analyzing zero-mean Gaussian stochastic phase noise in the frequency domain, which essentially connects the power law phase noise of the oscillator to its measurable power spectrum density. Unfortunately, the work mainly focused on theoretical simulation and did not move forward to the phase of experimental validation, or as proposed in this work, determine the phase noise quantitatively.
In this work, we proposed a novel phase noise measurement method with the application of an extended form of the Leeson’s power law theory proposed by Chorti et al. [19]. The testing modality is based on a mathematical model which correlates the phase noise components of the SUT with its power spectral density. The PSD data were measured and fitted to the model obtaining parameters with respect to the phase noise model, and consequently, the phase noise can be determined. The mathematical manipulation algorithm was predesigned with software programs which can reduce the use of complicated circuits or hardware and simplify the testing devices. To validate this methodology, a group of contrast experiments were carried out with error analysis. The results indicate that the proposed method exhibited similar accuracy with respect to a high-performance commercial phase noise analyzer.

2. System Model

2.1. Testing Modality

In order to resolve the main confinement of high-performance functional hardware, this research developed a mathematical phase noise measurement modality. The testing schematic is depicted in Figure 1. The SUT was output from an RF signal source and its PSD was measured by a spectrum analyzer. As discussed above, the phase noise of the oscillator under test can be well described with power-law relation. With this knowledge of SUT, its phase noise was obtained further by fitting the PSD data to a composite power-law expression, and the coefficients were extracted. To validate the performance of measurement, a high-performance phase noise analyzer was used to test the same SUT. The commercial phase noise analyzer was equipped with specially designed hardware and sophisticated modules for phase noise measurement, therefore, its measurement can be regarded as a reliable reference. The measurement results were compared with the ones acquired by the proposed method.

2.2. Phase Noise Model

The mathematical derivation of phase noise PSD should be sought and correlated with the PSD of the oscillator. Basically, a non-ideal oscillator can be expressed by a combination of noise and a sinusoidal signal [20], written in a complex form as
V ( t ) = [ V 0 + a ( t ) ] exp { i [ 2 π f 0 t + φ ( t ) ] }
where a(t) and φ(t) denote the amplitude and phase noise, respectively. The phase noise becomes dominant when the offset frequency range is small and close to the central frequency f0 [21], within which our measurements were taken. In the frequency domain, the single sideband PSD of phase noise L(f) is of main interest in practical measurement and expressed as
L ( f ) = 1 2 S φ ( f ) = 0 + R φ φ ( t ) exp ( 2 π i f t ) d t
In Equation (2), f indicates the frequency offset with respect to the nominal central frequency f0 and Rφφ(t) is the autocorrelation of phase fluctuation. Equation (2) can also be expressed in terms of frequency noise by rewriting the relative frequency deviation in the time domain as y ( t ) = ( 2 π f 0 ) 1 d φ ( t ) / d t , and the PSD for the frequency noise can be expressed as
S y ( f ) = f 2 f 0 2 S φ ( f )
To analyze the SUT from an oscillator, the PSD of V(t) should be derived. Taking Fourier transform with respect to V(t) yields
V ( f ) = δ ( f ) F [ e i φ ( t ) ]
where δ denotes the Dirac delta function and the nominal central frequency f0 is normalized by using the coordinate of offset frequency f. For the case of a relatively precise and high-performance oscillator, φ(t) is small and we consider the Taylor expansion of the second term in Equation (4), viz. exp [ i φ ( t ) ] 1 + i φ ( t ) 1 / 2 φ 2 ( t ) + , the PSD of V(t) would be written as
S V ( f ) = δ ( f ) + R ( f ) + φ ( f 0 ) φ ( f ) = δ ( f ) + R ( f ) + S φ ( f )
where R(f) comes from the nonlinear terms of φ(t) and can only be neglected for the small-angle approximation. In other cases, S V ( f ) should be discussed independently [18].
The power law relation that interprets phase noise in the frequency domain has been discussed by A. Demir [13], S. Yousefi [18], C. Greenhall [22], and N. Ashbby [23], etc. Qualitatively, the PSD of the phase noise term Sφ(f) exhibits a Gaussian shape when close to the carrier, or f ~ 0, which is followed by the so-called “power law region” [24]. The latter can be concisely expressed as the summation of hα fα over α = 0, −1, −2, −3 and −4, representing white phase noise, flicker phase noise, white frequency modulated (FM) noise, flicker FM phase noise, and random walk FM phase noise respectively. Each h α stands for the magnitude of the corresponding noise component. Considering the practical bandwidth of commercial instruments, such five sorts of noise can be expressed in the PSD form of both S V ( f ) and S φ ( f ) as summarized in Table 1 [17,18,19,22]. It can be seen that for a large offset frequency f, S φ ( f ) gradually approaches S V ( f ) , which conforms well with the small-angle approximation. For the cases of flicker FM and random walk FM phase noise, they will generate Gaussian components in the PSD of the oscillator which becomes significant for a small f. It should be mentioned that, although the factors h α are all constants upon the foregoing analysis, they would vary with respect to different carrier f0, which results in a more strict estimation model; our experiments nevertheless showed phase noise approximated even with even constant factors agreed perfectly with data measured by a commercial phase noise analyzer in practice.

2.3. Factor Approximation

The analytical forms of the oscillator’s PSD and concomitant phase noise consist of ten unknown parameters, five of which being the power-law factors, viz. hα. To conduct efficient parameter approximation and optimization, we simplify our data fitting process and assume that: (i) For commercial testing instruments, their bandwidth is usually much larger than the SUT and thus the white phase noise component in S V ( f ) is the same as its counterpart in S φ ( f ) , (ii) with ν1 being a very small positive value for the flicker noise of an oscillator, the identity also stands with respect to flicker phase noise and results in a simple 1/f spectrum, (iii) parameters p and f ¯ are actually connected and functions of h−4 [19]. For a real oscillator, h−4 and p are usually small and the effect of the power law starting frequency f ¯ is limited, which will be verified by the experimental results in the following section. With the above assumptions, only six parameters need to be determined, namely the Gaussian component q and the power law factors hα.. The objective function F(f) for optimization can be written, based on the least square criterion [25], as
F ( f ) = min h α , q , p { [ 10 lg [ S V ( f ) ] P e ( f ) ] 2 }
S V ( f ; h α , q , p ) = 1 q exp ( π f 2 q 2 ) + p 2 π 2 h 4 exp ( p f 2 2 π h 4 ) + h 0 + h 1 f 1 + h 2 ( π 2 h 2 2 + f 2 ) 1 + h 3 f 3 + h 4 f 4
where Pe(f) is the experimental tested PSD in the logarithmic coordinate. It should be noted that the objective function Equations (6) and (7) had been modified by omitting the Heaviside step function but adding parameter p in the variable list. Such setting violates the equations with respect to power unity and PSD continuity [19], hence, causes a perceptible discrepancy for frequencies close to the carrier, nonetheless, it has limited impact upon the determination of phase noise within the power law region, but would effectively decrease the computational complexity. The constraints for the variables are
{ 1 > h α , p , q > 0 p 2 π 2 h 4
in which the upper bound for the factors of all terms in Equation (7) is set to 1 to comply with the energy conservation of an oscillator’s PSD. Equations (6)–(8) can be optimized by a gradient-based Levenberg-Marquardt algorithm [23]. The Levenberg-Marquardt algorithm is the most widely used non-linear least squares algorithm. By giving the initial iteration value, the optimal solution can be obtained by gradient descent faster.

3. Results and Discussion

To validate the phase noise measurement capability by the mathematical relationship between the power spectrum and power law phase noise model, a testing system was established. In the experimental arrangement, the SUT was a carrier signal directly output from an RF signal source (R&S® SMW200A), and its PSD was measured by a spectrum analyzer (R&S® FSW). R&S® SMW200A has good phase noise performance (single-sideband phase noise ≤90 dBc/Hz for 1 GHz carrier and frequency offset >10 Hz, the overall noise pattern is close to the theoretical power-law model according to the instrumental specification [26]) which is conducive to experimental verification. The mathematical model gives predictions for the phase noise of the RF source at different carrier frequencies. The reference phase noise data was offered by a high-performance phase noise analyzer (R&S® FSWP). A group of error and accuracy analysis was carried out for further analysis.
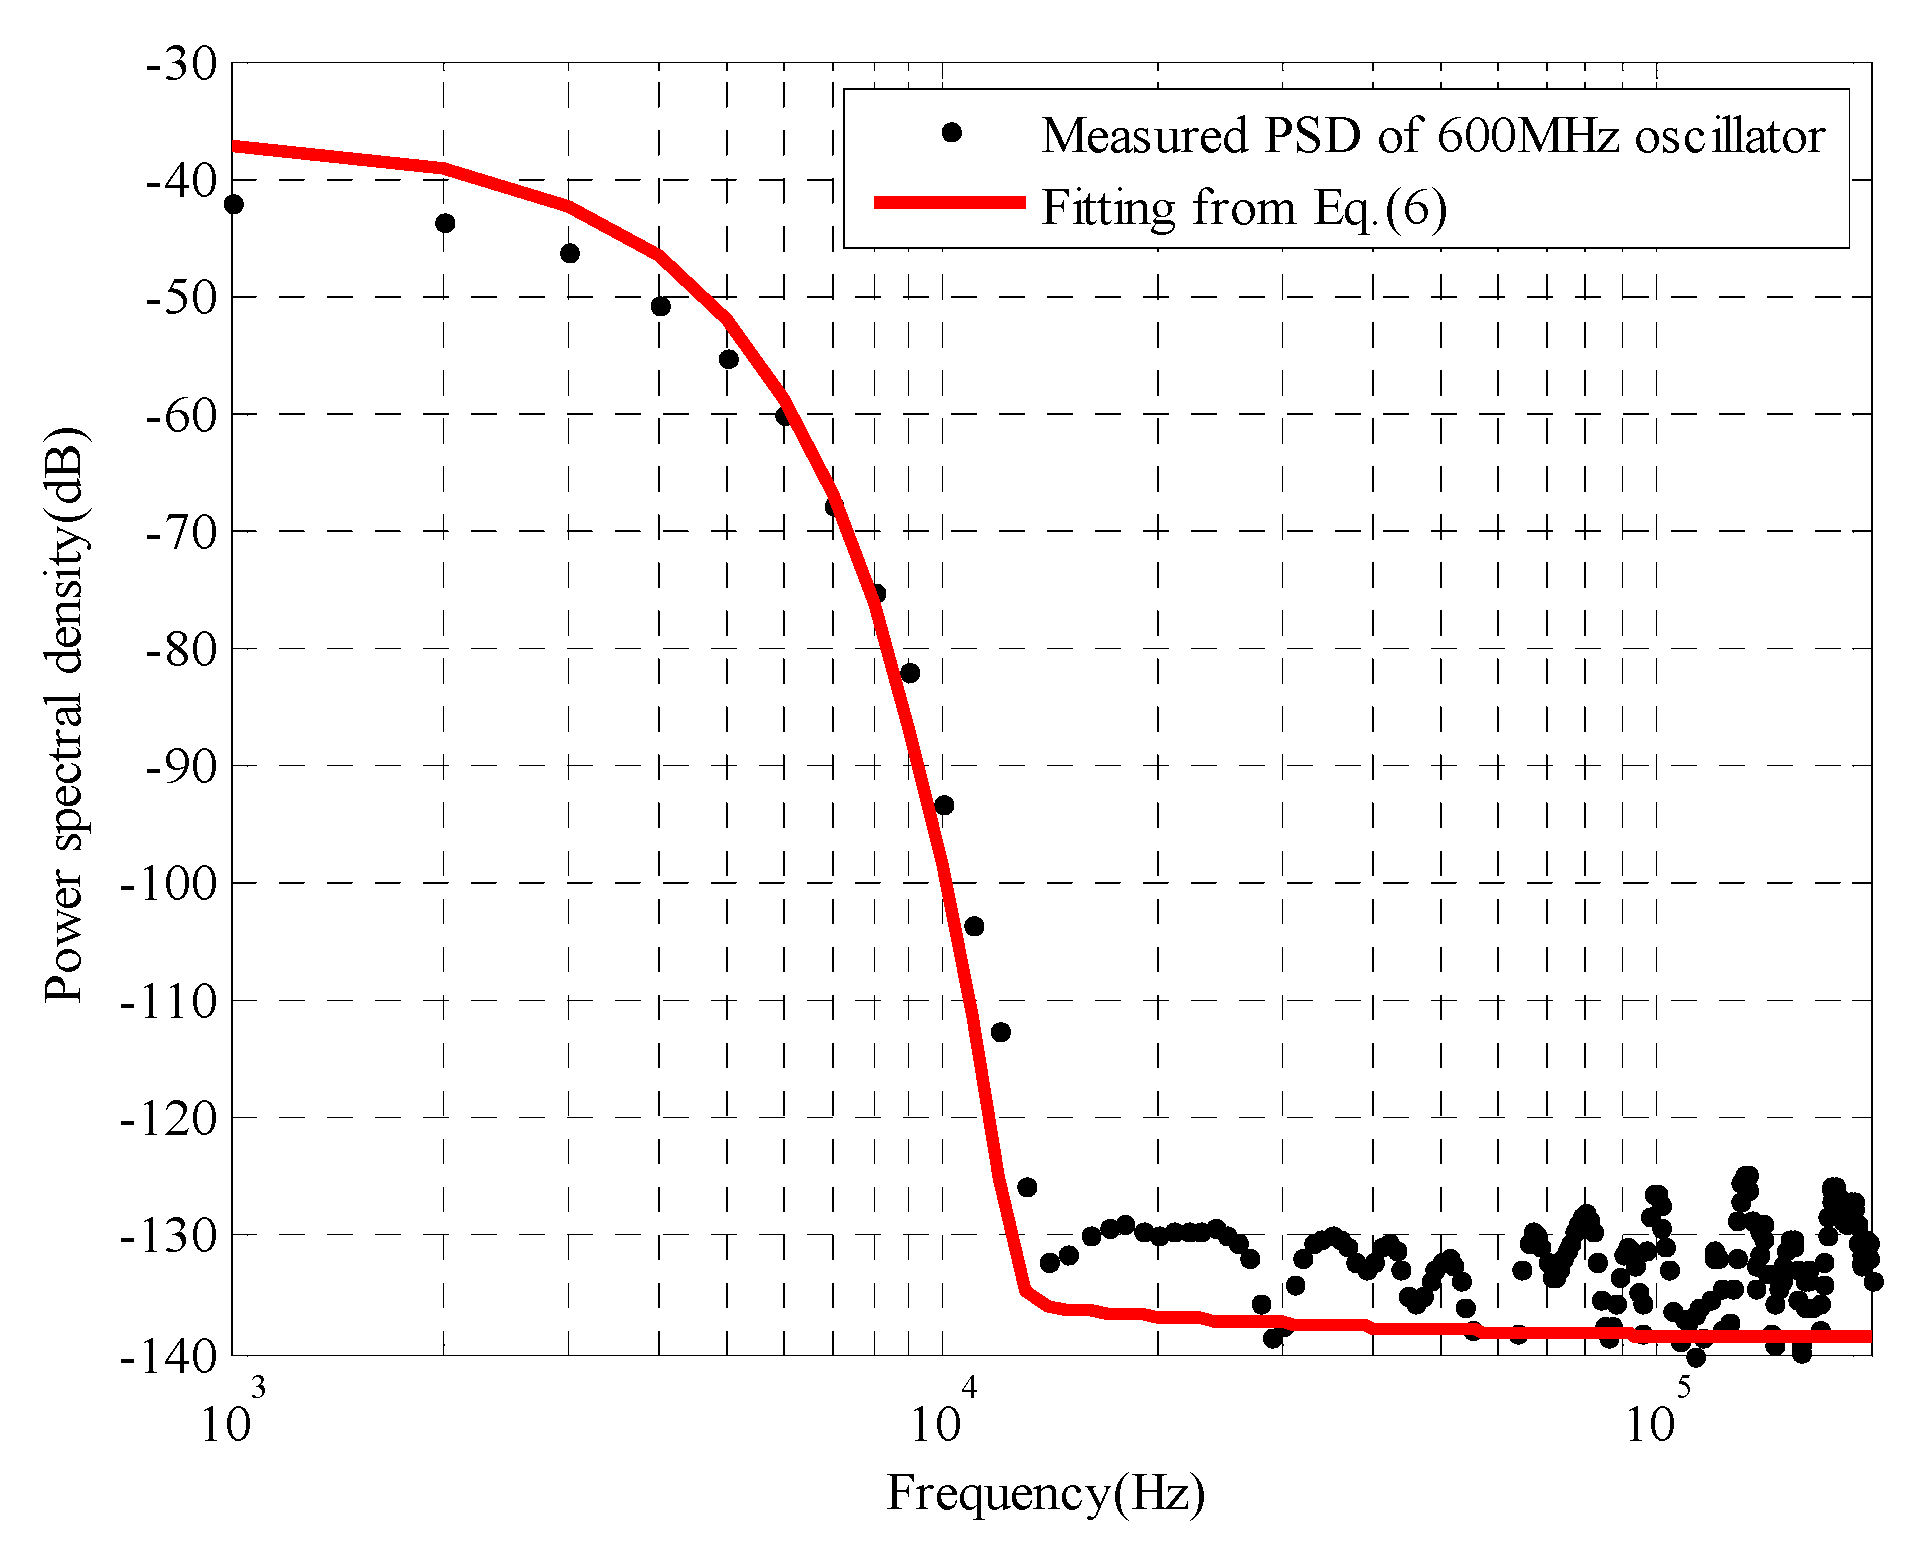
The capability of phase noise measurement by the proposed method was validated at a series of carrier frequencies. The carrier frequency of 10 MHz, 100 MHz, and 600 MHz was used as examples for phase noise analysis. The normalized single sideband PSD of the SUT at 600 MHz carrier obtained by the spectrum analyzer is shown in Figure 2 with the abscissa denotes the frequency offset (in Hz). In order to enhance the optimization, it would be very helpful to qualitatively analyze the power spectrum prior, to generate a reliable guess and narrow the variable bounds. The parameters after fitting are used to restore phase noise. Intuitively, one can observe a baseline for frequency larger than ~10 kHz in spite of some fluctuations. The actual values of these fluctuations are very small in linear coordinates. Since the least square method is used in the calculation process, the error between experimental and numerical values is the smallest. The baseline can be mainly characterized by white phase noise [17] and the constraint for h−4 can be further narrowed as 10−13 > h−4 > 10−15. Similarly, the lower and upper bound of the rest power-law coefficients can be modified as from 10−14 to 10−8 consecutively. Levenberg-Marquardt iteration is able to find the optimized fitting with fast convergence with proper guesses and narrowed boundary limit for hα, α = 0, −1, −2, −3 and −4. The optimized fitting results are shown in Figure 2 (red-dashed-line).
The extracted parameters for the PSD of the three groups of SUT are presented in Table 2. The value of ν3 is derived from the expression of q and conforms well to the desired feature of ν3→0 described in [17,18]. Due to the absence of f ¯ in the model, p is fitted out to be a very small number, and the spectrum of near-carrier range is resulted from the superposition of Gaussian and f 4 components without a knee point. This feature obviously violates the equations of power unity and spectral continuity, and that is the reason for the larger discrepancy between the experimental and fitted spectrum close to the carrier (< ~4 kHz). For larger offset frequency range, the fitting curve correctly predicts the trend and change pattern of the oscillator’s PSD.
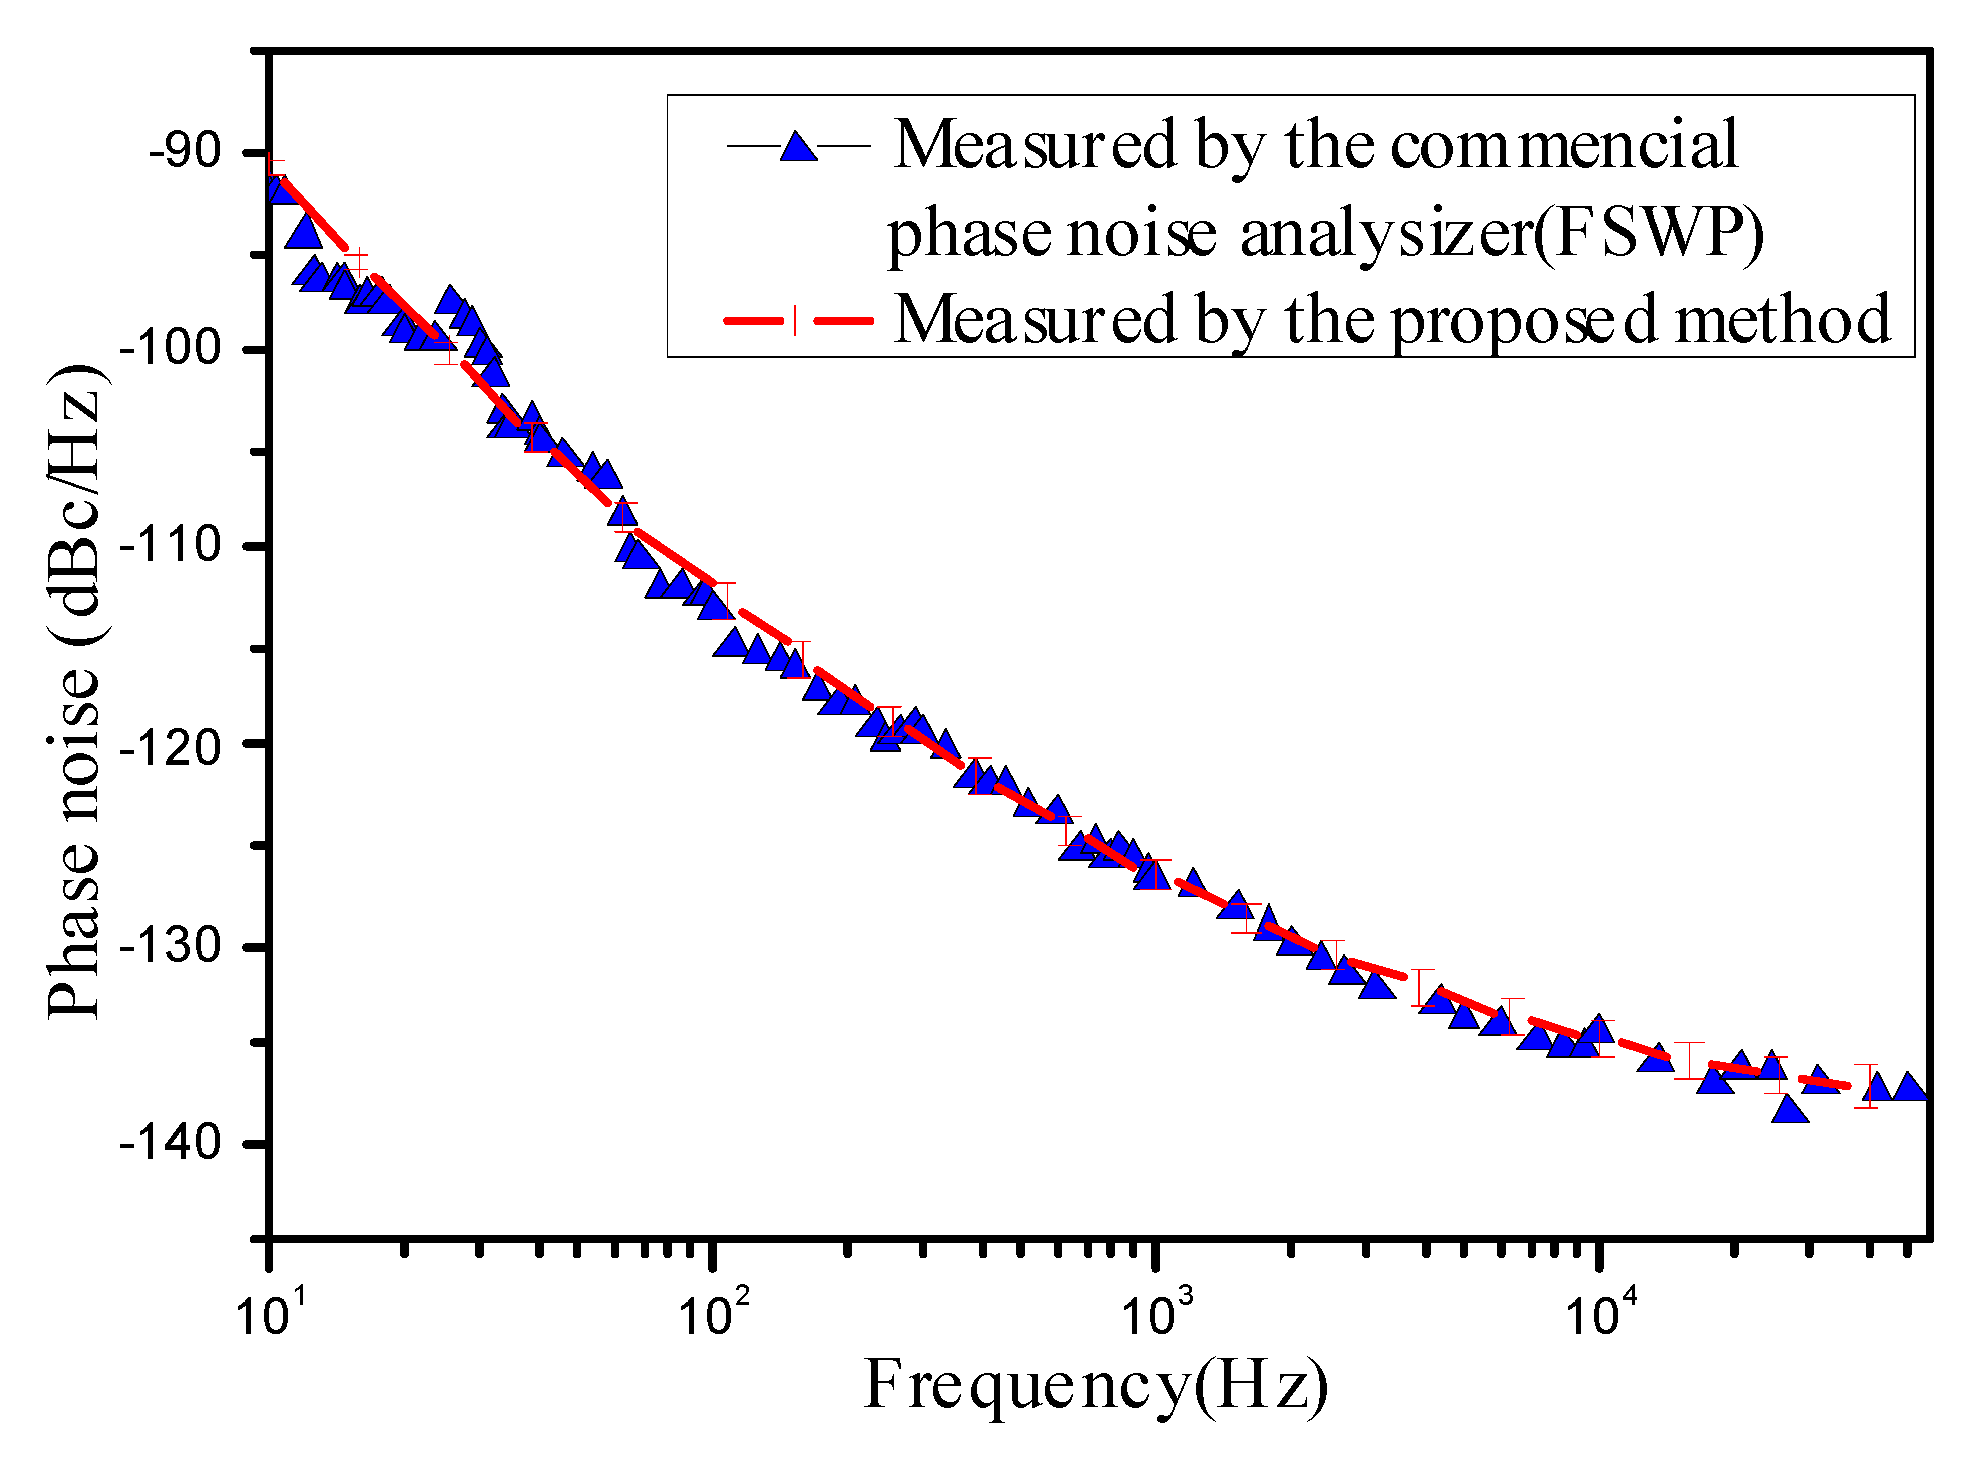
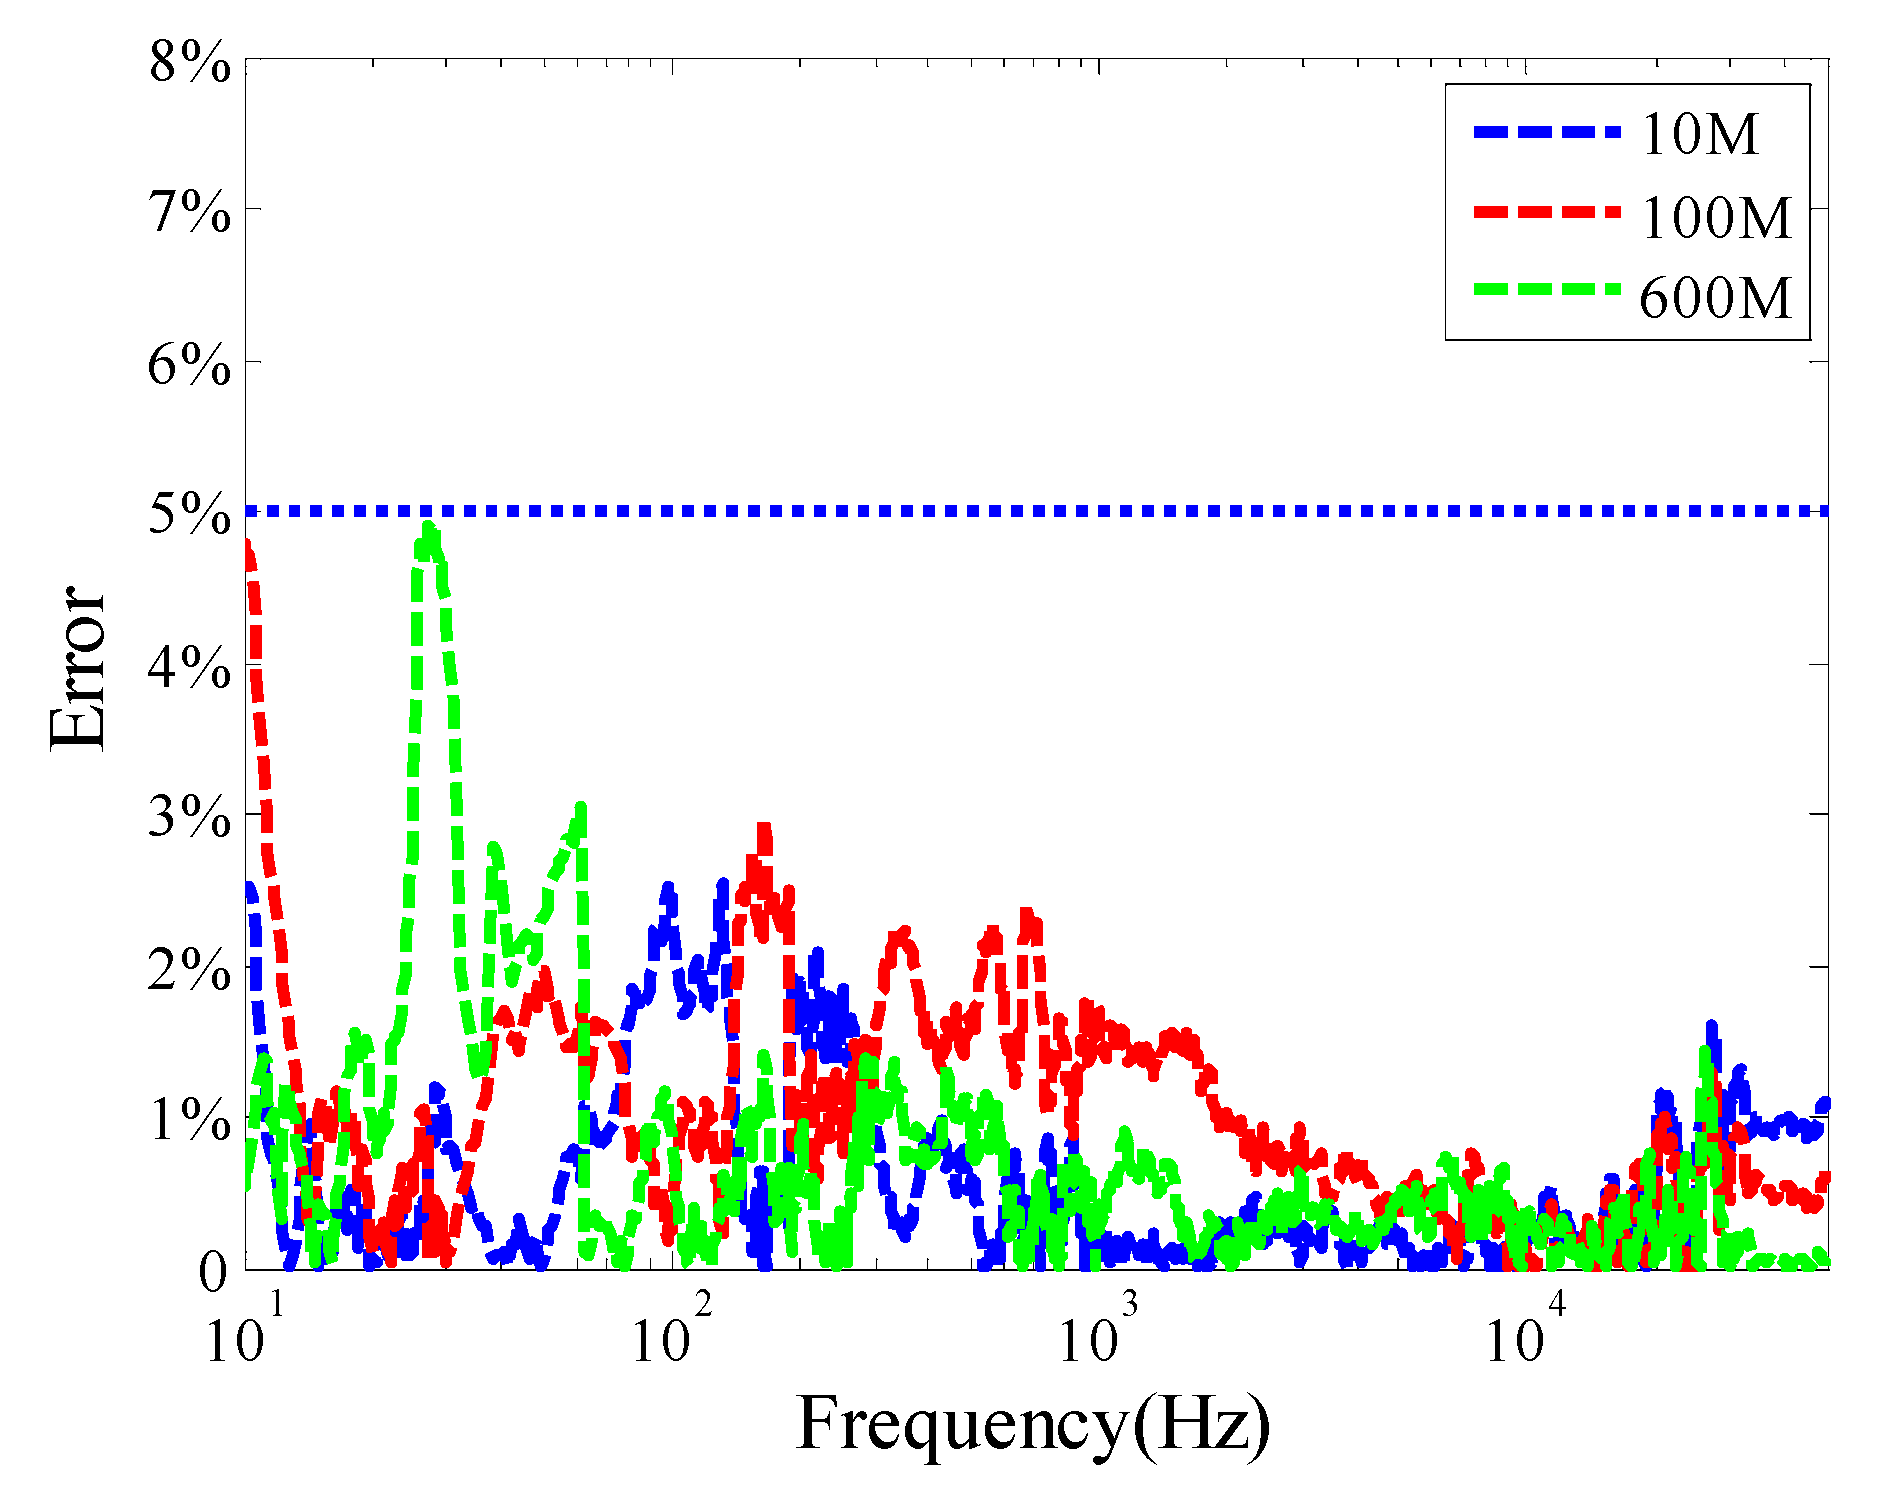
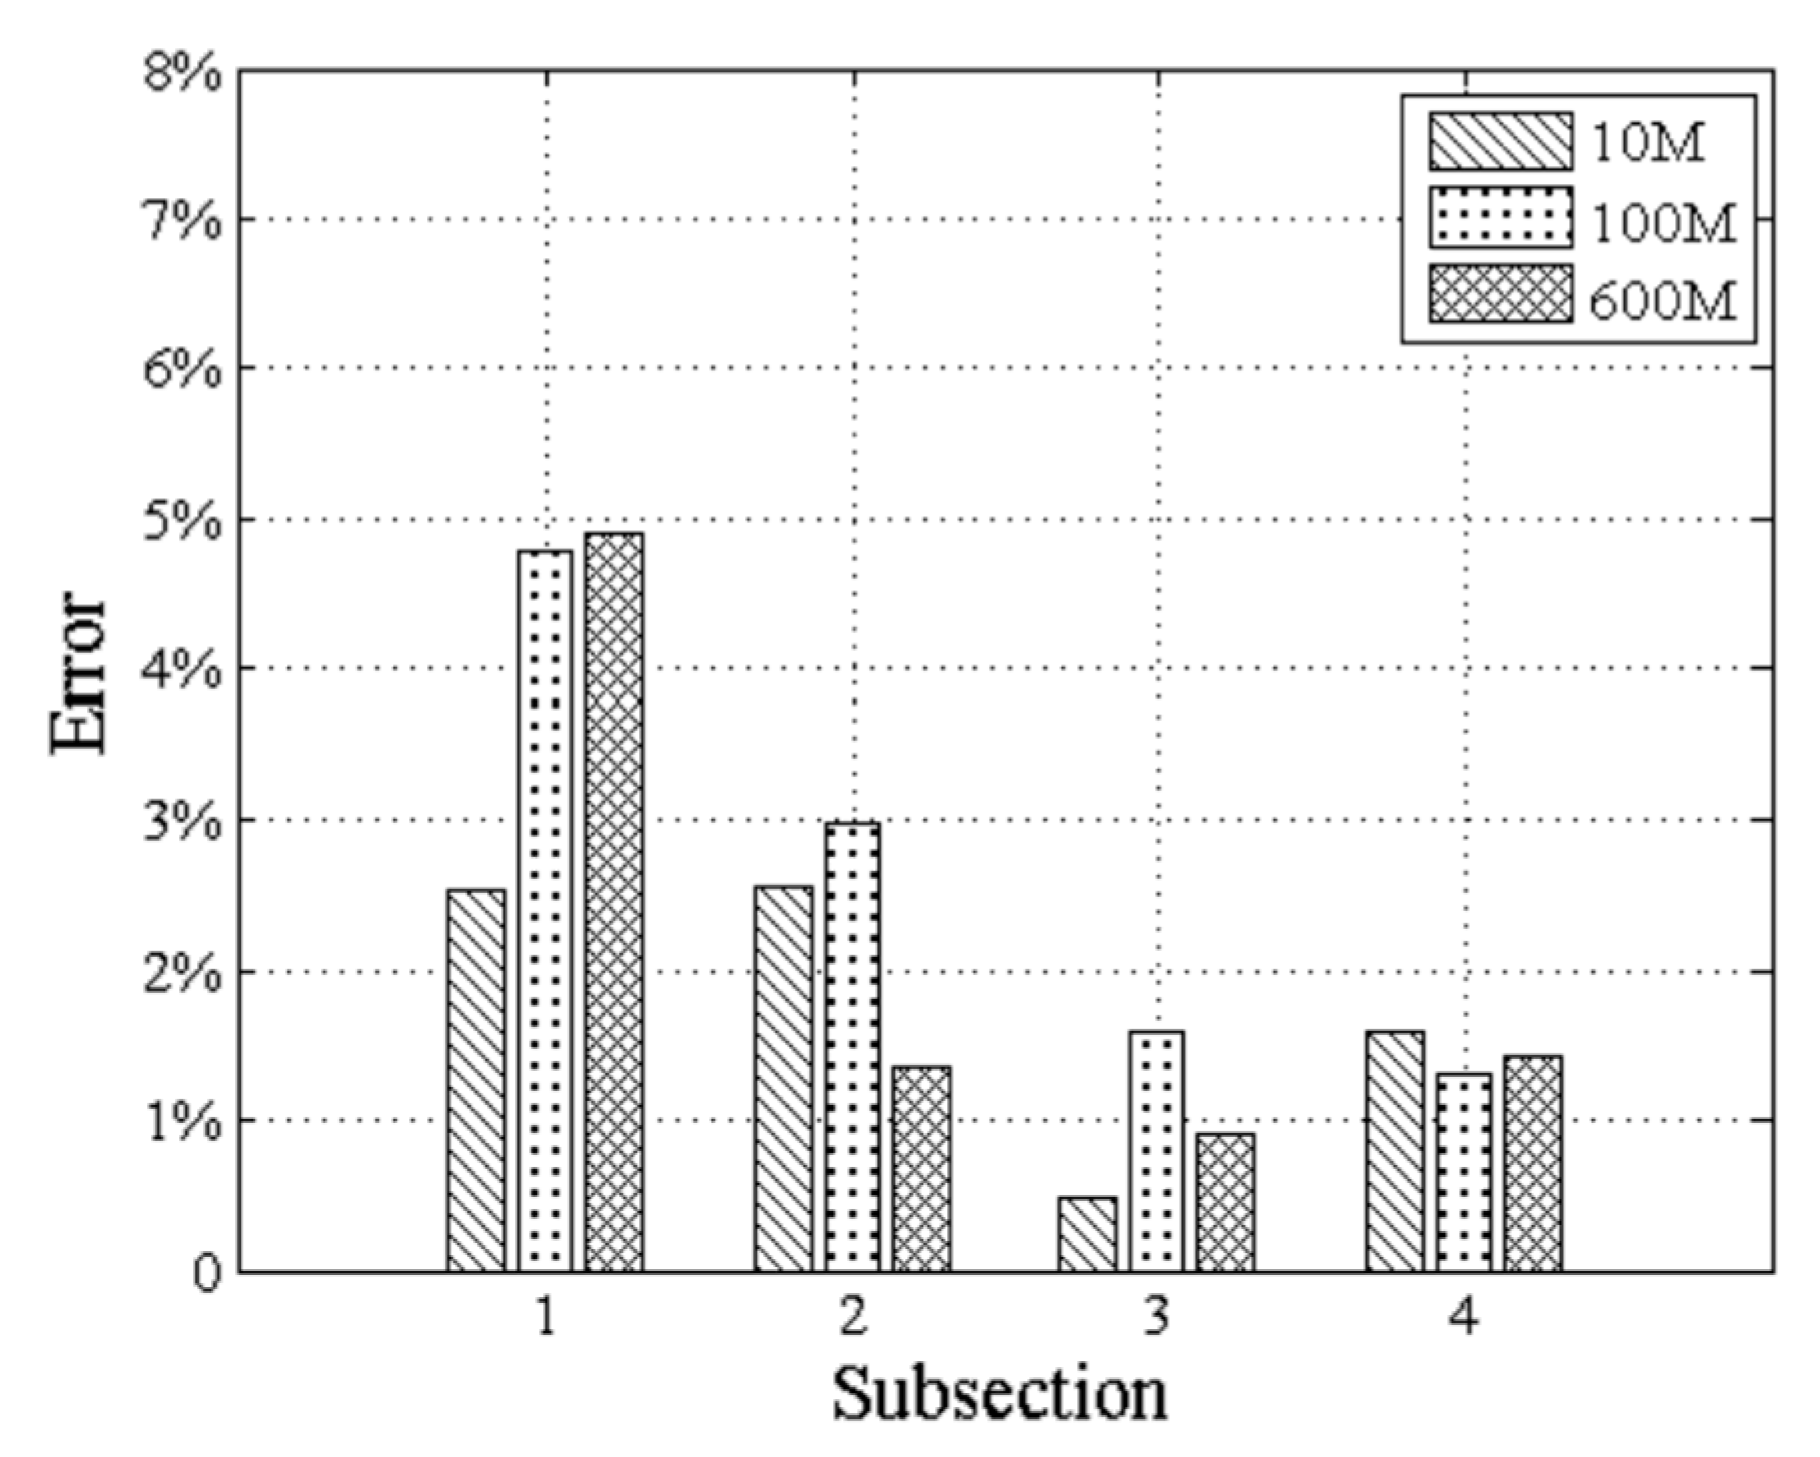
To validate the correctness of the proposed method, the phase noise of the same oscillator was measured at 10 MHz, 100 MHz, and 600 MHz, respectively, by a commercial high-performance phase noise analyzer (R&S® FSWP), again, the result of 600 MHz is given as an example shown in Figure 3. The PSD data were obtained multiple times, and the extracted phase noise was averaged. The results show that the phase noise retrieved from the calculation is in good agreement with the measured phase noise and satisfies the power law model. Additionally, Figure 4 plots the average error between the phase noise restored and measured with respect to different frequency offsets. The error is well below 5% for all frequency offsets. Also, the piecewise maximum error is shown in Figure 5, with the frequency offset range being divided into four subsections consecutively. It can be observed that at several different frequencies, the errors are larger in near-carrier range (< 100 Hz), because of the superposition of Gaussian and untruncated f-4 component. For the frequency offset above hundreds of hertz, the discrepancy reduces gradually and is smallest for 1–10 kHz range. The SUT PSD deduced phase noise curve shows excellent agreement with the commercial apparatus measured data. The error generally agrees well with the fitting results of the power spectrum. By referring to the reliable reference, this proposed method is proved to be stable and accurate.
To summarize the testing procedure with this scheme, we need a spectrum analyzer and a computer embedded with an optimization algorithm. The procedure is as follows: (i) testing the SUT with spectrum analyzer and obtain its PSD with the best resolution that can be achieved, (ii) PSD data was sent to the computer to implement data fitting with the composite power law model and extract coefficients, (iii) the phase noise is measured by calculating the power law expression with the obtained coefficients and plotting the curves.
Despite the compact and effective testing scheme, the measurement method proposed is based on sheer power law model. In fact, there is also Gaussian component of the phase noise which has been neglected in this scenario. For a real oscillator, the precision of this method would be limited for small frequency offset range. Furthermore, the performance of the measurement is closely related to the SUT noise feature, which should be known first, for a better signal source, which is less noisy and has a more regular shape. The error of the proposed method is small compared with straightforward measurement. However, if the signal source is under-performed, the physical model is incapable of interpreting the phase noise constituent, the calculated value by the proposed method will have a large deviation from the actual value.

4. Conclusions

In this work, we developed a novel phase noise measurement methodology based on a modified composite law model. It proved that the phase noise of an oscillator can be determined quantitatively by the direct computation proposed in this work, which significantly simplifies phase noise measurement. Regarding the disadvantages of some conventional direct measurement by complicated hardware-based apparatuses, this method only requires a spectrum analyzer and determines phase noise components with the mathematical fitting of the PSD data. Several assumptions were made to simplify the model and improve the optimization and parameter calculation process. Experiments showed that the SUT PSD deduced phase noise agreed well with that of measured by a commercial phase noise analyzer. In most applications, the use of phase noise analyzer may increase the complexity of the system. The proposed method uses the physical model of the SUT phase noise to evaluate its actual phase noise performance, relatively accurate phase noise can be obtained, avoiding the use of hardware-based phase noise detection adopted in phase/frequency demodulation and reducing the overall experimental cost. In addition, this method can be extended to determine phase noise of modulated signals such as pulse modulated signals which is usually hard to determine by a phase noise analyzer.
The accuracy and robustness of this methodology can be further improved by establishing a more precise model to characterize the near-carrier feature in the future. As mentioned before, the starting offset frequency of the power law region should be involved in the composite model and distinguished from near-carrier Gaussian component. The inherent Gaussian pattern of phase noise PSD should be considered and tested for more oscillators, which would facilitate a more compact and improved modality.

Author Contributions

Conceptualization, X.C., C.P., H.H., F.N. and B.Y.; methodology, X.C; formal analysis, X.C., F.N. and B.Y.; modeling, C.P. and H.H.; validation, X.C., C.P. and H.H.; data curation, C.P. and H.H.; writing—original draft preparation, X.C., C.P. and H.H.; writing—review and editing, X.C., C.P. and H.H.

Funding

This work was supported by the National Natural Science Foundation of China, Grant No. 61471282, 61727804, 61801358 and 61805187, and the Fundamental Research Funds for the Central Universities under Grants No. 8002/20101196703. The authors acknowledge an open fund (grant No. LSIT201812D) granted by Key Laboratory of Spectral Imaging Technology, Chinese Academy of Sciences.

Conflicts of Interest

The authors declare no conflicts of interest.

References

  1. Jurgo, M.; Navickas, R. Structure of All-Digital Frequency Synthesiser for IoT and IoV Applications. Electronics 2019, 8, 29. [Google Scholar] [CrossRef]
  2. Khanzadi, M.R.; Krishnan, R.; Kuylenstierna, D.; Eriksson, T. Oscillator phase noise and small-scale channel fading in higher frequency bands. In Proceedings of the 2014 IEEE Globecom Workshops (GC Wkshps), Austin, TX, USA, 8–12 December 2014; pp. 410–415. [Google Scholar] [CrossRef]
  3. Meng, Z.; Hu, Y.M.; Xiong, S.D.; Stewart, G.; Whitenett, G.; Culshaw, B. Phase noise characteristics of a diode-pumped Nd:YAG laser in an unbalanced fiber-optic interferometer. Appl. Opt. 2012, 44, 3425–3428. [Google Scholar] [CrossRef] [PubMed]
  4. Barton, D.K. Radar system analysis and modeling. IEEE Aerosp. Electron. Syst. Mag. 2005, 20, 23–25. [Google Scholar] [CrossRef]
  5. Chan, E.H.W. Suppression of phase-induced intensity noise in fibre optic delay line signal processors using an optical phase modulation technique. Opt. Express 2010, 18, 21573–21584. [Google Scholar] [CrossRef] [PubMed]
  6. Leeson, D.B. Oscillator phase noise: A 50-year review. IEEE Trans. Ultrason. Ferroelectr. Freq. Control 2016, 63, 1208–1225. [Google Scholar] [CrossRef] [PubMed]
  7. Chen, J.; Jonsson, F.; Zheng, L.R. A fast and accurate phase noise measurement of free running oscillators using a single spectrum analyzer. In Proceedings of the IEEE Norchip Conference, Tampere, Finland, 15–16 November 2010; pp. 1–4. [Google Scholar]
  8. Angrisani, L.; Baccigalupi, A.; D’Arco, M. A new method for phase noise measurement. In Proceedings of the IEEE Instrumentation & Measurement Technology Conference, Anchorage, AK, USA, 21–23 May 2002; pp. 663–668. [Google Scholar]
  9. Rohde, U.L.; Poddar, A.K.; Apte, A.M. Getting its measure. IEEE Microw. Mag. 2013, 14, 73–86. [Google Scholar] [CrossRef]
  10. Gheidi, H.; Banai, A. Phase-noise measurement of microwave oscillators using phase-shifterless delay-line discriminator. IEEE Trans. Microw. Theory Tech. 2010, 58, 468–477. [Google Scholar] [CrossRef]
  11. Chen, X.L.; Zhang, X.F.; Wang, J.L. A new algorithm for eliminating the frequency difference in phase noise measurement of the microwave signal. Prog. Electromagn. Res. M 2012, 23, 13–28. [Google Scholar] [CrossRef]
  12. Agrawal, D.K.; Bizzarri, F.; Brambilla, A.; Seshia, A. Numerical verification of an analytical model for phase noise in MEMS oscillators. IEEE Trans. Ultrason. Ferroelectr. Freq. Control 2016, 63, 1204–1207. [Google Scholar] [CrossRef] [PubMed]
  13. Demir, A.; Mehrotra, A.; Roychowdhury, J. Phase noise in oscillators: A unifying theory and numerical methods for characterization. IEEE Trans. Circuits Syst. I-Fundam. Theory Appl. 2000, 47, 655–674. [Google Scholar] [CrossRef]
  14. D’Arco, M.; De Vito, L. A novel method for phase noise measurement based on cyclic complementary autocorrelation. IEEE Trans. Instrum. Meas. 2016, 65, 2685–2692. [Google Scholar] [CrossRef]
  15. Kasdin, N.J. Discrete simulation of colored noise and stochastic processes and 1/fα power law noise generation. Proc. IEEE 1995, 83, 802–827. [Google Scholar] [CrossRef]
  16. Leeson, D.B. A simple model of feedback oscillator noise spectrum. Proc. IEEE 1966, 4682, 329–330. [Google Scholar] [CrossRef]
  17. Vernotte, F. Estimation of the power spectral density of phase: comparison of three methods. In Proceedings of the 1999 Joint Meeting of the European Frequency and Time Forum and the IEEE International Frequency Control Symposium, Besancon, France, 13–16 April 1999; pp. 1109–1112. [Google Scholar]
  18. Yousefi, S.; Eriksson, T.; Kuylenstierna, D. A novel model for simulation of RF oscillator phase noise. In Proceedings of the 2010 IEEE Radio and Wireless Symposium (RWS), New Orleans, LA, USA, 10–14 January 2010; pp. 428–431. [Google Scholar]
  19. Chorti, M.B. A spectral model for RF oscillators with power-law phase noise. IEEE Trans. Circuits Syst. 2006, 53, 1989–1999. [Google Scholar] [CrossRef]
  20. IEEE. IEEE Standard Definitions of Physical Quantities for Fundamental Frequency and Time Metrology—Random Instabilities; IEEE Standards 1139-1999; IEEE: Piscatway, NJ, USA, 2009. [Google Scholar]
  21. Klimovitch, G. A nonlinear theory of near-carrier phase noise in free running oscillators. In Proceedings of the 2000 Third IEEE International Caracas Conference on Devices, Circuits and Systems, Cancun, Mexico, 17 March 2000; pp. 1–6. [Google Scholar]
  22. Greenhall, C.A. An approach to power-law phase-noise models through generalized funcitons. IEEE Trans. Ultrason. Ferroelectr. Freq. Control 2015, 62, 116–128. [Google Scholar]
  23. Ashbby, N. Probability distributions and confidence intervals for simulated power law noise. Metrologia 2010, 47, 605–615. [Google Scholar] [CrossRef] [PubMed]
  24. Moré, J.J. The Levenberg-Marquardt algorithm: implementation and theory. In Numerical Analysis; Watson, G.A., Ed.; Springer: Berlin/Heidelberg, Germany, 1978; Volume 630, pp. 105–116. [Google Scholar]
  25. Marquardt, D.W. An Algorithm for Least-Squares Estimation of Nonlinear Parameters. J. Soc. Ind. Appl. Math. 1963, 11, 431–440. [Google Scholar] [CrossRef]
  26. R&S®SMW200A Vector Signal Generator. The Fine Art of Signal Generation. 2016. Available online: https://www.rohde-schwarz.com/ae/product/smw200a-productstartpage_63493-38656.html (accessed on 20 June 2019).
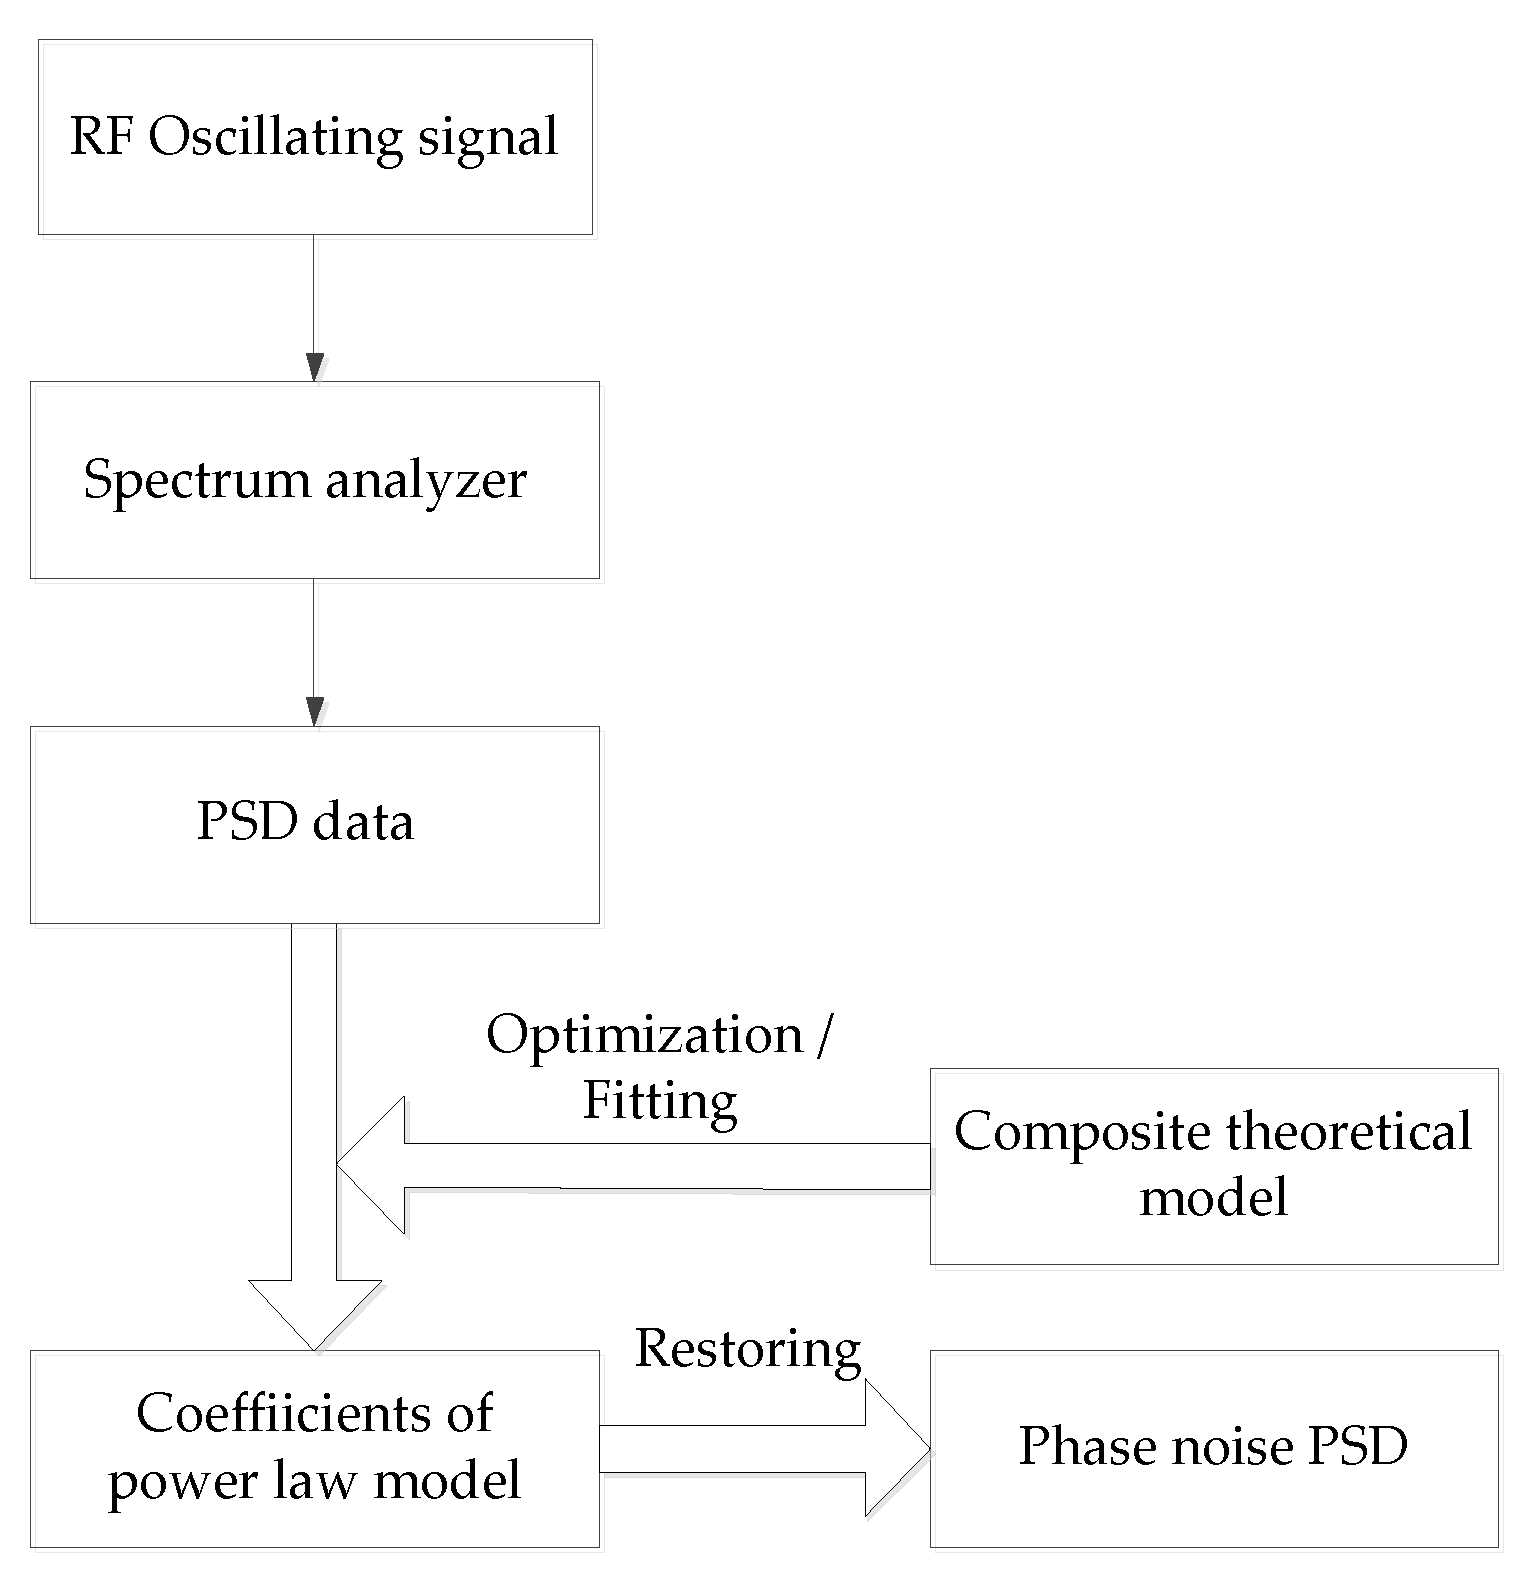
Figure 1. Schematic of phase noise measurement modality.
Electronics 08 00767 g001
Figure 2. The PSD data fitting by the composite theoretical model (f0 = 600 MHz, RMSE = 7.53).
Electronics 08 00767 g002
Figure 3. Comparison between fitting and model restoring (600 MHz).
Electronics 08 00767 g003
Figure 4. The error between the phase noise restored and measured.
Electronics 08 00767 g004
Figure 5. The piecewise representation of the maximum error, subsections 1 to 4 represent frequency offset range 10–100 Hz, 100 Hz–1 kHz, 1–10 kHz, and 10–100 kHz respectively.
Electronics 08 00767 g005
Table 1. The power law phase noise occurs in SV(f) and Sφ(f) [19].
Noise TypeαSφ(f)SV(f)Comments
White phase noise0 h 0 B 2 4 π 2 f 2 + B 2 h 0 B is the bandwidth of the testing instruments. SV(f) and Sφ(f) become constants only if
Bf
Flicker phase noise−1 ( 2 π ) 2 ν 1 h 1 | f 1 + ν 1 | h 1 | f 1 + ν 1 | 0 < ν1 ≪ 1
White FM noise−2 h 2 f 2 h 2 π 2 h 2 2 + f 2 SV(f) and Sφ(f) become identical if f > > π 2 h 2 2
Flicker FM phase noise−3 h 3 | f | 3 ν 3 1 q e π f 2 q 2 + h 3 | f | 3 ν 3 q is a function of ν3 as
(0 < ν3 ≪ 1):
q = ( 2 π ) 3 ν 3 2 π ν 3 / 4 Γ ( 1 2 ν 3 ) h 3 ( 2 ν 3 ) Γ ( 3 2 1 2 ν 3 )
Random walk FM phase noise−4 h 4 p 2 f 2 + f 4 p 2 π 2 h 4 e p f 2 2 π h 4 + h 4 f 4 H ( f f ¯ ) f ¯ is the starting offset frequency for f −4 noise, p is a constant and H(*) denotes the Heaviside step function.
Table 2. The controlled variables extracted by the best fitting of power spectral density (PSD).
Controlled VariableValue (10 MHz)Value (100 MHz)Value (600 MHz)
q0.2400.5000.500
ν39.00 × 10−42.00 × 10−42.0 × 10⁻⁴
p3.95 × 10−157.54 × 10−194.55 × 10⁻¹⁶
h01.69 × 10−141.55 × 10−141.28 × 10⁻¹⁴
h−11.36 × 10−101.51 × 10−101.58 × 10⁻¹⁰
h−21.36 × 10−82.33 × 10−83.79 × 10⁻⁸
h−34.91 × 10−74.31 × 10−73.22 × 10⁻⁷
h−48.81 × 10−101.81 × 10−138.13 × 10⁻¹¹