Abstract
Understanding human behavior can assist in the adoption of satisfactory health interventions and improved care. One of the main problems relies on the definition of human behaviors, as human activities depend on multiple variables and are of dynamic nature. Although smart homes have advanced in the latest years and contributed to unobtrusive human behavior tracking, artificial intelligence has not coped yet with the problem of variability and dynamism of these behaviors. Process mining is an emerging discipline capable of adapting to the nature of high-variate data and extract knowledge to define behavior patterns. In this study, we analyze data from 25 in-house residents acquired with indoor location sensors by means of process mining clustering techniques, which allows obtaining workflows of the human behavior inside the house. Data are clustered by adjusting two variables: the similarity index and the Euclidean distance between workflows. Thereafter, two main models are created: (1) a workflow view to analyze the characteristics of the discovered clusters and the information they reveal about human behavior and (2) a calendar view, in which common behaviors are rendered in the way of a calendar allowing to detect relevant patterns depending on the day of the week and the season of the year. Three representative patients who performed three different behaviors: stable, unstable, and complex behaviors according to the proposed approach are investigated. This approach provides human behavior details in the manner of a workflow model, discovering user paths, frequent transitions between rooms, and the time the user was in each room, in addition to showing the results into the calendar view increases readability and visual attraction of human behaviors, allowing to us detect patterns happening on special days.
1. Introduction
The advent of new communication networks and the Internet of Things (IoT) has fostered a new paradigm in which devices are embedded in the environment around us, providing researchers and analysts with large amounts of information [1]. Human actions are not usually detached from this environment, as multiple devices are sending data which reflects human behavior [2]. Initiatives as Obama’s 4P [3], which are personalized, predictive, preventive and participatory, are a pioneer in his words, a new model of patient-powered research that promises to accelerate biomedical discoveries and provide clinicians with new tools, knowledge, and therapies to select which treatments will work best for which patients.
The understanding of human behavior can support in the selection of adequate treatments according to the characteristics of the patient [4] or even detect illnesses in early stages where behavioral changes are apparent symptoms of disease inception like erratic movements in dementia [5] and treatment adherence [6]. However, the creation of human behavior models is not trivial. On the one hand, human behavior is determined by biological, psychological, and sociocultural factors that depend on multiple variables that make complex the creation of general behavior models [7]. On the other hand, human behavior evolves in time in a not homogeneous way [8]. This situation imposes that the model can change after its definition, making it not valid for further assessments and follow-up. This problem, elsewhere known as the concept drift, led authors to propose a continuous update of the model [9], which need tools to infer individual behavioral models automatically.
The acceptance of new mobile personal technologies and wearable sensors have increased the quantity of data related to human behaviors [10,11]. According to CISCO Visual Networking Index Prediction [12], the number of connected things on the Internet will rise to 26.3 billion by 2020 [13], which stands as an excellent opportunity towards a new generation of new applications and services at a population level [14,15]. A large amount of data available provides a new challenge for creating new models capable of extracting information, insights, visualizations, and to support in daily decisions for improving accuracy in the diagnostics [16]. In this way, new algorithms and methods have appeared to analyze the behavior through vision [17] and human activity [18,19,20,21].
Pattern recognition and machine learning techniques allow developing models to represent human behaviors [22]. Although these techniques can create complex mathematical models that discover and classify the behavior of the user, these models are usually not humanly understandable [23,24]. Understandability of individualized models allows experts to analyze human behavior better and detect undesired behaviors [25]. Process mining is a machine learning discipline that infers models from event logs and provides understandable human models by providing significant human behavior details, usually in the form of workflows [26]. Workflows are a simple representation of processes which can support human behavior analysis not only for detecting the behavioral changes but also offering an understandable view of patterns and insights of a person [27,28].
Several improvements have been achieved in human behavior recognition in the literature. The behavior recognition domain commonly contains various topics such as behavior modeling, activity monitoring, data processing, and pattern recognition [29]. Process mining is an emerging method in this area which provides extensive models and information about the executed processes applying data from various sources. In several studies, process mining has been used to discover human activities by considering human paths like a business process. Maarif [30] used process mining to present human daily activity patterns in a graphical representation. Nakatumba and van der Aalst [31] investigated the impact of workload on service times by considering the relationship between workload and services time. In a recent paper, process mining is applied to a data set of locations in a shopping mall to discover customer paths and classify genders [20]. Besides, it is applied to analyze the movements of people in operating rooms in 25-week data belonging to nine people collected with RFID technology [23]. Maruster et al. [32] established a user behavior model for farmers’ behavioral patterns by linking insights with decision-making methods using process mining. Previous articles studied human activity recognition [33] and visualization [20,30,34], however, none of them developed an understandable presentation at the individual level. Table 1 summarizes advantages and limitations of the mentioned studies.

Table 1.
A summary of the advantages and limitations of the previous studies.
In this study, process mining techniques are applied to discover and classify human behavior patterns. The proposed approach is based on the grammatical inference pattern recognition framework [35] and interprets workflows as timed parallel automatons, as tested by Fernandez-Llatas et al. [36]. Timed parallel automatons is a formal framework for identifying highly powerful workflows which have a regular grammatical complexity [37]. The objective is to discover the extent of methods that can detect and describe a wide variety of human behaviors. To this end, data from an in-house real-time location sensor system are used, and new data visualization interfaces are created.
The rest of the paper is structured as follows. The materials and methods are described in Section 2, including the electronic set up of the indoor location system, process mining techniques, and the calendar views. Section 3 presents the results of the applied methods for the selected three patients to show stable, complex, and unstable behaviors. Section 4 includes the discussion of the results and their limitations. Section 5 states the final remark of our contribution.
2. Materials and Methods
The proposed solution includes three main components: (1) Indoor Location Systems to track human activity in a house by means of sensors; (2) process mining tools and techniques, to discover and classify human behaviors, and (3) the calendar views, to display the human behavior patterns in the format of a schedule to identify patterns. Figure 1 depicts the developed methodology for this study, and the following subsections describe in detail the entire process.
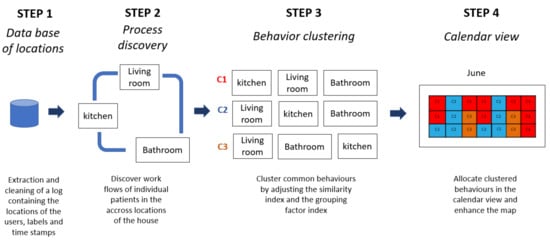
Figure 1.
Flowchart of the proposed methodology for the creation of the calendar views based on individual clustered behaviors from indoor location system sensors.
2.1. Indoor Location Systems
Indoor Location Systems (ILS) are defined as the technological infrastructures (hardware and software) that allow tracking assets and persons across indoor settings. The setup and type of technology used to track elements depend on the type of applications, elements to track and deployment characteristics. There is a wide range of technologies such as RFID [38], Bluetooth [39] and ZigBee [40] among others. Such systems have been previously used to support the activity recognition of humans in smart homes [41], AAL solutions [42] and the design of activities primitives [43]
In this study, an ILS based on Passive Infrared (PIR) sensors, which is an electronic sensor that measures the infrared light radiated from objects in the field of vision and are spread used for motion detectors is used [44]. Figure 2 presents an example of PIR systems. Each PIR sensor needs power supply at 5 V and 65 mA and provides a digital output (0–3.3 V). The sensor is equipped with a Fresnel lens that enhances the sensing range to 120 degrees and 7 m under normal temperature conditions. The sensor sensitivity and the output pulse width can be adjusted through two potentiometers. These sensors are cheap, reliable, unobtrusive, and easy to install. Sensors are installed and tagged in every room of the elderly individual housing so that the location provided by the sensor corresponds to a single room and a single user. Houses with more than two users were not included in the study.
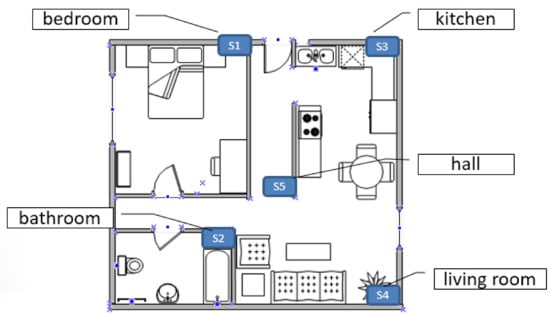
Figure 2.
Example of the Indoor Location System set up based on Passive Infrared sensors.
PIR sensors are connected to a central server which stores positive events (motion detection) into a database concerning the current timestamp and the id of the room.
2.2. Process Mining and Clustering
Process mining techniques are used to provide comprehensive models and information about human behaviors using data from the system. The data extracted from these devices are used to build an event log which contains the relevant information (activities completed, timestamps, case IDs and the resources that performed those activities), to be used in the available tools such as ProM [45], PALIA Suite [46] and DISCO [47]. These tools provide an output of different models that allow the detailed visualizations of the processes.
A discovery algorithm in process mining is applied to identify trajectories, and the process followed in the indoor scenario [27]. The PALIA Suite has an implementation of quality threshold clustering technique [46]. It enables to group human behaviors by a predefined similarity ratio using a workflow distance based on the error correcting method [48]. The reason to choose the quality threshold algorithm is two-fold. In many clustering techniques, the algorithm requires the number of clusters as an input [49]. However, it is difficult to determine in human behavior modeling. The quality threshold clustering is selected because it does not need a predefined cluster number. Additionally, it considers both the sequence of the nodes and spent time in the nodes.
2.3. Calendar Views
The calendar views are developed to visualize data collected by sensors using process mining. PALIA Suite, a process mining tool specifically designed to work with indoor location systems data in the health care domain, is used to create calendar views [28]. The main features of the PALIA Suite are the discovery of the process model, conformance analysis of the process, and the enhancement of the view of the whole process through the use of process mining algorithms over localization events. Additionally to this, our purpose is to generate several calendar views to visualize the evolution and heterogeneity of patient behaviors in a human understandable way.
The generation of two different views is proposed: (1) A workflow model view of human behaviors is generated using sensor data (Process discovery and process clustering in Figure 1), obtained from the setup described in Section 2.1. The workflow model describes the movements of a patient between the different locations in the house (e.g., from the kitchen to the bedroom) and identifies where it usually behaves. (2) A calendar view based on the different workflows obtained for different patient behaviors. Each day of the calendar view is classified with a specific color according to the workflow model behavior of that specific patient (Calendar views in Figure 1).
3. Results
3.1. Patient Data Information
A total of 25 participants who signed the informed consent were tracked using the ILS during a period varying from 68 days to 332 days. Table 2 provides the average distance walked by the user inside the house and the total registered number of days. Data from sensors were collected in the format of an event log, in which the system sampled the location of the user by means of motion detection, assigning to each event a universal timestamp, the house identification (ID in Table 2) and room label.
Table 2.
Patient data information.
Figure 3 presents the number of clusters (y-axis) depending on the grouping factor index (x-axis). Since the number of clusters is a priory unknown, a quality threshold clustering method is applied to group patient trajectories into a data-driven number of clusters, but this technique needed a predefined quality threshold. Therefore, different thresholds were tested to assign behavior patterns into the same cluster. For example, for a group factor of 0.05, the technique groups behaviors in the same cluster if they are similar at a ratio of least 5%. As soon as the group factor increases, the number of clusters normally decreases, and the average duration of behavior normally increases. As a counterpart, if this relation is inverted, it means there are some unusual behaviors which are indicators of complexity in individual behaviors. At the same time, a higher number of clusters with the same grouping factor indicates a user featuring a complex behavior.
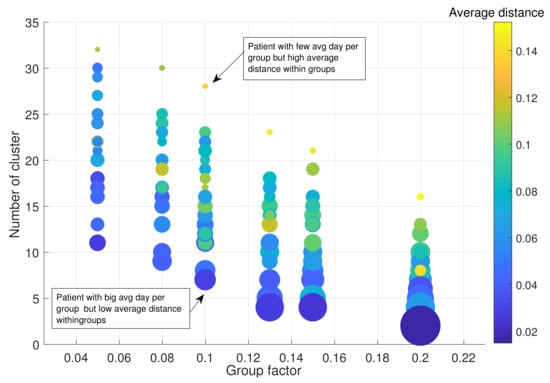
Figure 3.
Clustering of all patients.
On the one hand, if the clustering results in three numbers of clusters, it is an indication of low complexity behavior. On the other hand, showing all behavior models within 30 clusters means higher complexity because they include many different behaviors and cannot be grouped into a lower number of clusters. The average days also give a clue about complex behaviors. If the workflows of a patient have a higher number of clusters with lower average days, it reveals a complex behavior.
Beyond the number of determined clusters, it is also critical to understand the number of elements included and excluded (outliers) in the clusters. In Figure 3, the size of the point indicates the average number of items per cluster for each grouping factor index. It can be observed that the clusters computed with a group factor below 8% have fewer items than the clusters with a group factor over 20%. Moreover, the filling color shows the number of elements not included in any cluster (outliers). It provides meaningful information. For instance, the number of outliers decreases with the increase of the group factor.
These results show that grouping factors below 16% and above 20% are not well fitted for inferring patient trajectories. The first reason is that many outliers are encountered when the group factor is below 16%. The second reason is that there are a few outliers, but clusters contain complex workflows that are hard to understand when the group factor is above 20%. As a compromise solution, the study focused on selecting a group factor of 20% and three patients who featured three paradigmatic behaviors (Patient 18, Patient 10 and Patient 20) to show exciting and meaningful results of the proposed methodology. Figure 4 indicates details of clustering results for the selected patients.
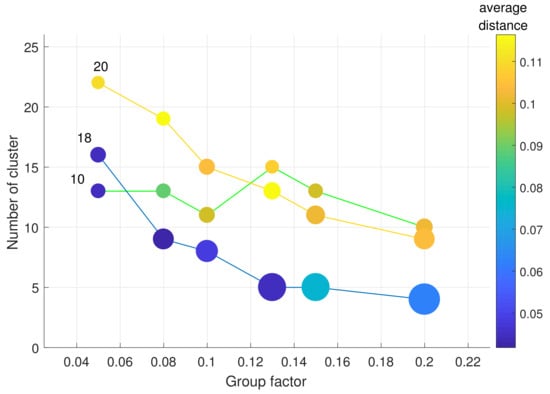
Figure 4.
Clustering of three representative patients.
It is an expected result that the number of clusters decreases when the group factor index increases. Besides, the average day should be increased in each cluster. For example, suppose a patient has a 30 day trajectory. If it is divided into three clusters, the average day can be ten days. If it is divided into ten clusters; the average day can be three days. Hence, if the number of clusters decreases, the average day in each cluster increases. The selected patients show the expected results. While the number of clusters does not increase for Patient 18 and Patient 20, when the group factor is 0.13, it rises from 11 to 15 for Patient 10. It is an indicator of complicated behavior that we will discuss later.
Moreover, as long as the number of clusters decreases, the distances between clusters increases because the clusters should be more separable. For Patient 18 and Patient 10, the mean distances between clusters increase, while it is irregular for Patient 20.
Data were analyzed for each of these three patients, and workflow view models were compared with each other according to its similarity. The comparisons provide several clusters that represent the days with similar behavior during the year (as per the calendar views).
3.2. Patient Individual Behavior Models
In the workflow views created by process mining, nodes and arrows are colored from green to red. The red nodes refer to the store group that had a higher visit duration. Figure 5, Figure 6 and Figure 7 include a legend for explaining meaning of the colors. The red arrows present the most executed transitions between two nodes (rooms in the house).
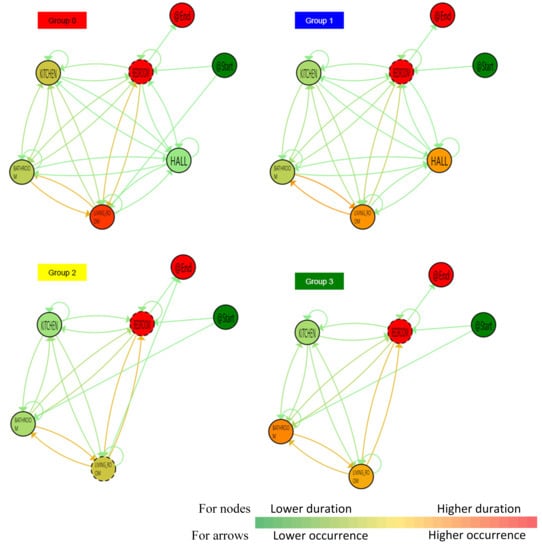
Figure 5.
Workflow view for Patient 18.
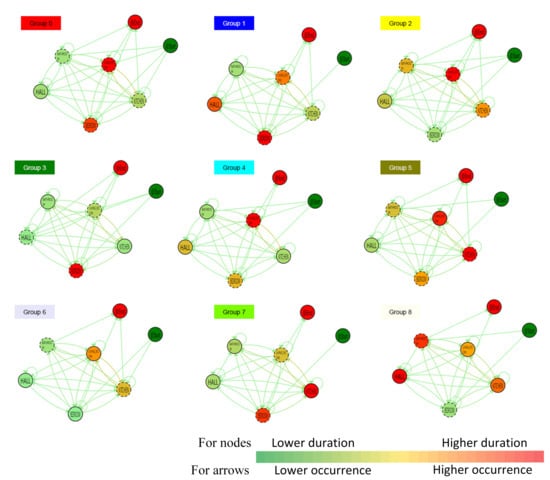
Figure 6.
Workflow view for patient 10.
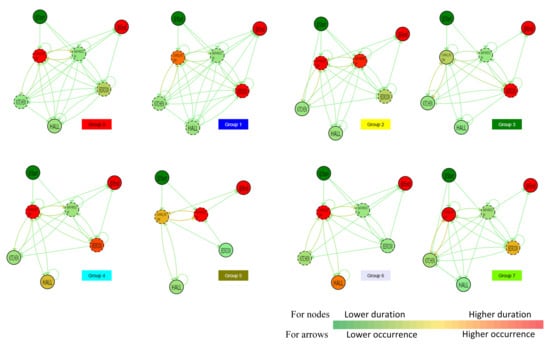
Figure 7.
Workflow view for patient 20.
3.2.1. Patient 18
The patient paths are clustered into 5 (4 + 1 outlier) groups at 20% group factor. Patient 18 is determined as a stable person because the average distances between clusters are lower and similar for each group factor. If the distance is smaller, this means the similarity is high. Furthermore, the patient’s behaviors are nearly similar for weekdays and weekends. Patient 18 has stable behaviors because colors are more stable in the calendar view. Figure 5 shows the patient’s flows. Almost in all paths, the transaction between the bedroom and living room is higher than others. Also, the time spent in the bedroom is normally higher than others due to the duration of sleep.
In Group 0, displayed by a red color, the patient stays more in the bedroom and living room. In Group 1, represented by blue color, time in the living room decreases, and the patient goes for a walk because the Hall shows that the last view of the patient is the entry door. In Group 2, shown by yellow color, and in Group 3, presented by green color, the patient does not go out of the house and stays more at home.
Figure 8 shows individual behavioral groups representing the groups of the workflow view of Figure 5. Patient 18, during weekdays, has similar behaviors because all are in the same cluster, Group 0. On the other hand, the patient has different behaviors at weekends. For example, yellow (Group 2) and green (Group 3) colors indicate the patient stayed more at home. In summary, Patient 18 has two regular behaviors in weekdays and weekends.
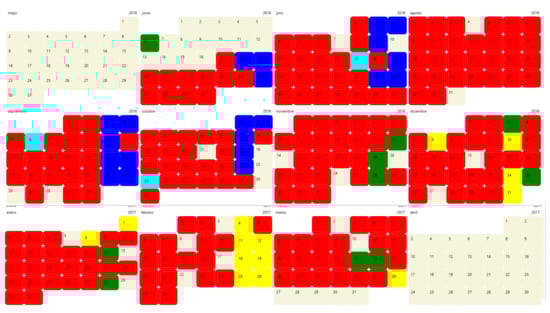
Figure 8.
Calendar view for Patient 18.
3.2.2. Patient 10
The patient paths are clustered into 10 (9+1 outlier) groups at 20% group factor and the average is 20.5 days for each group. The average distances between clusters have fluctuated. At the same time, the patient’s behaviors are too different in each day. Thus, Patient 10 has complex behaviors. Figure 6 shows the discovered patient paths. Each flow presents a different behavior type representing a different kind of days.
First of all, the number of clustered groups shows the complexity of the patient’s behavior. While Patient 18 has a stable behavior supported by the number of four clustered groups, Patient 10 has a complicated behavior that can be seen from nine clustered groups. The patient starts with only one room in some groups such as Group 1, Group 6, and Group 7, with more than one room in other groups. One typical behavior for Patient 10 is the transactions between the Kitchen and Living room is relatively higher than others; almost all groups. On the other hand, the spent time changes a lot for the same rooms. For example, the Hall is one of the rooms, which has the highest duration in Group 1 and Group 8. However, the patient did not spend much time in the Hall in other groups. In a general manner, the Living room is the most preferred room to spend time, and the Bathroom is the least used room for Patient 10. When the Living room is red, the Bedroom is green or yellow (except Group 1) and vice versa. Because of this, it can be concluded that the patient probably slept on the sofa, and it increased the spent time in the Living room.
Figure 9 shows the calendar view representing the groups of the workflow view of Figure 6 for a group factor of 0.2. The border colors represent the group discovered by clustering and shown in the workflow view. There are much more differences among groups because colors are less stable. There is a month (July) that the behavior is very different. Although the behaviors presented by Group 0 (red color) are dominant in July, the behaviors presented by Group 4 (turquoise border), Group 2 (yellow border), Group 1 (blue color), Group 3 (green border) and can also be seen.
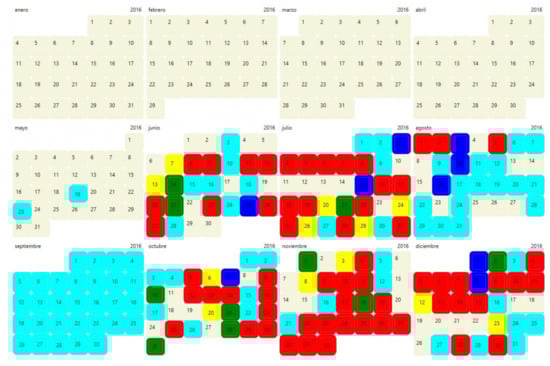
Figure 9.
Calendar view for patient 10.
3.2.3. Patient 20
Eight (7 + 1 outlier) groups are created at 20% group factor, and the average day is found at 31.5 days by each group. The patient’s behaviors change day by day. Moreover, the average distances between groups are higher than distances of the other patients’ groups. Therefore, Patient 20 has more complex and unstable behaviors. Figure 7 presents the patient’s flows. Each flow shows a different behavior type representing a different kind of day. Similar to other patients, the Living room is a room that spent more time in almost all groups. Nevertheless, the transactions from the Living room vary for different groups. For instance, in the most dominant group, Group 0, the patient passed the Bathroom from the Living room and vice versa. In Group 1, the second dominant group, the transactions between the Living room and Kitchen, are highest. Interestingly, Patient 20 was not seen in the Kitchen in Group 5. It is possible that the patient left the house earlier and had breakfast out of the house. The patient had a long shower and watched TV in the Living room after coming home.
Figure 10 shows the calendar view for representing the workflow view. There are much more differences among groups because colors are less stable. Red colors (Group 0) are the most dominant behaviors. It is interesting that the number of blue colors (Group 1) is increased in the summer and December, and there is no blue color in January. The behavior presented by Group 5 is mainly encountered in January.
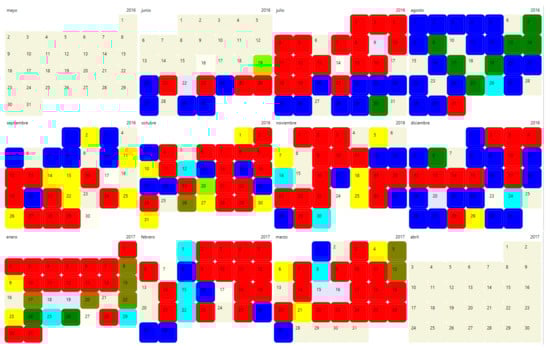
Figure 10.
Calendar view for Patient 20.
4. Discussion
In this paper, a novel methodology has presented and evaluated for extracting and understanding human behaviors based on ILS and advanced techniques from process mining. A total of 25 patients were analyzed, with daily data varying from 68 days to 332 days. The selected patients, Patient 18, Patient 10 and Patient 20, have 285, 205, 283 daily data, respectively. Firstly, the quality threshold clustering method is applied to increase the readability of the process mining results. Different threshold values are tried to decide the best group factor. The number of clusters, the average distances between groups, and the number of elements included in the groups are considered to determine the group factor. The method of choosing a better group factor is explained in Figure 3. Then, three representative patients are selected to demonstrate stable, complex, and unstable behaviors.
Two view models are created for each patient behavior. A discovery algorithm in process mining creates the workflow view model. The clustered groups are depicted by workflows to facilitate to make comparisons. The calendar view is created to realize real behavioral changes on a daily basis.
Patient 18 has a stable behavior because the average distances between clusters are lower. Moreover, the patient’s behaviors are nearly similar for weekdays and weekends. The patient generally stays more in the Bedroom and Living room. Patient 18 has two main behaviors in weekdays and weekends. On weekdays, the patient spent almost all the time in the Living room and Bedroom. On the other hand, the patient generally either goes out or stays at home on weekends. For example, Patient 18 went out all weekends in February.
Patient 10 has complex behaviors. The average distances between clusters have fluctuated. Furthermore, the patient’s behaviors are too different in each day. In the workflow view, transactions between the Kitchen and Living room are typical behavior for Patient 10. However, the duration in the rooms varies a lot. In calendar view, behavior in August is very different. The patient has eight different behaviors shown by different colors in 22 days in August.
Patient 20 has more unstable and complex behaviors. The patient’s behaviors change day by day. Besides, the average distances between groups are higher than distances of the other patients’ groups. In the workflow view, it is interesting that Patient 20 was not been seen in the Kitchen in Group 5. It is probably that the patient left the house earlier and had breakfast out of their home. The patient had a long shower and watched TV in the Living room after coming home. In the calendar view, the patient has similar behaviors in summer and December. Also, this behavior was never seen in January.
The significant advantage of the proposed methodology is to present readable and understandable results by not only experts but also non-experts. Many previous studies focused on human activity recognition, especially patient behaviors. For example, Kim et al. [33] developed a hidden Markov chain to model simple human activities such as eating, sitting, standing, and turning left–right. The results are hard to interpret for a non-expert on Markov models. On the other hand, some researchers benefited from process mining to visualize human activities. Maarif [30] built a visual model for human activity patterns on a daily basis in a smart home environment by using Heuristic miner and Fuzzy Miner in ProM. These algorithms mainly ignore infrequent event logs. However, infrequent event logs can have critical behaviors regarding the daily movements of patients [20,23]. Our methodology overcomes ignoring infrequent behaviors by the PALIA algorithm.
Although previous studies generated some graphical insight with process mining, such models are still complex and hard to understand. Process mining visualization is improved by means of a quality threshold clustering to create calendar views. Quality threshold clustering allows discovering several clustering patterns depending on two factors (similarity and distance), a valuable feature when the number of clusters is unknown. Since the number of clusters is unknown for human activities, the suitability is demonstrated in this study. Quality threshold clustering in process mining considers the similarity of the followed paths and spent time in the locations for creating groups. It also ensures that the similarity in a cluster is at least in a predefined quality level, which is used in the study group factor and increases the reliability of the results. Further work will probably consider other clustering techniques which take into account other important factors. For instance, the Levenshtein distance can measure the difference between two sequences ( i.e., the order in which the patient went from one room to another) or other techniques as the Principal Component Analysis to reduce the dimensionality of data and detect possibly correlated variables.
Table 3 describes the advantages and limitations of the proposed solution with respect to state of the art.
Table 3.
Advantages and limitations of the proposed solution.
Developing IoT technology surrounds us with smart devices that can collect a vast amount of data [50,51]. In many cases, the topic of analyzing human actions and behaviors is one of the significant areas in which the collected data can be used. Understanding of daily patient behavior is helpful to strengthening the adherence to the treatments [52]. Since the interest has increased in the control of patient behaviors to manage their illness, wearable smart devices were established into the houses of the 25 patients. The collected data by sensors are analyzed to understand the patients’ behaviors. Many factors affecting human behaviors make it complicated to create general behavior models. Because of these drawbacks, process mining techniques are chosen to discover individual behavior models. Understandable human behavior models by providing significant human behavior details are created in the workflows form. In addition to the understandable human view, real behavioral changes over time are detected. Sensors that are seamlessly integrated into IoT devices enable fast, reliable, and smoother operation of the process with automatic monitoring and configuration features. The connection of devices is managed as a part of distributed systems to enable the accessibility of all related information in real-time processing [53]
The study has the following limitations: (1) Even though different behaviors can be observed when applying different clustering thresholds, the proposed methodology needs to be tested using subjects that have a formal diagnosis of mental health or syndrome to validate our approach. (2) The data log may need quality assessment preprocessing to remove errors introduced by the ILS and unexpected events. (3) The data used in this study is limited to 25 residents. Including more massive datasets may be an essential factor for process mining-based human behavior discovery and classification. These limitations should be taken into account, scalability of such systems and generalization of the conclusions, and thus, the development of algorithms to correct ILS data is proposed to work in the future and to use other tracking technologies.
5. Conclusions
The study fills the literature gaps in two aspects. First, is to apply a clustering analysis to find similar behaviors, called the workflow view. A quality threshold clustering is chosen because the number of clusters is an unknown a priory. Moreover, each clustered behavior has a similarity ratio, defined in our experiments as the group factor. Different group factors are tested to find better clusters showing differences between patient behaviors. Second, is to improve the understandability of the result by a calendar, called the calendar view. The discovered and clustered workflow views are adopted into the calendar to present the behavioral changes in each day. The study proposes a novel solution moving away from the traditional predictive algorithms by using process mining and quality threshold clustering analysis to discover similar behavior from their indoor paths via the workflow model. Moreover, using calendar view improves the visual understanding of human behaviors and activity patterns.
Author Contributions
This work is a collaborative development of all authors. O.D. and A.M.-M. are the main researcher of the study and led the writing of the paper. A.M.-M. has adapted the PALIA Suite to the problem, and performed the experiments and filtered the samples. V.T. and C.F.-L. are the supervisions of the research. E.R., M.S. and J.M.-G. have studied data curation. All authors have read, revised and approved the final manuscript.
Funding
This research was funded by ITACA SABIEN and partially supported by CONICYT REDI 170136.
Conflicts of Interest
The authors declare no conflict of interest. The founding sponsors had no role in the design of the study; in the collection, analyses, or interpretation of data; in the writing of the manuscript; nor in the decision to publish the results.
References
- Gubbi, J.; Buyya, R.; Marusic, S.; Palaniswami, M. Internet of Things (IoT): A vision, architectural elements, and future directions. Future Gener. Comput. Syst. 2013, 29, 1645–1660. [Google Scholar] [CrossRef]
- Guo, B.; Zhang, D.; Wang, Z.; Yu, Z.; Zhou, X. Opportunistic IoT: Exploring the harmonious interaction between human and the internet of things. J. Netw. Comput. Appl. 2013, 36, 1531–1539. [Google Scholar] [CrossRef]
- Riley, W.T.; Nilsen, W.J.; Manolio, T.A.; Masys, D.R.; Lauer, M. News from the NIH: Potential contributions of the behavioral and social sciences to the precision medicine initiative. Transl. Behav. Med. 2015, 5, 243–246. [Google Scholar] [CrossRef] [PubMed][Green Version]
- Bayles, K.A.; Kim, E.S.; Azuma, T.; Chapman, S.B.; Cleary, S.; Hopper, T.; Mahendra, N.; McKnight, P.; Rackley, A.; Tomoeda, C.; et al. Developing evidenced-based practice guidelines for speech-language pathologists serving individuals with Alzheimer’s dementia. J. Med. Speech Lang. Pathol. 2005, 13, xiii–xxv. [Google Scholar]
- Santacruz, K.S.; Swagerty, D. Early diagnosis of dementia. Am. Fam. Physician 2001, 63, 703–713. [Google Scholar]
- Ajzen, I. Attitudes, Personality, and Behavior; McGraw-Hill Education: Berkshire, UK, 2005. [Google Scholar]
- Sanchez-Calzon, A.B.; Meneu, T.; Traver, V. Semantic Technologies for the Modelling of Human Behaviour from a Psychosocial View. In Semantic Interoperability: Issues, Solutions, and Challenges; River Publishers: Roma, Italy, 2012; p. 49. [Google Scholar]
- Alland, A. Evolution and Human Behaviour: An Introduction to Darwinian Anthropology; Routledge: London, UK, 2012. [Google Scholar]
- Tsymbal, A. The problem of concept drift: Definitions and related work. Comput. Sci. Dep. Trinity Coll. Dublin 2004, 106, 58. [Google Scholar]
- Chen, X.W.; Lin, X. Big data deep learning: Challenges and perspectives. IEEE Access 2014, 2, 514–525. [Google Scholar] [CrossRef]
- Atzori, L.; Iera, A.; Morabito, G. The internet of things: A survey. Comput. Netw. 2010, 54, 2787–2805. [Google Scholar] [CrossRef]
- Index, C.V.N. Cisco Visual Networking Index: Forecast and Methodology 2015–2020; White Paper; CISCO: San Francisco, CA, USA, 2015. [Google Scholar]
- Mamlin, B.W.; Tierney, W.M. The promise of information and communication technology in healthcare: Extracting value from the chaos. Am. J. Med. Sci. 2016, 351, 59–68. [Google Scholar] [CrossRef]
- Wichert, R.; Eberhardt, B. Ambient Assisted Living: 4. AAL-Kongress 2011 Berlin, Germany, January 25–26, 2011; Springer: London, UK, 2011. [Google Scholar]
- Bayo-Monton, J.L.; Martinez-Millana, A.; Han, W.; Fernandez-Llatas, C.; Sun, Y.; Traver, V. Wearable Sensors Integrated with Internet of Things for Advancing eHealth Care. Sensors 2018, 18, 1851. [Google Scholar] [CrossRef]
- Jameson, J.L.; Longo, D.L. Precision medicine—Personalized, problematic, and promising. Obstet. Gynecol. Surv. 2015, 70, 612–614. [Google Scholar] [CrossRef]
- Chaaraoui, A.A.; Climent-Pérez, P.; Flórez-Revuelta, F. A review on vision techniques applied to human behaviour analysis for ambient-assisted living. Expert Syst. Appl. 2012, 39, 10873–10888. [Google Scholar] [CrossRef]
- Botia, J.A.; Villa, A.; Palma, J. Ambient assisted living system for in-home monitoring of healthy independent elders. Expert Syst. Appl. 2012, 39, 8136–8148. [Google Scholar] [CrossRef]
- Bamis, A.; Lymberopoulos, D.; Teixeira, T.; Savvides, A. The BehaviorScope framework for enabling ambient assisted living. Pers. Ubiquitous Comput. 2010, 14, 473–487. [Google Scholar] [CrossRef]
- Dogan, O.; Bayo-Monton, J.L.; Fernandez-Llatas, C.; Oztaysi, B. Analyzing of Gender Behaviors from Paths Using Process Mining: A Shopping Mall Application. Sensors 2019, 19, 557. [Google Scholar] [CrossRef]
- Dogan, O.; Gurcan, O.F.; Oztaysi, B.; Gokdere, U. Analysis of Frequent Visitor Patterns in a Shopping Mall. In Industrial Engineering in the Big Data Era; Springer: London, UK, 2019; pp. 217–227. [Google Scholar]
- Duda, R.O.; Hart, P.E.; Stork, D.G. Pattern Classification; John Wiley & Sons: New York, NY, USA, 2012. [Google Scholar]
- Fernández-Llatas, C.; Benedi, J.M.; García-Gómez, J.; Traver, V. Process mining for individualized behavior modeling using wireless tracking in nursing homes. Sensors 2013, 13, 15434–15451. [Google Scholar] [CrossRef]
- Martinez-Millana, A.; Lizondo, A.; Gatta, R.; Vera, S.; Salcedo, V.T.; Fernandez-Llatas, C. Process Mining Dashboard in Operating Rooms: Analysis of Staff Expectations with Analytic Hierarchy Process. Int. J. Environ. Res. Public Health 2019, 16, 199. [Google Scholar] [CrossRef]
- Bogner, M.S. Human Error in Medicine; CRC Press: Boca Raton, FL, USA, 2018. [Google Scholar]
- Van der Aalst, W.M. Process Mining: Data Science in Action; Springer: London, UK, 2016. [Google Scholar]
- Van Der Aalst, W.; Adriansyah, A.; De Medeiros, A.K.A.; Arcieri, F.; Baier, T.; Blickle, T.; Bose, J.C.; Van Den Brand, P.; Brandtjen, R.; Buijs, J.; et al. Process mining manifesto. In International Conference on Business Process Management; Springer: London, UK, 2011; pp. 169–194. [Google Scholar]
- Fernandez-Llatas, C.; Lizondo, A.; Monton, E.; Benedi, J.M.; Traver, V. Process mining methodology for health process tracking using real-time indoor location systems. Sensors 2015, 15, 29821–29840. [Google Scholar] [CrossRef]
- Mshali, H.; Lemlouma, T.; Moloney, M.; Magoni, D. A survey on health monitoring systems for health smart homes. Int. J. Ind. Ergon. 2018, 66, 26–56. [Google Scholar] [CrossRef]
- Ma’arif, M.R. Revealing daily human activity pattern using process mining approach. In Proceedings of the 2017 4th International Conference on Electrical Engineering, Computer Science and Informatics (EECSI), Yogyakarta, Indonesia, 19–21 September 2017; pp. 1–5. [Google Scholar]
- Nakatumba, J.; van der Aalst, W.M. Analyzing resource behavior using process mining. In International Conference on Business Process Management; Springer: London, UK, 2009; pp. 69–80. [Google Scholar]
- Maruster, L.; Faber, N.R.; Jorna, R.J.; van Haren, R.J. A Process Mining Approach to Analyse User Behaviour. In WEBIST (2); Academic Publishers: Dordrecht, The Netherlands, 2008; pp. 208–214. [Google Scholar]
- Kim, E.; Helal, S.; Cook, D. Human activity recognition and pattern discovery. IEEE Pervasive Comput. Comput. Soc./IEEE Commun. Soc. 2010, 9, 48. [Google Scholar] [CrossRef]
- Dogan, O. Process Mining for Check-up Process Analysis. IIOBJ 2018, 9, 56–61. [Google Scholar]
- Stevenson, A.; Cordy, J.R. Grammatical inference in software engineering: An overview of the state of the art. In International Conference on Software Language Engineering; Springer: London, UK, 2012; pp. 204–223. [Google Scholar]
- Fernández-Llatas, C.; Meneu, T.; Benedi, J.M.; Traver, V. Activity-based process mining for clinical pathways computer aided design. In Proceedings of the 2010 Annual International Conference of the IEEE Engineering in Medicine and Biology, Buenos Aires, Argentina, 31 August–4 September 2010; pp. 6178–6181. [Google Scholar]
- Fernandez-Llatas, C.; Pileggi, S.F.; Traver, V.; Benedi, J.M. Timed parallel automaton: A mathematical tool for defining highly expressive formal workflows. In Proceedings of the 2011 Fifth Asia Modelling Symposium, Kuala Lumpur, Malaysia, 24–26 May 2011; pp. 56–61. [Google Scholar]
- Li, N.; Becerik-Gerber, B. Performance-based evaluation of RFID-based indoor location sensing solutions for the built environment. Adv. Eng. Inform. 2011, 25, 535–546. [Google Scholar] [CrossRef]
- Rida, M.E.; Liu, F.; Jadi, Y.; Algawhari, A.A.A.; Askourih, A. Indoor location position based on bluetooth signal strength. In Proceedings of the 2015 2nd International Conference on Information Science and Control Engineering, Shanghai, China, 24–26 April 2015; pp. 769–773. [Google Scholar]
- Fang, S.H.; Wang, C.H.; Huang, T.Y.; Yang, C.H.; Chen, Y.S. An enhanced ZigBee indoor positioning system with an ensemble approach. IEEE Commun. Lett. 2012, 16, 564–567. [Google Scholar] [CrossRef]
- Álvarez-García, J.A.; Barsocchi, P.; Chessa, S.; Salvi, D. Evaluation of localization and activity recognition systems for ambient assisted living: The experience of the 2012 EvAAL competition. J. Ambient Intell. Smart Environ. 2013, 5, 119–132. [Google Scholar]
- Byrne, C.; Collier, R.; O’Hare, G. A Review and Classification of Assisted Living Systems. Information 2018, 9, 182. [Google Scholar] [CrossRef]
- Manzoor, A.; Truong, H.L.; Calatroni, A.; Roggen, D.; Bouroche, M.; Clarke, S.; Cahill, V.; Tröster, G.; Dustdar, S. Analyzing the impact of different action primitives in designing high-level human activity recognition systems. J. Ambient Intell. Smart Environ. 2013, 5, 443–461. [Google Scholar]
- Lee, S.; Ha, K.N.; Lee, K.C. A pyroelectric infrared sensor-based indoor location-aware system for the smart home. IEEE Trans. Consum. Electron. 2006, 52, 1311–1317. [Google Scholar] [CrossRef]
- Van Dongen, B.F.; de Medeiros, A.K.A.; Verbeek, H.; Weijters, A.; Van Der Aalst, W.M. The ProM framework: A new era in process mining tool support. In International Conference on Application and Theory of Petri Nets; Springer: London, UK, 2005; pp. 444–454. [Google Scholar]
- Conca, T.; Saint-Pierre, C.; Herskovic, V.; Sepúlveda, M.; Capurro, D.; Prieto, F.; Fernandez-Llatas, C. Multidisciplinary Collaboration in the Treatment of Patients With Type 2 Diabetes in Primary Care: Analysis Using Process Mining. J. Med. Internet Res. 2018, 20, e127. [Google Scholar] [CrossRef]
- Günther, C.W.; Rozinat, A. Disco: Discover Your Processes. BPM 2012, 940, 40–44. [Google Scholar]
- Vidal, E.; Prieto, N.; Sanchis, E.; Rulot, H. Application of the Error Correcting Grammatical Inference Method (ECGI) to Multi-speaker isolated word recognition. In Recent Advances in Speech Understanding and Dialog Systems; Springer: London, UK, 1988; pp. 317–321. [Google Scholar]
- Dogan, O. Heuristic Approaches in Clustering Problems. In Handbook of Research on Applied Optimization Methodologies in Manufacturing Systems; IGI Global: Hershey, PA, USA, 2018; pp. 107–124. [Google Scholar]
- Lee, J.; Bagheri, B.; Kao, H.A. A cyber-physical systems architecture for industry 4.0-based manufacturing systems. Manuf. Lett. 2015, 3, 18–23. [Google Scholar] [CrossRef]
- Oppitz, M.; Tomsu, P. Internet of Things. In Inventing the Cloud Century; Springer: London, UK, 2018; pp. 435–469. [Google Scholar]
- Dogan, O.; Gurcan, O.F. Applications of Big Data and Green IoT Enabling Technologies for Smart Cities. In Handbook of Research on Big Data and the IoT; IGI Global: Hershey, PA, USA, 2018; pp. 22–41. [Google Scholar]
- Salkin, C.; Oner, M.; Ustundag, A.; Cevikcan, E. A conceptual framework for Industry 4.0. In Industry 4.0: Managing The Digital Transformation; Springer: London, UK, 2018; pp. 3–23. [Google Scholar]
© 2019 by the authors. Licensee MDPI, Basel, Switzerland. This article is an open access article distributed under the terms and conditions of the Creative Commons Attribution (CC BY) license (http://creativecommons.org/licenses/by/4.0/).