1. Introduction
Transmission line towers are important parts of the power system, but due to the special nature of their operating environments, some accidents can occur, such as collapse and breakage [
1,
2]. Although tower structures have been improved, the risk of damage cannot be avoided [
3]. Accidents are caused by abnormal stresses, and inclination and settlement are the causes of abnormal forces [
4].
To better understand the mechanical distribution characteristics of towers and the ability of towers under various conditions to undergo disasters, many scholars have analysed tower forces through calculation methods. Including the structural capacity of transmission towers under wind load and corrosive conditions [
5], failure analysis is carried out by finite element simulation in freezing rain, snow and wind load [
6,
7]. Some people have obtained the static wind load coefficient of transmission towers and transmission lines through wind tunnel experiments and have calculated an iron tower’s load by combining meteorological parameters to calculate the failure probability of the tower [
8].
Compared with various calculation methods, state monitoring technology can directly obtain the structural state of a tower by measuring the iron tower. Condition monitoring based on tilt sensors was an early method used to give alarm information when a tilt angle exceeded a standard threshold [
9]. Differential synthetic aperture radar interferometry has also been attempted for monitoring tower tilt [
10]. This method is mainly used to detect significant changes in the overall structure of towers, and local deformation and damage are not applicable. There are also studies of health monitoring of towers in special areas, such as tower foundations in permafrost regions that may become unstable with a rise in temperature, and some people have monitored the temperature of frozen soil to achieve structural health monitoring [
11].
The visual method is a better way to monitor the structure of iron towers. Deformation and structural state can be measured by images [
12], especially with the application of robotic total station and unmanned aerial vehicles (UAVs) in the power industry, which provides a better platform for this method [
13,
14]. Reference [
15] uses a point cloud model to implement viewpoint optimization, which can improve the accuracy of UAV monitoring.
Structural health monitoring using modal analysis is a common method and is often used in large structures such as bridges and offshore platforms. There are also some studies on transmission lines. In [
16], a modal identification method without cable was studied in a laboratory environment, but in practice, cable is not negligible. Reference [
17] established a finite element model for the health monitoring of the tower structure of a 131-metre large transmission tower and obtained the conclusion that the ladder, steel plate and bolt have no influence on the overall stiffness of the tower. Reference [
18] proposed an optimization method for the installation position of an acceleration sensor.
In this paper, a vibration-based tower structure health monitoring system is designed. This system is mounted on an accelerometer tower and transmits to an analyser through Zigbee. The analyser recognizes the natural frequency and gives an alarm based on the change in the natural frequency. The modal parameters of the tower are then identified. Finally, through the change in the modal parameters, whether the tower is settled is judged. Based on analysis of the vibration response of a tower, the response and natural frequency of vibration at different wind speeds and different positions are analysed by time-domain signal, power spectral density (PSD), root mean square (RMS) and short-time Fourier transform (STFT). The natural frequency identification of the overall structure is performed by the stochastic subspace identification (SSI) method. The system was tested on a 110 kV transmission tower, and the variation in the natural frequency of the tower was analysed before and after the deformation caused by lifting tower legs.
2. Design and Specifications the Vibration-Based Monitoring System
2.1. System Specifications
To enable operation in strong magnetic and vibration environments, the system is designed to have the following specifications:
Self-powered and low-power devices that can operate for at least 5 years because the solar cells can be charged in daylight conditions—even with continuous rainy days, the device can still run for 30 days depending on the battery.
Wireless communication via Zigbee, which can transmit vibration data in real time or can easily connect to a computer of on-site inspection personnel.
Data loss reconstruction function to reduce errors caused by wireless data loss.
Due to its light weight and small size, it will not cause too much pressure on the tower.
Highly waterproof with normal operation under continuous rain or heavy precipitation.
Anti-electromagnetic interference, installed on the transmission line with a high voltage level, can continue to operate without interference.
Fully considers the long-term operation under vibration conditions and will not cause damage due to wire vibration.
Acceleration maximum measurement range ± 2 g and sensitivity of 0.1 mg.
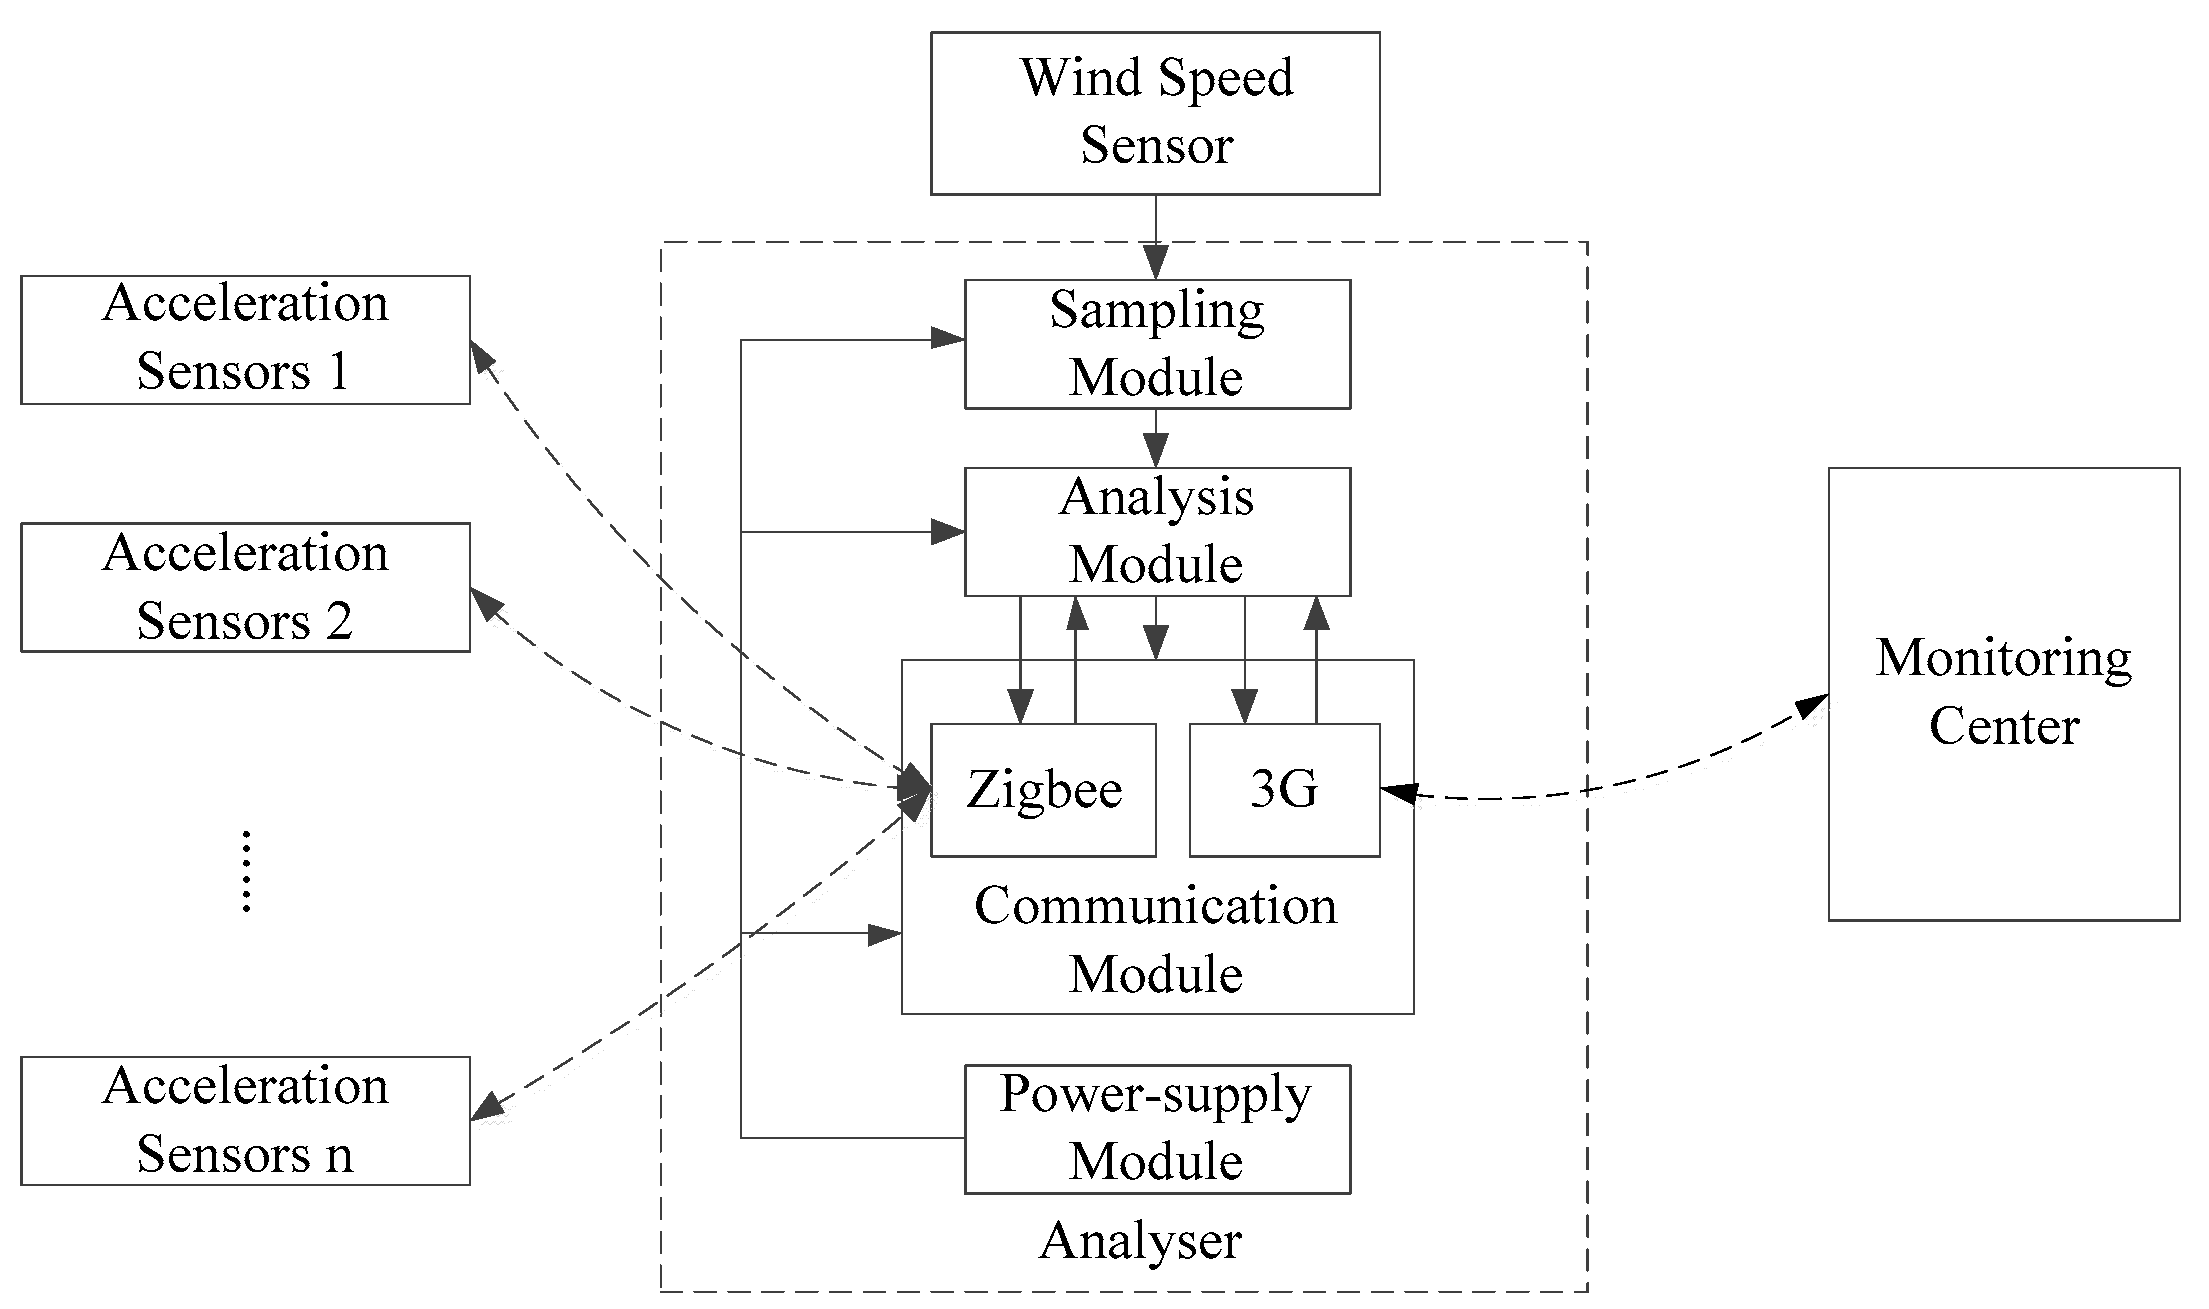
The vibration-based structural health monitoring system designed in this paper includes an acceleration sensor, wind speed and direction sensor, analyser and monitoring center. As shown in
Figure 1, the acceleration sensor is used to measure the vibration acceleration of the tower; the wind speed and direction sensor measures the wind speed and direction near the tower; the analyser receives the vibration data and analyses the modal parameters of the tower; and the monitoring center has the functions of alarm.
The number of accelerometers is determined by the tower type; accelerometers need to be installed at different locations, so they are designed as wireless sensors to transmit data via Zigbee. The components used in the sensors require very low power consumption, allowing the sensors to operate for a longer time. The MSP430F2955 microprocessor was chosen for its ultra-low power consumption and suitable operating speed. The MSP430F2955 microprocessor features a 16-bit RISC architecture with a maximum operating speed of 16 MHz and a minimum current of 0.7 μA in low-power mode. The LIS3DSH is a digital output Micro-Electro-Mechanical System (MEMS) sensor with very low power consumption (0.63 mW) that transmits data to the MSP430F2955 via serial peripheral interface (SPI) and is used to measure acceleration. The control and management module includes a plurality of load switches for controlling the power of each module to achieve energy savings.
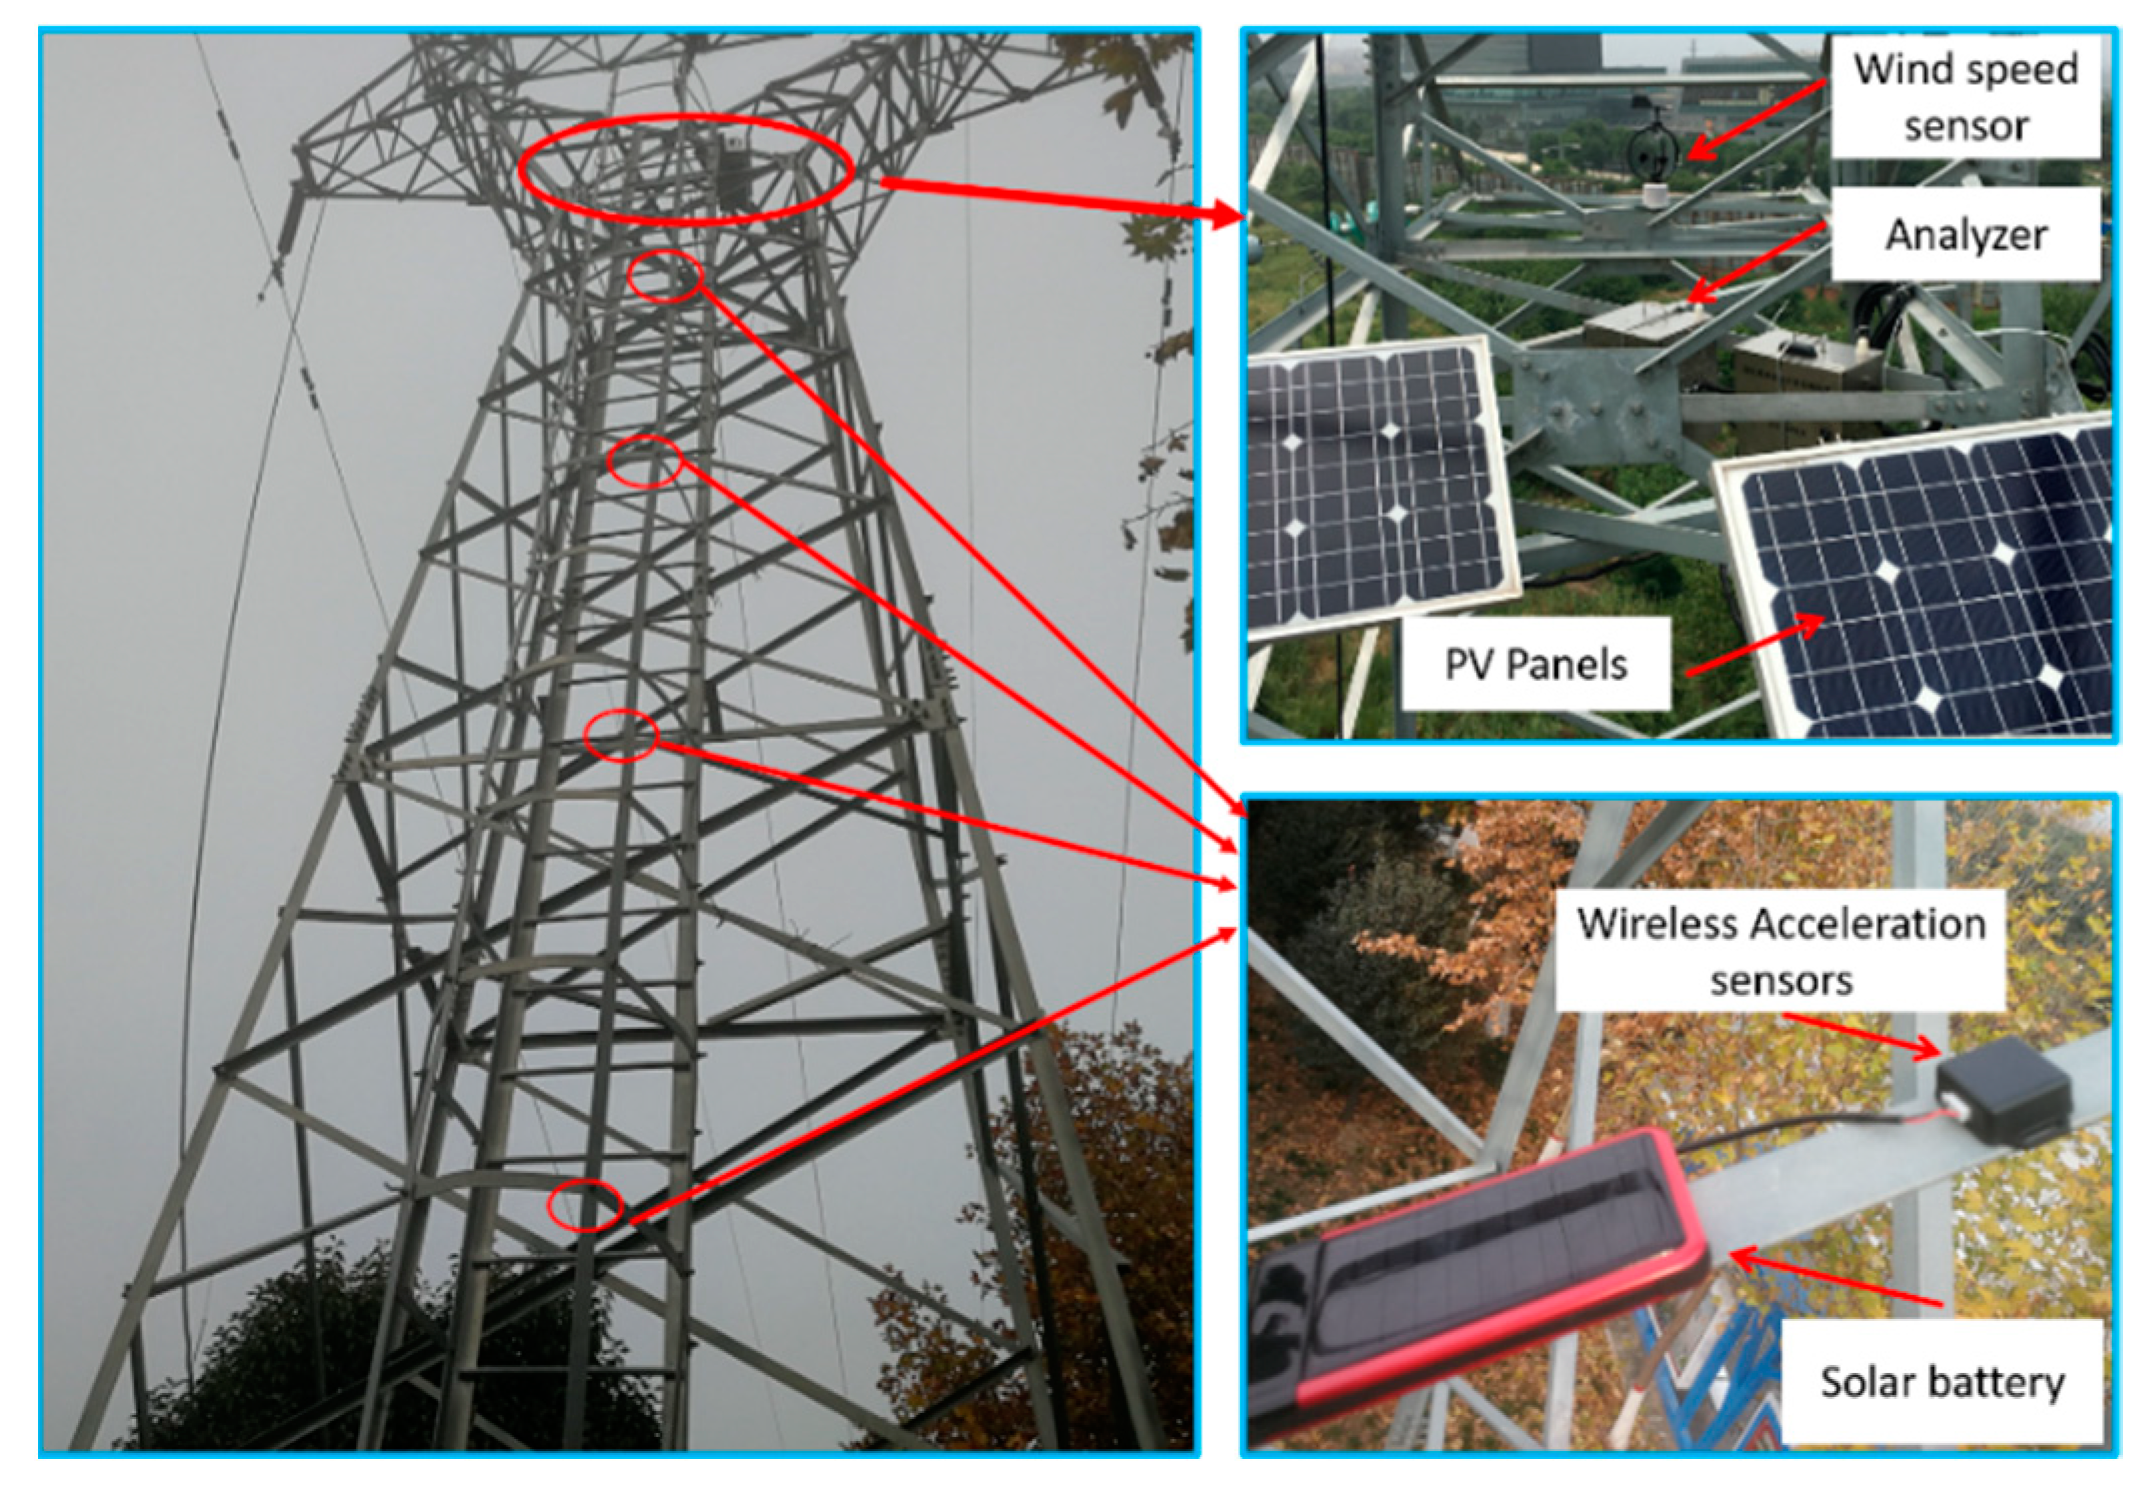
To make the sensor work for a long time and to avoid frequent replacement of the sensor battery, a small solar power source is used to power the acceleration sensor, as shown in
Figure 2. This power source has a power of 1 Wh from the solar charging board, a solar charging efficiency of 200 mA/h and a battery capacity of 20,000 mAh.
The wind speed and direction sensor uses an ultrasonic sensor to transmit data to the analyser via RS485. The sensor model is NHFS47.
The analyser uses STM32F407 as the CPU, and the working frequency can reach 168 MHz with 192 Kbytes of SRAM, which is enough to complete the modal analysis algorithm. The analyser’s power supply uses solar and battery power, 40 W solar panels and 40 Ah lead–acid batteries, allowing this power supply to work for more than 30 days without light.
Figure 2 shows a photo of the field installation.
2.2. Data Loss Reconstruction Function
Collecting data with wireless accelerometers is a common way to prevent signal degradation and increase installation flexibility. Wireless signal transmission is usually affected by distance, and data loss occurs. The overall structure of a lattice tower is not large. For example, the height of a 110 kV transmission tower in the plain area generally ranges from 15 m to 27 m. However, the lattice structure hinders wireless signals and makes it inevitable to lose some data during data transmission. To ensure the integrity of the data and improve the overall reliability of the system, this paper adopts a data recovery method based on compressed sampling (CS) to solve the problem of data loss in the wireless data transmission process. The key of this method is that the compressed data are sparse. According to preliminary experiments, the vibration response of the transmission tower does not have the characteristics of the coefficient matrix in the time domain. However, in the frequency domain, we are more concerned with the natural frequency. The vibration is a sparse matrix in the frequency domain.
First, the data collected by the sensor are compressed,
where
represents the acceleration data after compression. It is an m–order vector.
is the compression matrix. It is an m × n–order matrix.
is the data collected by the sensor and is an n–order vector.
is random noise.
Then, the compressed data
A0 are sent to the analyser, and the data
A1 received by the analyser after packet loss are determined according to the sampling frequency and the time label, the positions of the lost data are determined and the column corresponding to
Ψ0 is removed to obtain a new compression matrix
Ψ. The CS method can be used to reconstruct and recover lost data.
where
By calculating
x, data a can be reconstructed, and
x can be solved by solving 1-norm optimization.
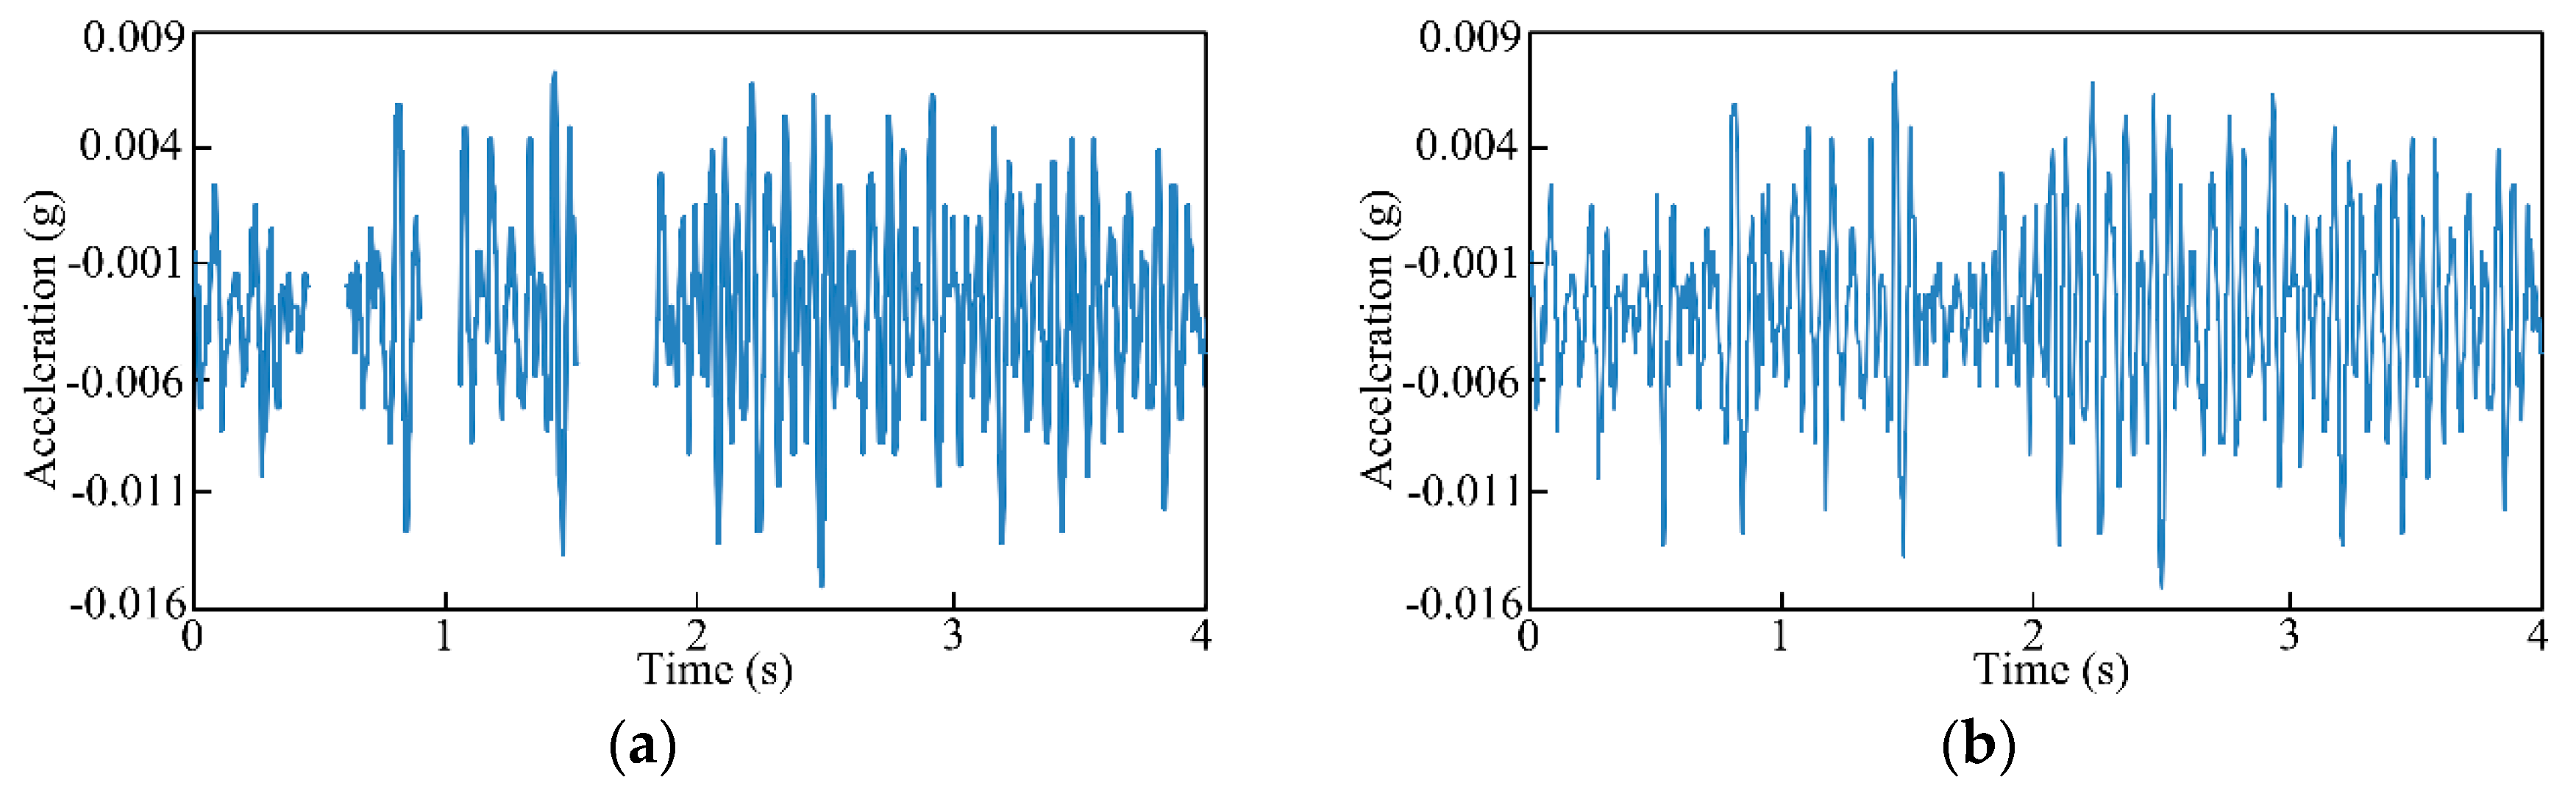
The online monitoring system designed in this paper is for a 110 kV transmission tower experiment at the Lintong Campus of Xi’an Polytechnic University. The sampling frequency of the acceleration sensor is 200 Hz, and data are collected for 20 minutes. The data loss rate is 5%, and the graph shows a typical packet loss situation. As shown in
Figure 3, the error caused by data loss can be reduced by data reconstruction.
3. Signal Processing and Natural Frequency Calculation
Acceleration is the main concern of the structural health monitoring system. However, the magnitude of acceleration does not directly reflect structural changes. After the structure of the transmission tower changes, it directly shows the change in the modal parameters. The relationship between acceleration and the modal parameters can be clearly seen from the equation of motion.
3.1. Equation of Motion of a Transmission Tower
Transmission towers are typical lattice towers that vibrate under the influence of wind. The structure of the transmission tower can be regarded as a multi-degree-of-freedom vibration system, and its differential equation of motion can be written as:
where
is the mass matrix,
is the damping ratio,
is the stiffness matrix,
is an externally applied force (wind load),
is the acceleration,
is the velocity,
is the displacement.
Under normal circumstances, the external force generated by the wind is similar to white noise. When the structure of the tower changes, the damping ratio and stiffness change, and the acceleration, velocity and displacement also change. Changes in structure and stiffness also result in changes in the natural frequency. Often, structural health monitoring techniques are the inverse of the equation of motion. First, the vibration acceleration is measured and the modal parameters, such as the natural frequency, the damping ratio and the mode shape, are analysed by the acceleration spectrum. The structural change is judged according to the change in the modal parameters.
3.2. Modal Identification of Transmission Towers
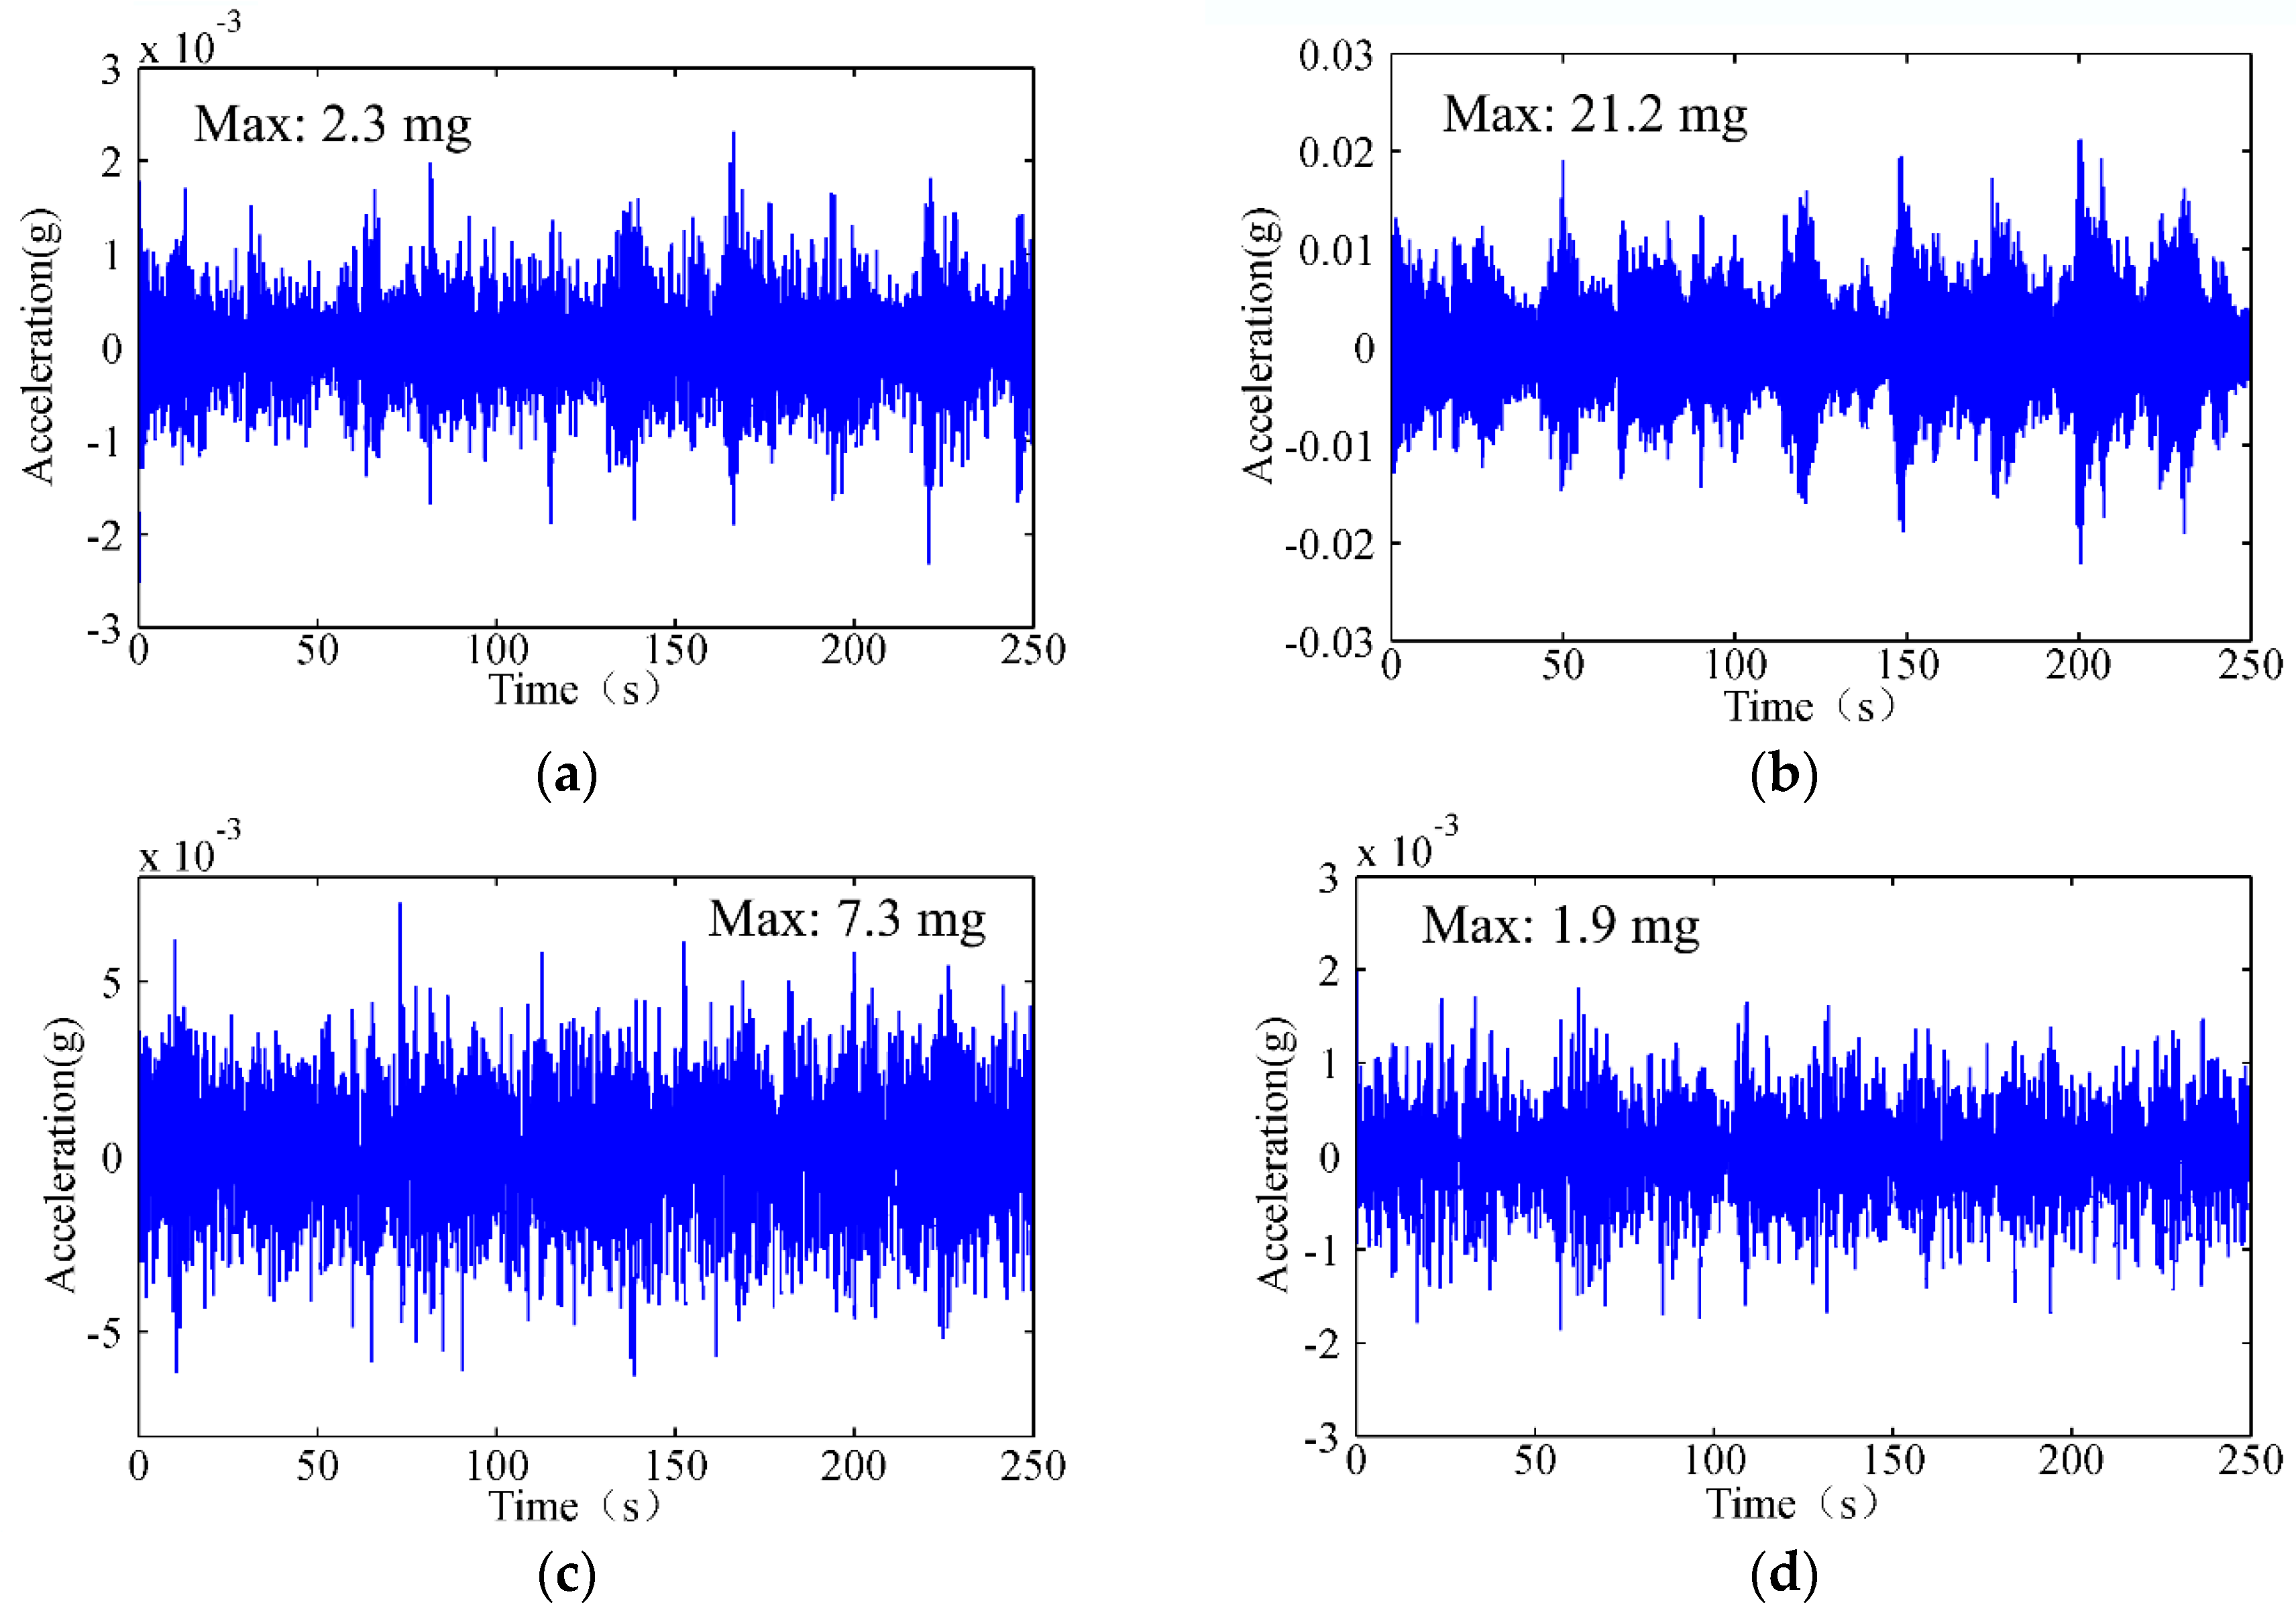
As expressed in Equation (4), the acceleration of a tower is related to parameters such as mass, stiffness and damping ratio. Modal recognition technology is a technique for solving modal parameters by acceleration signals. In this paper, the transmission tower structure health monitoring system is designed to install four accelerometers in a 21 m high 110 kV transmission line cat-head tower, and the vibration response is collected every 2 hours.
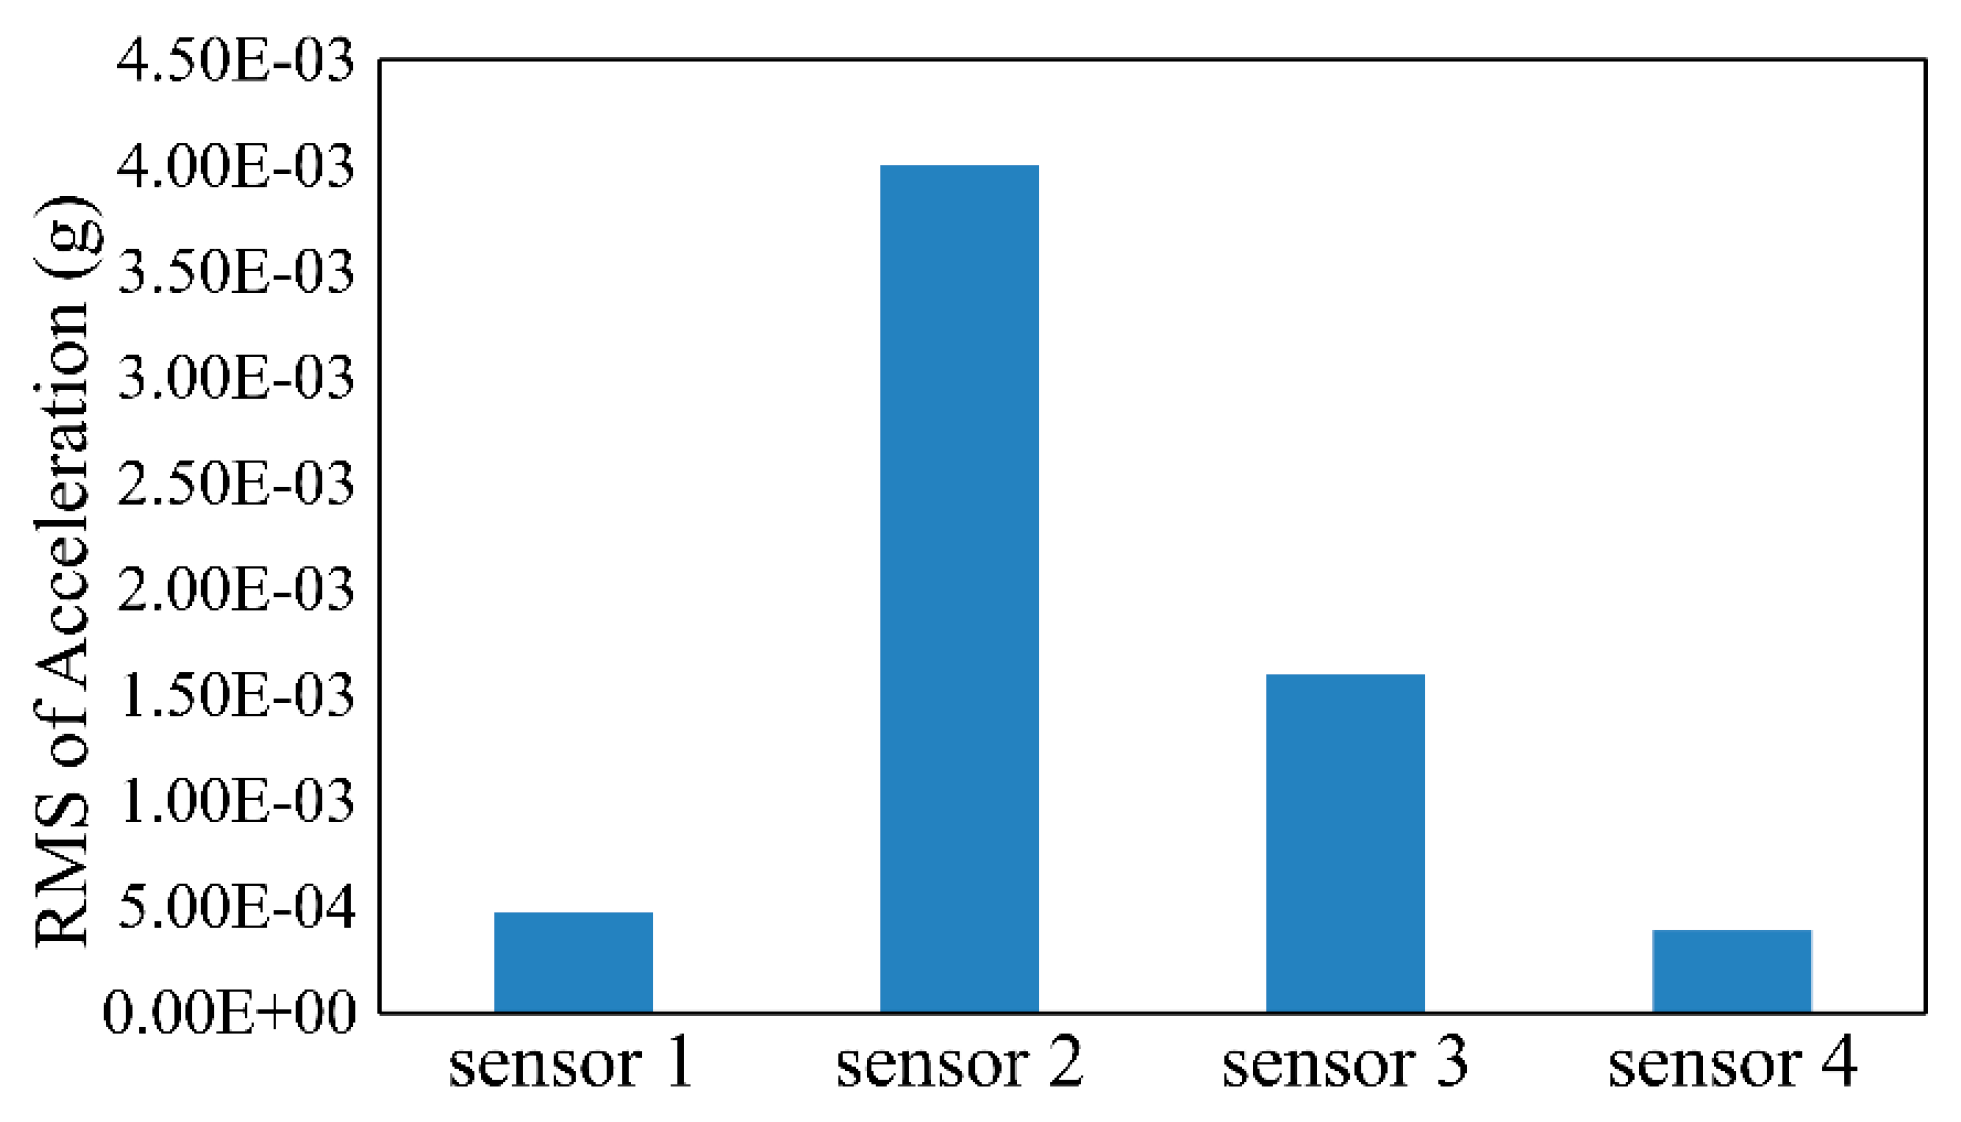
Figure 4 shows the time-domain signal of the sensor acceleration. It can be seen from the figure that the vibration acceleration of sensor 2 is the largest, which reaches 21.2 mg. That of sensor 3 is slightly smaller, and the maximum value reaches 7.3 mg. Other sensors have smaller acceleration amplitudes. It can also be seen from the RMS value shown in
Figure 5 that the responses of sensor 2 and sensor 3 are larger, while the responses of sensors 1 and 4 are smaller. This result is because the tower legs are partially bolted and have certain constraints. At the same time, the tower head is restrained by the force of the transmission wire, and the vibration response is not large.
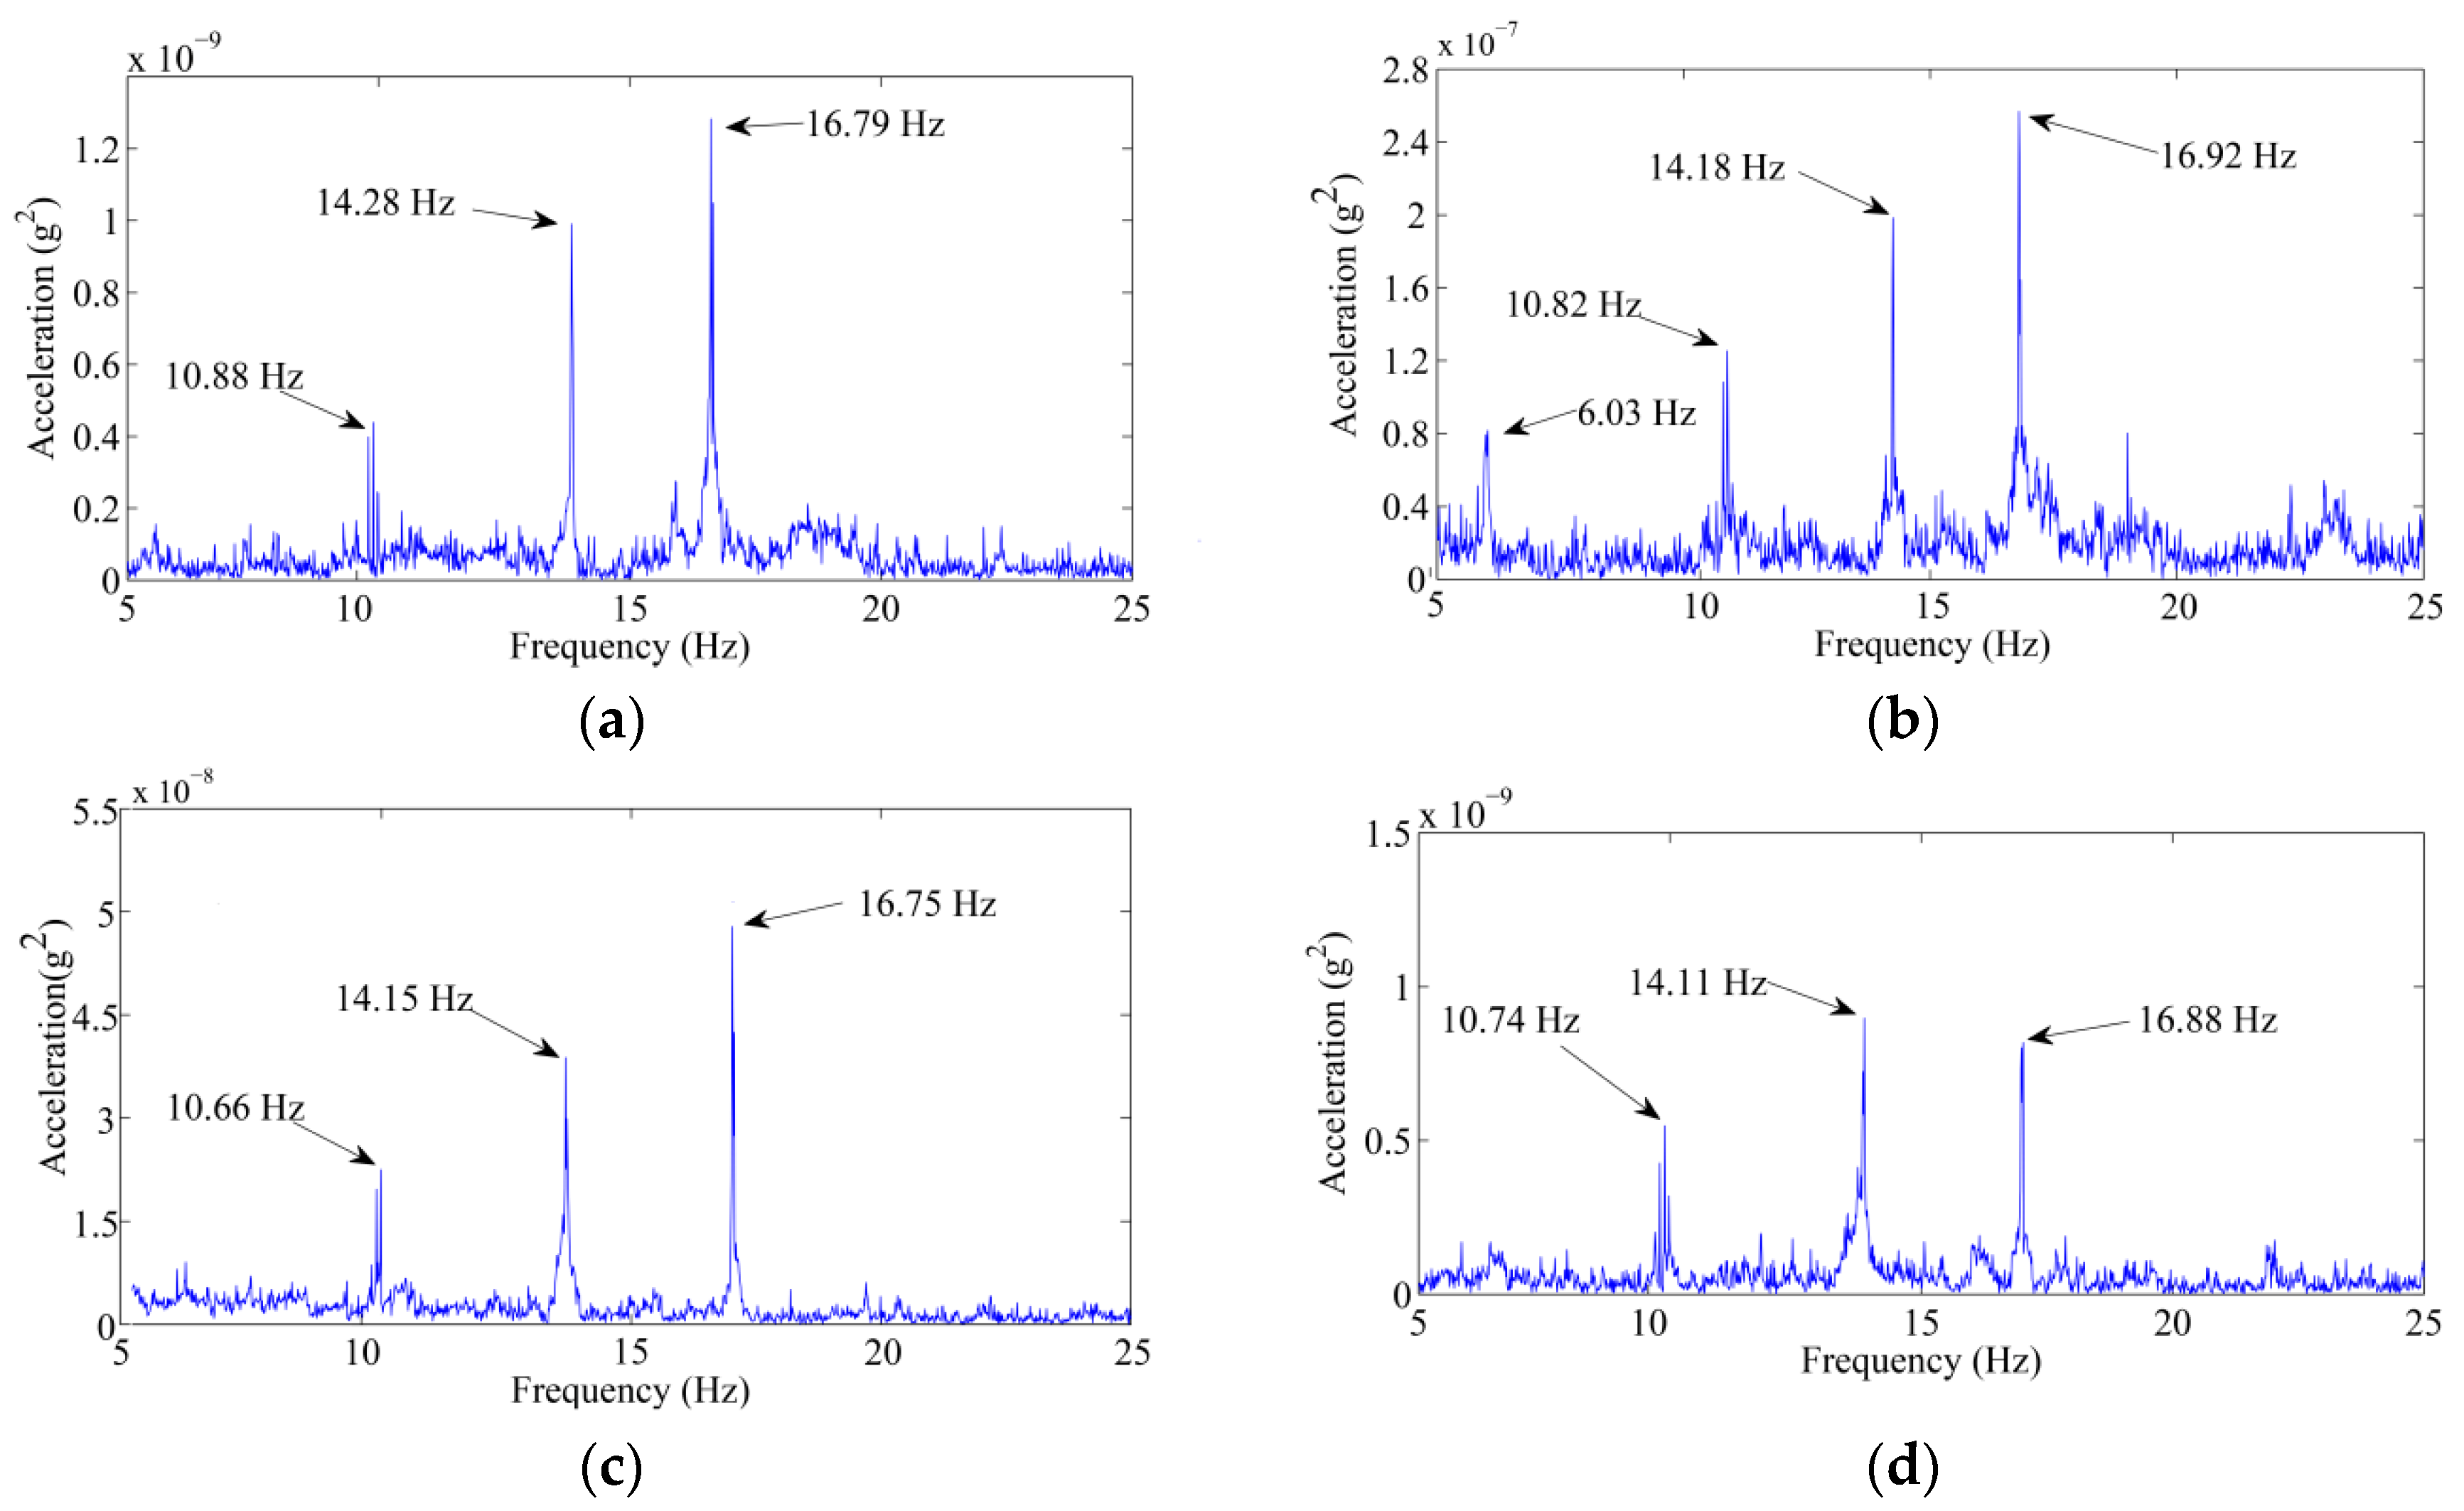
Figure 6 shows the self PSD of the four sensors. Although the acceleration responses of sensors 1 and 4 are small, the response at certain frequencies is indeed outstanding, especially at 3.891 Hz, 10.171 Hz and 11.786 Hz. Considering that the frequency of wind is broadband, similar to white noise, the frequencies marked in the figure may be natural frequencies of the tower. However, the wind continues to fluctuate and the vibration response of the tower is also changing. We need further time–frequency analysis to explain the vibration of the tower.
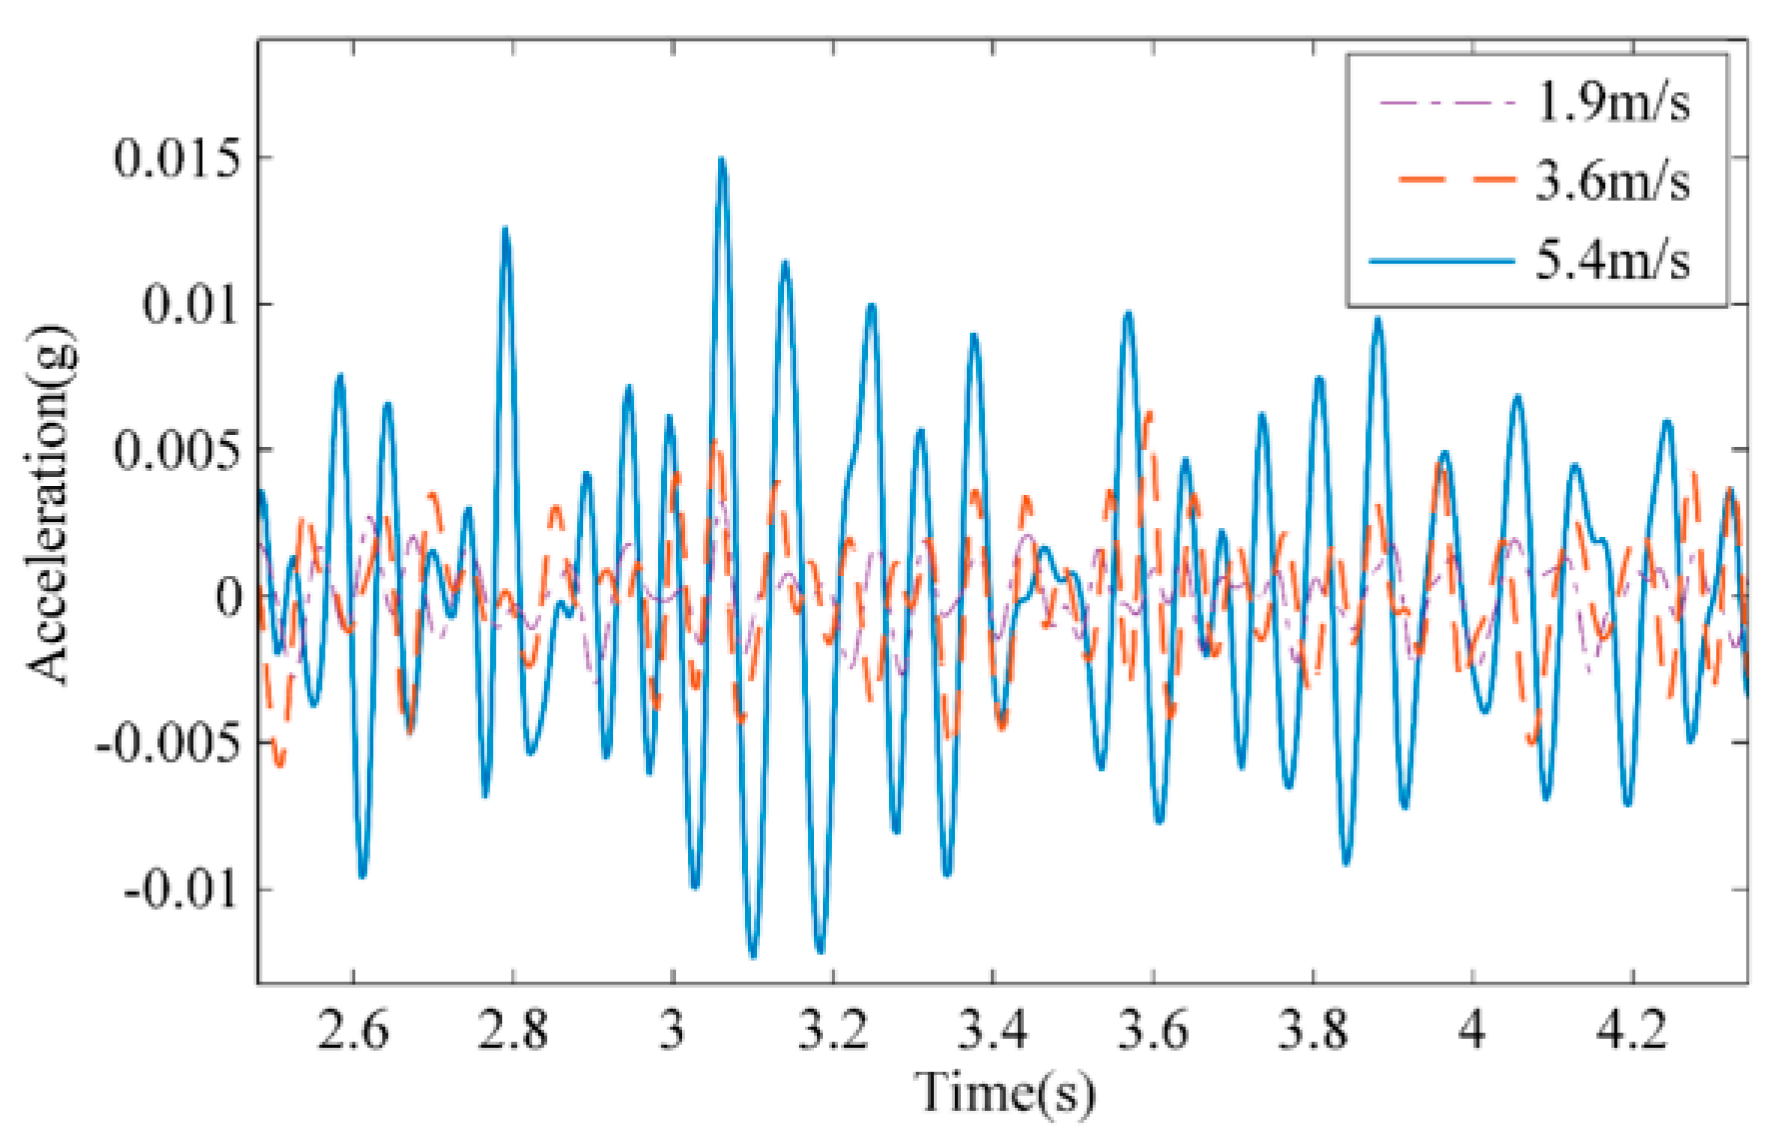
Figure 7 shows the vibration response of sensor 2 at different wind speeds. The greater the wind speed is, the greater the acceleration response. At a wind speed of 1.9 m/s, the maximum amplitude of the acceleration response is only 3.2 mg, while the maximum amplitude is 15.3 mg at a wind speed of 5.4 m/s. Obviously, the dynamic response of the tower is unstable, which is related to the constant fluctuations in wind speed.
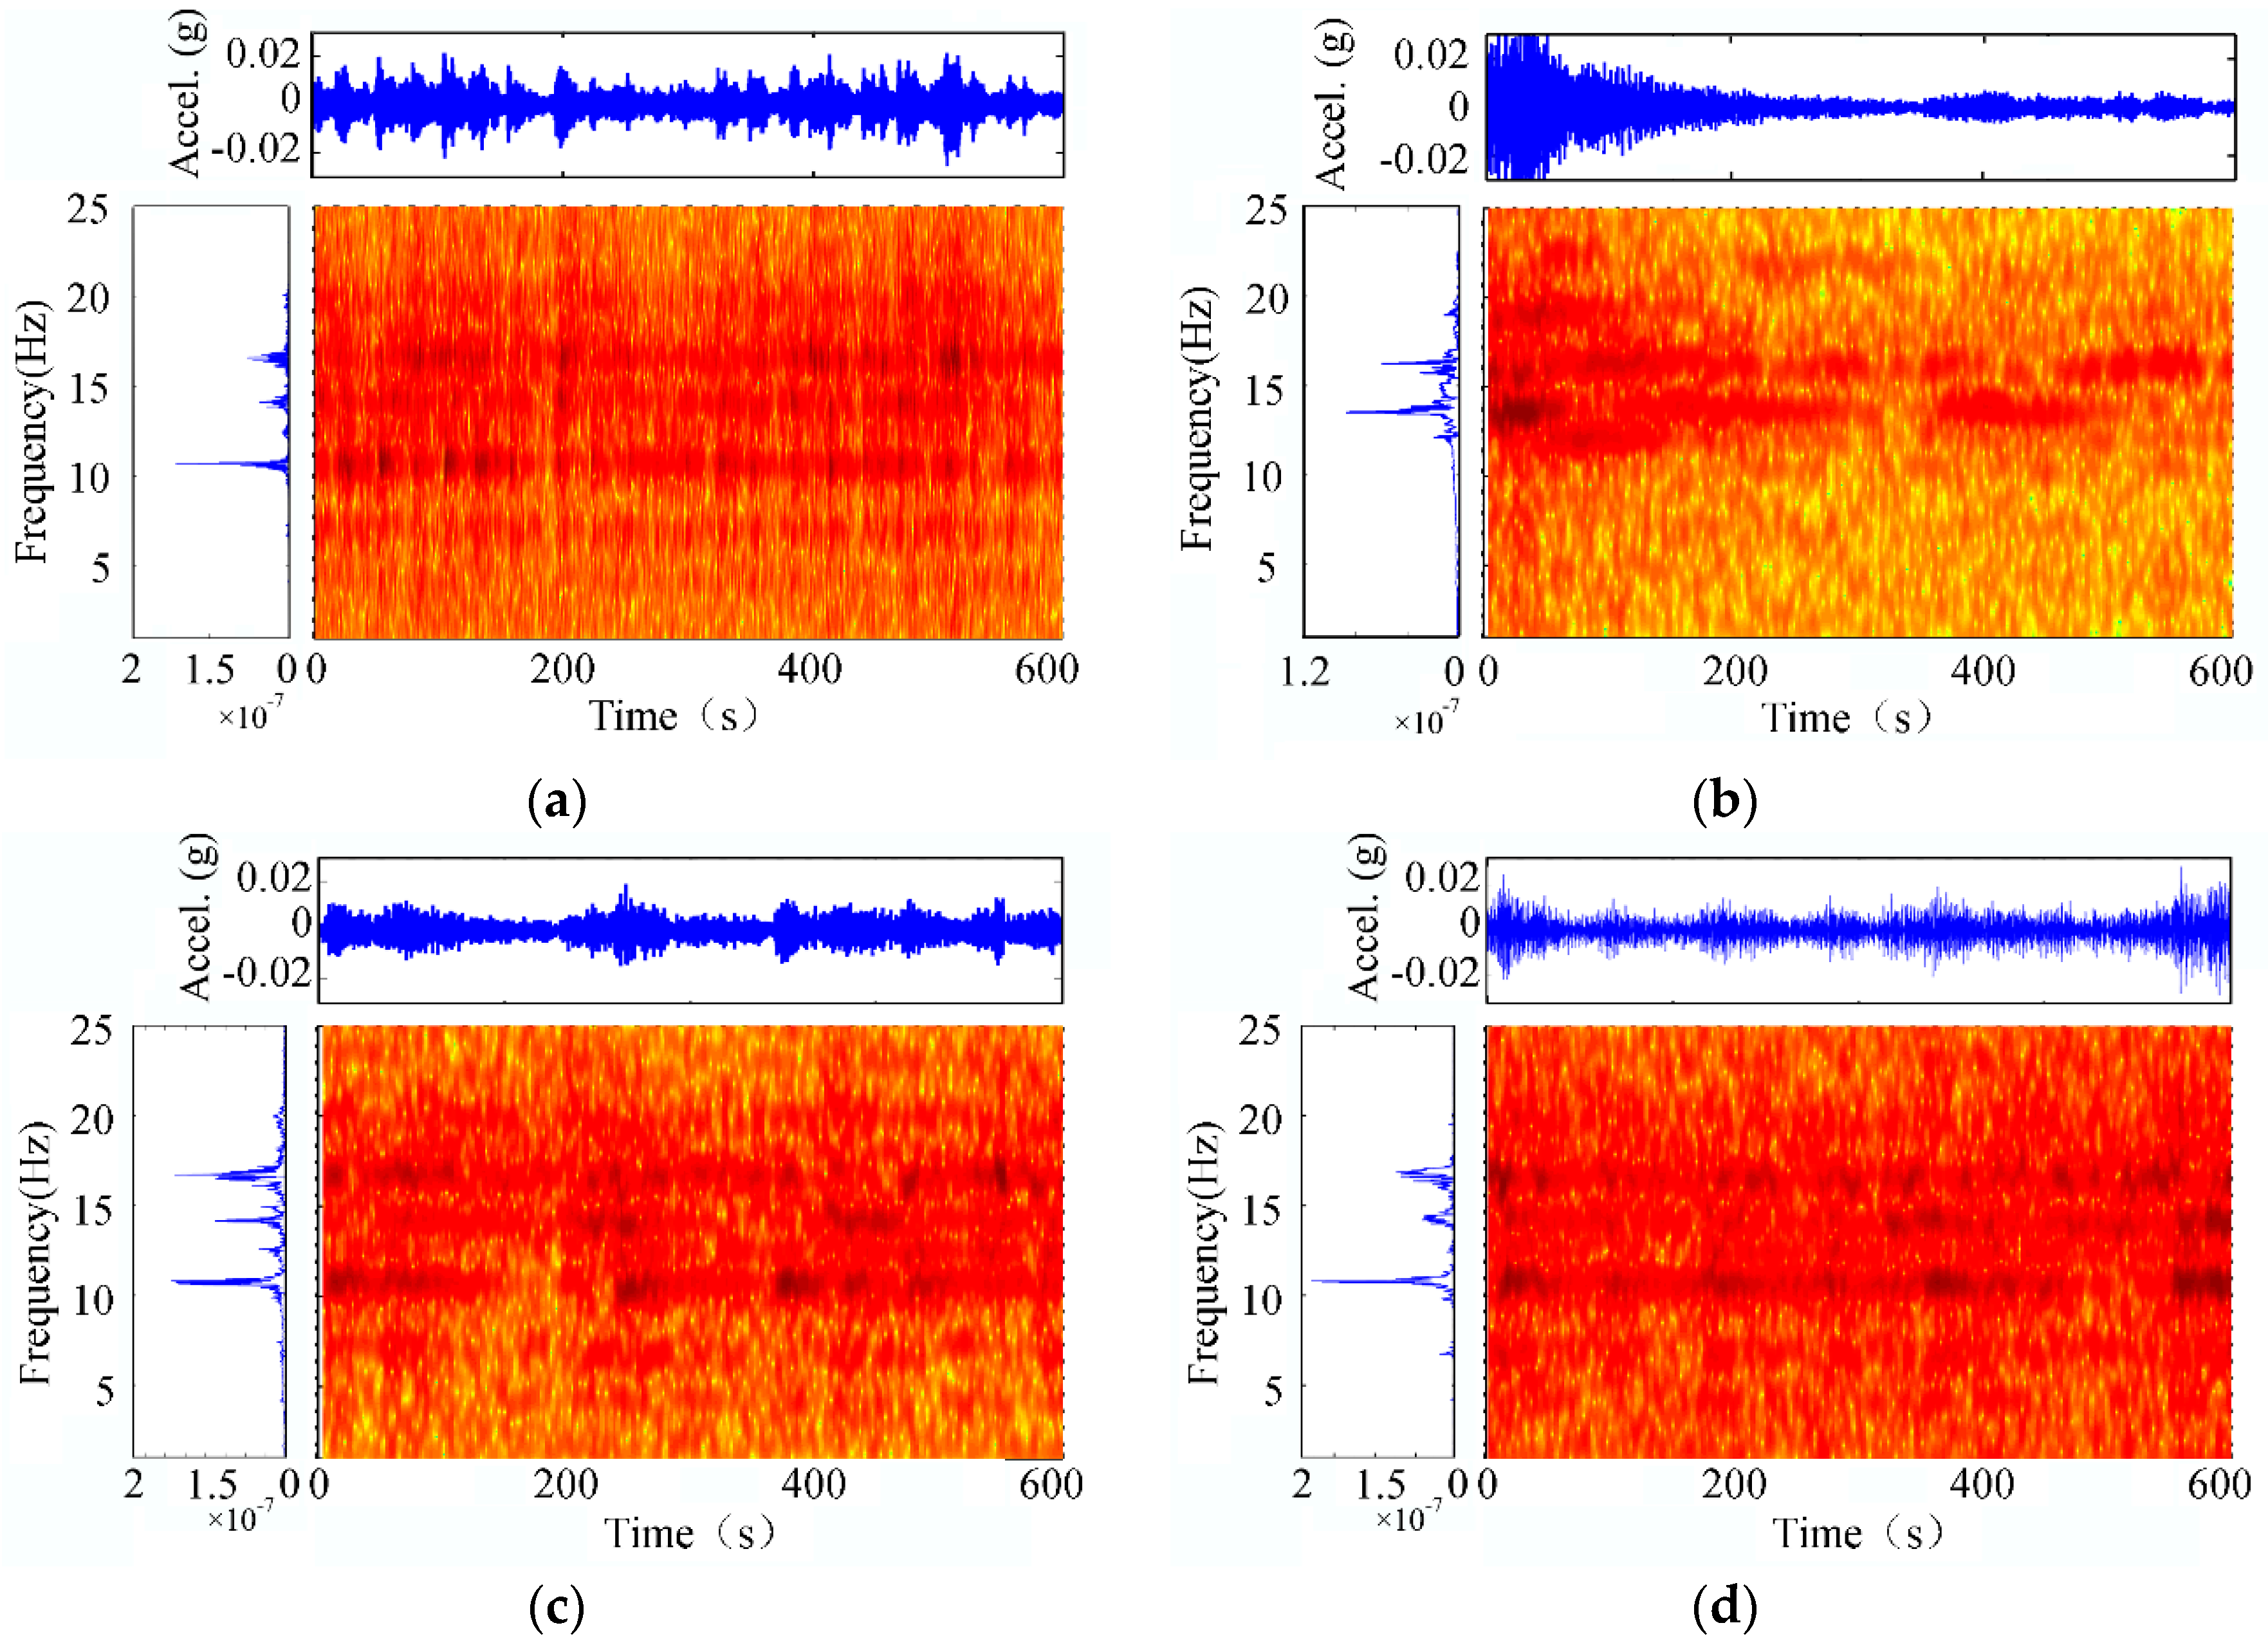
Therefore, the analysis of the vibration signal of the tower should include a method for processing time information. In this paper, the STFT is applied to the vibration response of each node measured by the sensors (seen in
Figure 8). A rectangular window with the length of 512 samples was used for the STFT. We also show the PSD plot on the left side of the spectrum and the time-domain waveform above the map. The time-domain waveform shows that the vibration response of the tower is very unstable, which is caused by the fluctuations in wind speed. At the same time, we found that the stronger the vibration response is, the deeper the colour in the spectrum, further indicating that the vibration intensity is stronger. The map also shows that although the response intensity fluctuates greatly, the dark position in the spectrum is nearly straight. As seen in the PSD diagram on the left, the dark lines correspond to the natural frequencies. As is apparent from
Figure 8b, when the response decrease is more pronounced, the colour in the map is obviously lighter. For example, when the response is strong, the position at 19.5 Hz can be seen, and the colour in the map is darker, indicating that the corresponding wind speed excites this mode.
Figure 8d shows that the mode with a frequency value of approximately 6 Hz is sometimes excited when the response is strong.
From the above analysis, the change in wind intensity causes the response of the transmission tower to change, which has a significant impact on the solution of the modal parameters. In addition, the above methods provide a corresponding analysis of the individual sensors. For the overall modal identification of the tower structure, the SSI method driven by covariance is used to solve the modal parameters for solving the vibration of the tower, and the natural frequency and damping ratio at different wind speeds are obtained, as shown in
Table 1.
It can be seen from the table that all the modal parameters cannot be obtained for different wind speeds, but the 2nd, 3rd and 4th natural frequencies are all present. On the other hand, the natural frequency does not change much at different wind speeds, but the damping ratio varies greatly. Therefore, we use these natural frequencies as the standard of measurement.
4. Experimental Results
The vibration-based transmission tower structure health monitoring system designed in this paper was tested in the experimental transmission line at Xi’an Polytechnic University. The test transmission line is a three-tower, two-speed structure with a voltage rating of 110 kV. The cat-head tower in the middle of the transmission line was tested, and the acceleration sensor was installed in the same position as described in
Section 2.
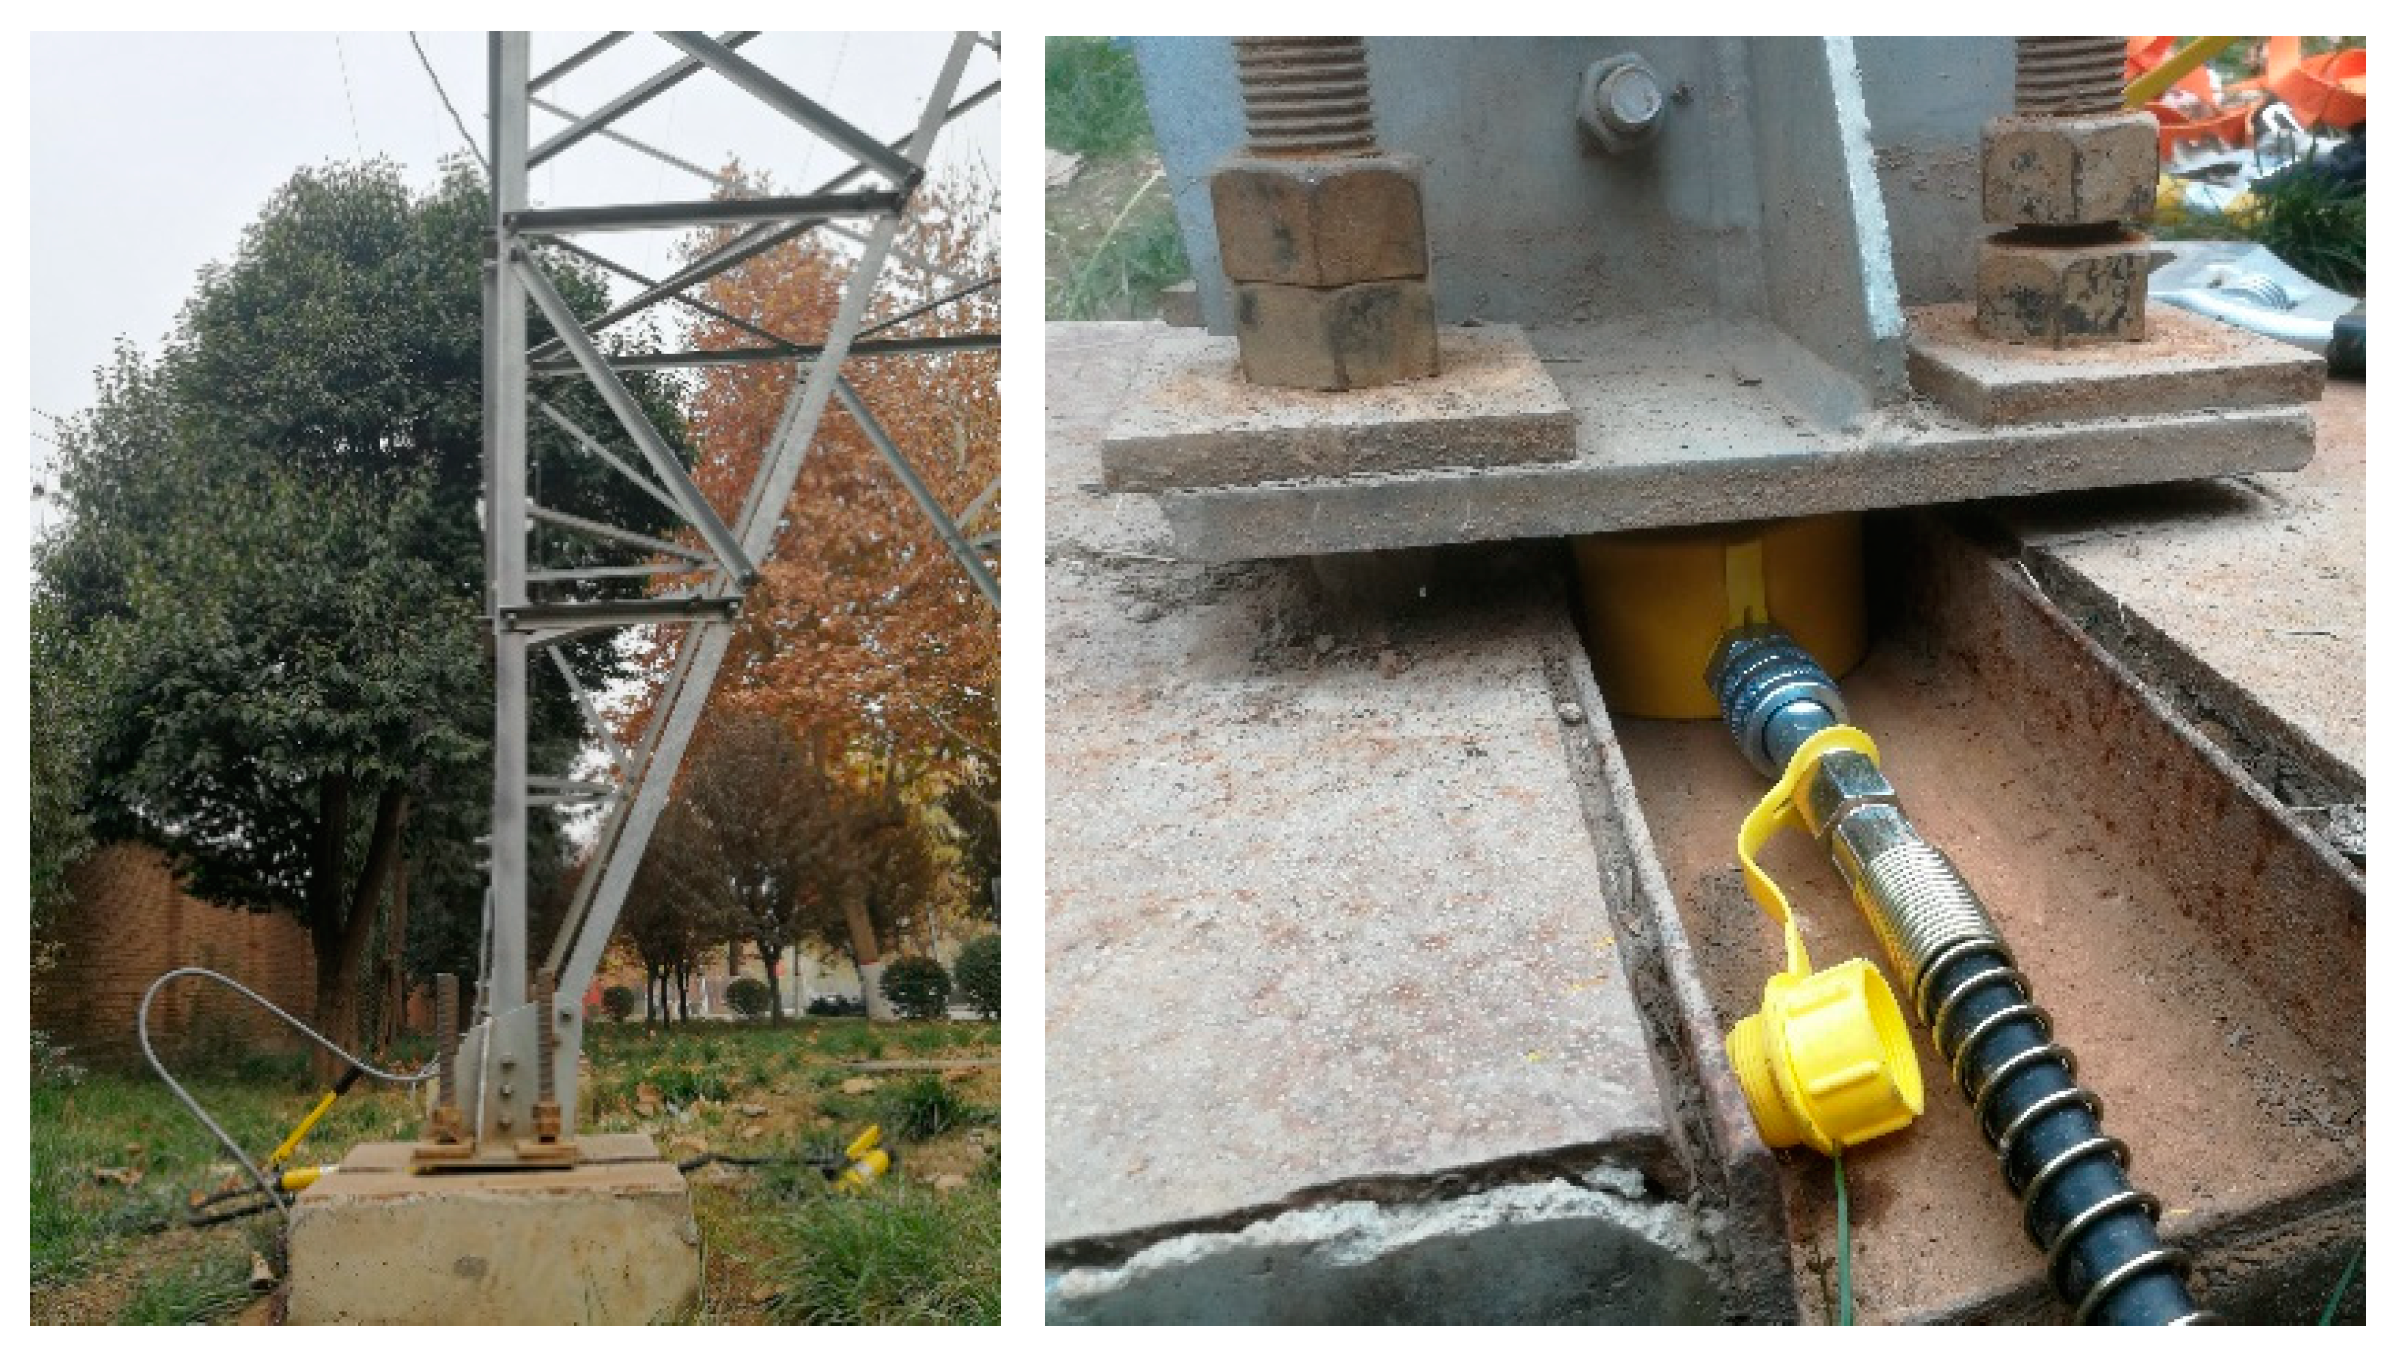
In actual transmission line operation, there are many situations that cause deformation of a tower. After the settlement of a transmission tower, a certain longitudinal displacement of the tower leg causes the force of the tower to change, and a certain deformation will occur. In response to this phenomenon, as shown in
Figure 9, we lifted a tower leg with a hydraulic jack, which is a deformation of the transmission tower.
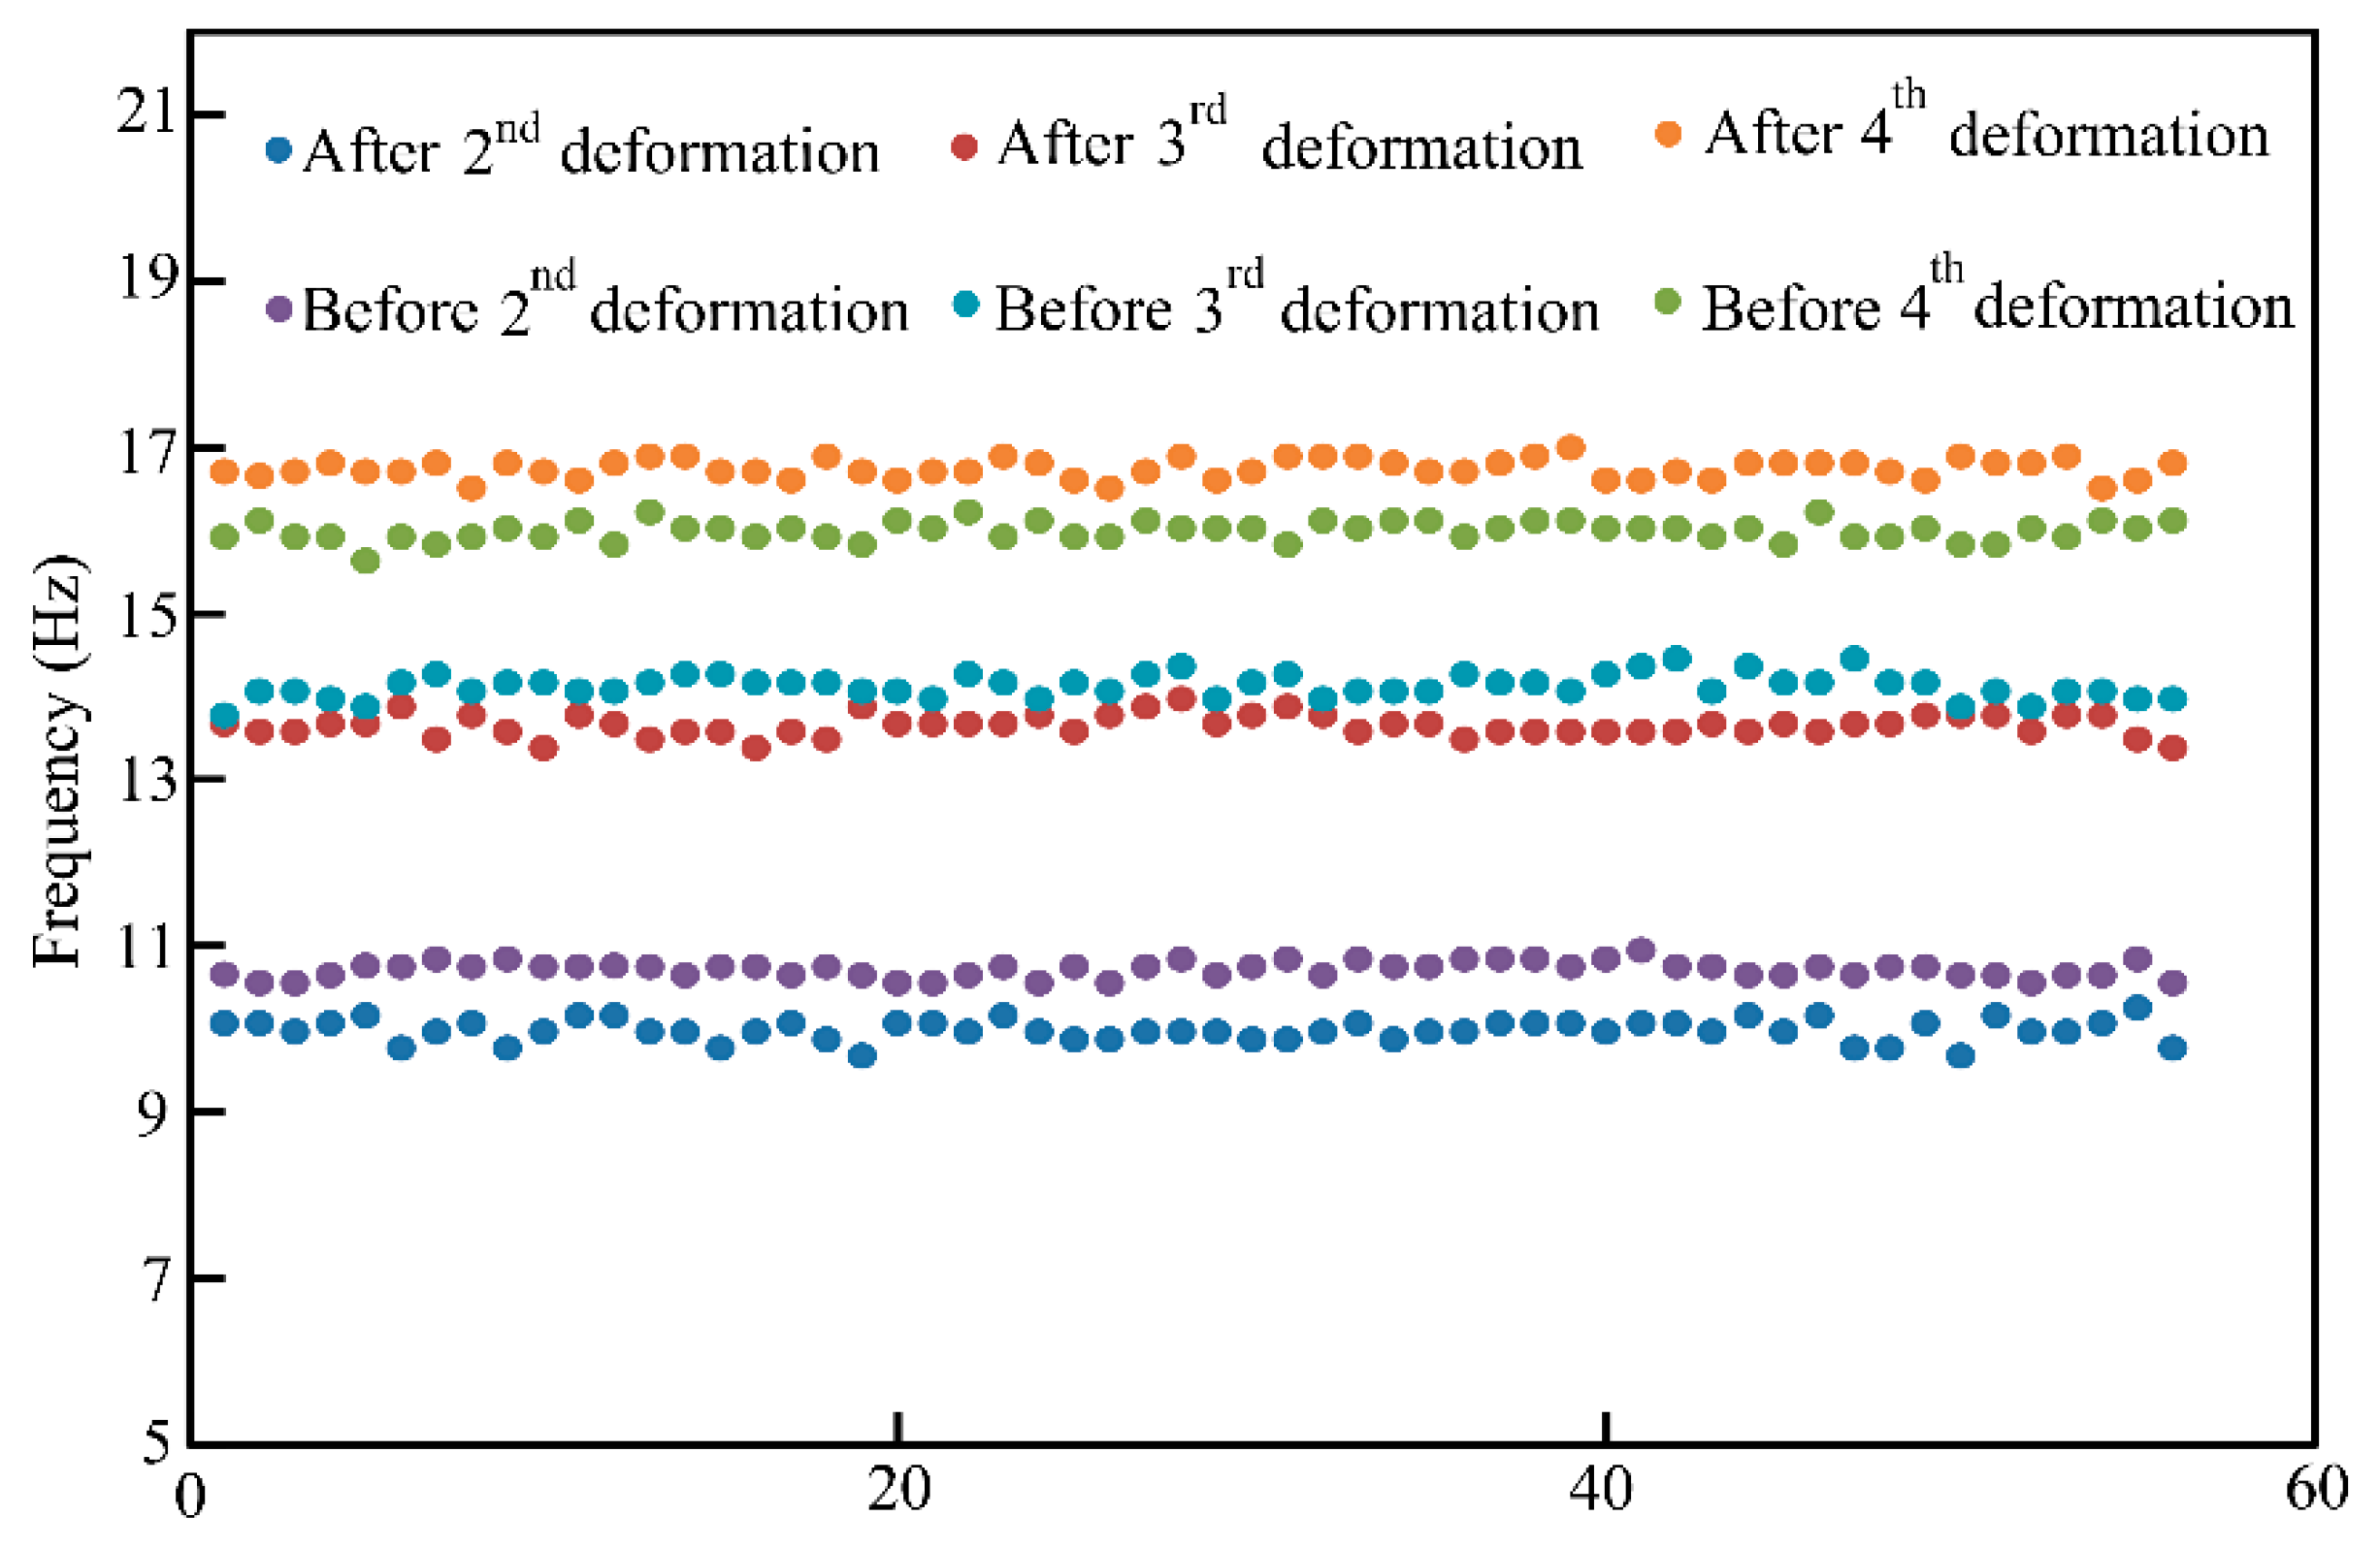
We performed continuous 9-hour experiments with and without deformation. The sampling frequency was 200 Hz, and the data were analysed every 10 minutes. The experimental results are shown in
Figure 10. Although the tower legs are in the same state, the identified natural frequencies still have small fluctuations, which are due to the inherent recognition of certain errors, and temperature changes may also cause changes in the natural frequencies. However, after the tower leg is raised (5 mm in the experiment), the natural frequencies of each order are significantly reduced.
Table 2 shows that the natural frequencies exhibit significant decreases before and after the tower leg is lifted. In particular, the 2nd, 3rd and 4th natural frequencies are shown in this table. Furthermore, the differences between the minimum value before the tower leg is lifted and the maximum value after the lift for these natural frequencies are 0.2999 Hz, −0.19 Hz and 0.3798 Hz, respectively. These results indicate that although the frequencies before and after deformation have changed, as seen in
Figure 10, if the analysis is performed with two measured values alone, it is not possible to determine whether deformation has occurred. However, from long-term monitoring, we found that the changes in the mean values of the 2nd, 3rd and 4th natural frequencies before and after the tower legs were raised were 0.7323 Hz, 0.473 Hz and 0.7491 Hz, respectively. Obviously, the third-order average natural frequency exhibits a substantial change. Therefore, in practical applications, we obtain the average of the natural frequencies as a basis by monitoring for several hours. According to the research results in Reference [
4], 7 mm displacement of tower legs will cause damage to the members. The data in
Table 2 are measured when the displacement of the tower leg is 5 mm. In practical application, the early warning information is given when the 2nd and 4th natural frequencies change to 0.7 Hz.
5. Conclusions
In this work, a system for health monitoring of transmission tower structures was designed and built, and the structural design and functional modules of the system were studied in detail. A field test was carried out on a transmission line spanning 105 m at Xi’an Polytechnic University.
An accelerometer is designed. Data compression technology reduces the influence of the lattice tower on signal transmission and realizes the vibration response of the transmission tower. Solar cells also solved the problem of power supply to the sensor.
The vibration response is analysed. From the time-domain signal, PSD and RMS analysis, it can be seen that the natural frequencies calculated by the responses at different positions are different. Combining the STFT time-domain signal and PSD analysis, it can be seen that the response strength caused by different wind speeds is different, and the number of natural frequencies excited also changes. In addition, from the SSI analysis of the overall structure, the 2nd, 3rd and 4th natural frequencies are excited at different wind speeds.
The system was implemented on a 105 m experimental transmission line at Xi’an Polytechnic University. From the long-term monitoring, we found two issues. Firstly, Measuring error, temperature effect and the micro-change of a structure will lead to errors in repeated measurements. However, the tower structure will not suddenly change dramatically, unless damaged, so it can be measured many times to find the average value to reduce this error. Secondly, changes in the mean values of the 2nd, 3rd and 4th natural frequencies before and after the tower legs were raised were 0.7323 Hz, 0.473 Hz and 0.7491 Hz, respectively. Therefore, in practical applications, the average value of the natural frequency is used as the basis for judgment. In practical application, the early warning information is given when the 2nd and 4th natural frequencies change to 0.7 Hz.
Further work will focus on how to identify the specific conditions of ice coating, bending of members, etc. by natural frequencies.
Author Contributions
Conceptualization, L.Z. and X.H.; Methodology, L.Z.; Project administration, L.Z. and X.H.; Software, Y.Z. (Ye Zhang) and Y.T.; Writing – original draft, L.Z.; Writing – review & editing, Y.Z. (Yu Zhao) and Y.T.
Funding
This research was funded by Shaanxi Provincial Education Department, grant number 17JK0322 and by the Xi’an science and technology planning project, grant number 201805030YD8CG14(3).
Conflicts of Interest
The authors declare no conflict of interest.
References
- Huang, X.; Chen, G.; Zhao, L.; Zhu, Y.; Xu, G.; Si, W. Stress simulation and experiment for tower foundation settlement of 110 kV transmission line. Electr. Power Autom. Equip. 2017, 37, 361–370. [Google Scholar]
- Mara, T.; Hong, H.; Lee, C.; Ho, T. Capacity of a transmission tower under downburst wind loading. Struct. Int. J. 2016, 22, 65–87. [Google Scholar] [CrossRef]
- An, L.; Jiang, W.; Liu, Y.; Shi, Q.; Wang, Y.; Liu, S. Experimental Study of Mechanical Behavior of Angles in Transmission Towers under Freezing Temperature. Adv. Steel Constr. 2018, 14, 461–478. [Google Scholar]
- Huang, X.; Zhao, L.; Chen, Z.; Liu, C. An online monitoring technology of tower foundation deformation of transmission lines. Struct. Heal. Monit. Int. J. 2018, 18, 949–962. [Google Scholar] [CrossRef]
- Niu, H.; Li, X.; Zhang, W. Capacity assessment of existing corroded overhead power line structures subjected to synoptic winds. Wind Struct. 2018, 27, 325–336. [Google Scholar]
- Tian, L.; Guo, L.; Ma, R.; Gai, X.; Wang, W. Full-Scale Tests and Numerical Simulations of Failure Mechanism of Power Transmission Towers. Int. J. Struct. Stab. Dyn. 2018, 18, 1850109. [Google Scholar] [CrossRef]
- Fu, X.; Li, H.-N. Uncertainty analysis of the strength capacity and failure path for a transmission tower under a wind load. J. Eng. Ind. Aerodyn. 2018, 173, 147–155. [Google Scholar] [CrossRef]
- Li, X.; Zhang, W.; Niu, H.; Wu, Z.Y. Probabilistic capacity assessment of single circuit transmission tower-line system subjected to strong winds. Eng. Struct. 2018, 175, 517–530. [Google Scholar] [CrossRef]
- Malhara, S.; Vittal, V. Mechanical State Estimation of Overhead Transmission Lines Using Tilt Sensors. IEEE Trans. Power Syst. 2010, 25, 1282–1290. [Google Scholar] [CrossRef]
- Wu, B.; Tong, L.; Chen, Y. Revised Improved DINSAR Algorithm for Monitoring the Inclination Displacement of Top Position of Electric Power Transmission Tower. IEEE Geosci. Sens. Lett. 2018, 15, 877–881. [Google Scholar] [CrossRef]
- You, Y.; Yu, Q.; Guo, L.; Wang, X.; Hu, J.; Qian, J.; Zhang, H. In-situ monitoring the thermal regime of foundation backfill of a power transmission line tower in permafrost regions on the Qinghai–Tibet Plateau. Appl. Eng. 2016, 98, 271–279. [Google Scholar] [CrossRef]
- Ličev, L.; Hendrych, J.; Tomeček, J.; Čajka, R.; Krejsa, M. Monitoring of excessive deformation of steel structure Extra-High Voltage pylons. Period. Polytech. Civ. Eng. 2018, 62, 323–329. [Google Scholar] [CrossRef]
- Moschas, F.; Stiros, S. High accuracy measurement of deflections of an electricity transmission line tower. Eng. Struct. 2014, 80, 418–425. [Google Scholar] [CrossRef]
- Hui, X.; Bian, J.; Zhao, X.; Tan, M. Vision-based autonomous navigation approach for unmanned aerial vehicle transmission-line inspection. Int. J. Adv. Robot. Syst. 2018, 15, 1729881417752821. [Google Scholar] [CrossRef]
- Liu, C.; Dong, R.; Jin, L.; Wu, H. Viewpoint Optimization Method for Flying Robot Inspecting Transmission Towers Based on Point Cloud Model. Chin. J. Electron. 2018, 27, 976–984. [Google Scholar] [CrossRef]
- Lam, H.-F.; Yin, T. Dynamic reduction-based structural damage detection of transmission towers: Practical issues and experimental verification. Eng. Struct. 2011, 33, 1459–1478. [Google Scholar] [CrossRef]
- Cheng, X.; Dong, J.; Han, X.; Fei, Q. Structural health monitoring-oriented finite-element model for a large transmission tower. Int. J. Civ. Eng. 2018, 16, 79–92. [Google Scholar] [CrossRef]
- Chow, H.M.; Lam, H.F.; Yin, T.; Au, S.K. Optimal sensor configuration of a typical transmission tower for the purpose of structural model updating. Struct. Heal. Monit. 2011, 18, 305–320. [Google Scholar] [CrossRef]
© 2019 by the authors. Licensee MDPI, Basel, Switzerland. This article is an open access article distributed under the terms and conditions of the Creative Commons Attribution (CC BY) license (http://creativecommons.org/licenses/by/4.0/).


