1. Introduction
The tourism industry is an indispensable part of the service sector in an economy due to many reasons. Tourism plays a quintessential role in the socio-cultural integration of a country. Whereas domestic tourism encourages intermingling of members of different communities. International tourism leads to better relations with other countries regarding the culture, traditions, and values of tourist destinations. Tourism has enormous potential to create jobs in a country and be a source of national income. Promoting tourism is a multi-faced, ongoing project in which all parts of the government, private businesses and the population have an active role. International organization such as United Nations World Tourism Organization (UNWTO) helps to promote tourism as a way of spurring economic growth and environmental sustainability. Media also plays an important role in providing greater awareness of new tourist destinations. This research paper focuses is on the travel route recommendation system to provide optimal route to tourists for comfortable and convenient traveling experience.
Nowadays, social media such as Facebook, Twitter, or Instagram is a great source of social networking. People travel to new places and share their experiences by posting photos on the internet. This attracts other people to travel worldwide. Travel route recommendation is necessary for tourists to make comfortable and convenient traveling. Recently it has attracted many researchers and engineers to develop a platform that provides travel recommendations for tourists. Recommendation systems play a vital role in our daily lives. Online social networking (OSN) offers new ways to further improve the accuracy of the recommender system (RS). In real life, people seek advice before buying or using services from social networks [
1]. There are many travel route recommendation systems available online such as TripAdvisor, or TripExpert. TripAdvisor is one of the largest travel online sites. It covers the world’s largest selection of famous tourist spots and has tourists’ feedback of more than six million. It covers more than seven million accommodations, airlines, experiences, and restaurants. It helps tourists to decide where and when to go, how to fly, where and what to eat, where to live, and what to do. It allows tourists to get the most out of every trip. Tourists can give reviews and a five-star rating system on every trip which is useful for other tourists before planning to visit any place.
The amount of information and the number of users available on the world wide web has grown tremendously over the last decade [
2,
3]. GPS-enabled devices, such as GPS phones, use the location as a context to change the way people interact with the network. These devices allow users to retrieve their current location, search for nearby location, and design travel routes to destinations. By uploading GPS logs to the community, individuals can visualize and manage GPS tracks on a web map. By sharing these GPS protocols with each other, you can also view the experiences of others. For example, you can find places that attract people from a person’s itinerary, so you can plan a fun and effective journey based on the experiences of many users. With the advent of GPS-enabled devices, a large number of GPS trajectories have accumulated in these online communities. However, in almost all applications, raw GPS data is used directly, For example, coordinates and timestamps. So far, these communities have not been able to provide people with interesting information about geographic locations. When the community encounters these large data sets, users will not be able to see every GPS track.
Recently, many techniques have been extensively researched to automatically recommend or find custom information. The personalized recommender system uses automatic information, filtering methods to recommend the preferred elements of the users [
4,
5]. Recommender systems represent user preferences for the purpose of suggesting items to purchase or examine [
6,
7,
8]. Location-based services are becoming increasingly popular due to affordable mobile devices and ubiquitous Internet access. Websites like Foursquare, Gowalla2, Google Latitude, and Facebook show that people want to share their location information anytime, anywhere, and give accurate location suggestions. As a location data exchange, users can now associate products, locations, events, or community relationships and groups.
There are some hurdles that are faced by tourists. This will affect the national economy and the growth of the tourism industry. The tourists may experience problems relating to various factors such as convenient route, guidance, and searching popular locations. Tourists have difficulty finding the places of their interest and economic. As a foreigner in Jeju, South Korea, I always had difficulty finding places and traveling via bus or taxi. Due to the language barrier, I could not reach the destination on time. Hence there was a waste of time and money as well. For senior citizens, it is not easy to travel without proper guide or recommendation. This lead us to design and develop optimal route recommendation system based on user preferences i.e., time, distance, and popularity of location for convenient traveling. Besides these factors, we have also considered weather conditions and the traffic situation for optimal route recommendation. The main objective of this paper is to provide an optimal route to tourists based on their preferences such as time, distance, popularity of location for comfortable and convenient traveling experience. Data collection and analysis is important for a country to make public policies and development of the global travel and tourism industry. Real-time big data is collected from Wi-Fi routers installed at popular locations in Jeju Island, South Korea. This dataset consists of thousands of mobile tourists in the year 2016–2017. The dataset includes tourists movement pattern. Tourist movements assist tourism planner in managing tourism attraction and destination planning. In this research article, we have collected user preferences and based on those preferences, an optimal route is recommended to the tourist. User preferences can change due to many reasons. User preferences can vary over time for example tourists like to visit beaches in summer as compared to winter season [
9]. Weather also effects user preferences, for example, tourists normally like to visit beaches on a sunny day. User preferences also vary person to person. Some tourists like to visit theme parks but some like to visit museums. Age is also one of the main factors because children like to visit parks and elder people will like to go to ancient historical sites. The proposed system also considers age and gender before recommending the optimal route to a tourist.
The aim of this paper is to provide an optimal route and for this purpose we have formulated an objective function. In the objective function, weights are assigned to the factors based on user preferences. Priority is given to the user preferences for example if a user wants to visit a location that is nearby, then nearby locations will be given high weights. Similarly, if the weather is rainy, then weighting for out-door locations, such as beaches and seasides, are low compared to indoor locations such as museums and art centers. If there is a traffic jam from source to destination, it will find alternative routes and give weighting to locations based on time, distance, and popularity of location. The proposed system recommends the optimal route to avoid traffic jams and rush hour for the convenience of tourist.
The rest of the paper is organized as follows.
Section 2 describes the study object of this research paper. In
Section 3, the related work is described briefly. Existing research work in the relevant field is highlighted.
Section 4 presents the proposed architecture of the recommendation system. In
Section 5, different methodologies and their pros and cons are explained in detail.
Section 6 includes implementation and testing environment.
Section 7 presents the results achieved during experiment.
Section 8 presents discussions. Finally, the paper is concluded in
Section 9 with an outlook on our future work.
2. Jeju Island, a Tourists Hub
Tourism is one of the most important research areas in terms of local revitalization around the globe, especially in developed countries like South Korea. Jeju Island is one of the most famous tourist destination in East Asia. Jeju Island has an area of 1845.55 km
and a population of 660,000 approximately. About 15 million tourists visit Jeju Island every year. The United Nations Educational, Scientific, and Cultural Organization has been closely engaged with different governments to conserve natural and cultural resources that are of global significance such as global geoparks, world heritage sites, and biosphere reserves. Jeju Island in South Korea is the only site in the world to be listed as a biosphere reserve (2004), Ramsar wetlands (2015), world natural heritage site (2007), and Global Geopark (2011) [
10]. The self-governing Jeju province government has been extensively promoting these three major designations. Jeju was also voted as one of the New Seven Wonders of Nature in 2011. This makes Jeju Island a unique place for local and international visitors. Jeju Island has been popular with tourists for decades because of its worldwide reputation, and the travel trend is expected to increase the influx of foreign tourists. Overall, the number of visitors increased, with the exception of respiratory syndrome in the Middle East (2015) [
11].
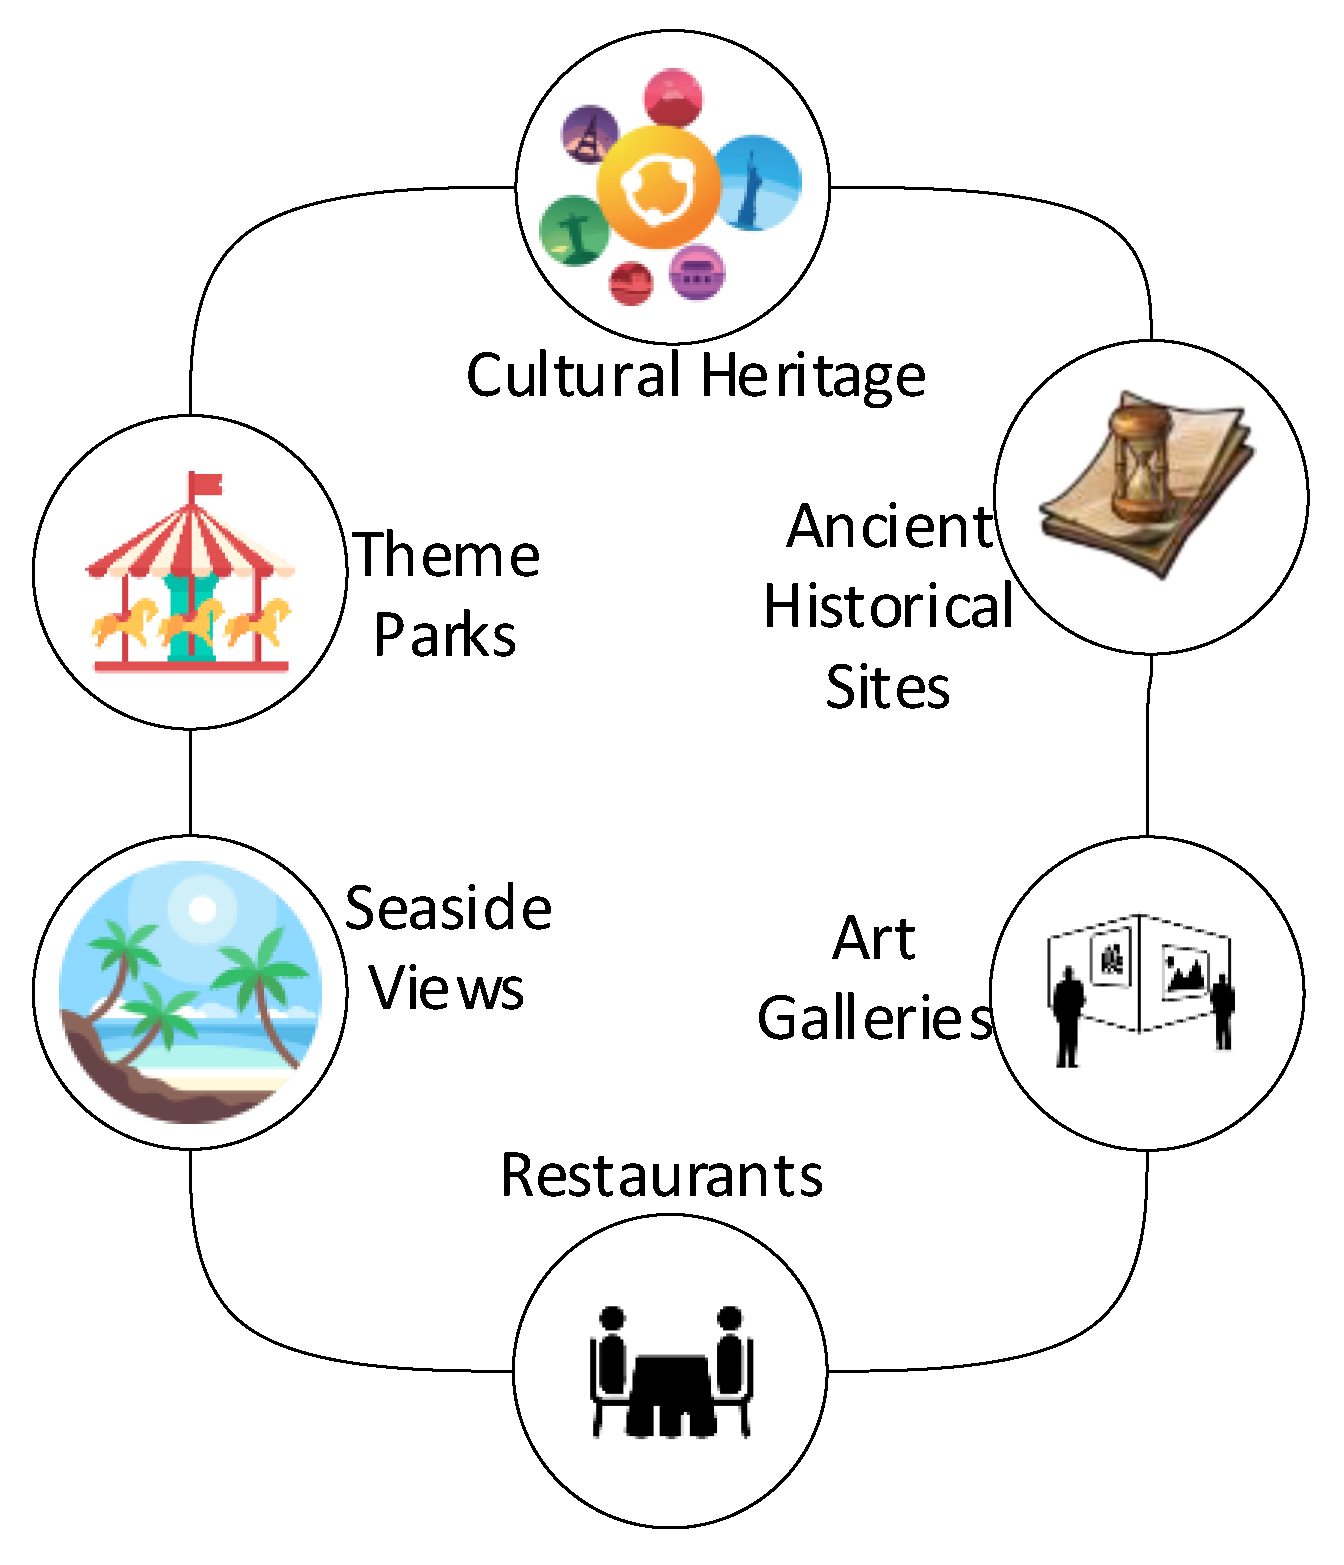
The tourism inventory includes two types of tourism resources i.e., tourism attractions and infrastructure or tourism support services. Tourism attractions include physical geographic features like rivers, forests, lakes. Tourism attraction may also include special events like sports event, seasonal festivals. Recreational facilities like riverboat gambling, hiking tracks are also a source of tourist attractions. Tourist support services include food restaurants, hotel accommodations, and transportation. We have considered both types of tourism resources and have divided famous tourist locations into six major categories i.e., cultural heritage, ancient historical sites, art galleries, restaurants, seaside views, and theme parks as shown in
Figure 1.
A tourist attraction is a place of interest where tourists visit, typically for its inherent or an exhibited natural or cultural value, historical significance, natural or built beauty, offering leisure and amusement. There are different types of tourist attractions such as traditional tourist attractions and cultural tourist attractions. Natural beauty locations include mountains, deserts, beaches, forests. Cultural tourist attractions include historical locations such as temples, museums, and monuments.
Table 1 shows some popular tourists attractions in Jeju Island, South Korea.
The tourism industry is very actively introducing new technologies. Recent developments in communications, databases, networking, data processing, and e-marketing opened up many new opportunities for tourism, which have a major impact on tourism growth. The use of information and communication technologies increases the value of tourism services and products and contributes to the development of industrial networks. Information and communication technologies (ICT) cover the entire travel value chains such as accommodation, information on destination, transportation, package tours and services [
12]. The main area of change in innovation in the field of tourism is the use of ICT. The spread of ICT in the tourism industry allows consumers to interact directly with tour operators [
13]. One major innovation in the tourism industry is electronic tourism commonly known as e-tourism. E-tourism’s main role is to provide services to the tourists online such as hotels, transportation, accommodation. There are many organizations that provide e-tourism facilities in Jeju such as the ‘Jeju Tourism Organization’, or ‘Visit Jeju’.
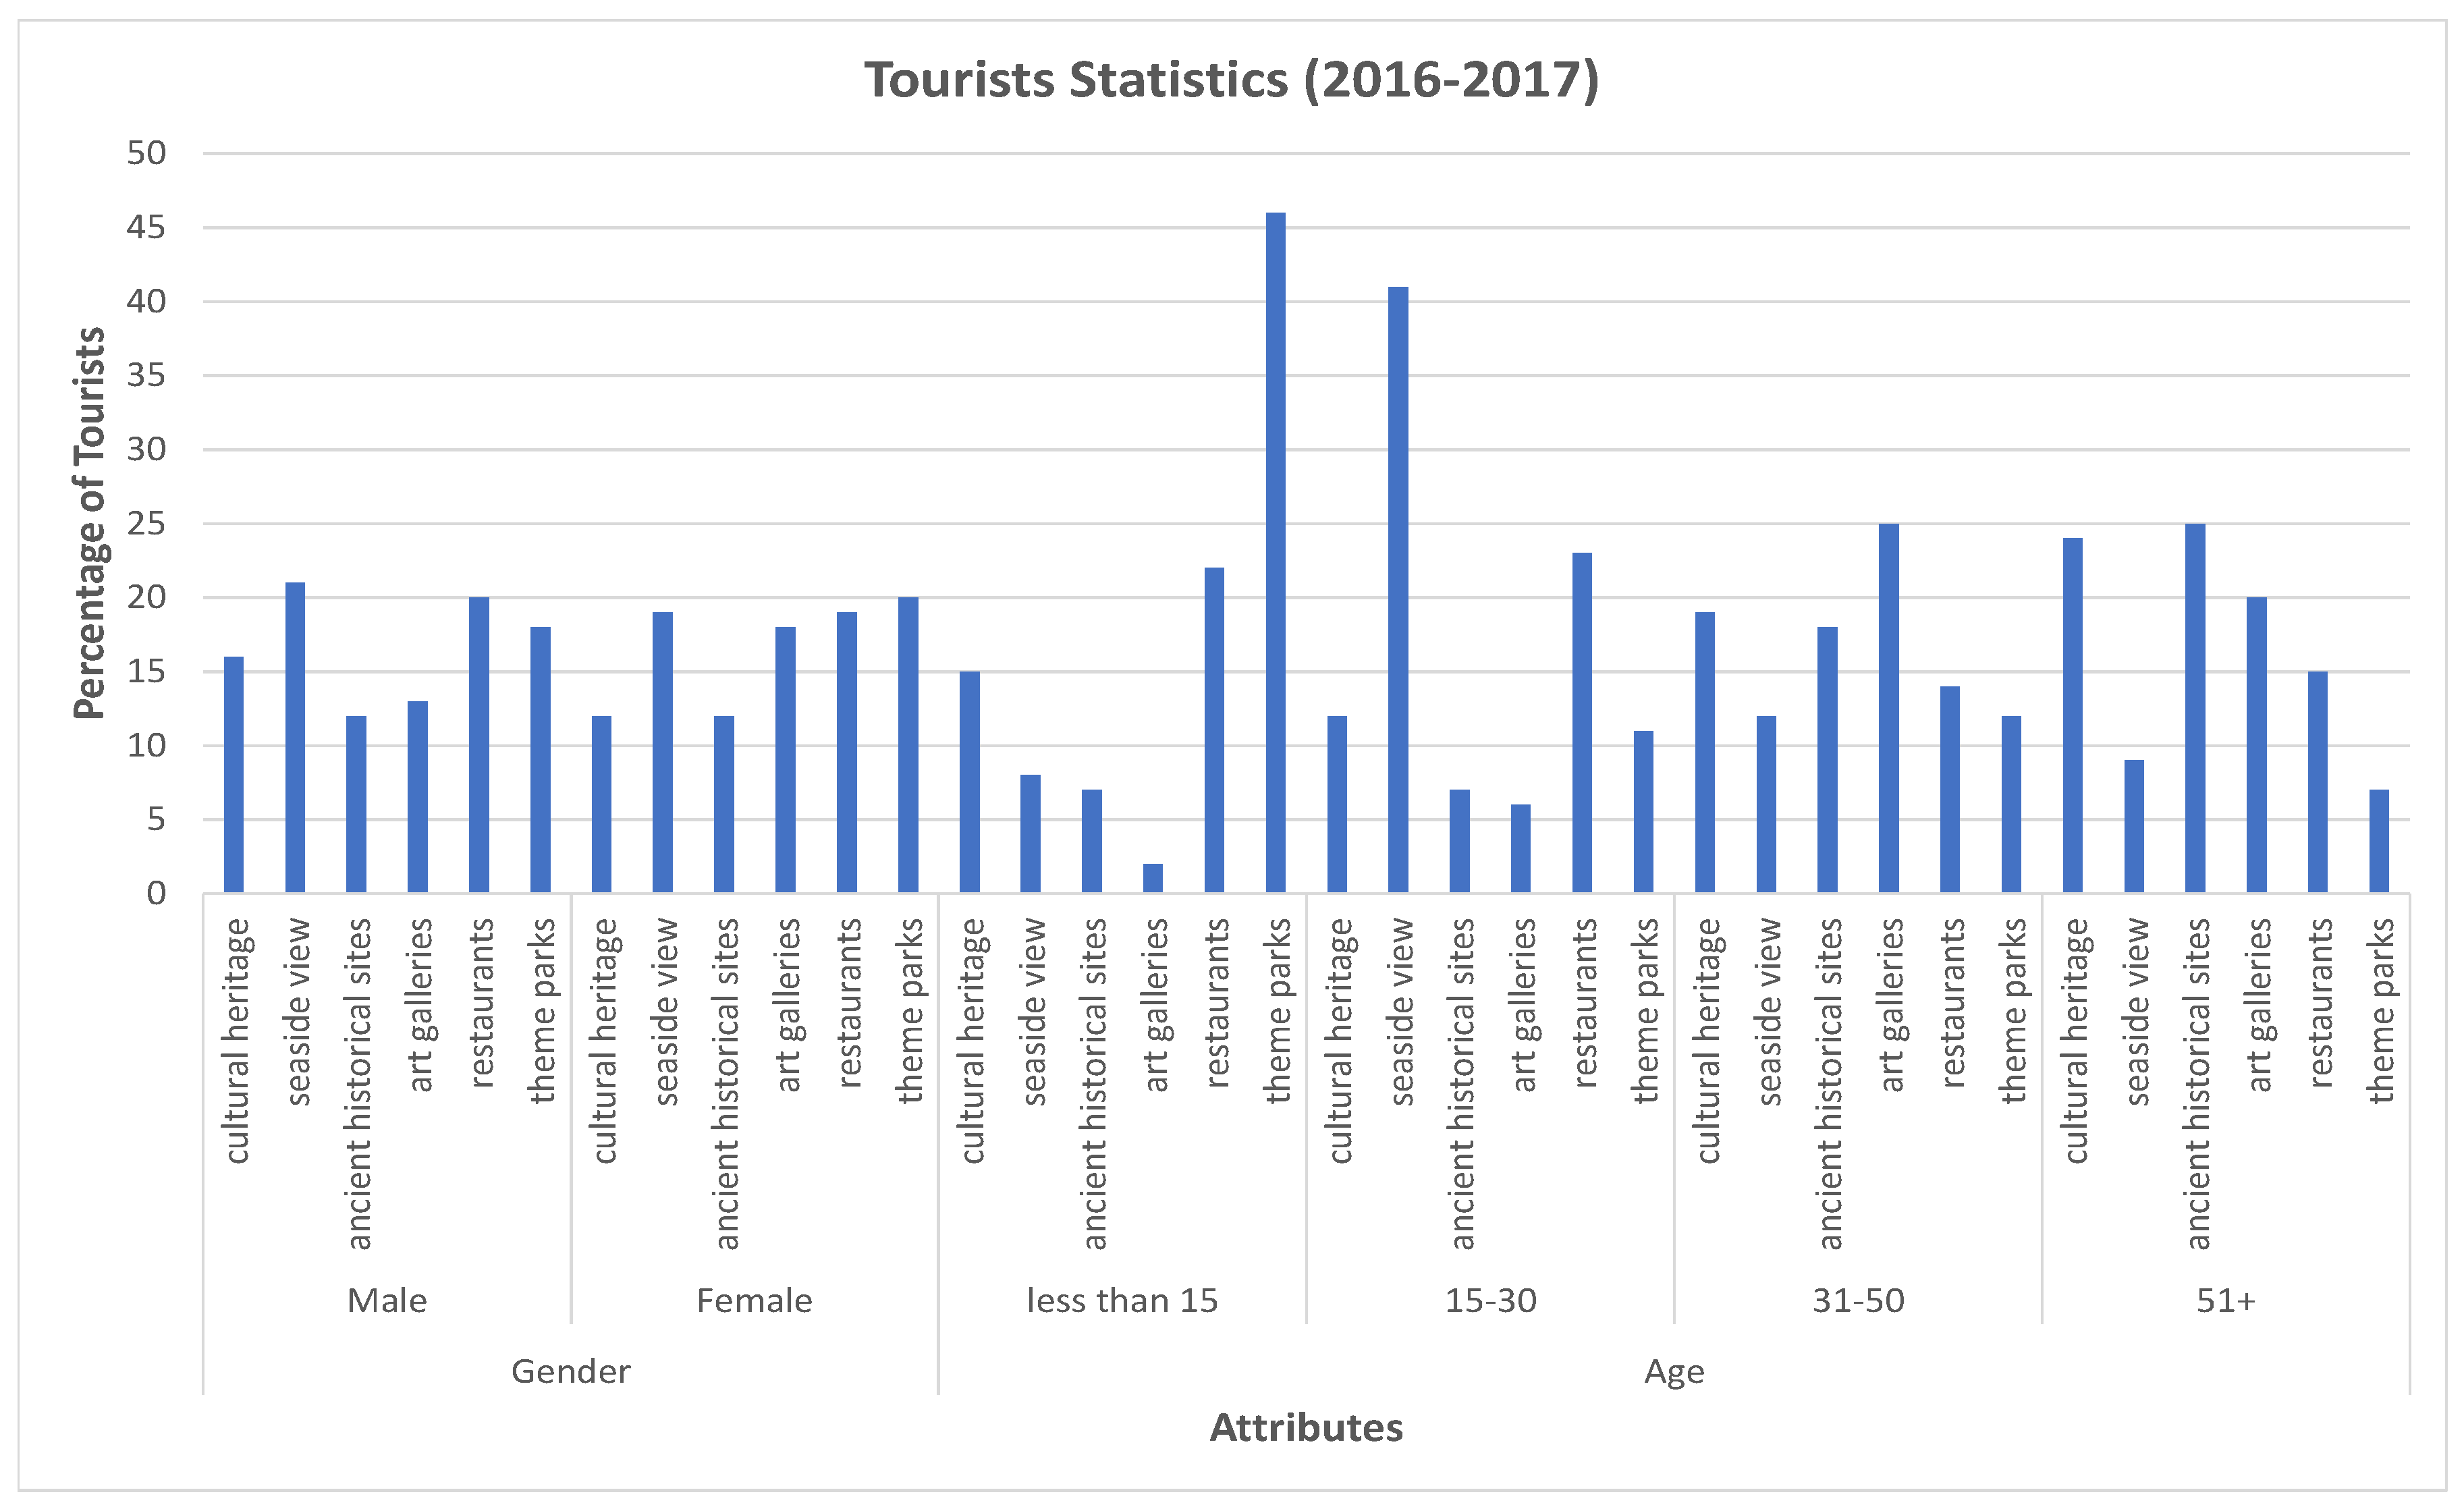
Figure 2 represents the percentage of tourists visiting the mentioned categories with respect to attributes. We have defined six major categories of locations, i.e., cultural heritage, ancient historical sites, art galleries, restaurants, seaside views, and theme parks. We have defined two attributes, i.e., age and gender. We have calculated the percentage of tourists visiting the locations based on two years worth of data (2016–2017). In
Figure 2, if we look at the statistics gender wise, we can see that 22% of the males has visited seaside locations. It is the maximum percentage of males visiting location among six categories. Similarly, 21% of females visited theme parks and 20% of females visited seaside locations. If we look at the graph age wise, we can see that 44% children of less than 15 years of age visited theme parks. Of tourists between the ages of 15 and 30, 40% of them visited seaside views, while 26% of tourists between the age of 31 and 50 visited art galleries, and 25% of tourists older than 51 visited ancient historical sites.
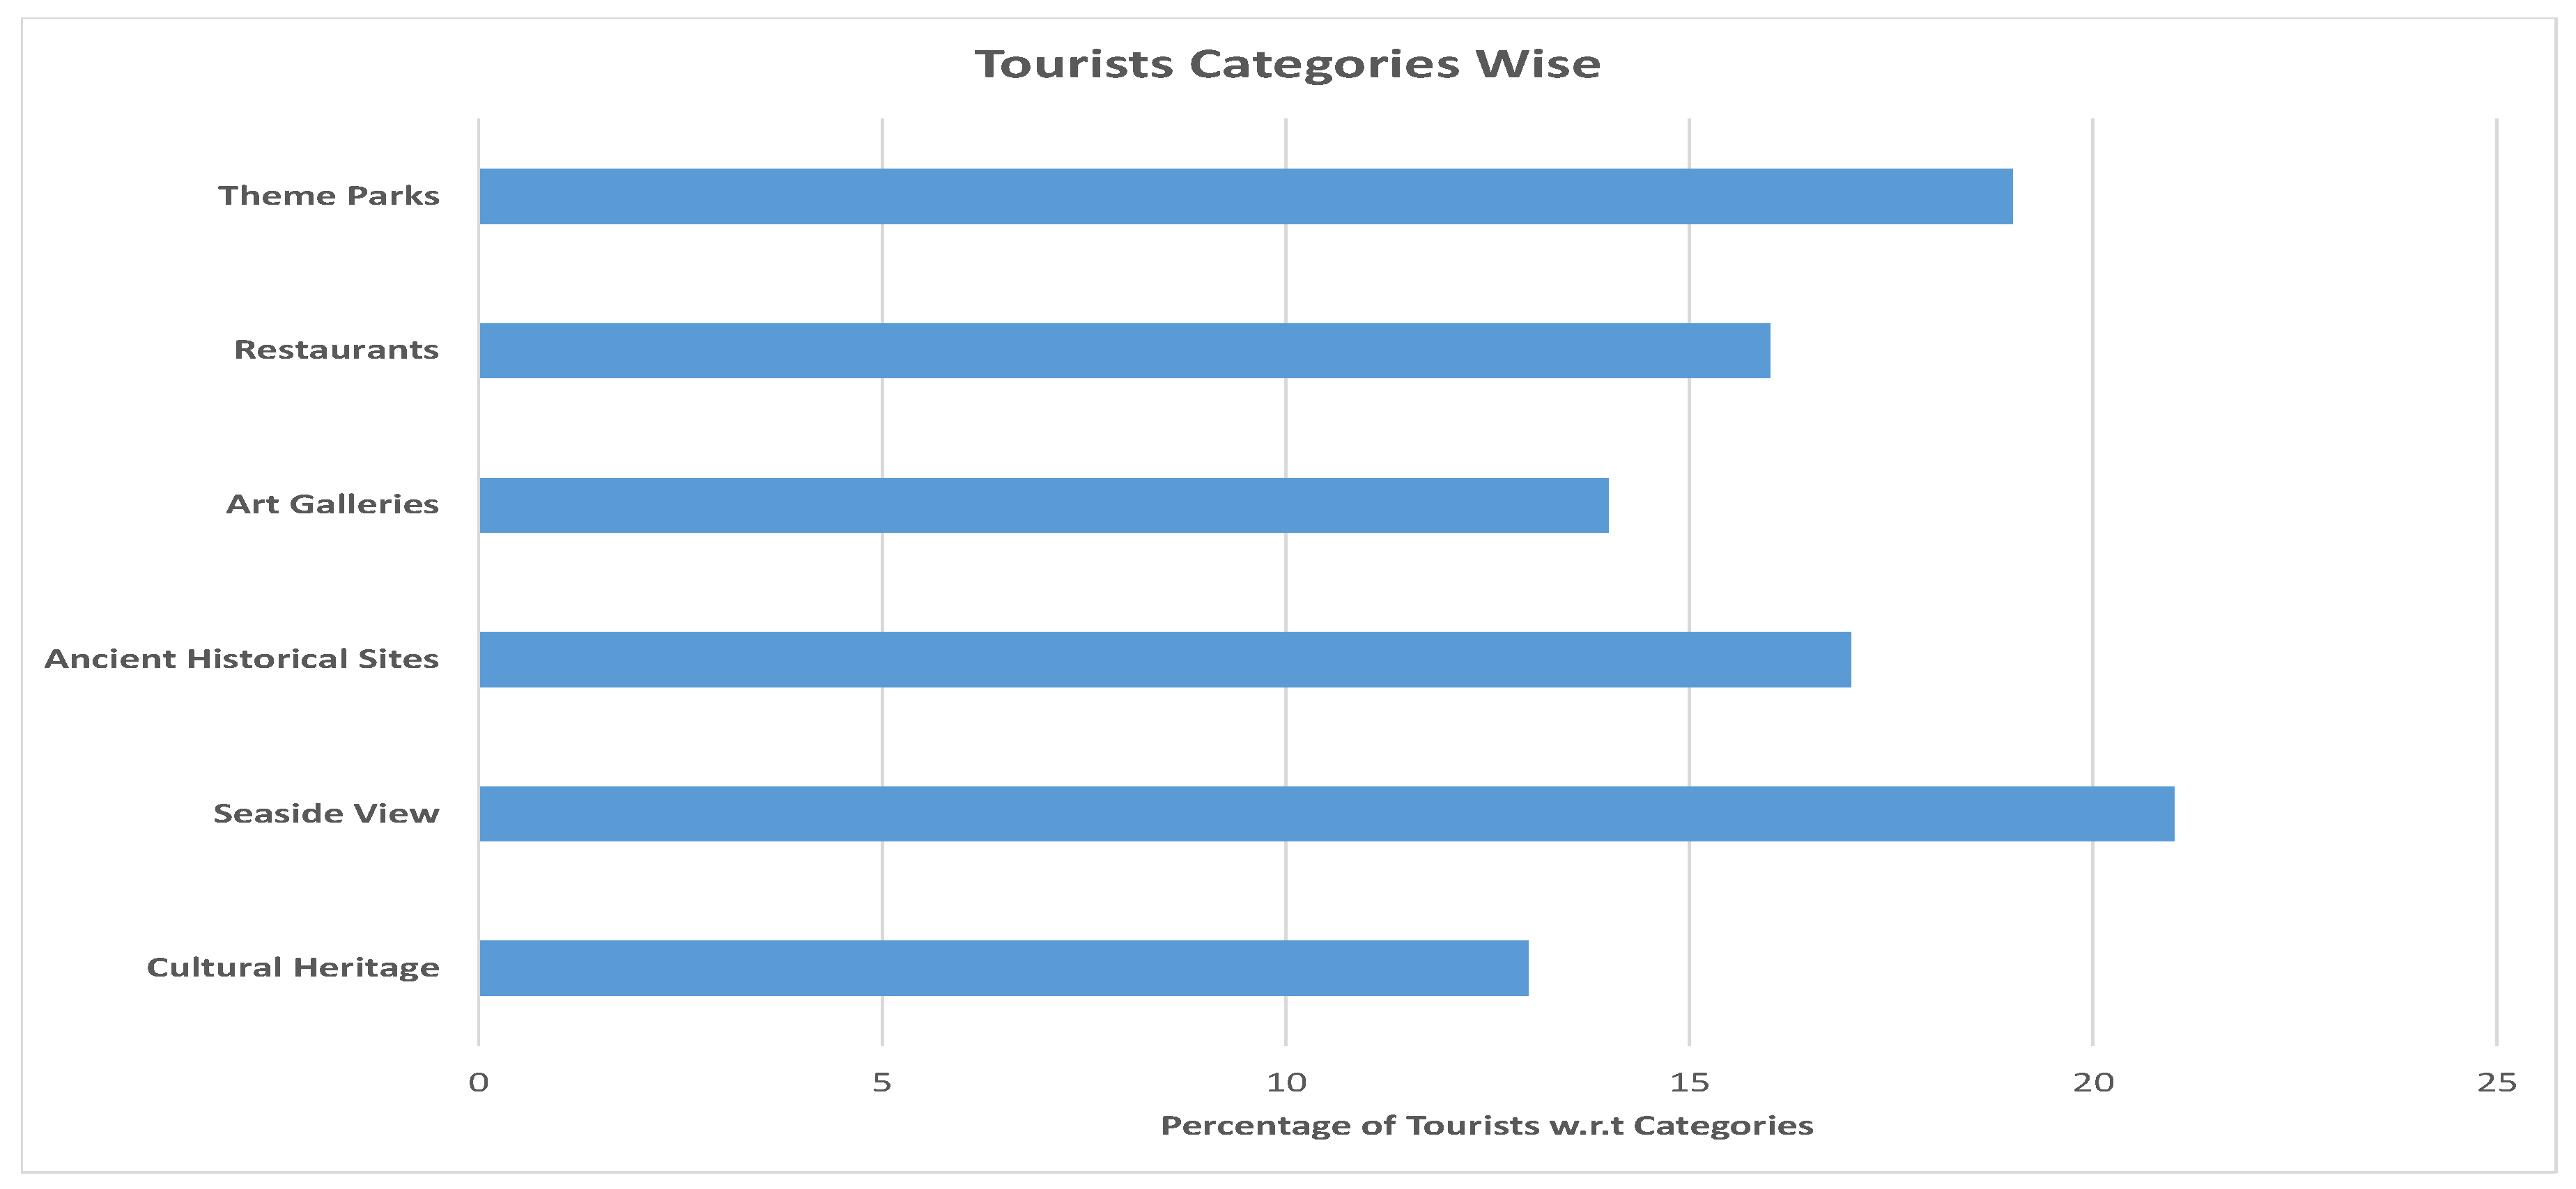
Figure 3 represents the percentage of tourists visiting the locations in the mentioned categories. This graph shows the statistics of tourists visiting Jeju Island, Korea in the year 2016–2017. From this graph, we can see that the most popular category is seaside view; 22% of the tourists visited seaside views. Meanwhile, 19% of the tourists visited theme parks, 16% of the tourists visited restaurants, 17% of the tourists visited ancient historical sites, 14% of the tourists visited art galleries, and 13% of the tourists visited cultural heritage locations.
Jeju is a self-governing province of South Korea. There are some administrative issues and challenges for the government due to over-tourism. Over the past decade, the island has turned into Korea’s tourism hub with many luxury hotels and resorts, thanks to an increasing number of visitors from overseas and other parts of the country. Every year, 15 million tourists visit Jeju Island. It is estimated that the number of tourists will reach to 45 million by 2035. It is a big challenge for the government in Jeju. Over-tourism is defined as the excessive growth of tourists that leads to overcrowding in areas where residents suffer the consequences of temporary and seasonal tourism peaks, which have enforced permanent changes to their lifestyles, and access to amenities. The tourism industry damages beaches, landscapes, putting infrastructure under enormous strain, and pricing residents out of the property market. It is a hugely complex issue that is often oversimplified.
3. Literature Review
The tourism market has reached a mature stage and will no longer experience rapid growth in new developments. Providing an individual daily itinerary for tourists is important for improving the travel experience. This is an important step for travel managers in increasingly competitive markets [
14]. The behavior of post-modern tourists has undergone major changes, and visitors prefer personalized travel, ready-made travel packages or general travel packages. However, personal travel plans are a time-consuming and complex process of choosing tourist attractions and booking travel. These issues are highlighted as ‘tourist trip design problem’ (TTDP). These issues are solved to plan trips for tourists so that they can maximize their entertainment while considering various constraints [
15].
China’s National Tourism Administration (CNTA) said China will try to achieve the goal of “smart tourism” in the next decade. This is intended to alleviate the enormous pressure of popular tourist routes during the Chinese holiday so that people can get a better travel experience. They provide a static introduction to the sights that are no longer connected, usually between the fascinating sights. When choosing a destination, travelers must search, navigate and organize itineraries to get travel information before creating a travel plan. Of course, this requires a lot of time and is not the easiest way to achieve the desired goals. Some platforms may offer a route for visitors. These are itineraries for travel agents, but they are usually not contacted by travel agents [
16].
In recent years, due to the rapid development of the economy and the development of modern society, more and more people are hoping to travel on vacation, and new models of consumption diversification in tourism are becoming increasingly popular. Due to economic development and national income, the demand for tourism has increased significantly. On the other hand, due to the popularity of web technologies, the internet was used to request information before leaving. Unfortunately, the collection of useful information from the Internet is very difficult. However, the tourism industry is facing intense competition. How to effectively combine tourism resources and improve the level of services is very important. Tourists do not have enough information to select the correct route. Based on the above analysis, it is important to develop an intelligent route system [
17].
As the quality of life has improved, tourism has become a new way of life. Tourist’s demand is diversified. Traditional travel models do not meet the needs of modern tourists. More and more tourists are looking for experience and satisfaction on the road. To improve your journey, visitors plan their route before heading to an unfamiliar scenic city. Travelers sort their itineraries, looking for travel schedules, personal travel blogs, or friends’ data because of their preference and time and money restrictions. Planning a trip itinerary is a time-consuming task. It is hard to find places worth visiting and finding out your route. Therefore, the tourists planning model is used to build high-quality tourist routes. Tour Route Planning Problem (TRPP) is used to maximize tourism experience and build high-quality tourist routes [
18].
Millions of users use social networking services such as Facebook and Twitter. The wealth of knowledge of these social networking sites offers a variety of recommendation systems for new friends and the media. Location-based social networks (LBSNs) such as Foursquare, Facebook Places, and Yelp are popular due to the explosive growth of smart phones. The dramatic growth of smart phones has fueled the booming online LBSN system. Through LBSN, users can find friends and share information. To improve the user experience on the LBSN, a point of interest (POI) suggestion has been proposed that allows the user to access the new location in the registration record and establish the social relationship of the user.
Travel planning is often a difficult and time-consuming task for visitors visiting unknown destinations. Many visitors can view and access travel information online at any time. In addition, they can organize their own travel routes using computers and smart phones. Therefore, it is very important to develop a decision support system for the itinerary [
19]. The most important topic in the design of the tourist route is the consideration of the total travel costs, the shortest distance and the landscape resources. In surveys, visitors are most concerned about the time spent traveling and the charm of the resources that normally meet their needs. To find points and features, this article [
20] uses two phases of thought. First, all features of the points are filtered according to the characteristics of the tourist route. Then the cities of these attractions are statistically classified.
In recent years, the use of recommendation systems in the field of technical improvement learning (TEL) has also aroused interest. This interest is reflected in the specific themes of the seminar and the specific topics of social information retrieval. Google and other search engines earn more revenue by indexing most information available on the internet, but learning is less accurate [
21]. Flickr collects multiple geo-tags to create recommendations that can predict the relative location of individual users. On Flickr, the placemark is a tuple of latitude and longitude that indicates the exact location where the user took the photo. Geo-tagging can be done manually by placing a photo on the map. If the global positioning system (GPS) module is installed, you can automatically register on the device. Collective knowledge expressed in these geo-tag labels can be used to assess similarities between location and that personalized location recommendations can be derived from the similarity model [
22].
The current recommendation system requires further enhancements to make the referral method more effective and broader [
23]. You can apply it to a wider range of real-world applications, including vacation, investor-specific types of financial services, and products recommended for purchase in stores [
24]. These enhancements include better ways to represent user behavior and proposed information, as well as advanced recommendation modeling a methodology that incorporates various contextual information into the referral process, uses multi-criteria assessments and develops a more intrusive and flexible referral method that is more effective based on the performance of the referral system [
25,
26].
4. Proposed Architecture
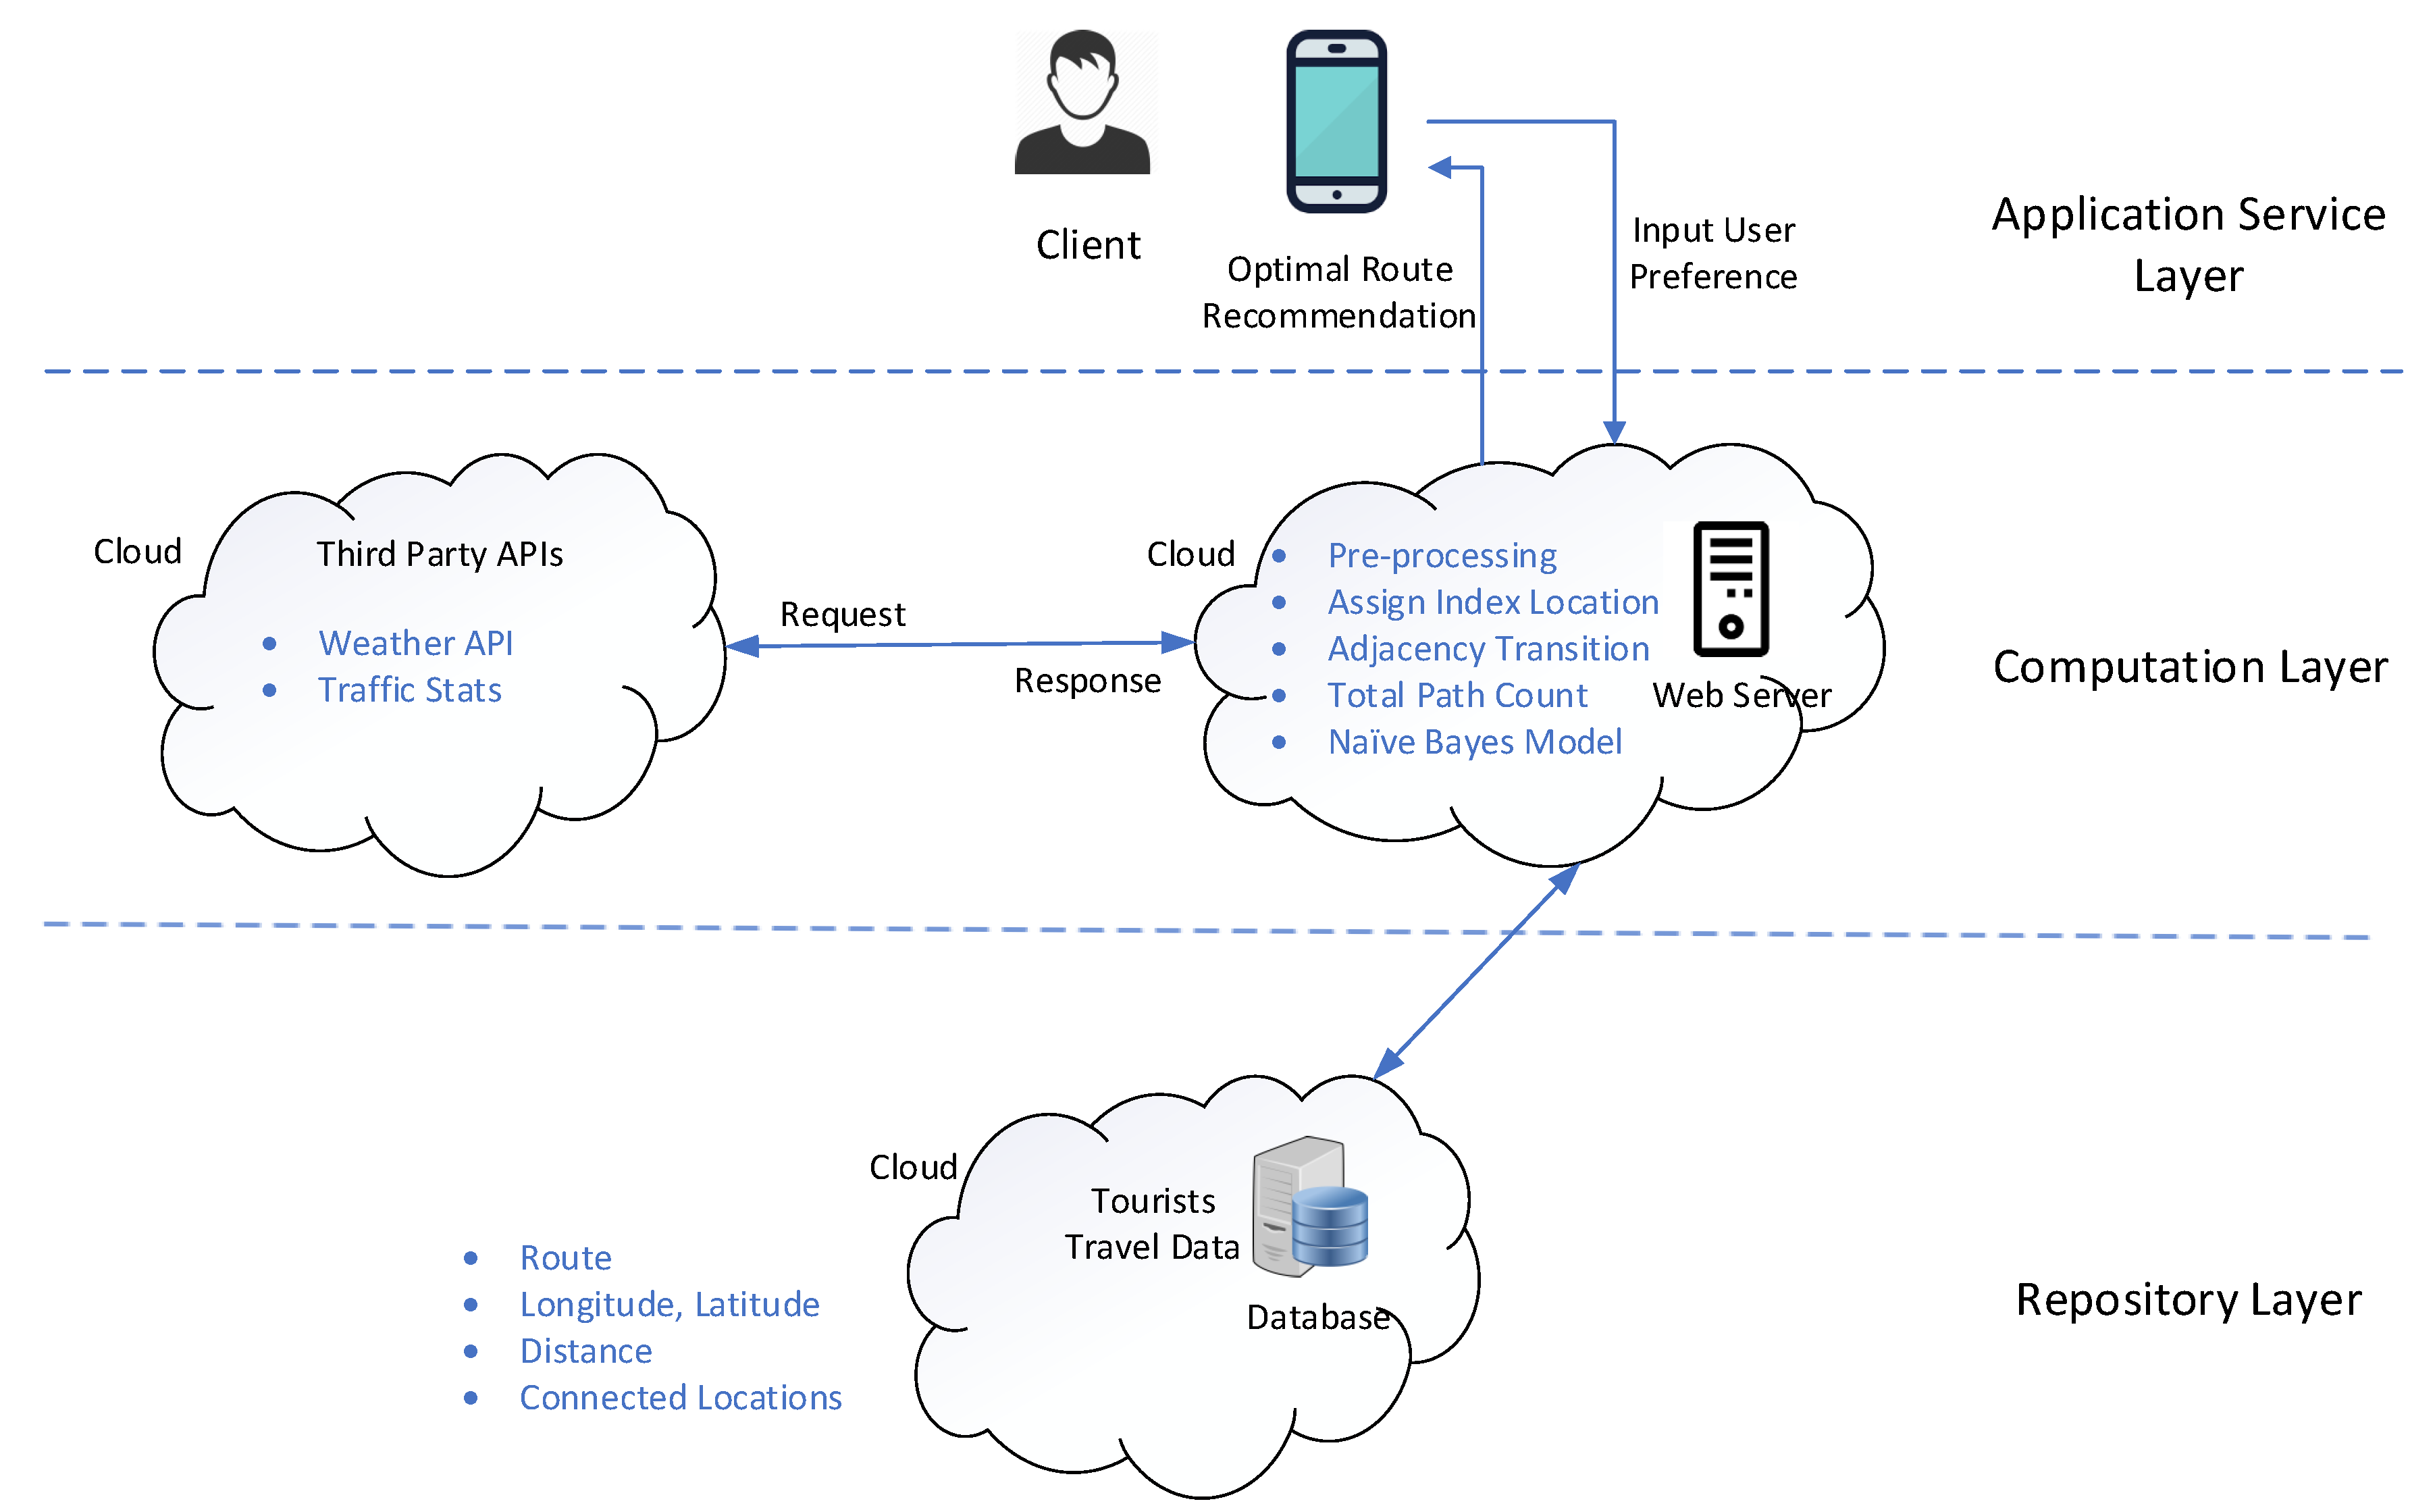
Figure 4 represents the proposed architecture of the system. In this figure, there are three layers, i.e., the repository layer, computational layer, and application service layer. The repository layer consists of the tourists data visiting Jeju Island, Korea in the year 2016–2017, collected from Wi-Fi routers. We have used MySql as database to store the data. Data includes the route of tourists visited to locations. It consists of the location’s longitude and latitude. We have used third-party APIs to find the longitude and latitude of the location by passing the name (string) of the location. We have also used third-party APIs to calculate the distance between locations. We have created adjacency matrix by using Pandas library in python to find out the connected locations. We have stored the adjacency matrix in excel sheet. The data set is of tourists visiting famous spots in Jeju Island, Korea. In
Figure 2, we can see that route is the input. First we preprocess the data and extract features. We extract unique locations and assign them index. We count the total number of visits on each location to find the probability. We also find the latitude and longitude of each location to find the distance between locations. Adjacency matrix is connected nodes from the data.
In the application service layer, the tourists input user preference. User preference is based on cost of the location, age, and gender. There are some locations that are free to visit like beaches, cultural heritage. There are some locations that cost ticket to enter and visit, e.g., Hanwha aqua planet. Tourists preference is taken into consideration before suggesting optimal route. Age is also taken into consideration as children like to visit, e.g., theme parks and adults like to visit, e.g., seaside views and ancient historical sites. Gender is also taken into consideration as statistics show that females are more likely to visit restaurants, and theme parks whereas males are more likely to visit seaside views, and cultural heritage.
The computation layer consists of all the processing of the data on the cloud. We have availed Amazon web services (AWS) for processing and computation of big data. We have used the Amazon Elastic Compute Cloud (Amazon EC2) for this purpose. In the computation layer, we pre-processed the data. Pre-processing includes spliting of actual route from the data and extracting the unique locations. There are 149 unique locations extracted from the dataset. We assigned unique number to each location. We have calculated the popularity of the location based on total path count from the data set. We are using third-party APIs to calculate distance between locations. First we find latitude and longitude of the locations, then on the basis of longitude and langitude, we calculate the distance between locations and save it in the distance matrix. We used the Pandas library to create distance matrix. We are using third-party API to check weather. We used OpenWeatherMap API to find out the weather and recommend optimal route based on weather. Weather is an important factor to suggest optimal route. Tourists are unable to enjoy on beaches if it is raining. So if the weather is rainy, it is possible to recommend indoor location like aqua planet. We have used TomTom traffic stats to analyze the traffic status. If the traffic is jam, the proposed recommendation system is able to suggest alternative route to avoid rush. It may cover more distance but it is convenient for the tourist.
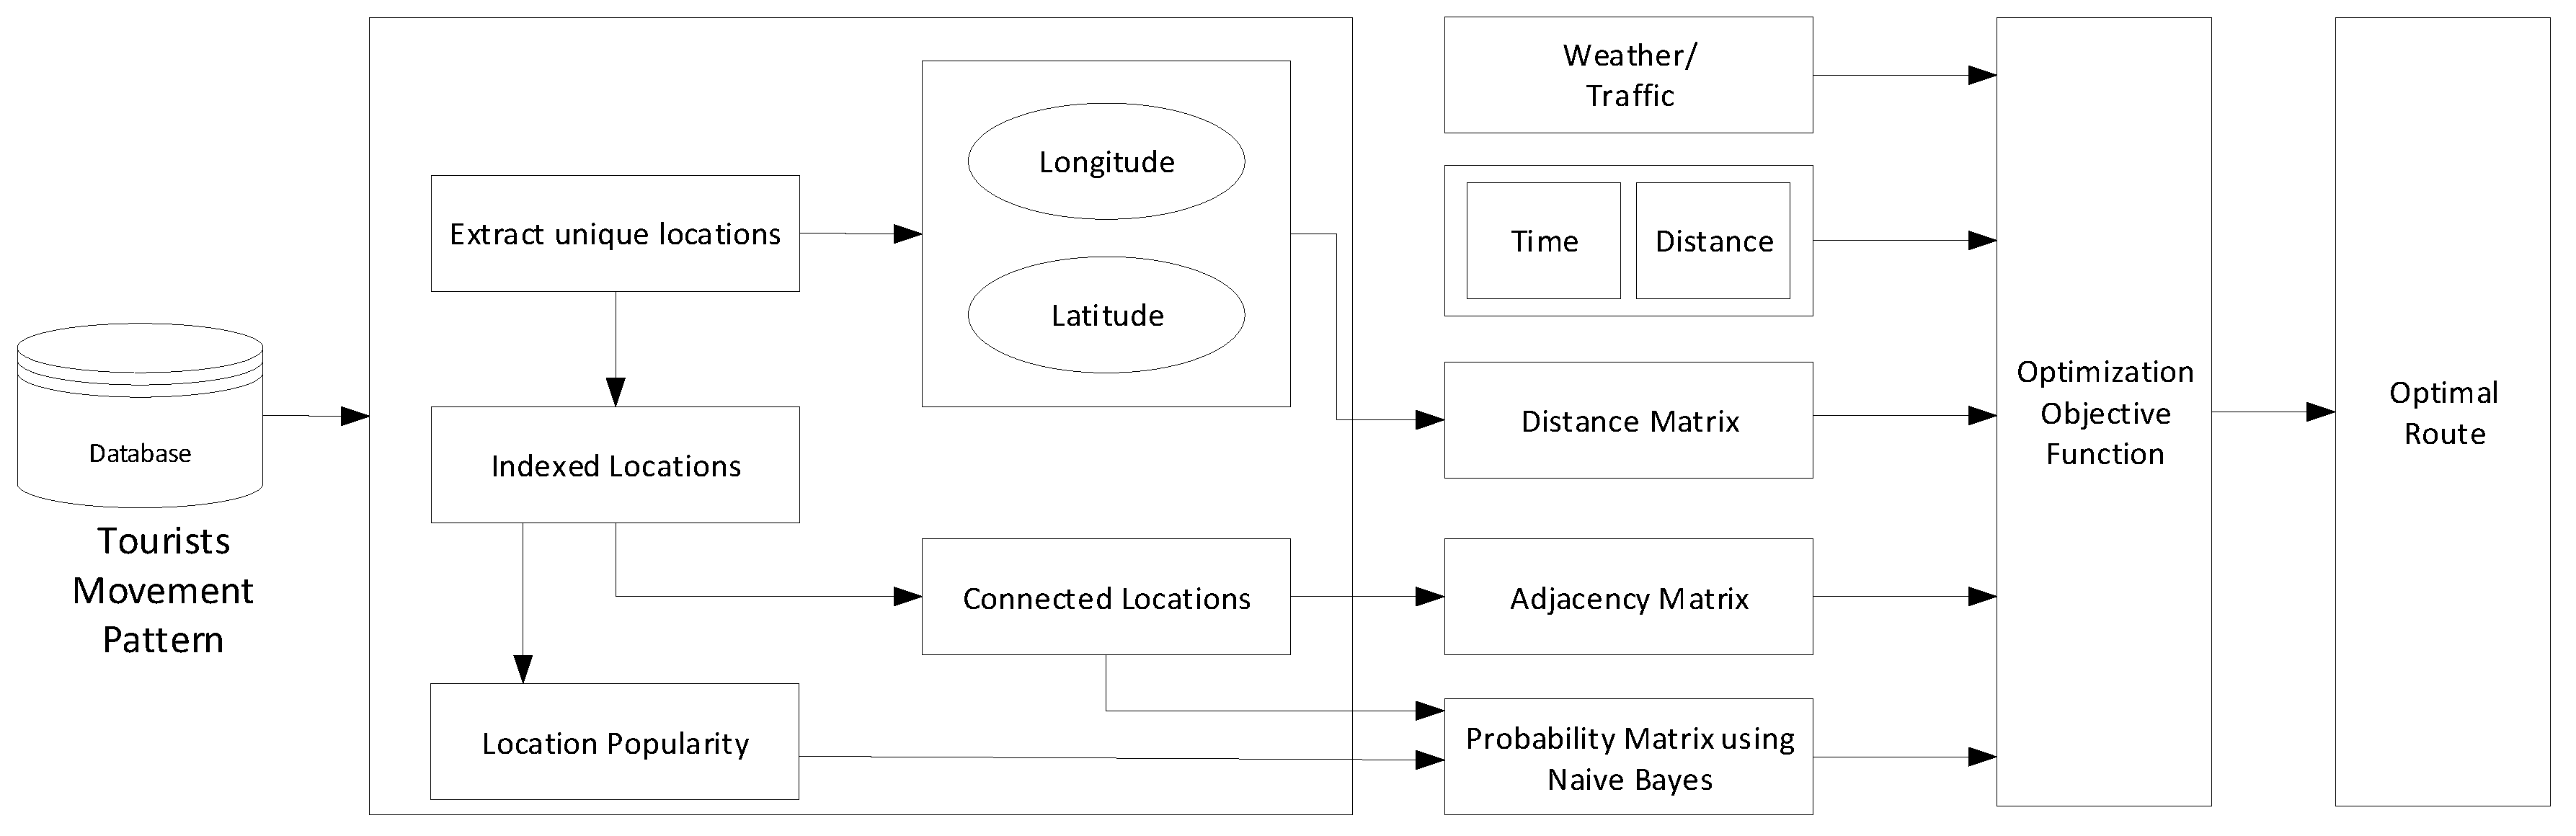
Figure 5 presents detailed system flow diagram of the proposed system. In this diagram, we have a database which contains real time data of tourists who visited Jeju Island, Korea in the year 2016–2017. This data is collected from Wi-Fi routers. We have used a MySql database to store big data. We have used AWS for analysis and computation of big data. In the first step, unique locations are identified from the dataset. After identification of unique locations, those locations are indexed. By using third-part APIs, we find longitude and latitude of the location. Then we find location popularity based on the total path count of that particular location. Next we find the connected locations in the dataset. Connected locations means, if the user has visited from one particular location to another location from the set of unique locations.
In the next phase, we find out the distance between locations. We used the Pandas library to store distance matrix. Connected locations are convertd into an adjacency matrix using the Pandas library. If the value is 1, it means that a user has visited from one location to another. If the value is 0, it means tourist has not visited from that location to destination. We calculate probability matrix on the basis of data set. We used the naïve Bayes model to find out the probability of the tourist likely to visit the next location. There are three options for the user to select, i.e., time, distance, and popularity. The difference between the time and distance options is that if user only selects time, then the optimal route is recommended on the basis of less time and if user selects distance, then the optimal route is recommended on the basis of weather and traffic condition as it can recommend alternative routes for tourist convenient that may cover more distance.
In the end, all these values are passed to the optimization objective function. Each parameter has its corresponding weights. On the basis of the optimization objective function, the optimal route is recommended to the tourist. The optimal route may vary on the basis of user preference, weather, and traffic condition.
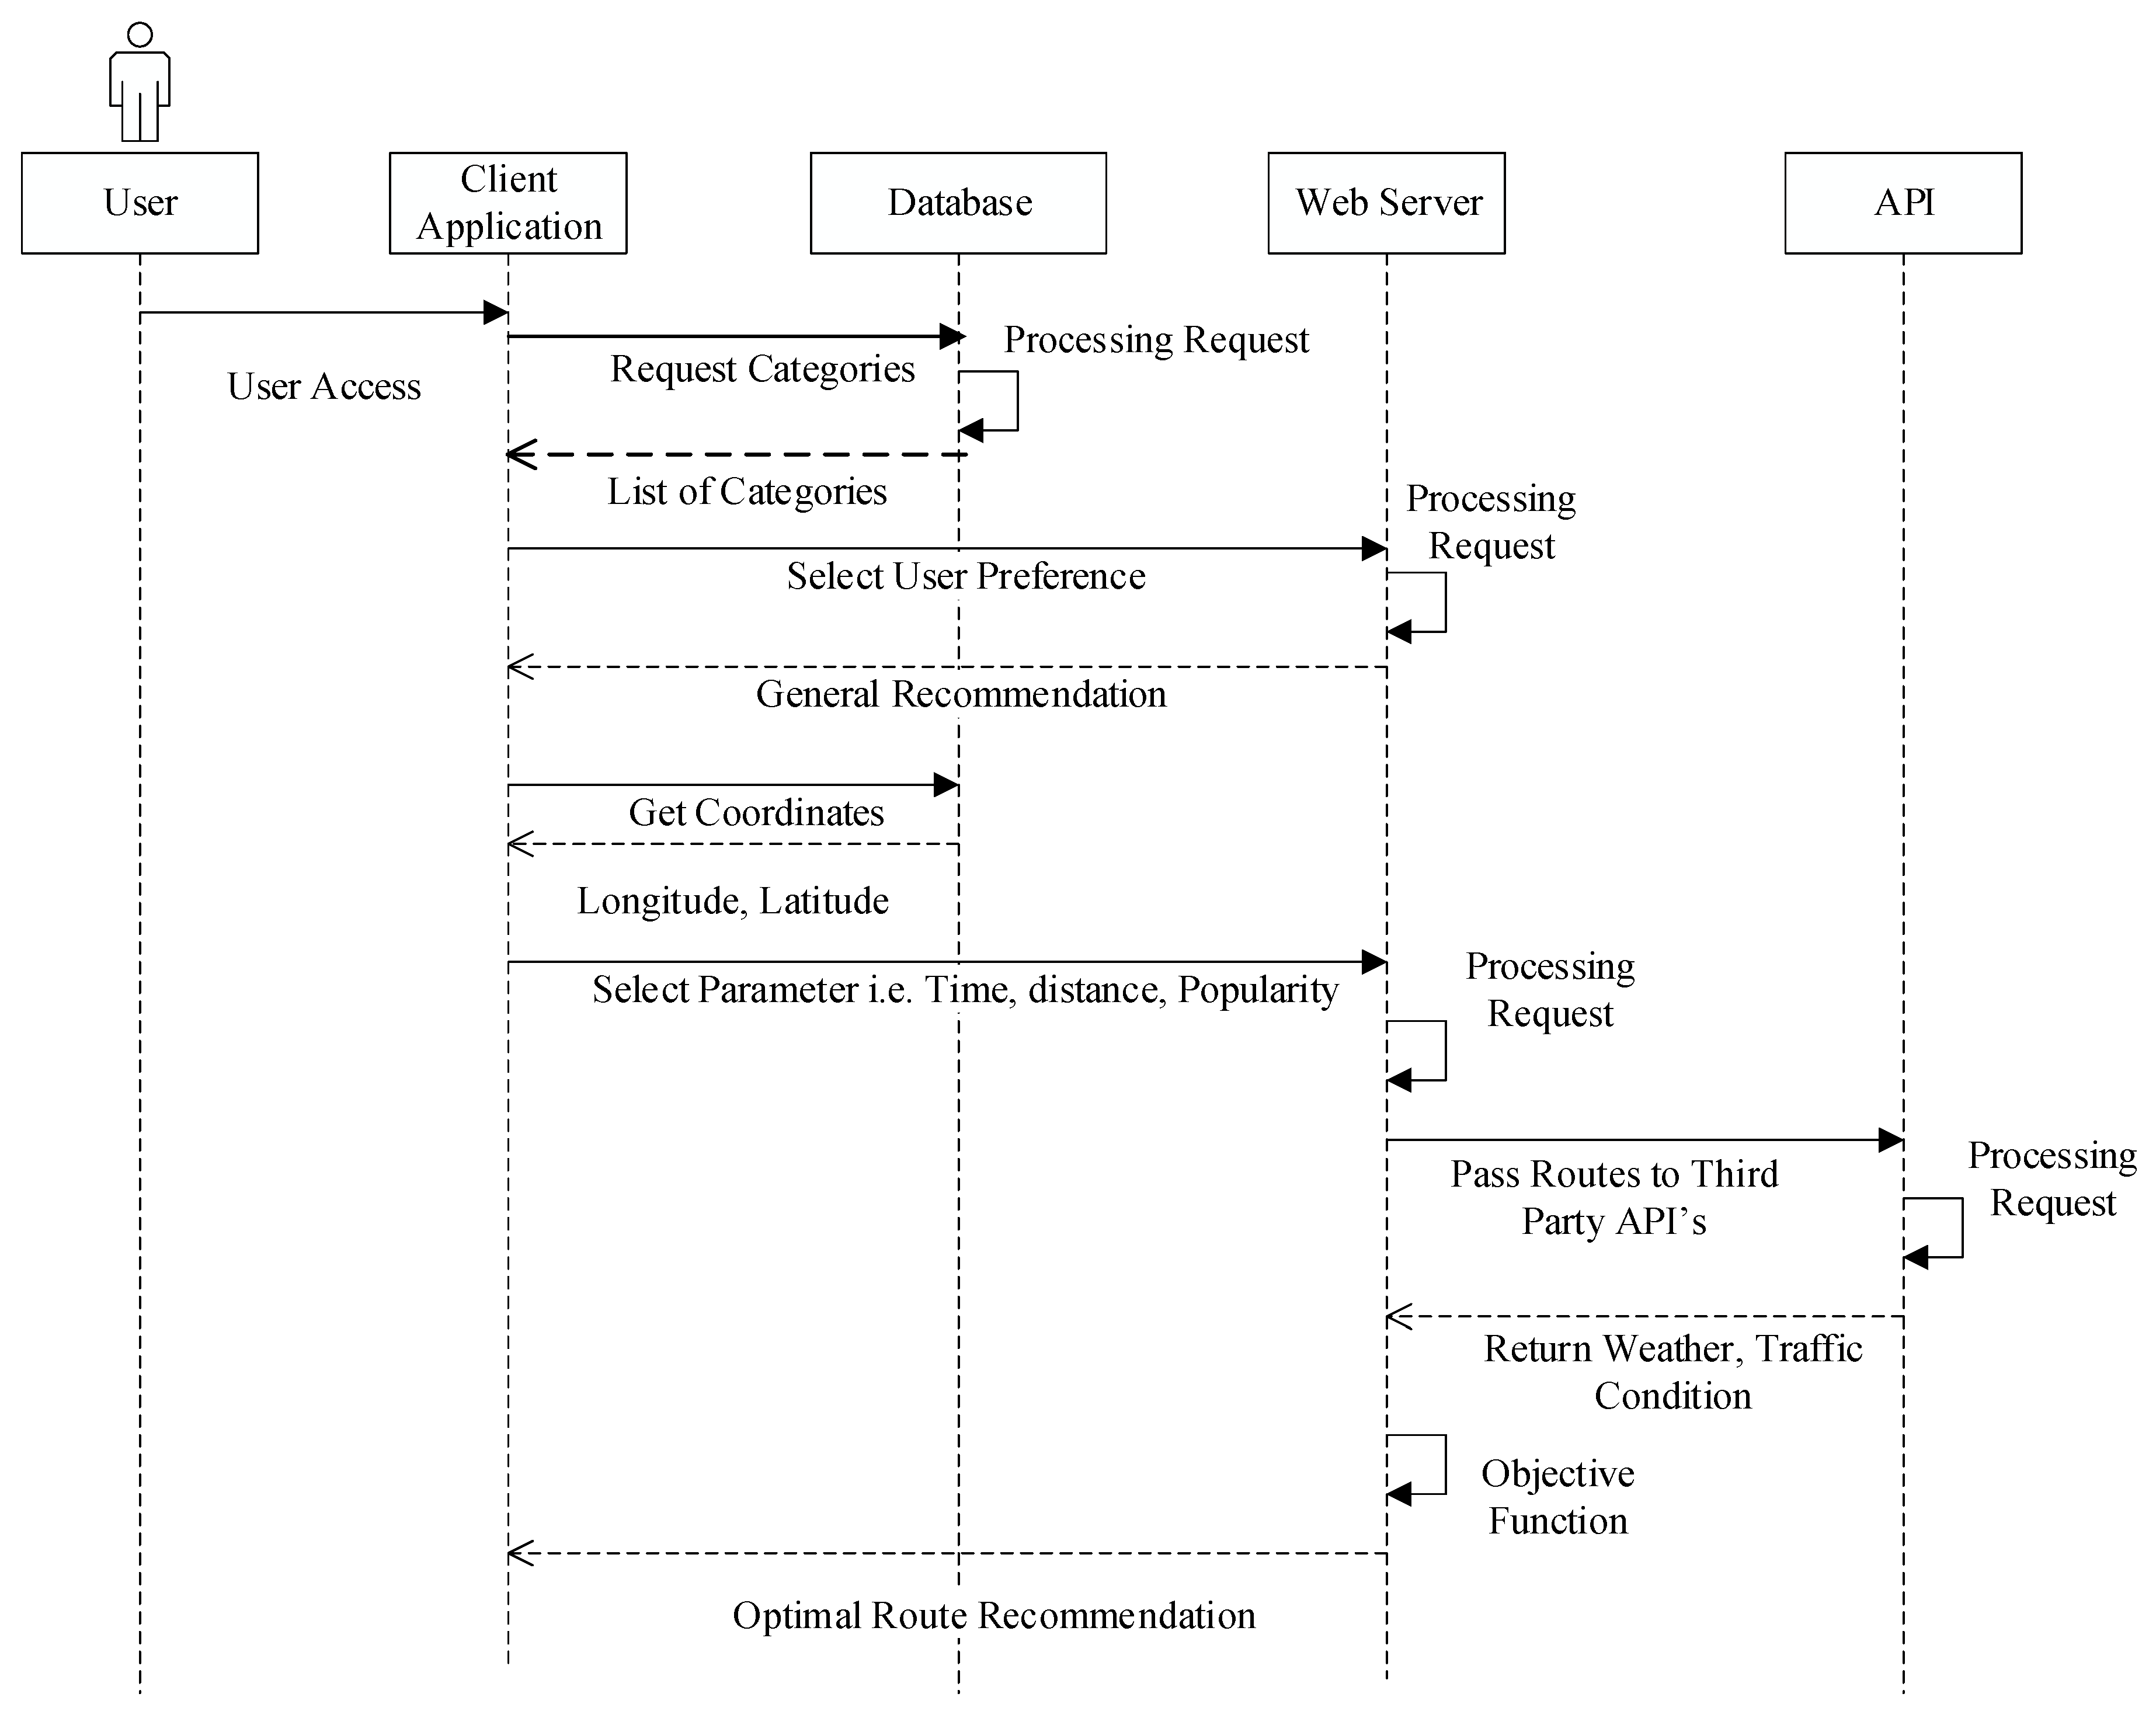
Figure 6 shows the sequence diagram of the proposed system. In the first step, user access client application. The user requests a list of categories defined in the system. In response, a user gets list of the categories i.e., cultural heritage, ancient historical sites, art galleries, restaurants, seaside views, and theme parks. The user selects user preference, i.e., which type of locations he or she prefers to visit, cost of the location i.e., free or ticket, and provides basic information like gender and age. On the basis of the user’s current location, a general recommendation is provided to the user. The user selects any location that he or she is interested in visiting. On the basis of user selection, the application finds the coordinates of the location i.e., longitude and latitude of the location using third-party APIs. At this stage, the user has three options i.e., time, distance, and popularity of location. The user can mark any one option or multiple options. User preference is sent to the web server for processing. Using third-party APIs, we find out the weather condition and traffic of the nearby locations. We used OpenWeatherMap to find the weather in the location by providing locations coordinates. We used TomTom traffic stats to find out the traffic jam in nearby locations to suggest optimal route to the tourists. After receiving weather and traffic conditions, an optimization objective function is applied to the values and optimal route is recommended to the tourist.
5. Methodology
In this section, we will briefly explain the methodology of the proposed recommendation system. The dataset available did not include information like coordinates of the location, distance between locations, popularity of the location based on the number of tourists visited. Data needed to be preprocessed before it could actually be used for the optimization function.
5.1. Data Preprocessing
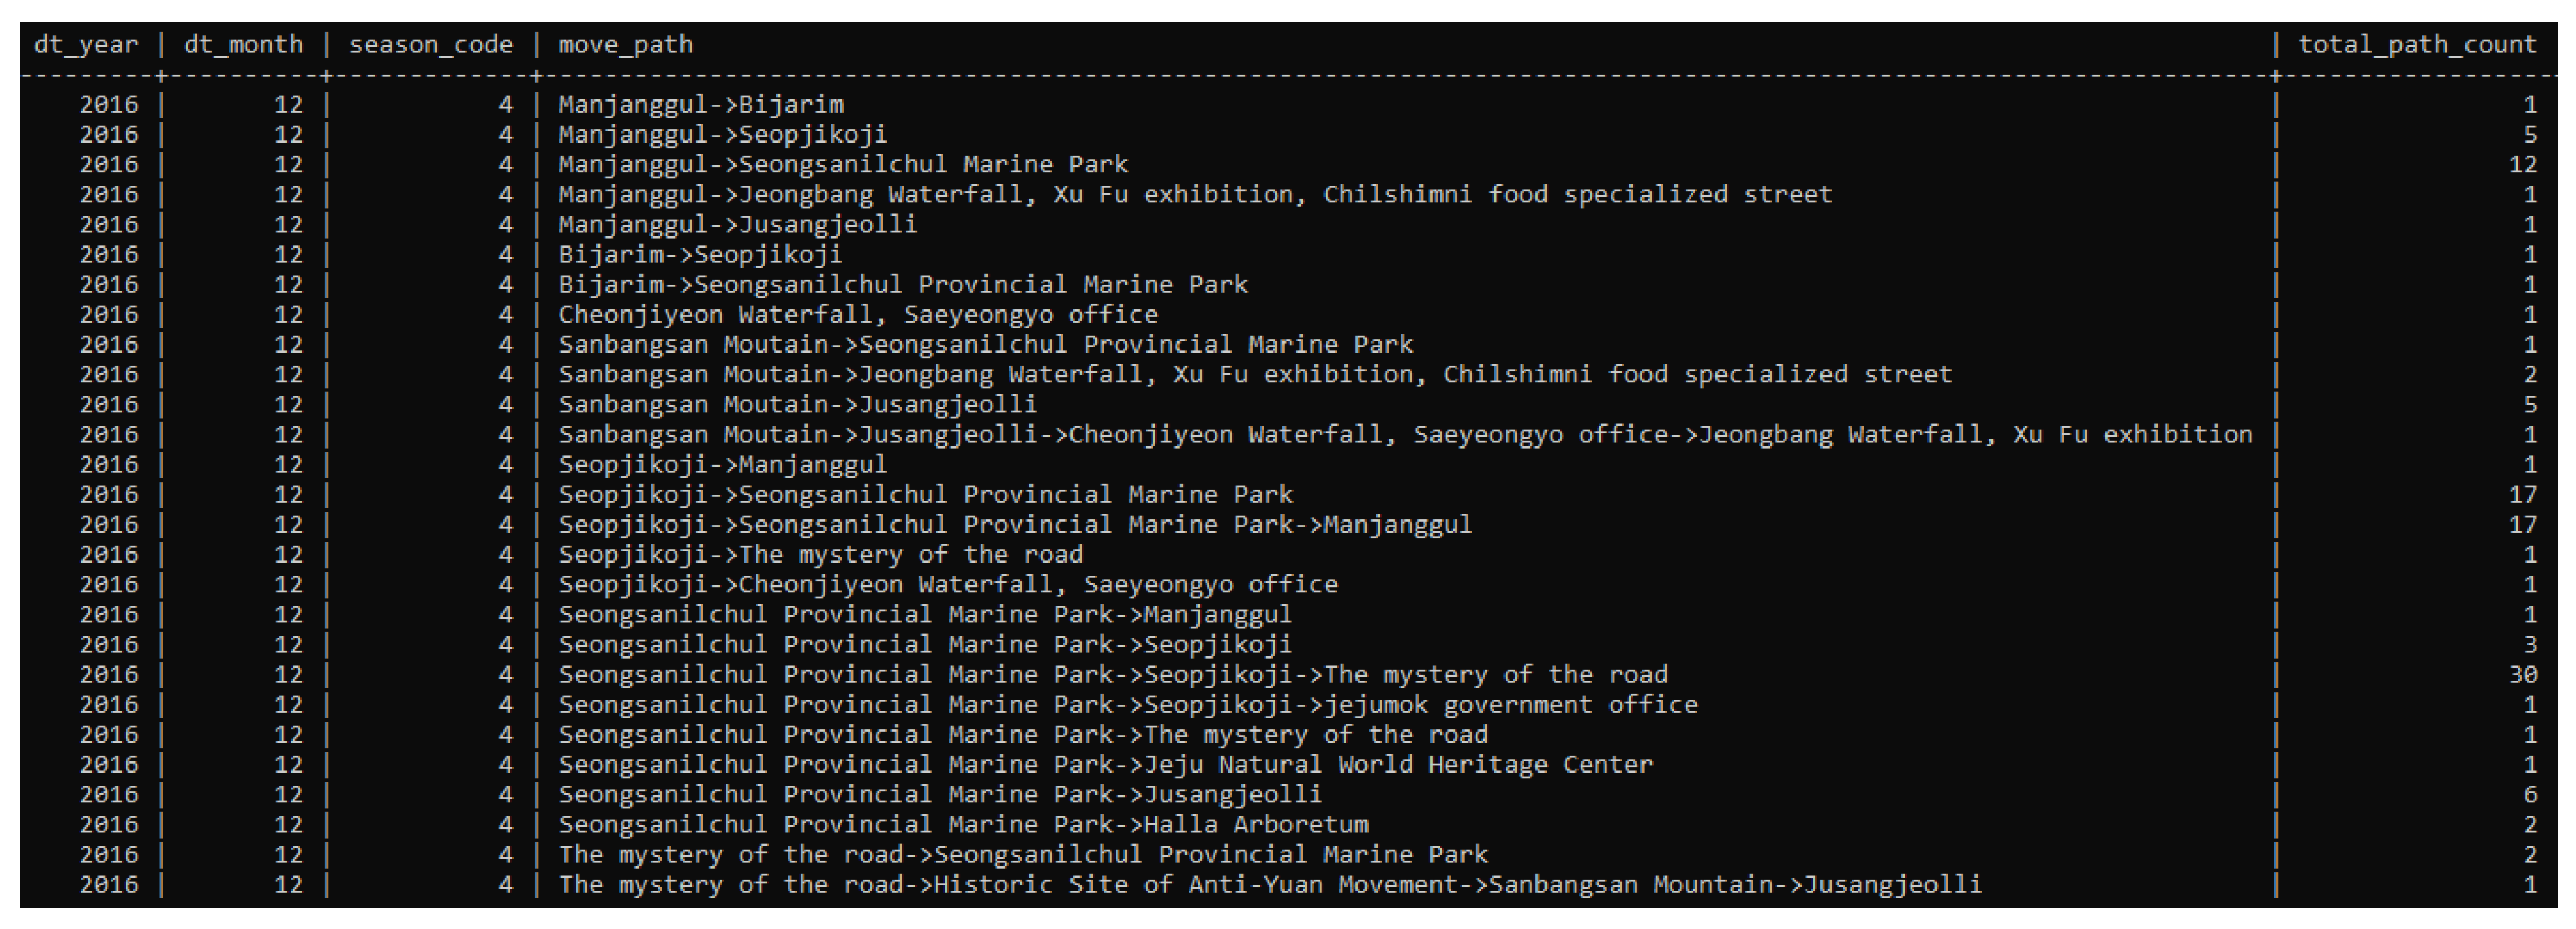
Real data based on mobile tourists is gathered for the year 2016–2017 from different locations in Jeju island, South Korea. The data was collected from the Wi-Fi routers installed at every location. The data had attributes like date of the connection. The date was split across month, half and quarter for granularity purposes. Apart from this, the moving path was recorded showing the tourist movements across different locations. Additionally, a number of tourists were counted for the route, and the duplicate count was also noted down which represents the number of tourists who travel part of the route. The difference between the total path count and duplicate path count was that in case of a duplicate, the tourist covered part of the trajectory. A small chunk of the dataset is shown in
Figure 7. We used a MySql database to store the data of tourists.
We had data of tourists traveling from one location to another location. In order to perform analysis and recommend optimal route, we had to pre-process the data. First we extracted unique locations from the data set. There were 149 unique locations in the data set. We included different locations in different categories so that we could recommend an optimal route on the basis of user interest.
Table 2 represents the transition matrix of the data set. We have shown a few locations in
Table 2. The transition matrix shows distance between one location to another location in kilometers (KM). From
Table 2, we can see that distance from ‘Manjanggul’ to ‘Bijarim’ was 5.5 km and distance from ‘Manjanggul’ to ‘Seopjikoji’ is 18.72 km.
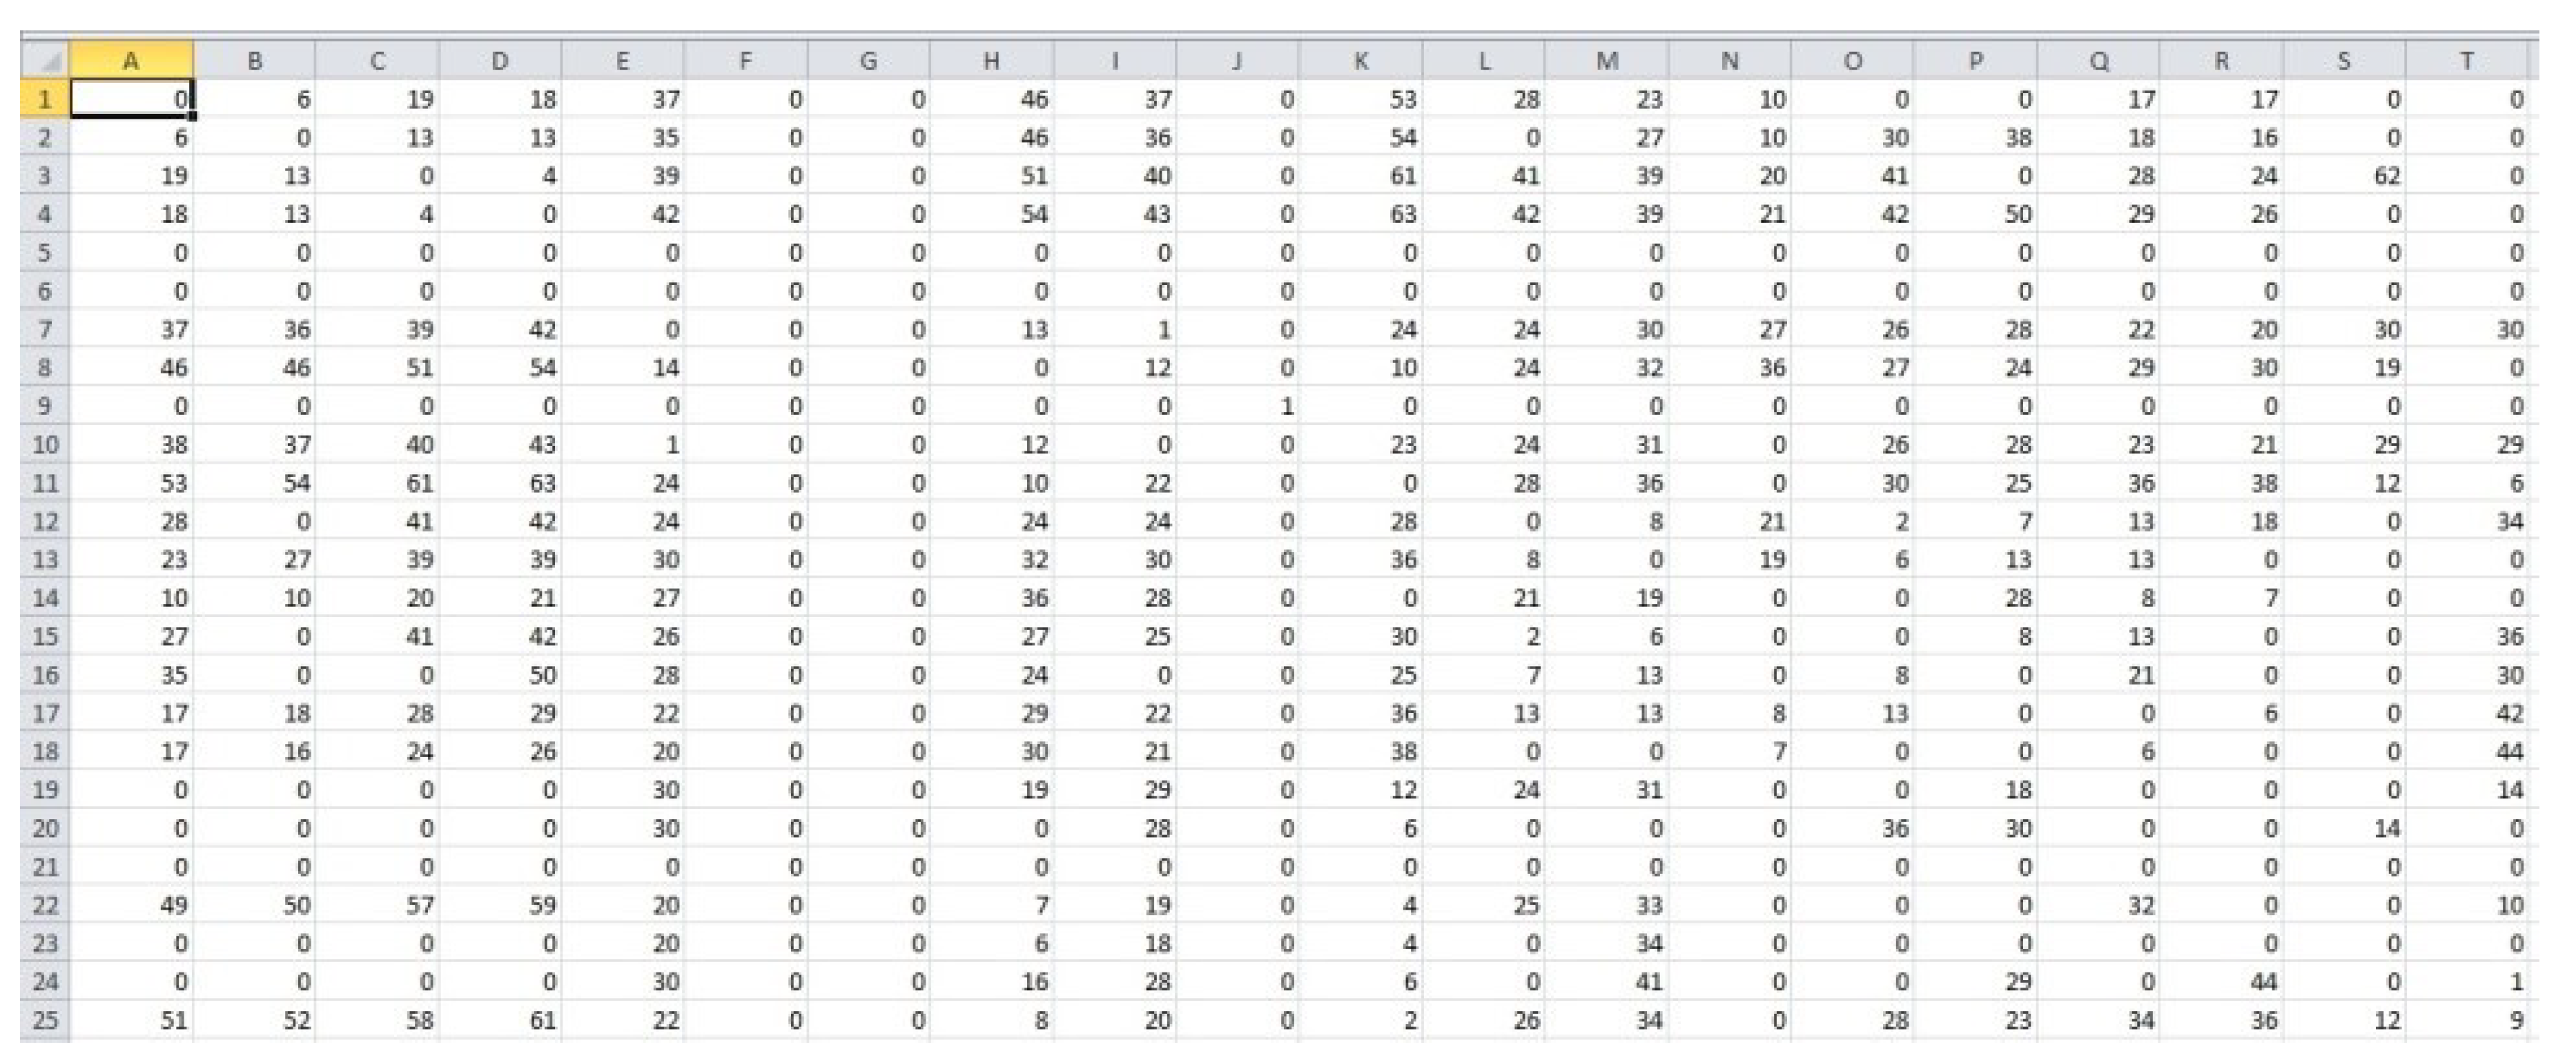
We have also created an adjacency matrix during pre-processing. The purpose of the adjacency matrix was that it made us able to find out that how many times a user has visited from current to next location. This information was needed to find the probability in a naïve Bayes model. In
Figure 8 we can see the adjacency matrix, which explains each location connected with other locations from data set. In case of 0, it means user has not visited from the current to that location.
Table 3 represents the latitude and longitude of the locations. We have shown only few locations longitude and latitude in the table. We have used third-party APIs to find the longitude and latitude. We passed the location name (string) to the API and get the longitude and latitude in response. Longitude and latitude are used to calculate the distance between locations.
In order to compute distance transition matrix, for all the locations in dataset, the distance was calculated using the Haversine formula. The Haversine formula calculated the distance between two locations on earth considering Earth as a sphere if their latitudes and longitudes are known, and many researchers have been using it lately. It is very useful in navigation and is sometime regarded as a special case of spherical trigonometry. For any two locations on Earth, the harvesine of the central angle between them is given by
In Equation (
1),
x represents the latitude of the location whereas
y represents the longitude of the location.
D is the diameter of the Earth and
d is the distance from one location to another.
Putting the values of haversine function from Equation (
2) to Equation (
1) gives rise to
By putting the values of
x and
y in Equation (
3), we can find the distance between two locations.
5.2. Naïve Bayes
Bayes theorem provides a way to calculating the posterior probability,
, from
,
, and
. A naïve Bayes classifier assumes that the effect of the value of a predictor (
x) on a given class (
c) is independent of the values of other predictors. This assumption is called class conditional independence [
27].Using Bayes formula
In this study, is the probability of traveling from current to next location, is the popularity of current location, is the popularity of next location. Using this equation we will find the next best location and loop till we reach the destination location. Using next best location, we will recommend optimal route for tourists based on popularity.
5.3. Optimization Objective Function
The objective of the optimization function was to find a route which has less distance and time and covers more popular location at the same time. There were some factors that may affect the optimal route recommendation like weather condition, and traffic situation. In the proposed system, we have availed third-party APIs to find out the weather and traffic condition of the tourists destination. Based on the user preferences, the proposed system recommended alternative routes that were based on current weather and traffic situations. We have availed OpenWeatherMap API to find the current weather condition of source and destination of the tourist. To find the traffic situation of the route between source and destination, we have availed the services of the TomTom Traffic Stats API.
The optimization function tried to minimize distance and time, and maximize the popularity index. In Equation (
5), the objective is to maximize popularity of the location.
where
is the popularity index based on the number of visits a location is visited by tourists. The time and distance constraints needed to be minimized by the objective function, i.e.,
Based on Equations (
5) and (
6) the optimization objective function is given by
In Equation (
7),
is the weight given to weather condition and
is weight given to traffic jam. If its raining, the value of
X is 1 and if it is sunny, the value of
X is 0. Similarly in the rush hour, the value of
Y is 1 and if traffic is normal, the value of
Y is 0. If the value of the optimization function is positive then it is considered as a good route for tourists. If the value of the optimization objective function is negative, it is not considered a good route to travel for tourists. The maximum value of the optimization objective function indicates the best route for the tourist and hence it is recommended.
6. Implementation and Testing Environment
In this section, we will briefly describe the Implementation and testing of the proposed recommendation system.
Table 4 represents the brief summary of hardware and software required to implement the proposed recommendation system.
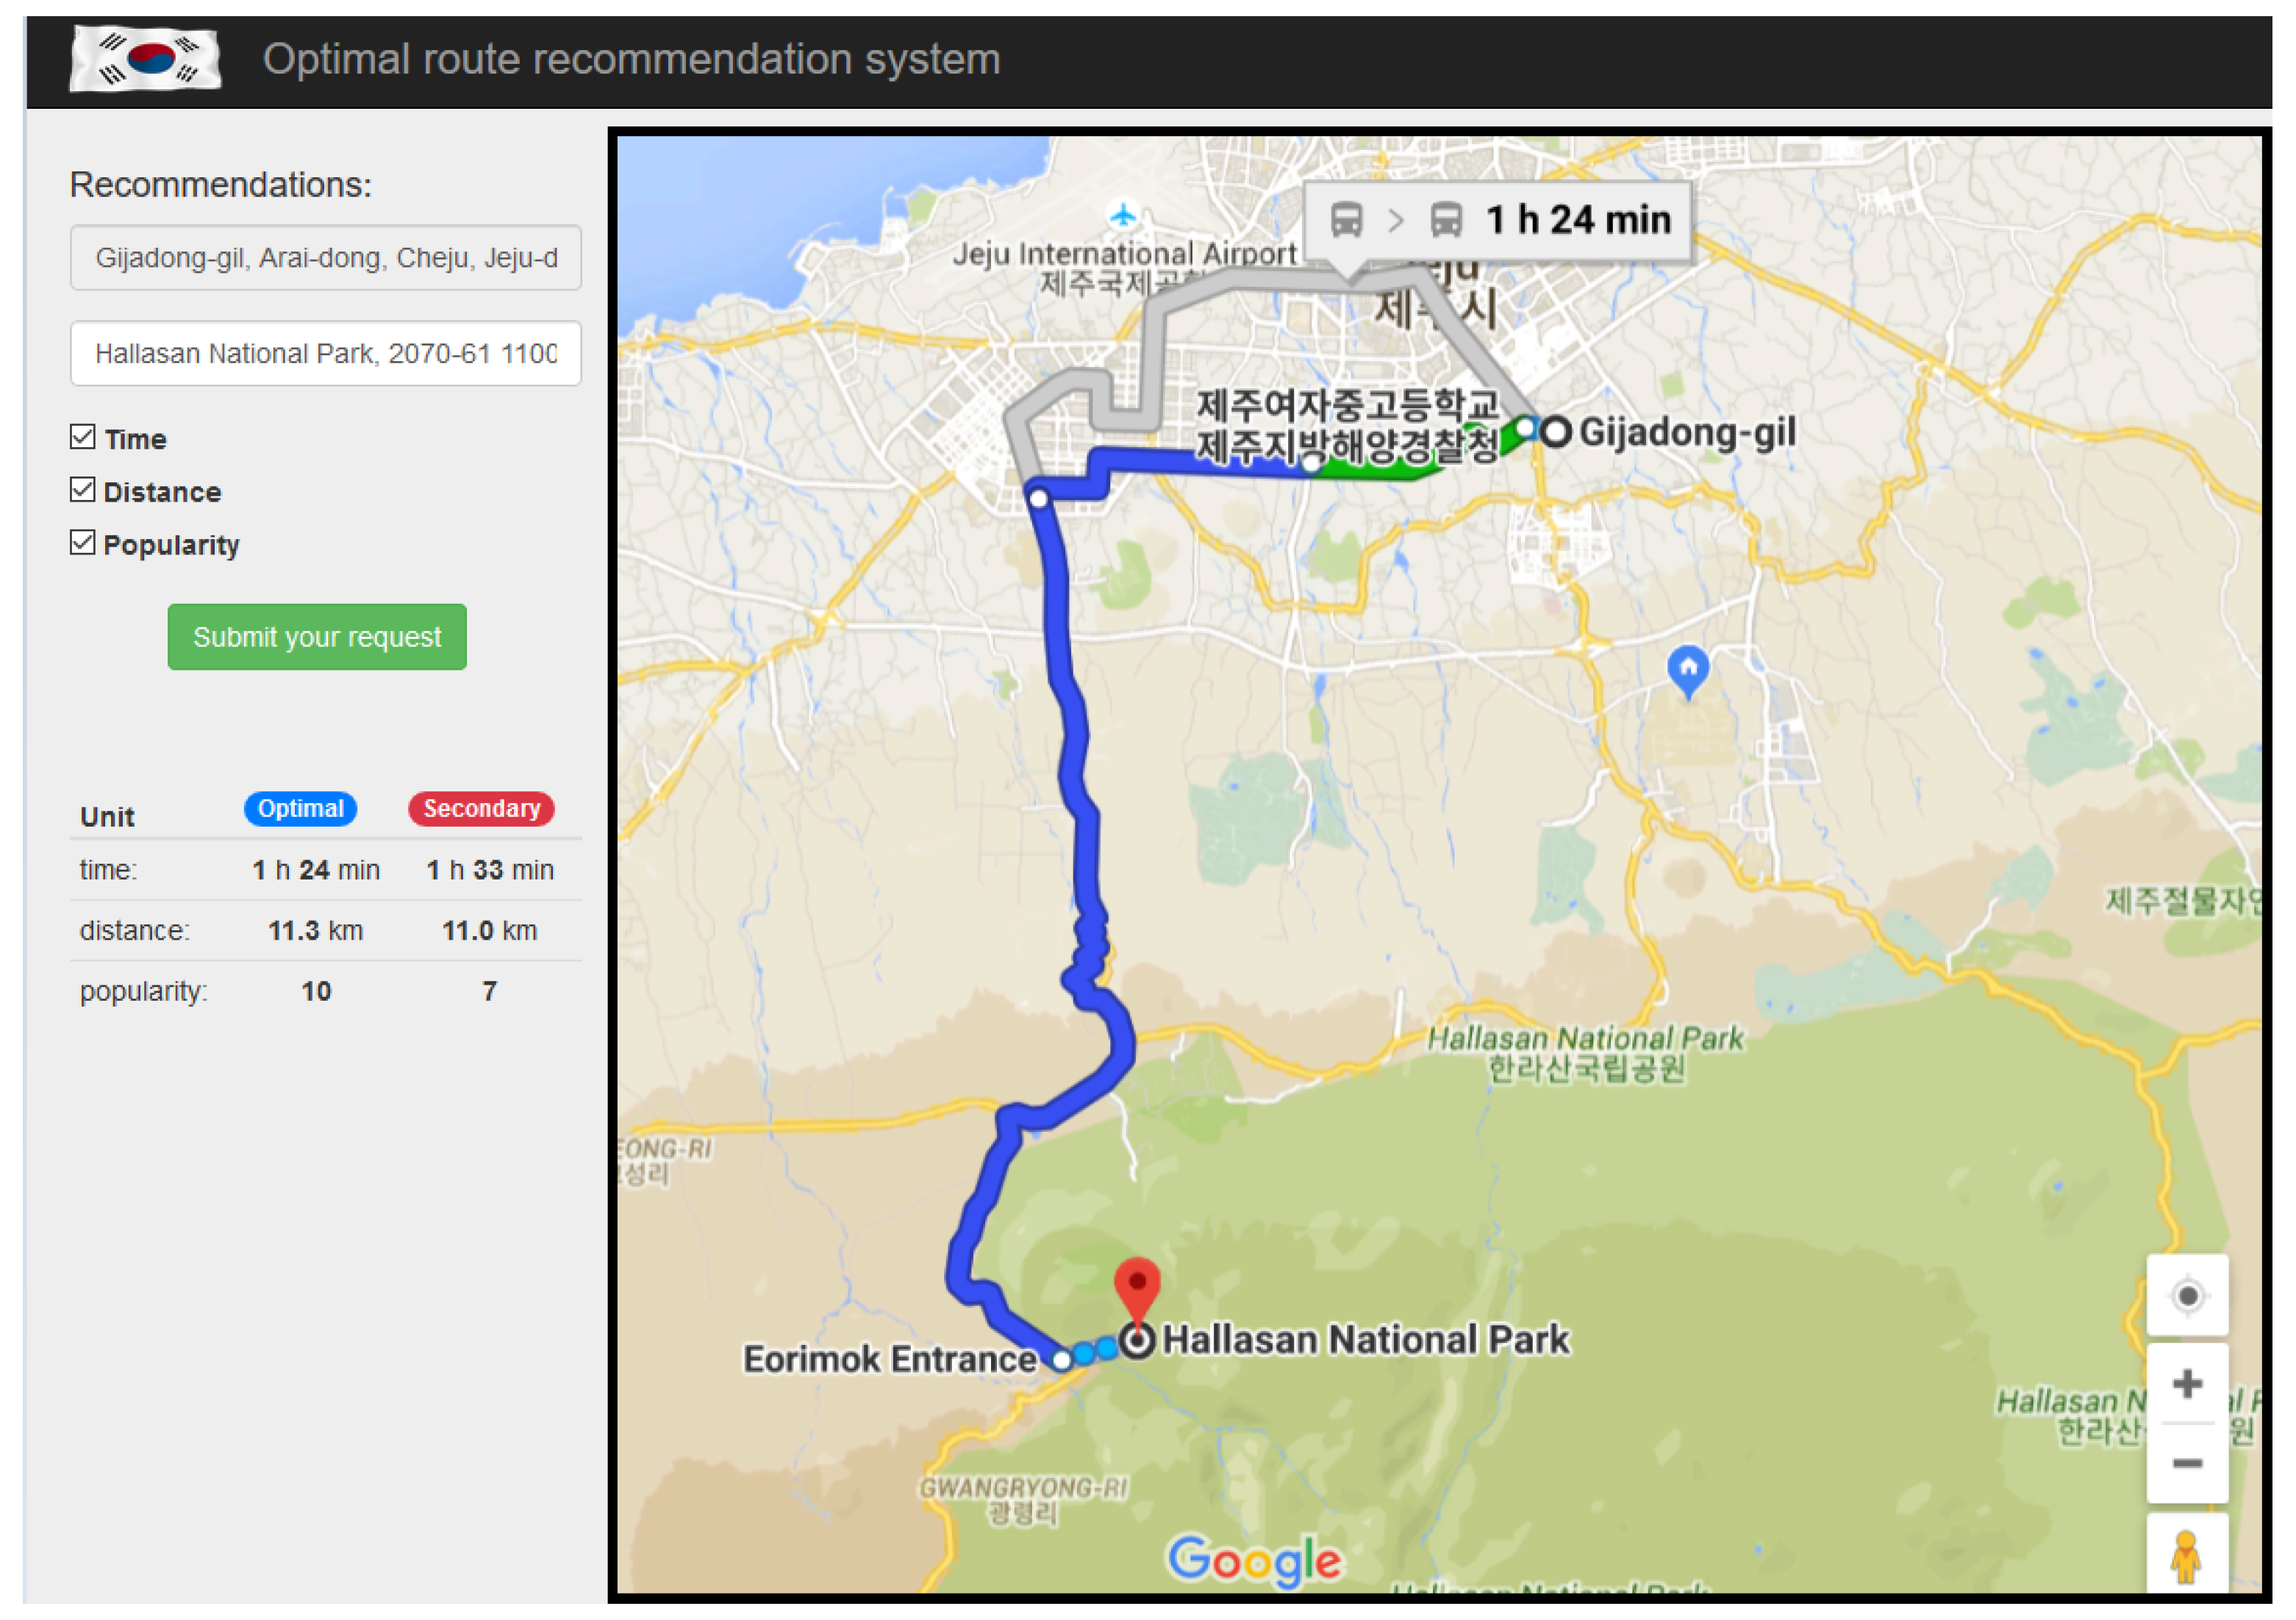
Figure 9 represents the web interface of the proposed system. In this figure, we performed testing of actual and optimal route using Optimal route recommendation system. In this Figures, the current location is ‘Gijadong-gil’ and the destination is ‘Hallasan National Park’. Hallasan is the highest peak in Jeju Island, Korea. The gray line indicates the actual route based on previous data. The blue line indicates the optimal route recommended for the tourist. The actual route covered distance of 11.0 km but it had to go through the mountain. The optimal route covered distance of 11.3 km but did not have to go through mountain. The time needed to reach the destination was 1 h and 24 min. We can see the popularity index was 10 in the optimal route and 7 in the actual route. It means the user can visit many popular sites based on his or her preferences.
7. Results
In this section, we will explain the performance of the proposed recommendation system and present results.
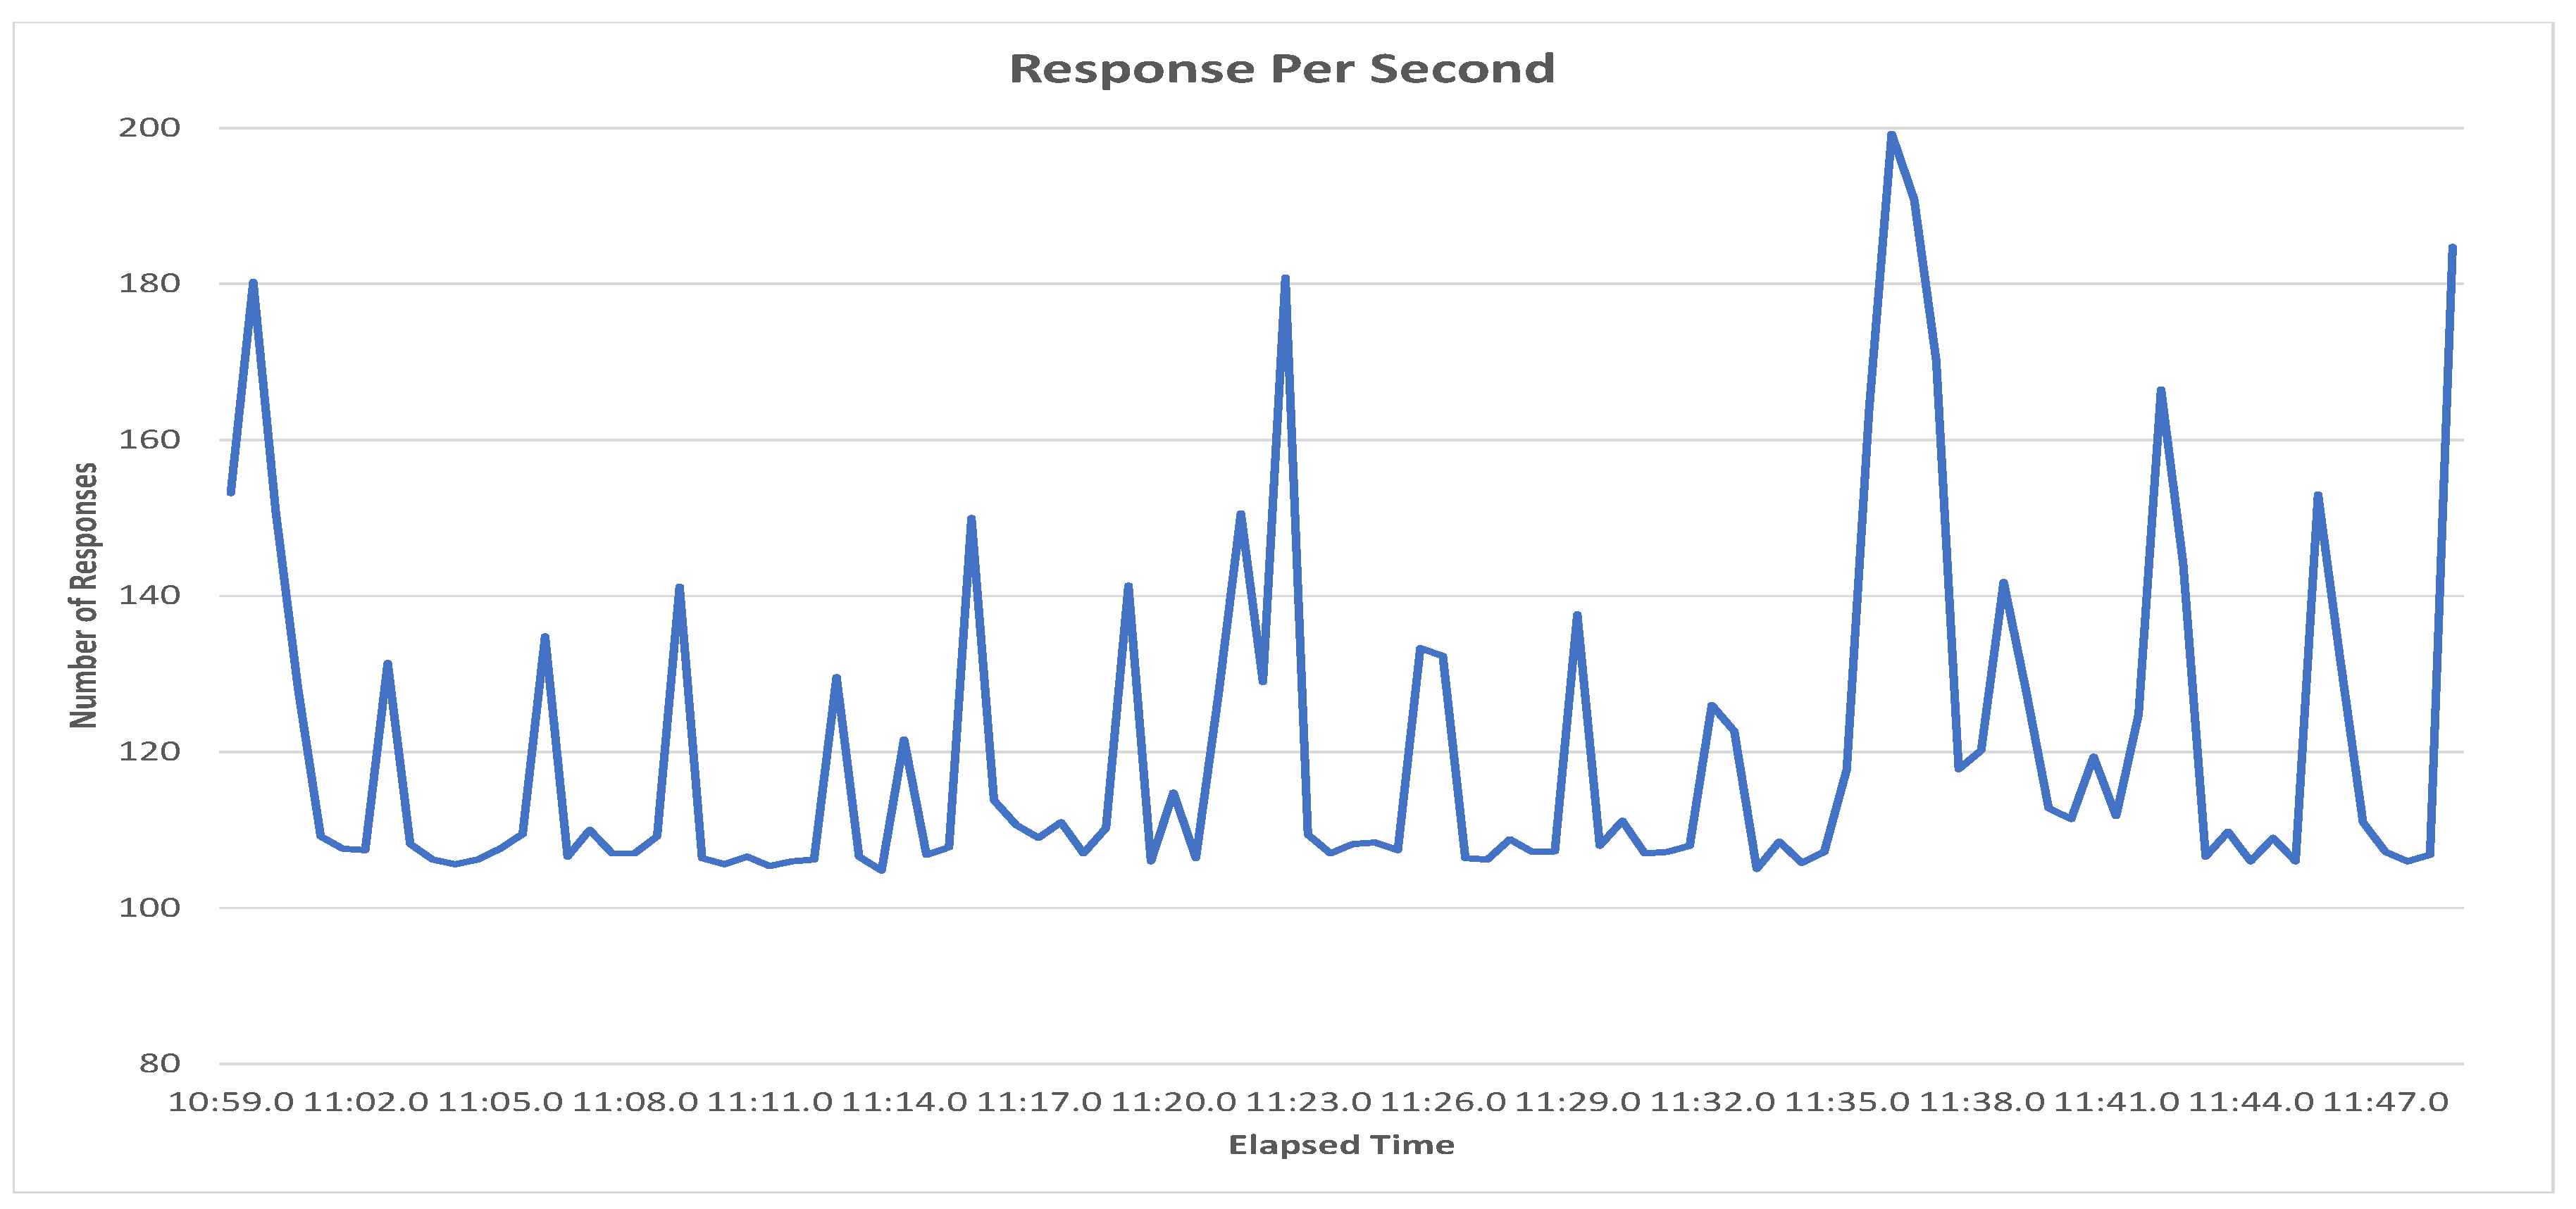
Figure 10 represents the number of responses per second. The optimal route recommendation system is very responsive. We have tested the system by sending hundreds of requests to the server. In
Figure 10, we can see that maximum number of responses per second is 199 and the minimum number of responses per second is 105.
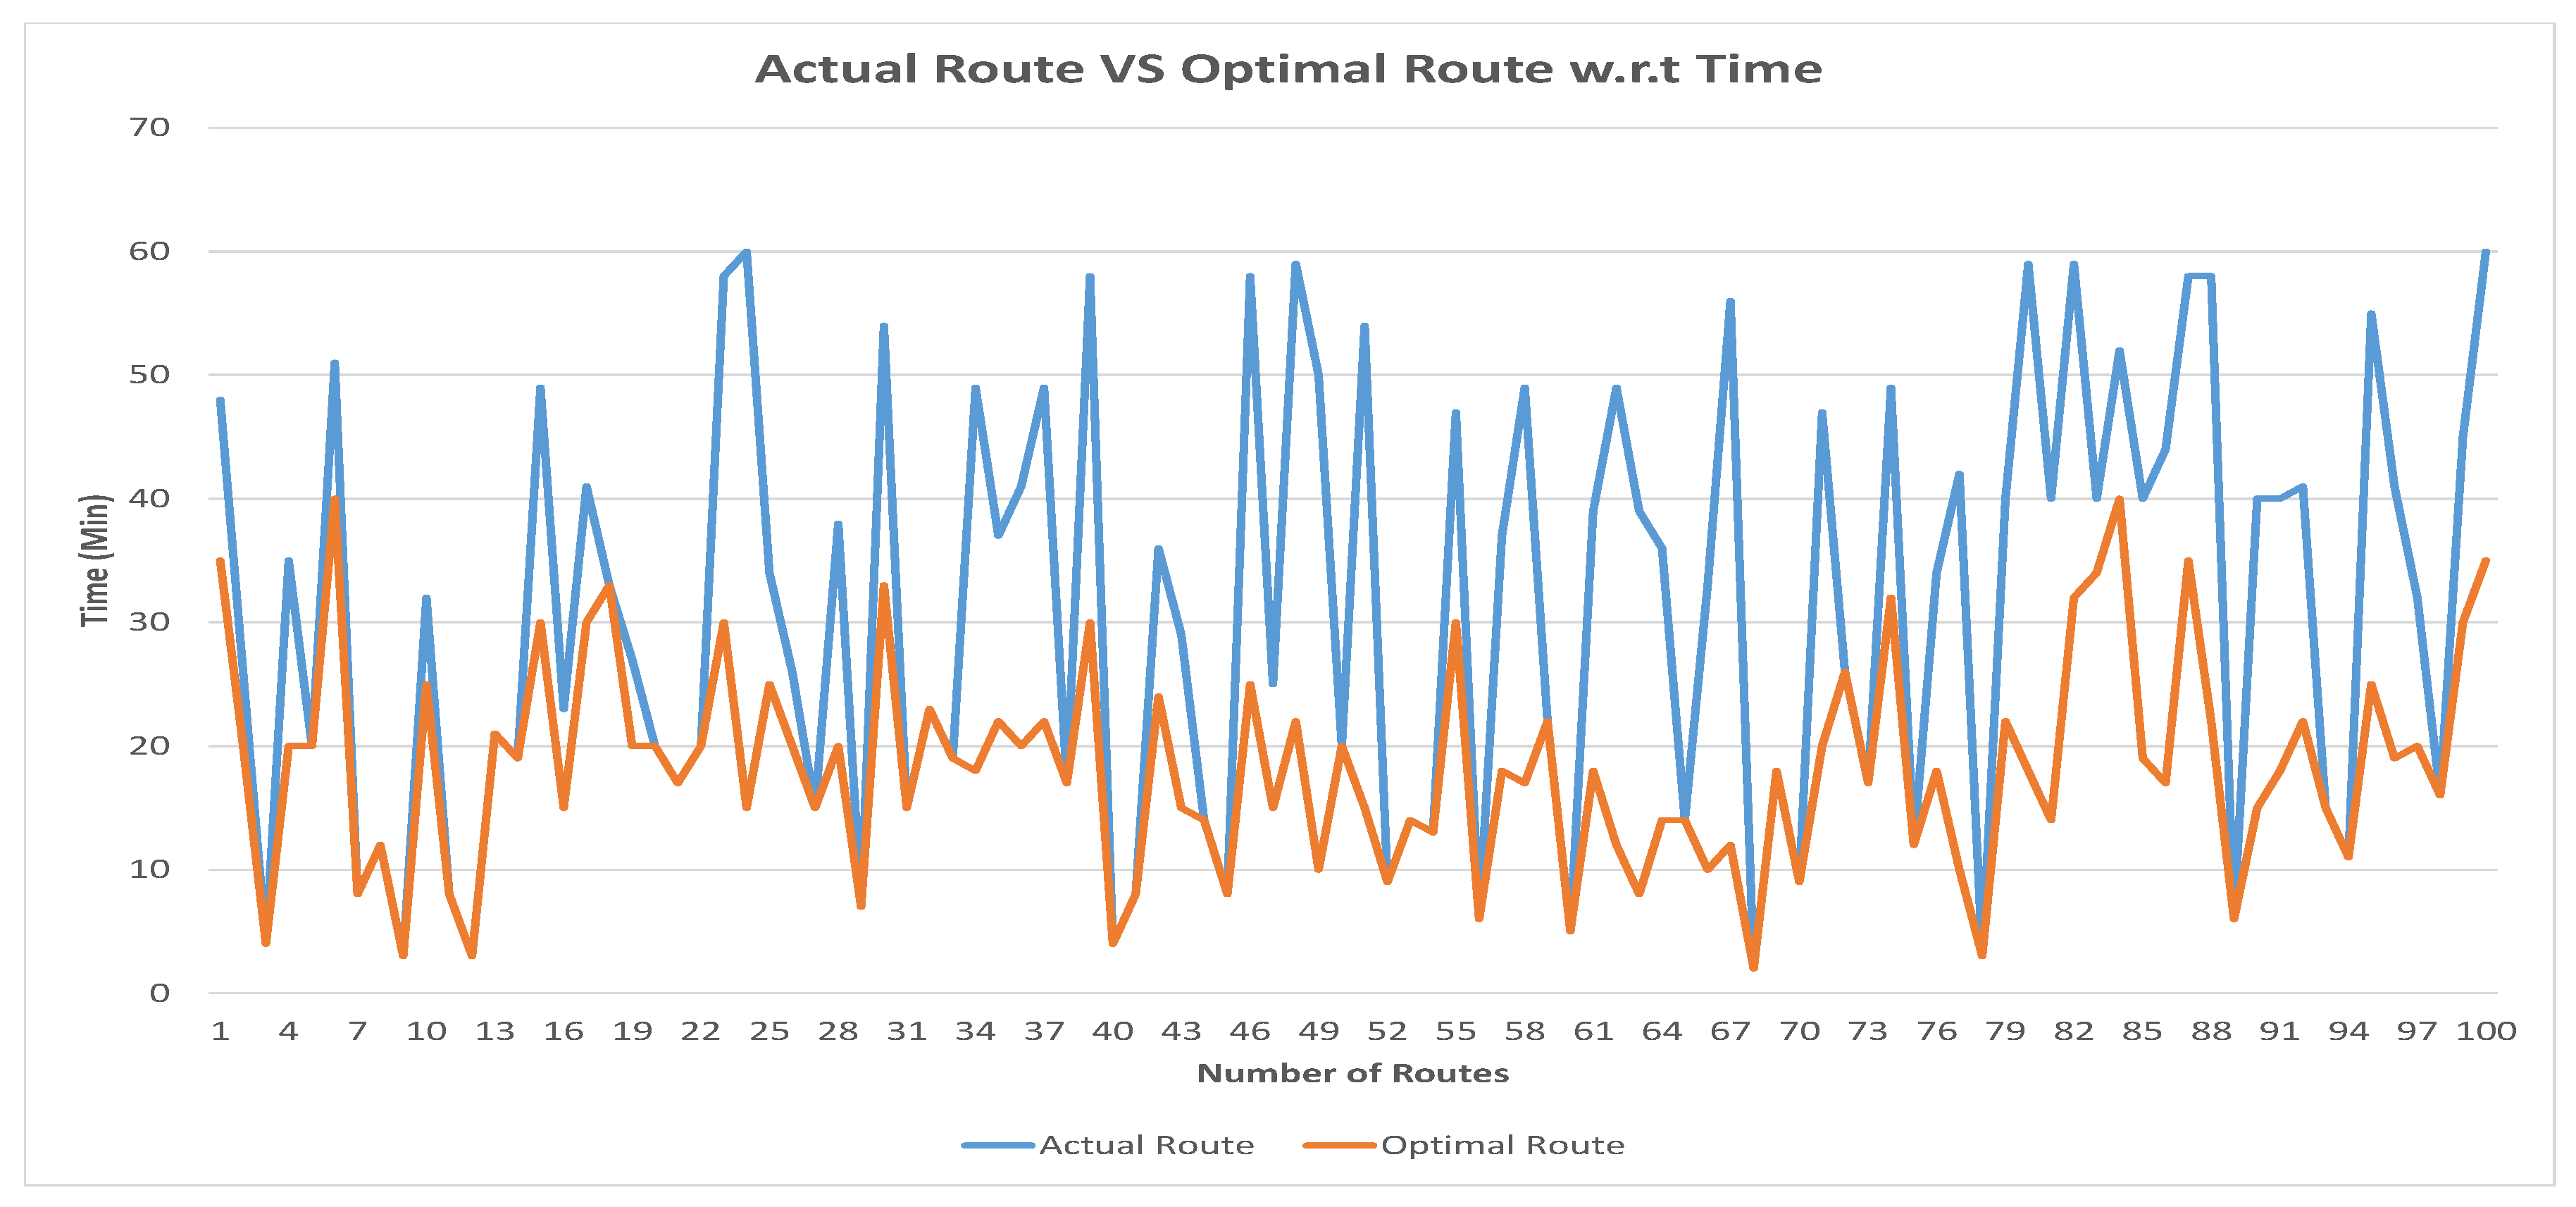
Figure 11 represents the data between actual and optimal route of tourists visiting locations with respect to time. We have split the locations from the actual route and calculated the total time (minutes) from current to next location. The blue line shows the time taken from actual route of tourists visiting locations in the year 2016–2017 whereas the orange line represents the time taken from optimal route calculated from proposed recommendation system. We have calculated the time taken between the current and next location until the destination of the actual route and compared it with time taken between the current and next location until the destination of the optimal routes. Time was calculated in minutes between current and next location of the actual and optimal route. We can clearly see in the graph that the optimal route took less time to visit destination. In
Figure 11, maximum time taken from the current to the next location of the actual route is 60 min i.e., one hour and minimum time taken from current to next visited location of the actual route was 8 min. Similarly, we can see that maximum time taken from current to next location in optimal route was 39 min and the minimum time from current to next recommended location was 2 min.
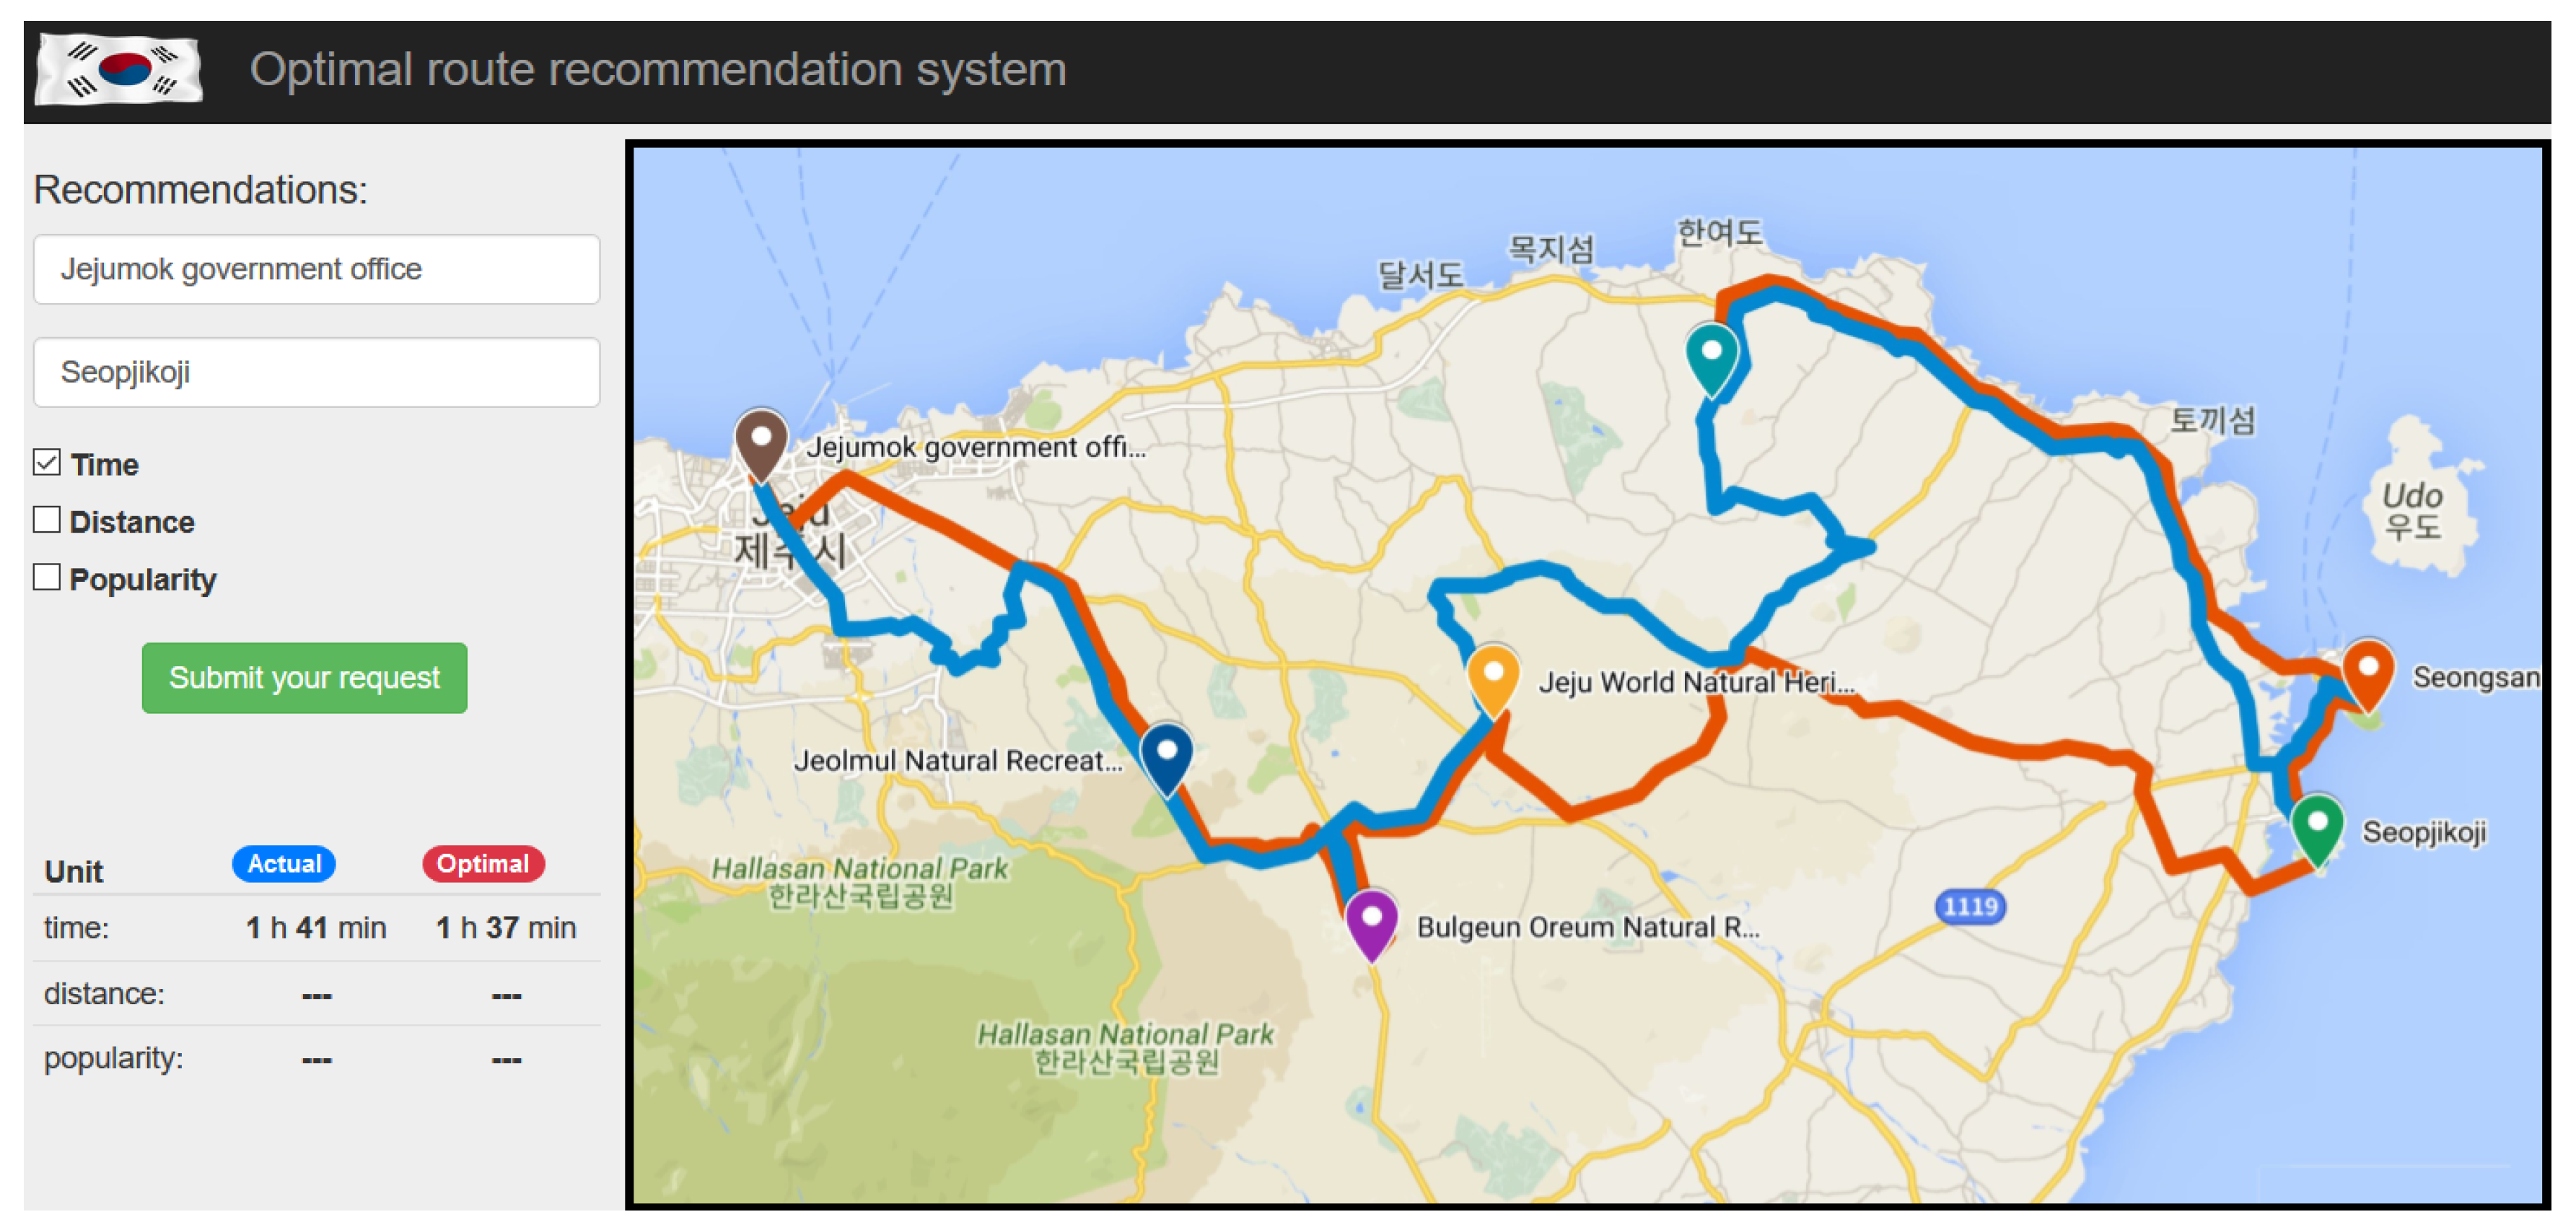
Table 5 shows one example of actual route and optimal route from the dataset with respect to time. In the actual route, tourists visited from ‘Jejumok government office’ to ‘Seopjikoji’ via ‘Jeolmul Natural Recreation Forest’, ‘Bulgeun Oreum Natural Recreation Forest’, ‘Jeju Natural World Heritage Center’, ‘Bijarim’, ‘Seongsanilchul Provincial Marine Park’. The tourist visited a total of seven locations. The proposed recommendation system represented the optimal route with respect to time i.e., from ‘Jejumok government office’ to ‘Seongsanilchul Provincial Marine Park’ via ‘Jeolmul Natural Recreation Forest’, ‘Bulgeun Oreum Natural Recreation Forest’, ‘Jeju Natural World Heritage Center’, ‘Seopjikoji’, ‘Seongsanilchul Provincial Marine Park’, and ‘Manjanggul’. In the optimal route path, the tourist visited a total number of eight locations. In this example we can see that tourist can visit the maximum number of locations including Seopjikoji in less time.
The actual and optimized path presented in
Table 5 is shown on the map in
Figure 12. From the map, we can see that there were lots of turns and curves in the actual path, whereas the optimized path was straight and short. We can also observe from the map that in the actual path, the tourist was traveling from ‘Jeju Natural World Heritage Center’ to ‘Bijarim’. The path was curvy and going backward and forward. Instead the proposed recommendation system suggests tourist to go from ‘Jeju Natural World Heritage Center’ to ‘Seopjikoji’ as it was easy and convenient. The proposed system recommends to go to ‘Bijarim’ via ‘Seongsanilchul Provincial Marine Park’ as it took less time and the roads were straight without any turns. The recommended route was sensible according to the infrastructure.
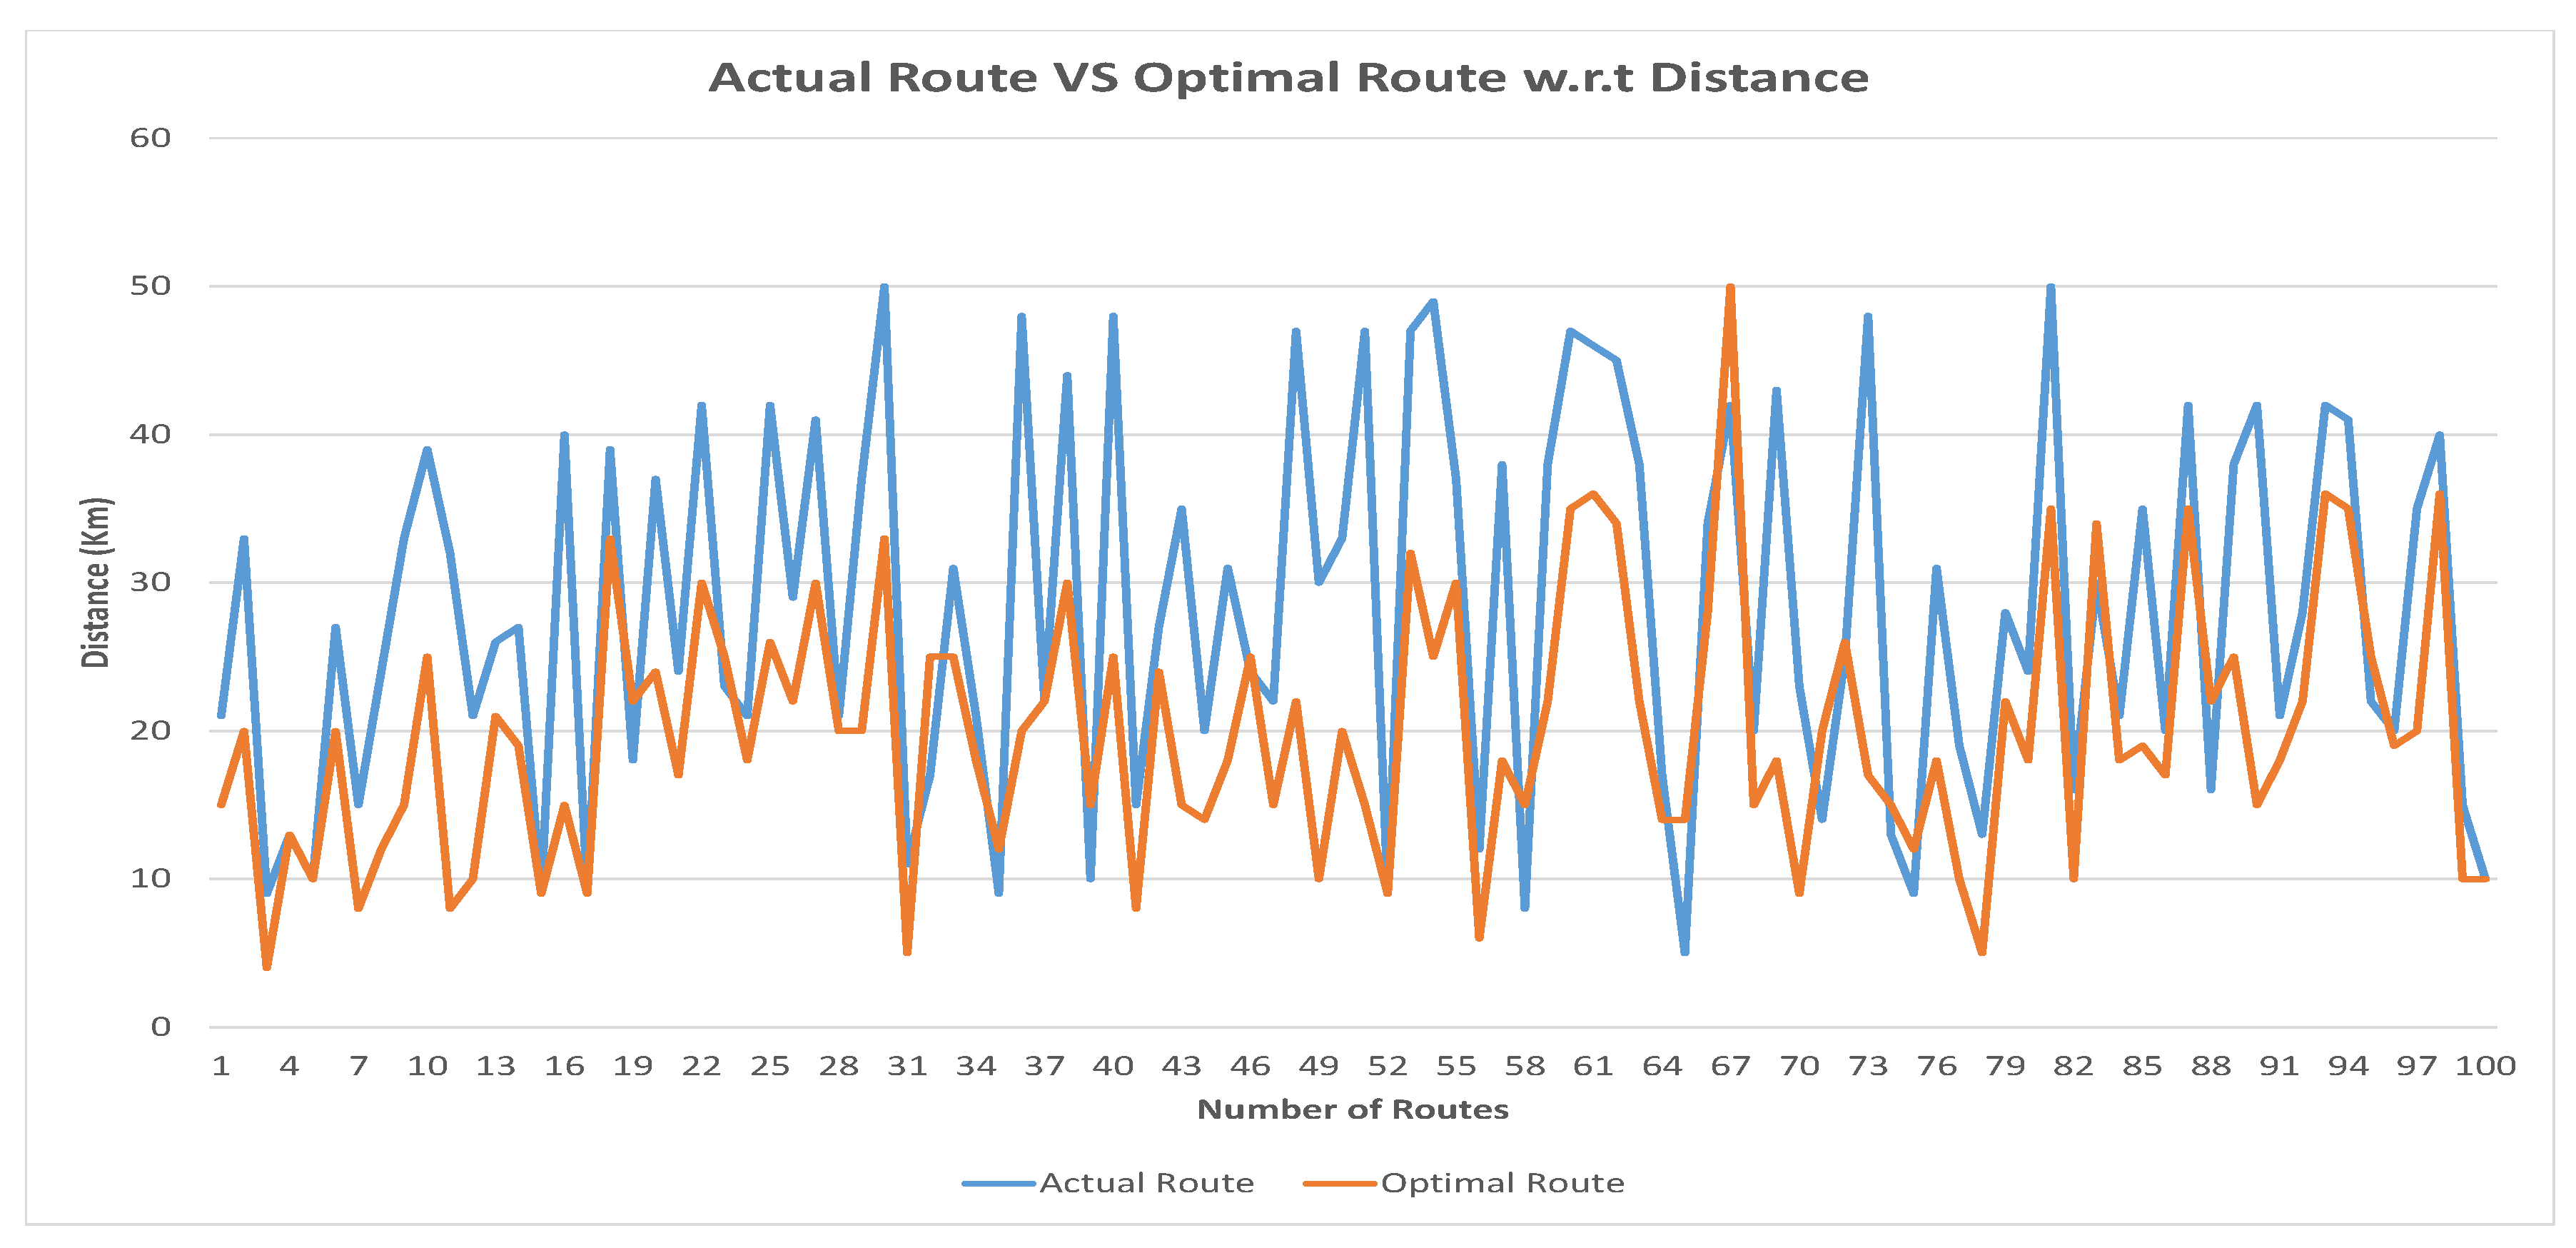
Figure 13 represents the data between actual and optimal route of tourists visiting locations with respect to distance. We have split the locations from the actual route and calculated the distance (Kilometers) from current location to next location. The blue line shows the time taken from actual route of tourists visiting locations in the year 2016–2017 whereas the orange line represents the time taken from optimal route calculated from proposed recommendation system. We have calculated the total distance in kilometers between current location and the next visited location until the destination of actual route and compared it with the distance calculated between the current location and next recommended location until destination of the optimal route. Distance was caclculated in kilometers between the current and next location of actual and optimal route. We can clearly see the difference between the distance of current and next location of actual and optimal route in the graph. The optimal route suggested a route to the destination with less distance as compared with the actual route of the tourist. In
Figure 13, maximum distance covered from current to next visited location of the actual route was 47 km and the minimum distance covered from current to next visited location of the actual route is 5 km. Similarly, we can see that maximum distance covered from the current to next recommended location in the optimal route was 46 km and the minimum distance covered from current to next recommended location in the optimal route was 3 km.
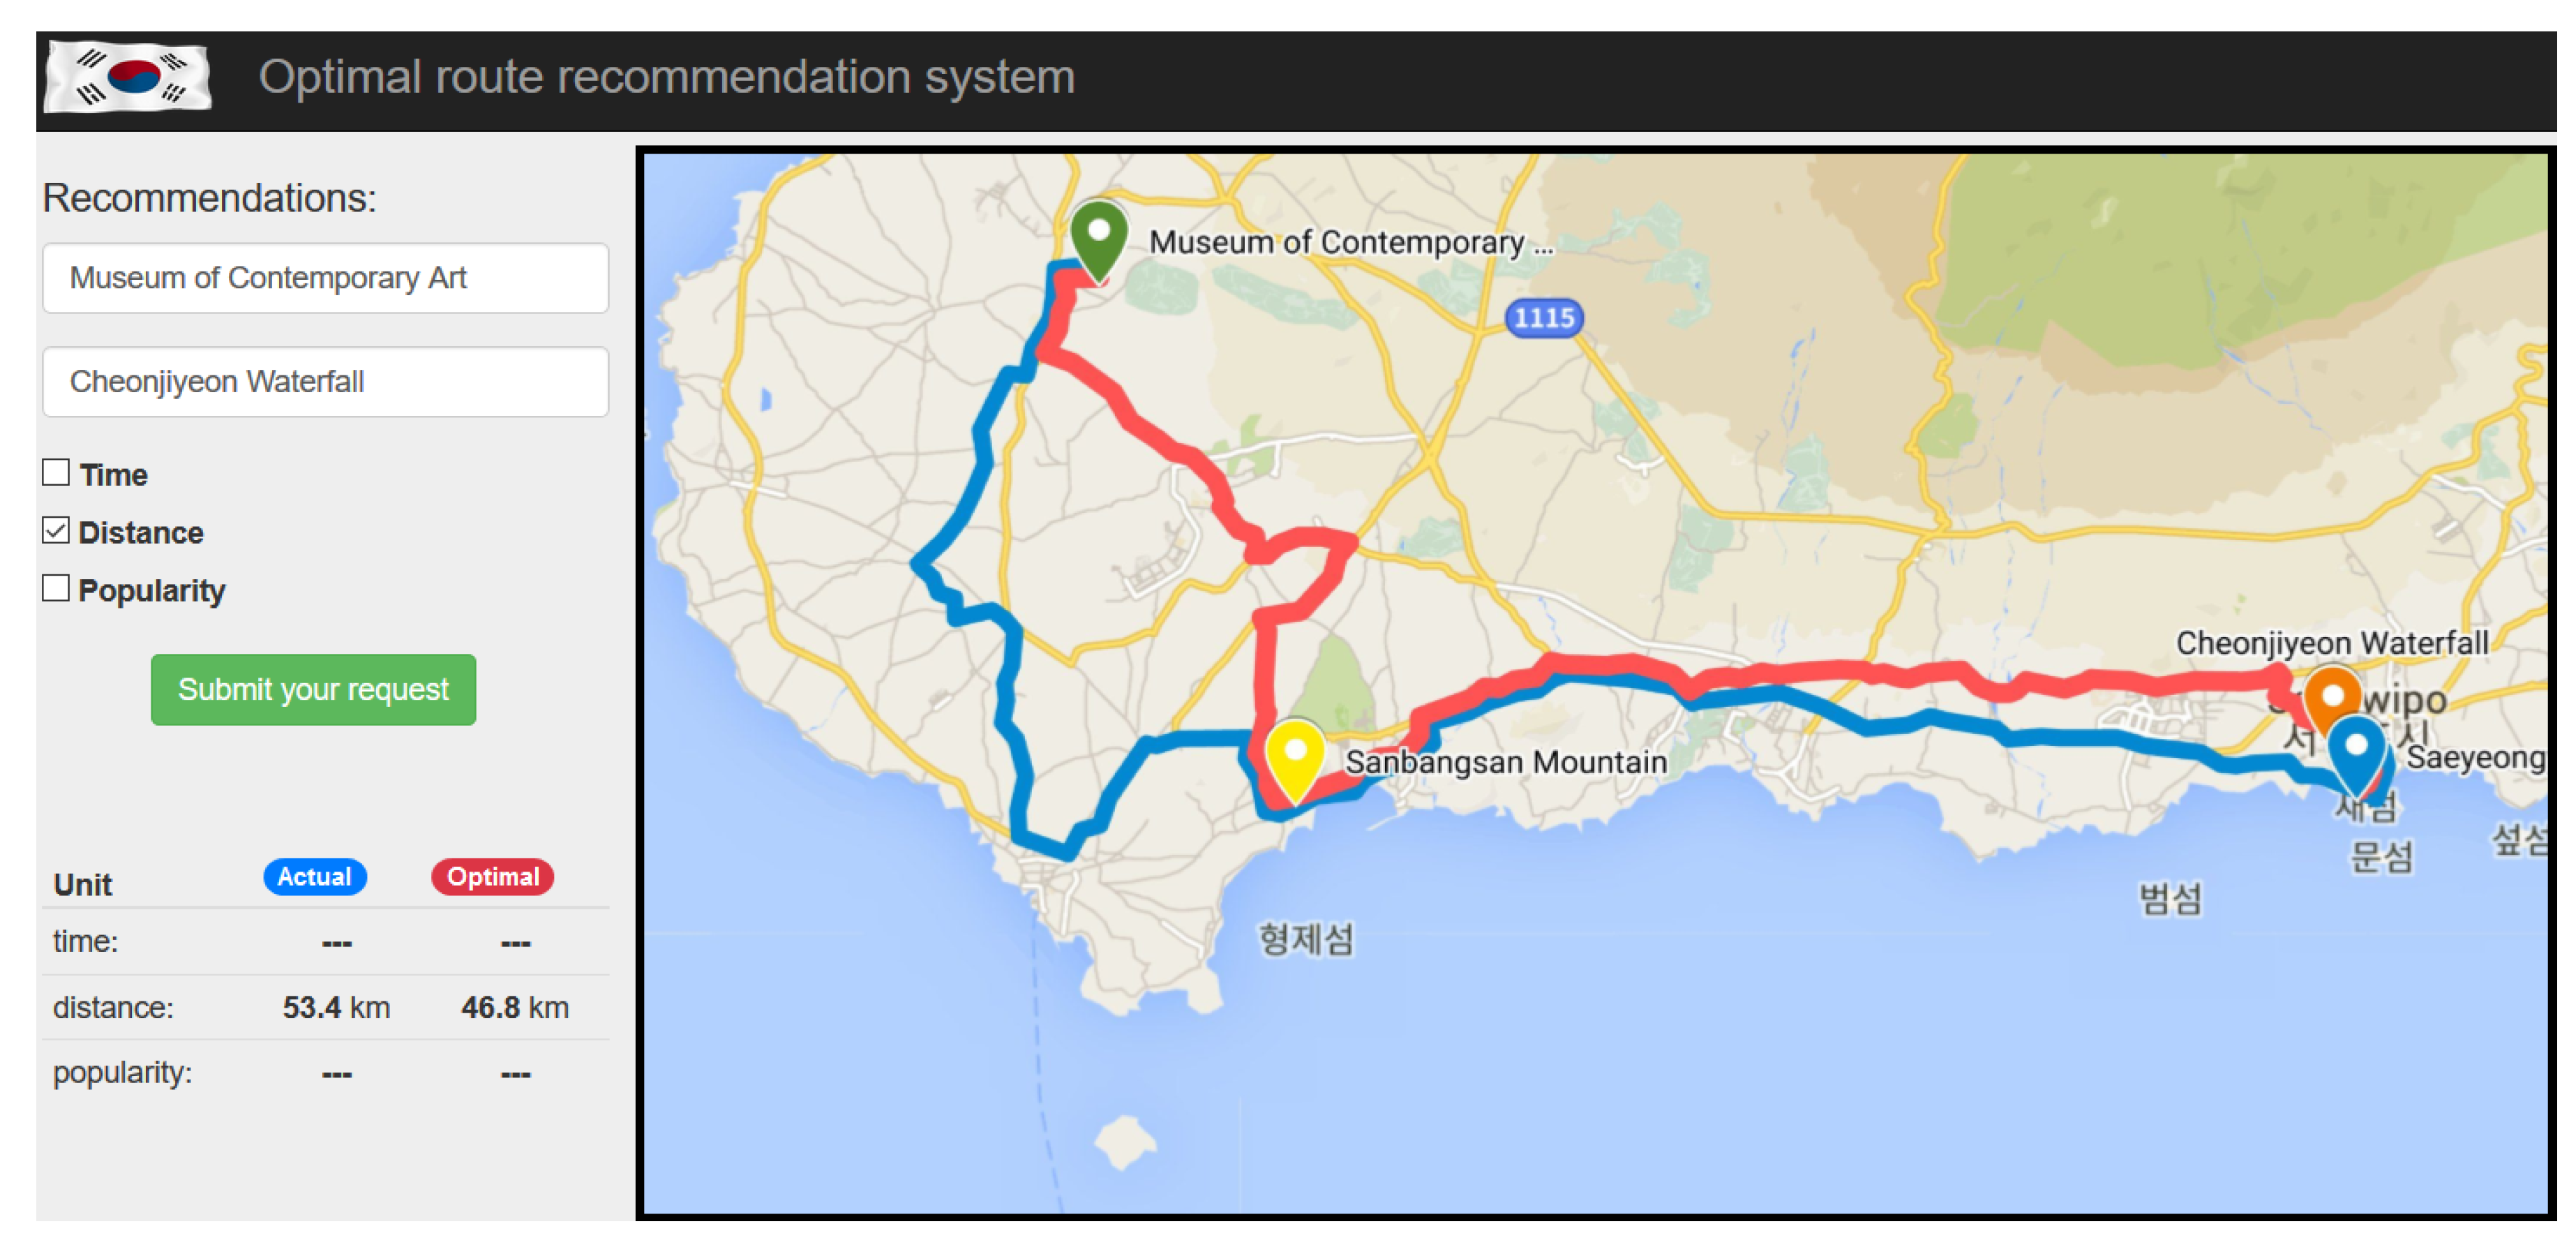
Table 6 shows one example of actual route and optimal route from the dataset with respect to distance. In the actual route, the tourist visited from ‘Museum of Contemporary Art’ to ‘Cheonjiyeon Waterfall’ via ‘Sanbangsan Mountain’, ‘Saeyeongyo office’. The tourist visited total of four locations. The proposed recommendation system represents the optimal route with respect to distance i.e., ‘Museum of Contemporary Art’ to ‘Saeyeongyo office’ via ‘Sanbangsan Mountain’ and ‘Cheonjiyeon waterfall’. In the optimal route, a tourist can visit four locations.
The actual and optimized path presented in
Table 6 is shown on map in
Figure 14. From the map, we can clearly see the difference between the actual and optimized path. In the actual path, a tourist travelled from ‘Museum of Contemporary Art’ to ‘Sanbangsan Mountain’. The path was very lengthy and curvy. The tourist then travelled from ‘Sangbangsan Mountain’ to ‘Cheonjiyeon Waterfall’ via ‘Saeyeongyo’. Whereas the proposed recommendation system suggested to visit ‘Saeyeongyo’ via ‘Cheonjiyeon Waterfall’ as it covered less distance and time. From the map, we can see that the actual route covered 53.4 km whereas the optimized route covered 46.8 km.
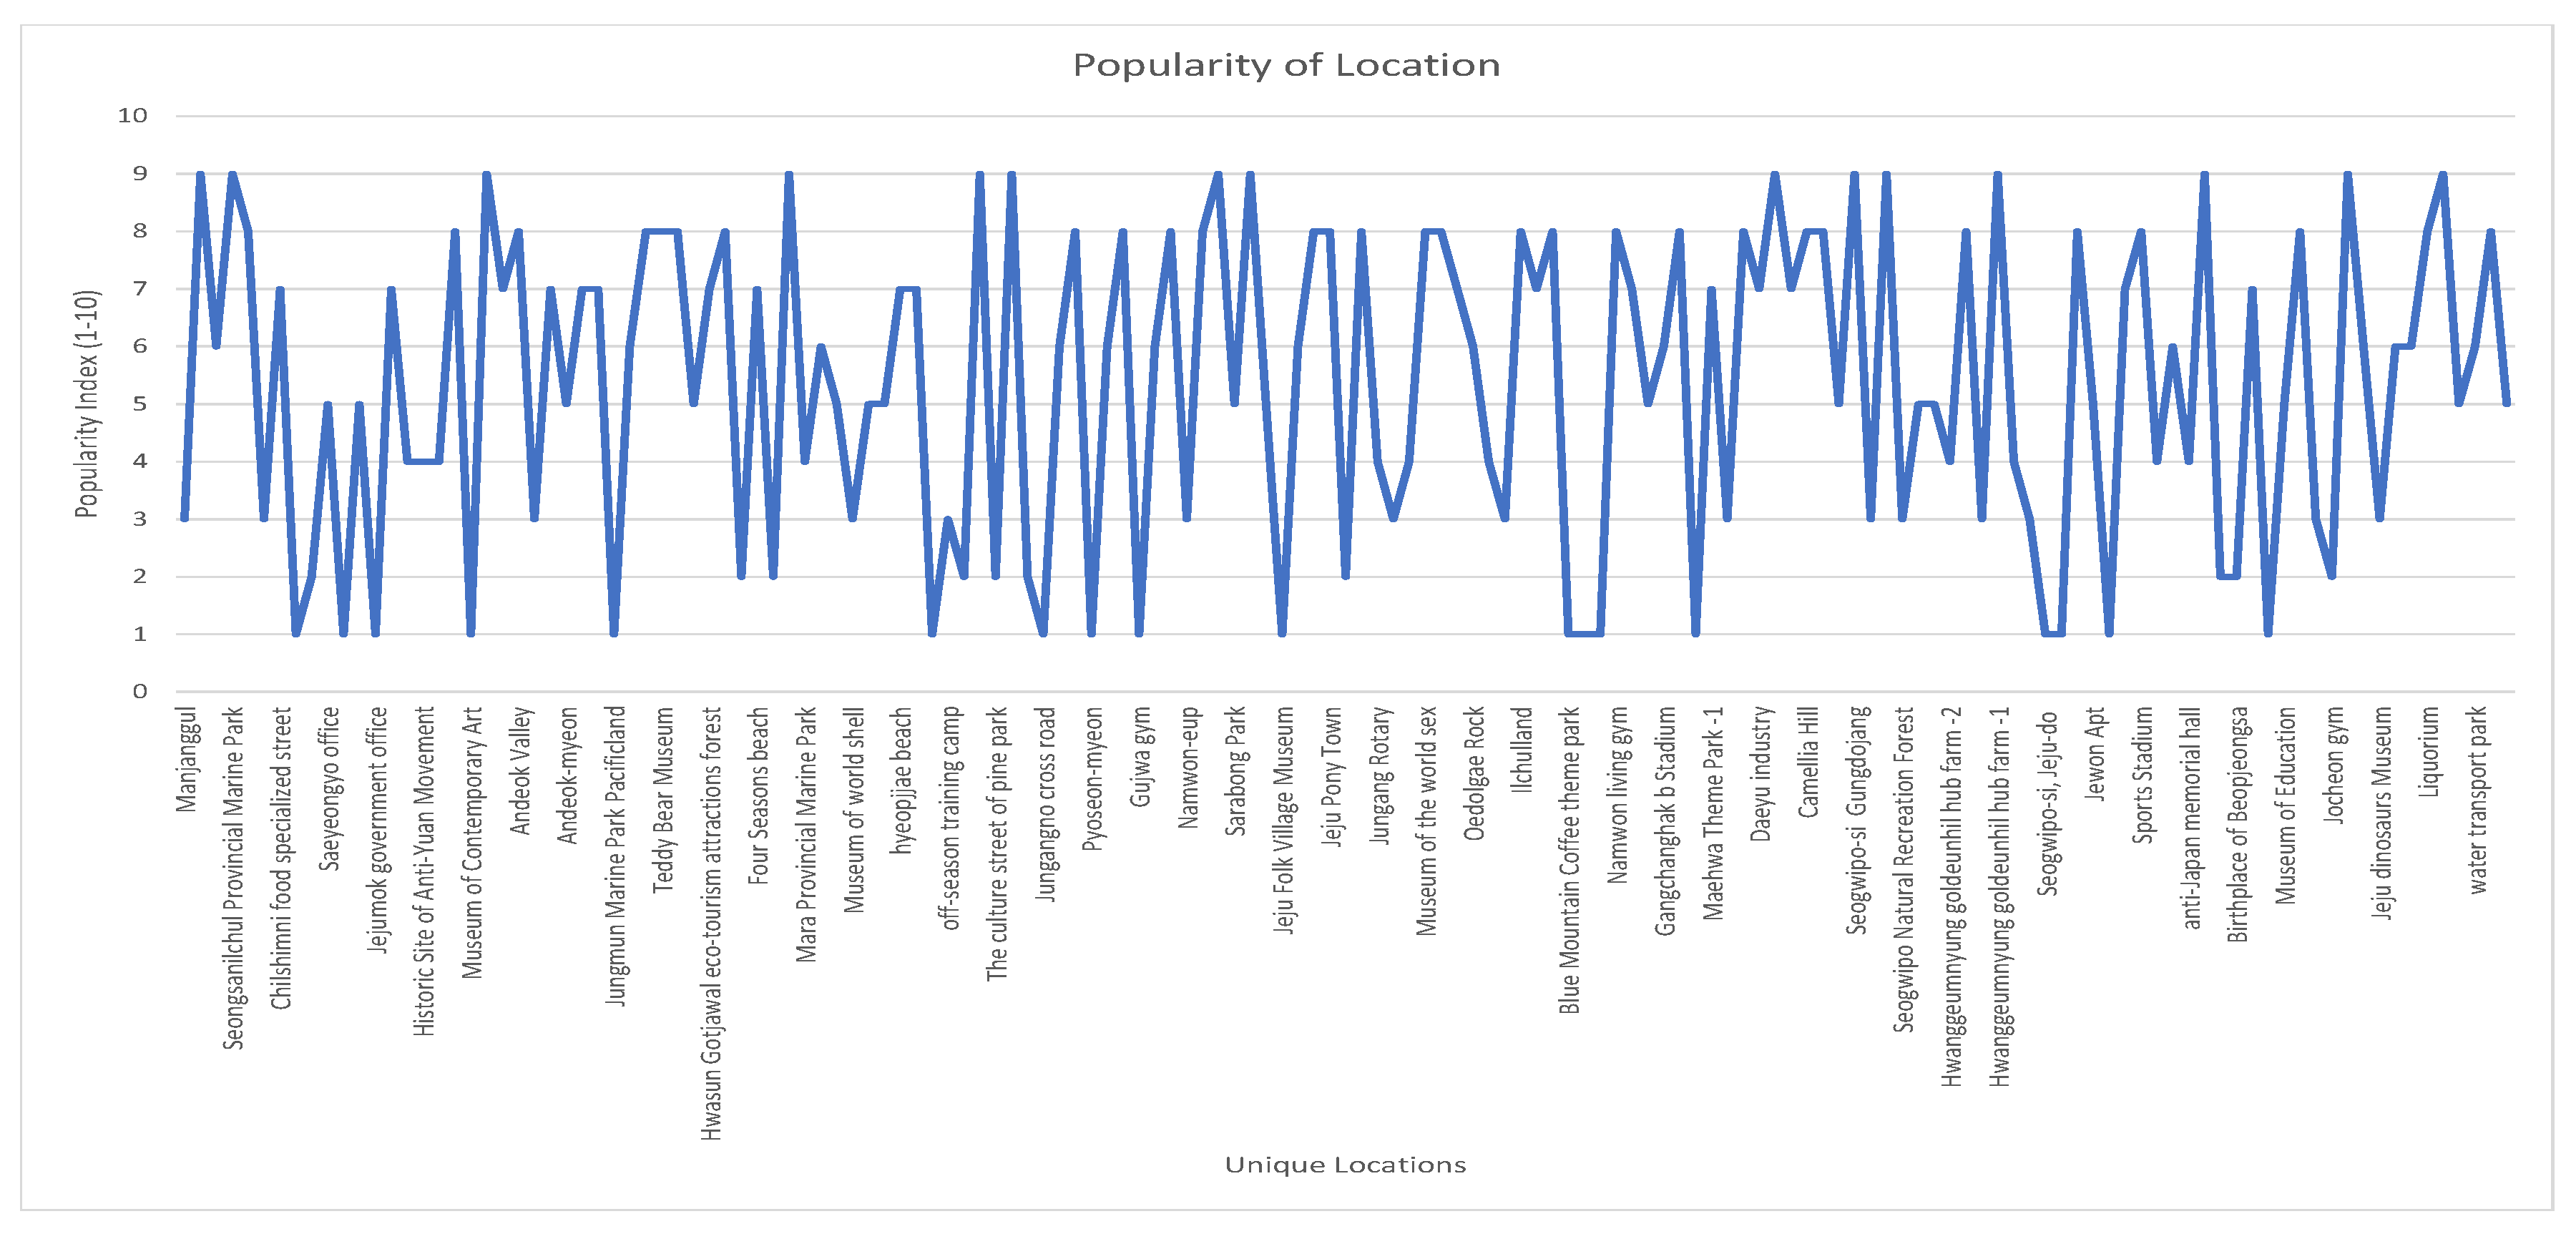
Figure 15 represents the data of tourists visiting locations with respect to popularity of the location. We have split the locations from the actual route and calculated the popularity index ranging between 1–10. The proposed recommendation system suggested the optimal route based on the popularity of nearby locations so that user can visits maximum number of popular locations before reaching the destination in less time and distance. Popularity of the location was calculated using the Bayes model. We have calculated the popularity of the location based on the data collected within the year 2016–2017.
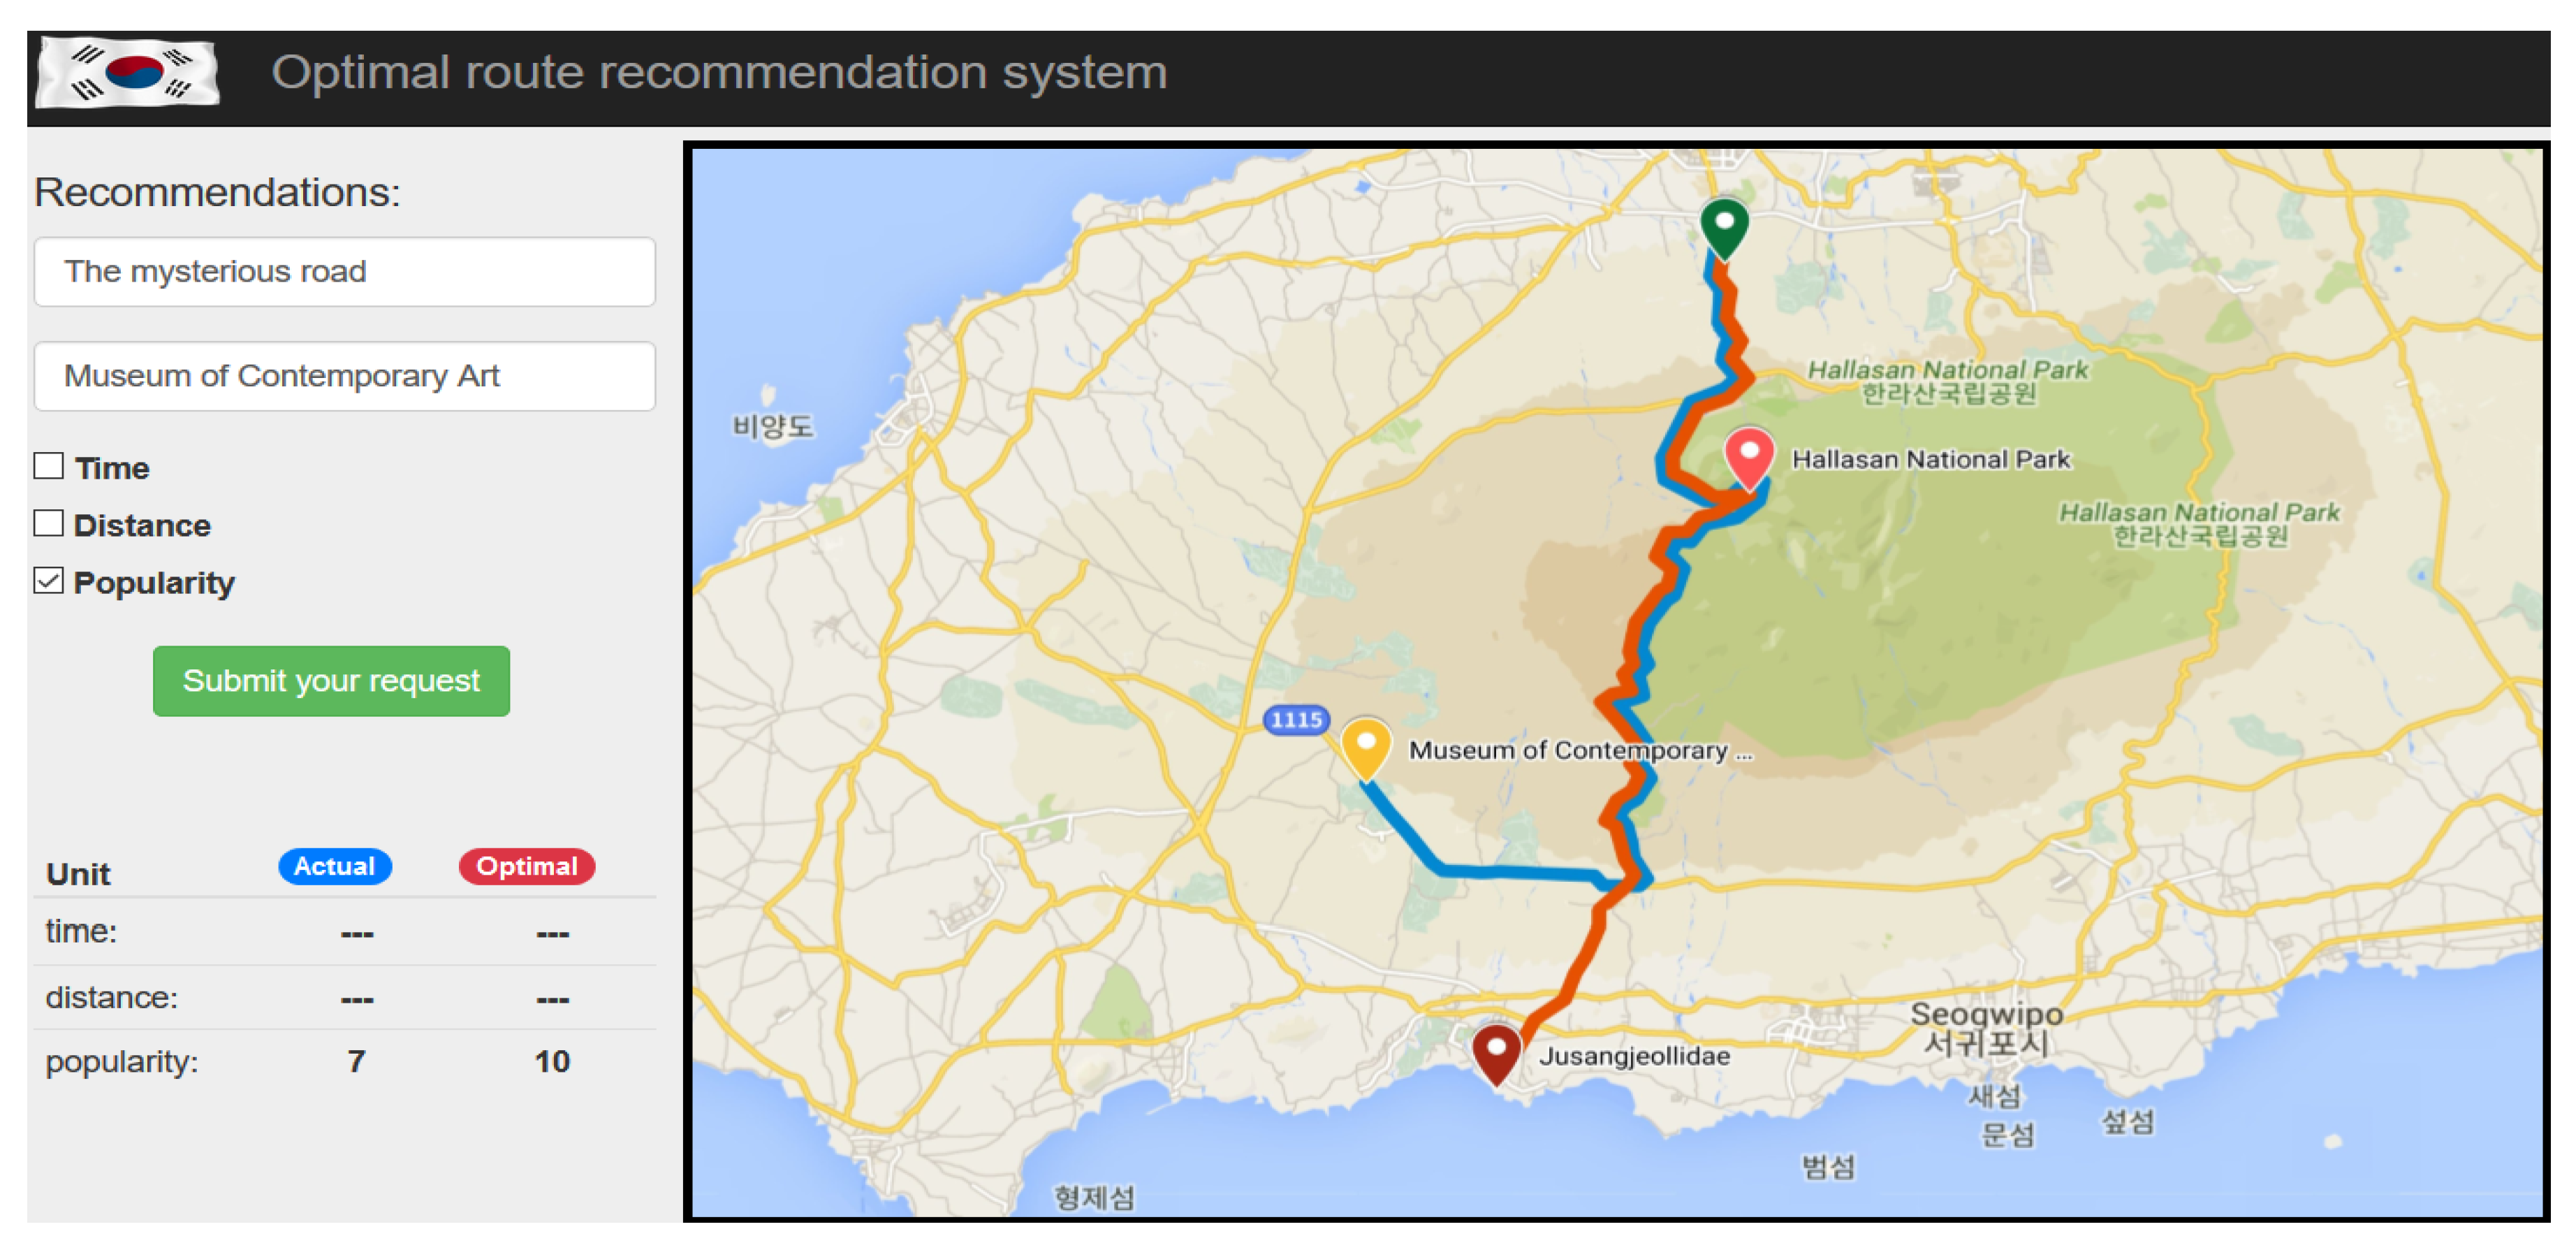
Table 7 shows one example of actual route and optimal route from the dataset with respect to popularity of the location. In the actual route, a tourist visited from ‘The Mysterious Road’ to ‘Museum of Contemporary Art’ via ‘Hallasan National Park’. The tourist visited a total number of three locations. The proposed recommendation system represents the optimal route with respect to popularity of the location i.e., from ‘The Mysterious Road’ to ‘Jusangjeollidae’ via ‘Hallasan National Park’. In the optimal route, a tourist can visit three locations.
The actual and optimized path presented in
Table 7 is shown on map in
Figure 16. From the map, we can see clearly the difference between actual and optimized path. In the actual path, a tourist travelled from ‘The mysterious road’ to ‘Museum of Contemporary Art’ via ‘Hallasan National Park’. Whereas the proposed system recommended the tourist to travel from ‘The mysterious road’ to ‘Jusangjeollidae’ via ‘Hallasan National Park’ based on the user preferences and popularity index. From the map we can see that popularity index of the actual route was 7 and the popularity index of the optimized route was 10.
8. Discussions
This section focus on the challenges, implications, and limitations in the development of proposed recommendation system in tourism industry. A web-based recommendation system is developed to aid the tourists destination selection process and accommodate individual traveller’s preferences. There were several challenges in the development of the proposed recommendation system such as handling huge amount of data, changing data, changing user preferences, unpredictable weather and traffic. Real-time big data is used in this study to analyze the tourist movement pattern. We used the Pandas library to deal with the large dataset. User preferences may also change over time, so we had to update the user preferences to recommend optimal route. There are some unpredictable situations such as weather. Weather is inevitable. Similarly traffic is also unpredictable. We had to use open source APIs to deal with unpredictable situations.
This finding has several implications. Firstly, the proposed recommendation system recommends optimal route that is based on the user preferences i.e., time, distance, and popularity of location. It is not always necessary that the shortest route will take less time to reach destination. Short route may take more time due to weather condition or traffic situation. Weather plays a major role in tourism. It must be taken into account while planning a tour as unexpected weather may effect the tour. To predict weather condition, we have availed the services of OpenWeatherMap API. Similarly traffic also plays a major role in tourism. If there is heavy traffic on one route, it provides alternative route for the convenience of tourist even if it is far but takes less time to reach the destination. We have availed TomTom Traffic Stats to find the current situation of the traffic. Secondly, the proposed recommendation system recommends optimal route that is based on tourists profile. A tourist’s profile includes locations that attract the tourist, the tourist’s sex and age. Tourists can prioritize locations of interest from the categories. A tourist’s attraction may vary from person to person. In this study, we have categorized tourist’s attraction into six major categories i.e., cultural heritage, ancient historical sites, art galleries, restaurants, seaside views, and theme parks. These tourists attraction may also vary age-wise and gender-wise.
From the statistics shown in
Figure 1, we can conclude that tourists within the age-group of less than 15 mostly like to visit theme parks, teenage tourists most likely to go to seaside views. Adults are most likely to go art galleries or cultural heritage and senior citizens are most likely to go to ancient historical sites. Similarly, tourist attractions may also differ gender-wise. Formulating an objective function is not an easy task in such scenario. The purpose of objective function is to minimize distance and time, and maximize popularity index of location.
Even though the objective of the study was achieved, there were some limitations that were identified. The challenges and limitations of the proposed system include group recommendation, privacy, serendipity, and security. Tourists normally travel in groups and the proposed recommendation system specifically focus on a single tourist rather than a group. When tourists travel in groups, the main challenge is to combine the preferences of each individual and recommend optimal route that is acceptable by every group member. Privacy also plays an important role in the travel recommendation system as it includes the user information and preferences so it becomes crucial to protect the privacy of the users. The current proposed system provides limited privacy about user information, but user preferences are used for analysis purpose and statistics are available to other users. In the tourism domain, serendipity can be explained as if a tourist is interested in interested in art history, there is a chance that a user might be interested in ancient monuments which is completely different. Such models are trained using machine learning algorithms. Current proposed recommendation system lacks such model. In future, we may use different machine learning techniques that are capable of processing large amounts of behavioral data. Another challenge to the current proposed system is security. Travel recommendation systems are vulnerable and it is necessary to protect the system from different types of attacks. For example, a malicious user can create fake accounts and down-rate the system. The current proposed system does not provide the authenticity of the user that may validate the user information.
9. Conclusions and Future Direction
In this study, we work on the real data set which includes famous tourist spots in Jeju Island, South Korea, collected from the Wi-Fi router. We have classified regions into six categories i.e., cultural heritage, ancient historical sites, art galleries, restaurants, seaside views, and theme parks. Popularity of location can vary from person to person, season-wise. We used a naïve Bayes classifier to find out the probability of tourists going to visit next location from big data. We used third-party APIs to find the longitude and latitude of the location. Using the Haversine formula, we calculated the distance between the locations. We have taken three factors into consideration to recommend optimal route i.e., time, distance, and popularity of location. Beside these factors, we also considered weather and traffic conditions. On the basis of these factors, we recommend the optimal route for tourists using optimization objective function. The proposed system is highly responsive to mobile users. The results of this system show that the recommended routes allow tourists to visit maximum number of famous locations based on user preference, weather, and traffic. Experimental tests and results conclude that optimal is comfortable and convenient for tourists as compared to actual route. In future, we can extend this work by introducing natural language processing (NLP) techniques in proposed recommendation system to facilitate non-English speaking tourists.


