Abstract
The electric power system infrastructure has begun to adopt digital information technologies such as transmission control protocol/internet protocol (TCP/IP) and Ethernet infrastructures. With this adoption, information technology-centric network and system management (NSM) tools are used to manage the intermediate communication systems and electric devices in digital substations. However, the technology to monitor the cyber–physical System (CPS) statistics for the intelligent electronic devices (IEDs) and serial communication for a digital substation does not exist yet. In this paper, we aim to propose cyber-physical analysis methodologies of a digital substation system, concerning issues of (1) International Electrotechnical Commission (IEC) 62351-7 based network and system management, (2) behavior analysis of the CPS, (3) cyber–physical anomaly detection systems, and (4) a testbed for a digital substation. By collaborating with Electric Power Research Institute (EPRI), a cyber security testbed for the digital substation has been developed to implement the use cases and analyze potential security threats. Newly integrated methodologies for information handling are expected to lead to improved safety and reliability for the CPS of electric power grid systems.
1. Introduction
The rapid pace of change in the electric power grid creates a challenging environment for asset owners and operators of an electricity infrastructure to monitor the activities of industry and standards organizations, develop an understanding of the security impacts of new technologies, and assess and monitor cyber security risks. Power system operators in a utility require not only comprehensive backgrounds in the physical monitoring of field devices, but also cyber monitoring of intelligent electronic devices (IEDs) in a digitalized substation. Thus, a comprehensive approach is required to utilize cyber–physical system (CPS) interactions, to provide insight by various monitoring tools, architectures, guidelines, and testing results.
To address the need for improved operations and visibility in the power grid infrastructure, companies in the utility industry have begun to adopt information and communication technologies, such as TCP/IP and Ethernet. With this adoption, IT-centric network and system management (NSM) tools are widely used to monitor and manage communications with and between intermediate cyber systems and field devices. International Electrotechnical Commission (IEC) 62351-7 represents a technical specification that attempts to address the need for a single set of NSM definitions regarding the security for the IEC 61850 protocol. This specification focuses on power system infrastructure to address telecommunication management, as well as cyber security monitoring and management. Previous literature [1,2] has provided a transformation of IEC 62351-7, so that it can be implemented.
Chen et al. [3] propose a modeling of cyber security status of the digital substation by the Markov decision process (MDP), but it only focuses on the design of the detection of cyber security attacks in a limited-use case. Moreover, the model does not consider cyber–physical analysis concerning IEC 62351-7-based network and system management.
In further literature from Cai et al. [4], the authors review cyber challenges in the digital substation and analyze several secure communication mechanisms of the IEC 62351 standard. However, they have not proposed an application specific for an IEC 62351-7-based network and system management. Also, they did not consider implementation and testing on the cyber–physical testbed of the digital substation.
The cyber–physical testbed for the substation environment was introduced in Hong et al. [5], to study the interactions between a complex power system and the information and communication technologies (ICT) system. However, the authors have not provided the modeling and simulation for a cyber–physical assessment of the substation. Also, it did not employ the multiple devices supporting IEC 61850 protocol with different manufactures, which is common in utility environments.
In Sarralde et al. [6], the authors address the difficulty of installing IEDs from different manufacturers within the same cyber security system. They emphasize the need and requirement for additional definition and implementation to manage digital substations. However, they have neither further research on the actual definition, nor the implementation applicable to protection and control IEDs.
In IEC 62351-7, NSM data objects are defined to monitor the health of networks and systems, to detect possible security intrusions, and to manage the performance and reliability of the digital substation infrastructure [7]. The goal is to define a set of abstract objects that will allow the remote monitoring of the health and condition of intelligent electronic devices (IEDs), remote terminal units (RTUs), distributed energy resources systems (DERs), and other systems that are important to power system operations. However, the first edition of IEC 62351-7, published in 2010 [1], was described in high-level viewpoints that made it challenging for utilities and manufacturers to adopt the standard [8]. The second edition was published in July 2017, and it constitutes a technical revision that includes the following significant technical improvements:
- NSM object data model has been reviewed and enriched in detail. In the first edition, there are 137 NSM object definitions that fall into three categories: end-system health monitoring, communication health monitoring, and intrusion detection. In the second edition, there are five major agent categories: environmental, IED, clocks, interfaces, and application protocol. Also, the application protocol agent has been further enriched for IEC 61850, IEEE 1815, and IEC 60870-5.
- A Unified Modeling Language (UML) model has been adopted for the NSM object description. The NSM object definitions are abstracted using the UML. It defines NSM objects using UML description tools, UML class, or class attributes to allow flexibility of the mapping between the objects with different NSM protocols.
- Simple network management protocol’s (SNMP’s) management information base (MIB) translations are included as code components. Standard MIB objects are provided to enable SNMP in a simplified manner. SNMP protocol is compatible with MIB browsers available today, allowing users to browse detailed definition and data formats easily.
This research integrates information about potential cyber and physical security threats in a way that is intended to provide broad power industry and public benefits. Information integration facilitates faster and more coordinated responses to system threats, leading to improved system reliability. The public benefits of this project involve newly integrated information handling that is expected to lead to improved safety and reliability for the delivery of electric service [9].
To support utilization of the IEC 62351-7 SNMP MIB, further research has been conducted [10,11]. This research provides a review of manufacturers’ implementations, and includes a technical guide for exposing relevant IEC 62351-7 NSM objects via SNMP. Equipment manufacturers [12] may use this guidance to incorporate the SNMP MIBs into their products. Utilities using products supporting the 62351-7 MIBs may develop a more comprehensive, cohesive, and focused view of security and situational awareness for the monitored systems.
One tool developed to demonstrate the functionality and utility of the IEC 62351-7 SNMP MIB is Korea Electric Power Corporation’s (KEPCO) NSM Sensor. Our work is to integrate and test a development prototype of KEPCO’s NSM Sensor in EPRI’s Knoxville Lab. Integration and testing of the prototype demonstrates the utility of the technology and the benefits provided by use of the IEC 62351-7 MIBs for securing electric sector infrastructure.
The contributions of our work are as follows. First, we propose NSM application and integration using a cyber–physical security testbed. The testbed can be applicable for assessing and monitoring risk in a digital substation environment. Second, IEC 61850 protocol’s specification-based metrics are newly investigated. To this end, the generic object-oriented substation environment (GOOSE) and manufacturing message specification (MMS)’s specific factors are captured from this experimental data, and used for the proposed NSM use cases. Third, we test the real network traffic data captured from both the North American and South Korean digital substation environment. As far as we know, Korea has adopted one of the most advanced smart grid technologies in the world, strongly driven by the government. To our best knowledge, this work is the first attempt to analyze real operational network data of both the U.S. and Korean smart grid environments, which is globally applicable to any other countries employing the IEC 61850 protocol in the smart grid.
2. Network and System Management in Substations
The concept of NSM was presented in [2,7]. Within IEC 62351-7, the objects include both monitoring and management aspects of the CPS. The objects may build on the legacy discipline of embedded devices, hardware, and software, whose major mission is not for computation. By utilizing NSM objects, the CPS integrates the dynamics of the physical processes with servers, software and intermediate systems; and it provides abstractions, modeling, design, and analysis techniques for the integrated substation environment in the power grid. This is aligned with typical IT network environment and network technologies that utilize both monitoring and management capabilities. These capabilities include the monitoring and management of
- Servers used as general-purpose computational platforms, which are used for widely accessed applications, such as web portals/pages, file transfer protocol (FTP), mail, etc.
- Embedded devices used as the core physical components of an electric grid, which are used by grid operations as well as supervisory control and data acquisition (SCADA) and energy management (EMS) systems.
- Intermediate systems, such as firewalls, routers, and Ethernet switches.
The capabilities described above have common general features with a typical IT environment. However, similar to the IT environment, the topology viewed by the developers of IEC 62351-7 employs communications protocols not found in typical IT environments. These include serial protocols, such as distributed network protocol 3 (DNP3), Modbus, and additional protocols such as IEC 61850, used for electrical substation automation. A typical 154 kV substation using the IEC 61850 standard in Korea [13] has been constructed, as shown in a single line diagram of Figure 1. A substation consists of physical field devices of the substation switchyard and remote digital systems of the control center. In Figure 1, a physical substation switchyard is depicted by a black solid line, and IEDs and digital control centers are depicted by a green and blue dotted line, respectively. The electronic current transformer (CT) and power voltage transformer (PT) are depicted by a red line. These electronic signals are mapped with digital output, using a merging unit shown as yellow box in Figure 1. Then, the substation system transmits the process measurements to digital protection IEDs in a process bus. A detailed symbolic notation for circuit breakers, transformers, process bus, station bus, switches, and feeders can be found in [14].
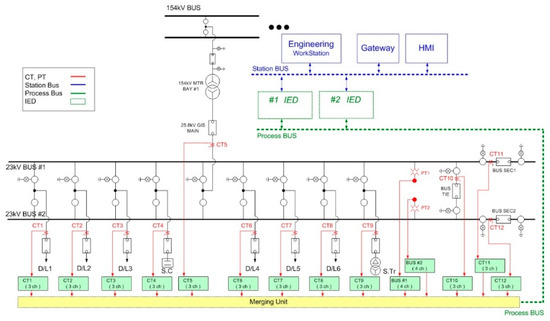
Figure 1.
Single line diagram of a substation [14].
In Figure 1, physical equipment in a substation is managed by either protection, control, or measurement IEDs. The key insight gained from Figure 1 is that cyber–physical interaction between physical and digital component is critical in a substation automation environment. The concept of NSM then provides the description of the real-time interaction between remote digital systems and the physical switchyard devices.
Support for the protocols used in a substation is outside of the typical IT NSM environment. It includes exchanges between master/slaves, clients/servers, and publisher/subscribers. These monitored exchanges include, but are not limited to, IED to IED, master station to IED, and RTU to IED.
The typical exchanges show a simplified network infrastructure, as shown in Figure 2, which consists of two local area networks (LANs) that are connected to each other through the use of routers and firewalls. Each LAN is created through the use of ethernet switches. The wide area network (WAN) that bridges the two LANs provides connectivity, which allows the IEDs to exchange information with each other through a SCADA system. To provide access control functionality, each local network is protected by firewall (located in front of routers).
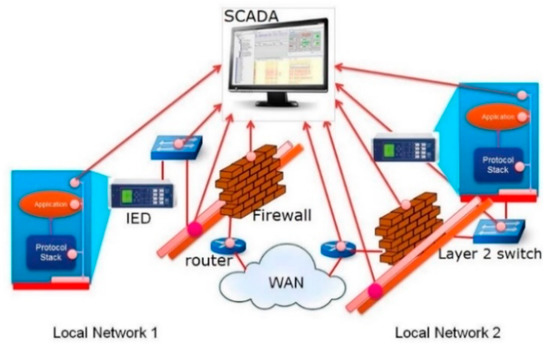
Figure 2.
International Electrotechnical Commission (IEC) 62351-7 network and system management (NSM) capability.
In addition to typical IED-to-IED information exchange, such as remote protection and control activities, networks supporting critical infrastructure may also require IED NSM capabilities. Information supporting NSM may be available from multiple cyber–physical sources within the network, as depicted with red dotted points of the cyber and physical system in Figure 2.
Many of these monitoring points may already be available through existing communication channels, such as switches, routers, and firewalls. This allows utilities to plan transition and migration strategies [15] by the addition of a “monitoring agent”, shown in Figure 3. The definition extends the ability to react to issues that were either unmonitored before or monitored in a proprietary manner. However, the ability to integrate NSM information from IEDs has not typically been extended to network control or operations centers. Further, the presentation of IED NSM information has not been standardized.
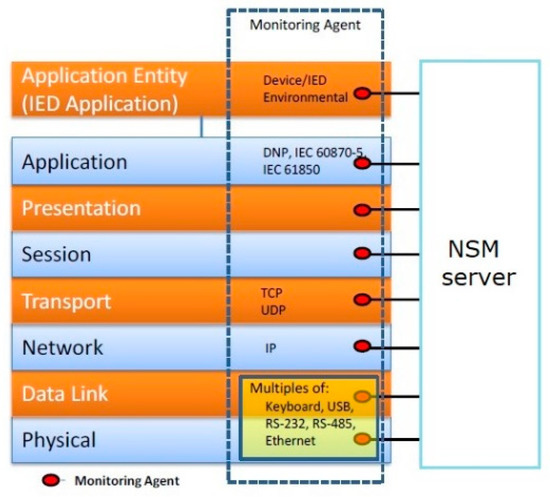
Figure 3.
Identified IEC 62351-7 monitoring agents.
The typical IED, although it may be utilizing TCP/IP technology for communication, does not utilize common IT protocols—for instance, FTP and hypertext transfer protocol (HTTP)—for the exchange of real-time control and status exchange. Typical protocols utilized for IED information exchange are IEC 60870-5, DNP 3.0, and IEC 61850. There is no native NSM support within these protocols [8]. We note that the previous works [16,17,18,19,20,21,22,23,24] did not consider NSM application within these protocols. Moreover, none [25,26,27,28,29,30,31,32,33,34,35,36,37,38,39,40,41,42] focused on NSM use cases and integration with field devices. In this paper, we tested the lab substation equipment and programs implemented to utilize NSM use cases.
2.1. IEC 61850-Based Digital Substation Monitoring
There are substantial research and several commercial products available on intrusion detection and network monitoring in the SCADA environment. While previous research on intrusion detection has mainly focused on the Modbus and DNP3 protocols, there is no commercial product for intrusion detection in the IEC 61850-specific protocols or for the physical status of an electric field device. In previous work, Lahza et al. [9] used an IEC 61850-specific feature set to detect distributed denial-of-service attacks (DDoS), but it only monitors the network traffic statistics, and does not include the control command level feature sets on a field device; thus, it lacks the physical status monitoring of the power grid itself.
The IEC 61850 protocol and function commands are used widely for the standard communication between heterogeneous smart grid systems, such as SCADA, micro-grids, electric vehicle charging infrastructure, demand response (DR), and DERs. The IEC 61850 protocol stack depicted in Figure 4 requires thorough analysis to ensure secure implementation when a new system is deployed. The critical nature of protection switching within substations was one of the principal challenges addressed in the development of IEC 61850 network protocols and related network design guidelines. A major development was the definition of GOOSE. GOOSE messages have a direct mapping into the Ethernet, bypassing the overhead of TCP/IP protocols. GOOSE messages are recognized by compliant Ethernet switches to have preemptive priority over network traffic. Within five milliseconds of a critical system event, GOOSE messages are required to multicast to other registered IEDs attached to the Ethernet-based network, replacing earlier generation station bus-type communications.
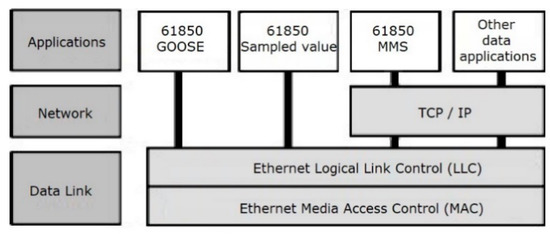
Figure 4.
IEC 61850 protocol stack.
Ethernet switches involved with protection signaling must be capable of recognizing GOOSE messages and forwarding them on a preemptive priority basis. When using GOOSE, as shown in Figure 5, all access control should be managed in the Ethernet layer, using media access control (MAC) addressing and application identification (ID) whitelisting strategies (in Figure 5, the actual configuration of the source and destination IP/ports are hidden for internal security reasons). This may require additional system changes. For example, the conventional 5-tuple, signature-based snort rule [12] requires an extension, using a 9-tuple signature structure as shown in Table 1. Snort rule is an open source-based intrusion detection system, capable of real-time traffic analysis and packet logging, but it does not support the analysis of the domain-specific industrial control protocols.
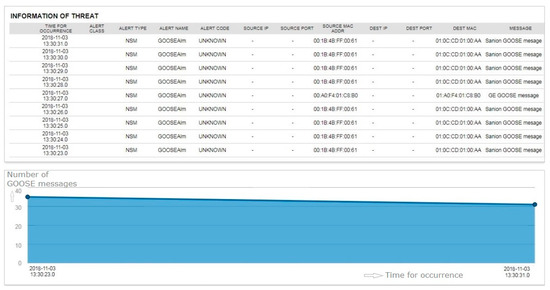
Figure 5.
Generic object-oriented substation environment (GOOSE) packet monitoring.

Table 1.
The IEC 61850 extended feature set used in this paper.
If the address, port, or application ID is not in the corresponding whitelist, the detector takes action to alert. For example, the TCP port for IEC 61850 is <102>, and should be required by the whitelist. Similarly, the simple network time protocol (SNTP) is extended, as used to synchronize time utilizing an SNTP server. SNTP adopts user datagram protocol (UDP) connections in the transport layer on port <123>. These newly extended fields were implemented and tested during the current project.
2.2. Network Flow-Based Situational Awareness
Traffic patterns are used to define the whitelist in the open system interconnection model, and identify the permitted protocols for smart substation networks only. In terms of the station bus in IEC 61850, only MMS and SNTP traffic are allowed. In terms of the process bus, GOOSE, sampled value (SV), and IEEE 1588 (precision time protocol, or PTP) traffic is allowed. Moreover, on each source and destination pair in the network flow, statistical trends of the traffic volume and traffic frequency are checked. Table 2 provides the data structure for the network flow analysis result.
Table 2.
Data structure of network flow.
Network flows have been considered one of the key characteristics of SCADA networks in smart substations, compared with IT networks. The statistical property defines the upper and lower threshold values of each network flow, and summaries are compared against the baseline. Deviations of the network flow that fall outside of the normal thresholds could indicate problems with the network, or be an indicator of a potential attack.
A network flow is defined from the captured network traffic by each distinguished pair of a source and destination IP/MAC/port/protocol. Each distinguished pair is labelled by the unique flow sequence number. In this paper, each defined network flow is summarized by the following statistics:
- packet transfer rate per second (PPS)
- transfer byte size per second (BPS)
- the length of packets (LoP)
- the size of packets (SoP)
From a network flow analysis results, on an hourly, daily, and monthly basis, each flow sequence number is characterized by the distinct operation pattern within a digital substation, due to its unique behavior on a regular form. The unique behavior of each flow sequence is categorized into one of the four behavior characteristics in power equipment: settings, failure, security, and performance monitoring. The function command of an end device is sent, within the same packet transfer rate and transfer byte size, the length and size of packets. The device then identifies the statistics value of each network flow by the sample mean vector y, whose jth element () is the average value of the N observations of the jth variable ():
Based upon using normal IEC 61850 traffic contents as a baseline, the regular traffic flows and predictable device behavior patterns can be specified in the analytics engine in the sensor. Any occurrences outside the lower and upper threshold values of the network flow statistics are considered anomalous and suspicious. If any of the aforementioned network flow thresholds are violated, the sensor generates an alert at one of three levels: critical, major, and minor. This alert is then sent to the sensor monitoring system for processing. The three levels are predefined, based on the severity and importance of an event to the deploying organization. The situational awareness of a substation manages the alarms that can presented to security operators in a smart substation. It also summarizes the number of alarms and the types of NSM alarms.
2.3. Intelligent Electronic Device Management
Substation configuration language (SCL) files are used to exchange the configuration data of an IEC 61850-based substation. They are also used to describe configurations of all IEDs using object models, and specify a unified and standardized format for configuring IEDs within the substation [13]. Therefore, using the SCL file as the input into the sensor, the security and interoperation information for a substation can be imported as a virtual model of each IED.
A typical SCL file utilizes specific, syntactic XML schema structures, and contains five elements: Header, Substation, Communication, IED, and DataTypeTemplates. In each element of an SCL, a tree node represents either a logical node, a type of data object, or a type of data attribute. To comply with the same syntax structure as the SCL file, the security sensor uses a tree structure to visualize and display substation assets and their respective communications within the hierarchy, as shown in Figure 6.
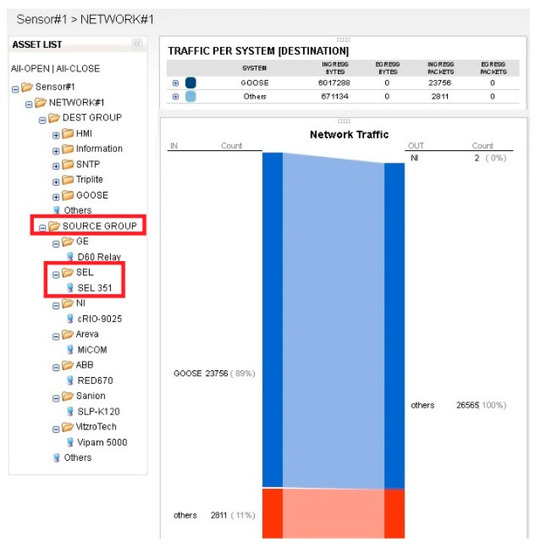
Figure 6.
Intelligent electronic device (IED) management—example asset hierarchy of a digital substation.
The hierarchy of the source group in Figure 6 is created automatically by the syntax parsing of IED elements in IEC 61850 standard-based SCL files. The system manages detailed IED information with respect to the manufacturer of the IED. In the EPRI Knoxville testbed, there are seven different manufacturers listed in the source group, as shown in Figure 6. Each manufacturer’s hierarchy folder expands the actual name of IED device model. For instance, the deployed device “SEL 351” is created in the hierarchy from the IED name object field in the SCL file, and is grouped under the manufacturer name of “SEL”. The substation administrator has been challenged to manage the asset list and its detailed IED configuration by SCL file. Thus, an automated hierarchy of the asset list enables IED configuration management efficiently by the import function within the system.
By checking the SCL file, the maximum number of instantiable report control blocks for each IED is defined, and used in the configuration of the security sensor. The GOOSE application protocol data unit (PDU) has twelve fields. These fields are defined as follows:
- gocbRef (control block reference)
- timeAllowedToLive
- datSet (data set reference)
- goID (GOOSE ID)
- t (event timestamp)
- stNum (state number)
- sqNum (sequence number)
- test (test identifier)
- confRev (configuration revision)
- ndsCom (needs commissioning)
- numDatSetEntries (number of data set entries)
- allData
GOOSE multicast addressing is configured in the SCL file, and the first three octets of a GOOSE destination address are predefined as (01-0C-CD). Using this information, the security sensor validates each GOOSE packet, using the destination address preamble the configuration from the SCL file.
Moreover, the changes to the state number (stNum) and the sequence number (sqNum) in the GOOSE application payload must strictly comply with the associated IED behavior patterns. The value of stNum shall change incrementally when a value of datSet has changed in the sent GOOSE message, which shall also cause the value of the sqNum to be set to zero. When the value of stNum has no change, the value of sqNum will change incrementally for each GOOSE transmission, but it shall roll over to 0 at its maximal value of 4,294,967,295. Thus, the security sensor manages stNum and sqNum changes, as shown in Figure 7, and alert about abnormal behavior of the GOOSE transmission.
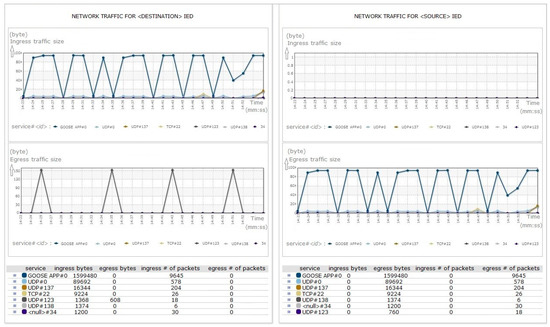
Figure 7.
IED management—graph view of each IED’s application level.
In the case of analysis on GOOSE transmissions from one source IED to another destination IED, as depicted in Figure 7, the network pattern of the destination IED’s ingress traffics are the same with the source IED’s egress traffics. They are identical with regard to the traffic size and the number of packets, regardless of the time. However, the destination IED’s egress traffics may differ with the source IED’s ingress traffics. There is no traffic allowed on a local network back towards the source IED, although the destination IED attempts to transmit egress traffics based on destination IED’s own setting.
3. Behavior Analysis Using Network and System Management Objects
The advent of an implementable set of IEC 62351-7 MIBs and definitions allows the NSM visibility gap to be closed and the construction of concrete behavioral analysis for a digital substation of CPS. During the development of the behavior analysis mechanism, several observations were made:
- The current generation of IEDs do not support the information required to create the IEC 62351-7 MIBs. This will be changed as the standard to be published for wider visibility.
- It was found that the switches and routers had proprietary MIB information that could be mapped into IEC 62351-7 MIBs to create a demonstration that utilized standardized MIB definition.
- The use of the standardized MIBs allowed the use case demonstration to be successful. In some cases, proprietary MIBs were utilized unmapped, for the purpose of convenience and to meet the timeframe.
- During the creation of the demonstrations, it was discovered that IEC 62351-7 did not have information regarding clock synchronization or clock tampering. These MIB definitions were developed and forwarded to IEC for standardization. IEC has accepted the definitions that were developed.
Staging demonstrations of the behavior analysis allowed us to see the benefits of the extended NSM architecture, and to provide feedback and ideas for future demonstration expansion. Our major goal is to describe the behavior analysis use cases that drive the normal operation status of the digital substation. We also aim to demonstrate and evaluate the application of the 62351-7 MIB definitions [7]. The behavior analysis models are newly defined in this paper, and are categorized into four different types and 15 scenarios as follows.
3.1. Intelligent Electronic Device Clock Synchronization Monitoring
3.1.1. External Clock Synchronization Failure
If the external clock source has failed and is no longer present, then NSM sensor send the alert notification to the NSM manager, which results in issuing the work order to the maintenance operator.
3.1.2. Clock Accuracy Change
An IED calculates its precision drift after time synchronization, and would allow an alert if the drift exceeds a configured threshold value. The appropriate MIB element would be set, allowing the NSM sensor to send the alert notification to the NSM manager, which results in issuing the work order to maintenance operators.
3.1.3. Clock Tampering Detection
There are two prevalent types of tampering: front panel clock tampering, where the clock is set forward or backward beyond a prescribed amount; and clock source tampering where one of the clock sources has had its clock changed. The use of multiple time sync sources via GPS, Inter-range instrumentation group - B time code (IRIG-B) and multiple IEEE 1588 (Precision Time Protocol) will allow an NSM sensor to send the alert notification to the NSM manager, which results in the system administrator or analyst selecting another time source.
3.2. Physical Security Perimeter Monitoring
The power system equipment of a substation is widespread and located at a remote site. On-site maintenance work requires physical access to a substation perimeter. Wired, direct access to a substation network is a common way to monitor and maintain a substation on-site. The main problem of physical security points is that they may not be correlated with adequate cyber security features; thus, they may lead to an incorrect behavior analysis of on-site maintenance work. Therefore, physical access control is defined by each physical component of a substation, e.g., the fence or gate of a substation site, door to the control center, and the device port of IEDs.
3.2.1. External Physical Security Perimeter Breaches
The fence or gate surrounding the actual substation is monitored and set to the appropriate MIB element if the barrier is crossed. It would then notify the substation engineering team about the physical intrusion, and be cleared when the intrusion has been mitigated. Figure 8 illustrates the interaction with both the operation and IT/telecom environments. Operation and IT/telecom initiate the workflow on the work management system to mitigate the detected problem. This interaction and the workflow both run on the other cyber–physical response scenarios as well.
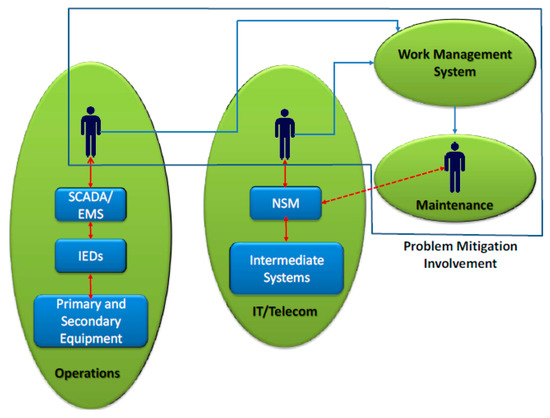
Figure 8.
Substation behavior analysis using network and system management (NSM) objects.
3.2.2. Control Center Door Monitoring
The door to the control center or control racks is monitored as the second level, and sets the appropriate MIB element if the barrier is crossed. This door would then notify the substation engineering team about the intrusion, and be cleared when it has been mitigated.
3.2.3. Intelligent Electronic Device Physical Access
A physical connection to the IED is monitored, and sets the appropriate MIB element if the access plugged into the external physical port is appeared. The NSM sensor would then notify the substation engineering team about the intrusion, and be cleared when it has been mitigated.
3.3. Digital Certificate Monitoring
3.3.1. Detection of Impending Certificate Expiration
The number of certificates exceeding 70% of their validity period is monitored, and the NSM event is triggered to query substation engineering to take steps to renew the certificate and clear the event.
3.3.2. Detection of Configured Use of an Expired Certificate
A critical situation occurs when the utility allows a certificate to expire; in that case, an NSM event is triggered to query the substation engineering team to take steps to update the expired certificate and clear the event.
3.3.3. Detection of a Configured Certificate Being Revoked
By the application of a certificate revocation list (CRL), or via online interactions using online certificate status protocol (OCSP), the revoked certificate is configured, and causes an NSM event to send an alert notification.
3.4. Protocol Monitoring
GOOSE messages form a key part of the IEC 61850 protocol, embedding select logical and analog data, such as circuit breaker status, circuit breaker control, interlocking, general alarms, and power transformer’s temperature, which are transmitted in Ethernet packets [25].
3.4.1. Detection of GOOSE Unavailable
The NSM sensor monitors the expiration of the parameter TimeAllowedToLive (TAL), which represents the relative time in which to expect the next packet to be received, and detects the lack of reception of the next transmission within the specified TAL.
3.4.2. Detection of a GOOSE Power Outage or Control Block Disabling
A GOOSE packet contains a StateNumber (SN) that changes incrementally each time a data value in the GOOSE changes value. If an SN received after TAL expiration is less than the previously received SN, then it signals that either the IED has a reset/power sequence or that the control block was disabled and enabled again.
3.4.3. Distributed Network Protocol 3.0 Communication Timeout
The NSM sensor monitors if the master station retransmits the same application protocol data unit (APDU) with the same sequence number, then sets an MIB element configure station response latencies.
3.4.4. Detection of New Intelligent Electronic Devices Being Added to the System
The NSM sensor monitors if non-configured addresses are detected but are not being communicated via the configured master, then notifies the substation engineering team about the new IEDs.
3.4.5. IEC 61850 Static Feature
The NSM sensor checks the consistency or grammatical correctness of the IEC 61850 protocol [9], using the response and report feature in a measurement signal of MMS protocol-based command as a static feature. The MMS protocol-based command metric is for deep packet inspection, to check whether the MMS measurement signals’ confirmed response (command type A1) and unconfirmed report (command type A3) has been correctly issuing measurement data based on the request.
Function MMS_metric () {
IF () || ()
THEN return 0
ELSE return 1
}
3.4.6. IEC 61850 Dynamic Feature
It is also necessary to monitor the GOOSE usage pattern [9], using recency–frequency–monetary (RFM) analysis [15] to capture GOOSE behavior-based patterns as dynamic features. In this paper, recency (RIED_i) is defined as the last GOOSE arrival time, and frequency (FIED_i) is defined as the mean time interval of the GOOSE arrival time. Lastly, monetary (MIED_i) is defined as the total GOOSE arrival count. In comparing RFM with the GOOSE report period (GRP), we find abnormal GOOSE behavior when it receives too frequently or too rarely than it is supposed to as set up in the configuration file. Then, the GOOSE behavior-based usage pattern metric is defined as follows:
Function GOOSE_metric () {
IF (Current time < + GRP) && ( < GRP) && ( > GRP * 60*24)
THEN return 0
ELSE return 1
}
For example, according to the configuration file of one main transformer IED, it has one GOOSE-CONTROL-BLOCK class for GOOSE communication between IED GOCB01’s record and interlock status in Tr, and for reporting the control of on-load tap-changer’s operation block in stVal. With GOOSE usage pattern analysis, RFM values (23:59:55.397, 10.38, 384) return 1, detecting suspicious GOOSE frequency.
4. Cyber–Physical Anomaly Detection System
Cyber–physical systems are intrinsically concurrent. At a minimum, the cyber and the physical subsystems coexist in time, but even within these subsystems, concurrent processes are common. Models of concurrency in the physical world are very different from the models of concurrency in software, and very different from models of concurrency in networks. Reconciling the divergent models of concurrency, and ensuring interoperability and communication between components is the key problem in CPS. In this research, we adopted the alarm types of NSM objects, a decision algorithm by correlation with other NSM object types, and anomaly possibility values for determining the severity of an anomaly.
4.1. Network and System Management Alarm Object
In the IEC 62351-7 NSM definition, the “alarm” class is defined with the lack of any algorithm or correlated computation for the determination of the alarm event itself. Thus, modeling on each alarm event using preexisting NSM objects of cyber–physical status is significantly considered in this work. We newly categorized this NSM class into nine sub-classes: backup system alarm, connection alarm, protocol alarm, alarm control, physical alarm, end-system alarm, contingency element, communication equipment, and security alarm. The NSM class has further correlations between alarm sub-classes, with 12 relationships and 51 attributes, as depicted in Figure 9. The definition of all sub-class attributes in Figure 9 are shared in Appendix A for each identified object.
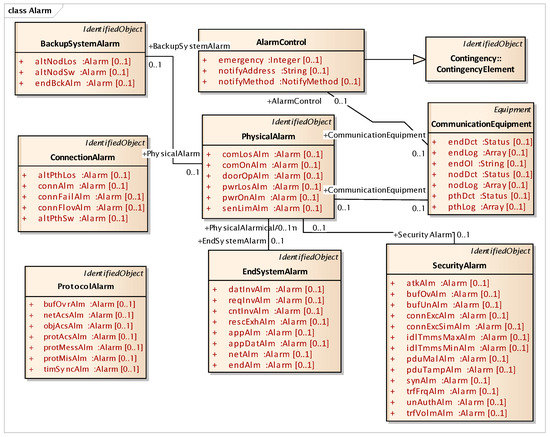
Figure 9.
Outline of NSM alarm class.
4.2. Decision Algorithm for Network and System Management Alarm Objects
Each NSM alarm object consists of the continuous monitoring of the cyber–physical system status using an NSM object. NSM object values are computed with a decision algorithm, such as the examples depicted in Figure 10, Figure 11 and Figure 12. The availability of a cyber–physical system is the highest priority for a power grid, including digital substations [43]. In Figure 10, the resource exhaustion alarm (RescExhAlm) is triggered from an end-system, as depicted in Figure 9, based on checking the allowed range of resource of the Message Byte and Message Count NSM object value. If these NSM object values are less than the minimum or more than the maximum threshold value, the decision algorithm triggers RescExhAlm. In Figure 11, a network traffic frequency alarm and network traffic volume alarm are triggered from a security system, as depicted in Figure 9, based on checking of BPS and PPS statistics from network flow analysis. In Figure 12, a protocol message alarm is triggered from IEC 61850 protocol-based IEDs, which validate the protocol stack and access control list of a pre-defined subscriber. For further information, including the acronyms for variable names in Figure 10, Figure 11 and Figure 12, IEC 62351-7 NSM data object modeling results are shared to the public as described in Appendix A.
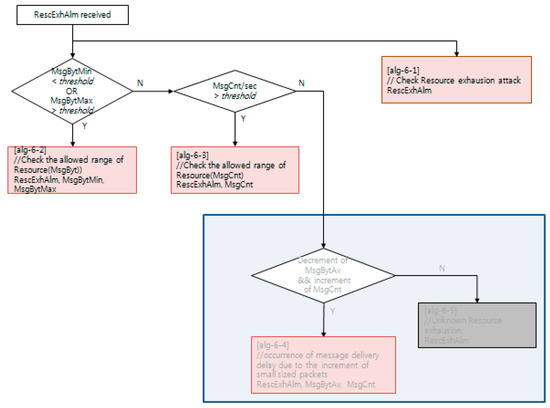
Figure 10.
Decision algorithm for the resource exhaustion alarm, using NSM.
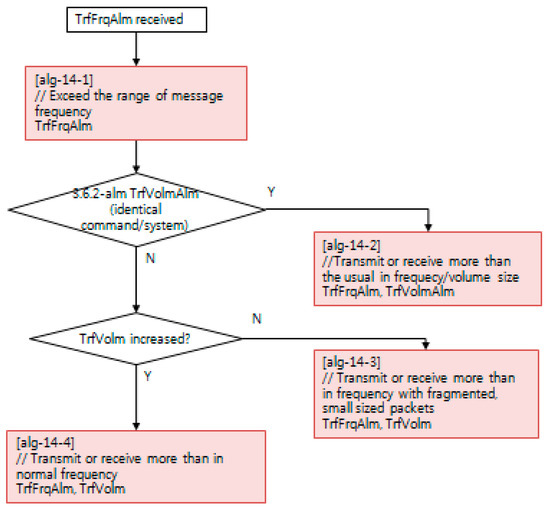
Figure 11.
Decision algorithm for the network traffic frequency alarm, using NSM.
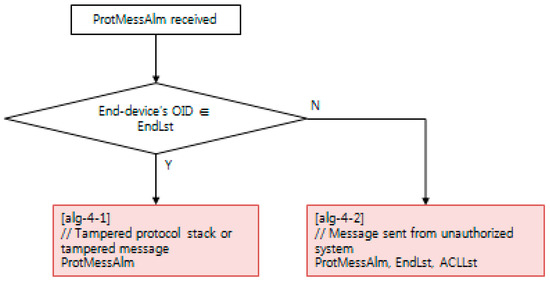
Figure 12.
Decision algorithm for the protocol message alarm, using NSM.
4.3. Anomaly Detection Function
The design of an anomaly detection function is defined as function A of three input parameters in the previous work [10]: A{f(PPS, BPS, LoP, SoP), f(GOOSE_metric), and f(MMS_metric)}. Function A can be represented by the total anomaly possibility value
where w1, w2, and w3 represent given weight values from 0 to 1, satisfying the condition that the sum of the three weights equals 1. As an initial weight value, w1, w2, w3 are selected as 0.4, 0.4, and 0.2, respectively, since dynamic features can sensitively explain real-time network traffic data.
A = {w1∙f(PPS, BPS, LoP, SoP) + w2∙f(GOOSE_metric) + w3∙f(MMS_metric)}
The anomaly statistics in Equation (2) are calculated each time that the concurrent process of cyber and physical system interfacing generates a new NSM object status or a change in NSM value. In case of the alarm type of NSM object, triggered from a point of NSM sensor, anomaly possibility value A is used to determine the severity of the abnormal behavior.
5. Testbed
The EPRI Smart Grid Substation Testbed was developed within the EPRI Cyber Security Research Lab (CSRL)m to provide a platform for testing the KEPCO IEC 62351-7 NSM sensor. The architecture of the testbed environment is displayed in Figure 13. The rationale was to emulate a substation environment, using IEDs of various design and origin. That is, some IEDs were manufactured in the United States, and others internationally. The IEDs communicate using IEC 61850 protocols. KEPCO’s NSM sensor is deployed to passively identify the traffic within the environment, as well as anomalies in the traffic patterns that could indicate a potential cyber–physical attack and implement the proposed vulnerability detection approaches. As depicted in Figure 13, the testbed consists of seven IEDs of different manufacturers and KEPCO-NSM sensor/manager servers. They are ABB, SEL, NI, Areva, Sanion, Vitzro, and GE. All IEDs are connected to a Ruggedcom switch and the facility three-phase uninterruptible power supply by APC (Paris, France). The testbed also has a cellular modem, which supports the connectivity from a remote external network for the maintenance staffs. The primary utilization of the testbed, as established, is to support research on IEC 62351-7 SNMP MIB, test on use cases, and compare test results with previous proof-of-concept NSM tools.
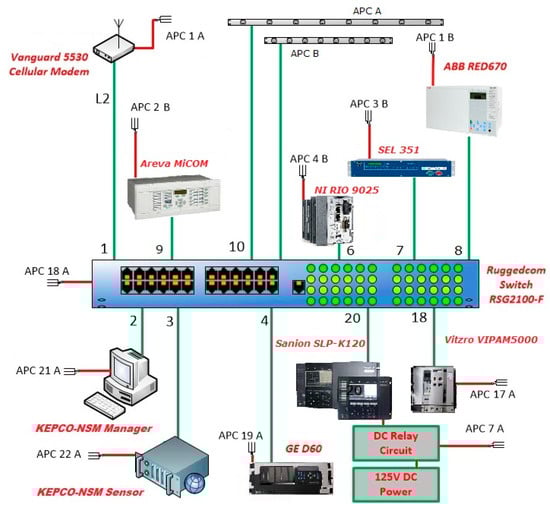
Figure 13.
Testbed at the Electric Power Research Institute (EPRI).
In the testbed, information supporting NSM is collected from 10 monitoring points of cyber–physical sources within the network. The monitoring points are either available through existing communications channels, such as a switch, router, and NSM sensor, or by monitoring through seven end-device monitoring agents of IEDs.
5.1. Test Scenarios
Table 3 described the test scenarios conducted in EPRI testbed environment. The full list of cyber–physical test scenarios on a digital substation environment is shared publicly in Appendix B.
Table 3.
Test scenario.
5.2. Test Results
After baseline packet captures (PCAPs) have a 1-h replay of normal IED traffic, exercise of various use cases was detected, with the sensor based on the predefined IEC 61850-specific rules and sensor learning features. The sensor then reacted with either an alert message from the NSM manager displaying all alerts descriptions, or a log message in the form of rule engine system logs from the NSM sensor.
5.2.1. Testing Result for Port Scan
When the network mapper (NMAP) tool began operations from the test laptop, the security sensor immediately detected the alarm message shown in Figure 14. The figure shows that the NMAP scanning attempt was detected from the source IP address.
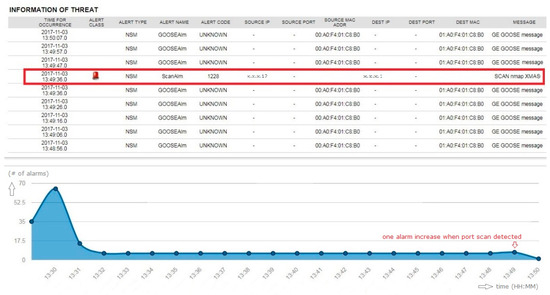
Figure 14.
Testing result of port scan.
5.2.2. Testing Result for Abnormal Device Network Flow Characteristics
When the network flow of one IED was repeated, the security sensor detected the increase and reported it in both the system log and the alarm system. The test only detected instances where the traffic average in a three-minute span exceeded the baseline threshold by the alert tolerance depicted in Figure 15. The alert tolerance is a tunable value.
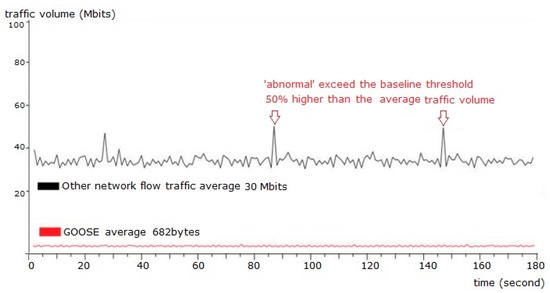
Figure 15.
Network traffic load with GOOSE message.
An NSM sensor captured all the network traffic through the tapping port analyzed mode. The test access point of two from-publisher-and-subscriber IEDs are verified for zero delay and zero loss of messages. In a period of three minutes, the network traffic load in a test environment is as depicted in Figure 15.
5.2.3. Testing Result for GOOSE Payload Model Monitoring
When there was a change in the GOOSE payload model, the security sensor detected the change and alerted the system with a critical alarm. The payload change was recognized because of a change of the GOOSE model. The sensor learns the structure of each IED, and validates the received payload model against the known IED payload model [46]. The test only detects instances where the type of value changed, such as Boolean to integer, or where the tree structure changed. Instances where one Boolean value was replaced with another went undetected, provided that the tree structure remained the same. The payload change was detected by the preprocessor rule set, derived from the IED management and analysis module, as depicted in Figure 16.
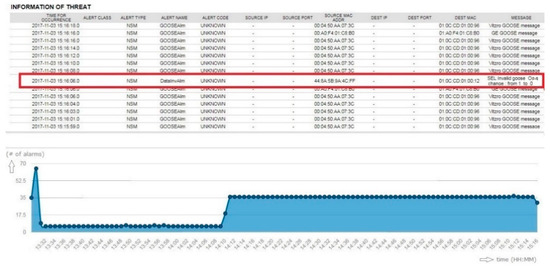
Figure 16.
Testing result of GOOSE payload model monitoring.
5.2.4. Testing Results for GOOSE Timing Monitoring
Periodic GOOSE messages are managed thoroughly in the NSM sensor. When a rate change of 1 s was increased to a 1.6 s timing interval, the sensor detected the change and issued a critical alarm. The sensor alerts on the resulting decrease in network flow over that interval. For example, when GOOSE has a 1-s interval between each message, the security sensor has <alpha>% of timing buffer to deal with network latency issues. However, when the GOOSE message rate exceeds network flow threshold, the security sensor produced the alarm shown in Figure 17.
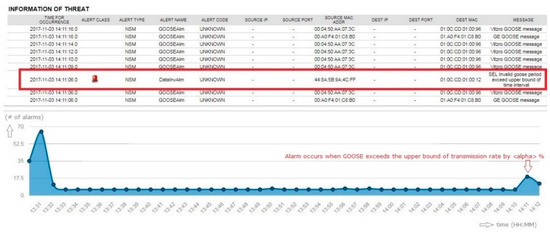
Figure 17.
Testing result of GOOSE timing monitoring—exceeding the upper bound of GOOSE period.
The rate change was detected by the preprocessor rule (set in Figure 18) derived from IED management and the analysis module with alerting enabled on the invalid GOOSE period. The rule set in Figure 18 is an example detection rule for GOOSE timing monitoring. The rule engine is based on a snort, open source-based rule set [12], with the extension to add source/destination MAC address and source/destination application ID, as well as rule options. The rule options consist of the alarm message specified for IEC 61850 command, NSM object name, and NSM alarm states. In case of an invalid GOOSE period alarm, the NSM object name is defined as “DataInvAlm”. The NSM alarm state has a unique identification, numbered 00010490. GOOSE was requested once, with GOOSE dataset “SEL_351_1CFG/LLN0$GO$GPub01” on every 1-second (1000 milliseconds) time interval, with system identification number (SID) as 6020001. The rule feature set defined in this literature was introduced in Table 1.
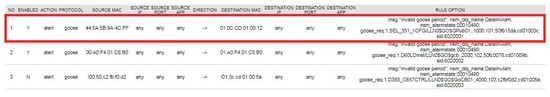
Figure 18.
Detection rule for GOOSE timing monitoring.
5.2.5. Testing Result for Bad GOOSE Vulnerability
When GOOSE-modified traffic passed through the network, the security sensor identified two characteristics of the modified traffic. The first alert was a GOOSE denial-of-service attempt, which the sensor monitored and analyzed as increased network flow from a normal IED. This increased traffic was caused by a replay attack. The second alert was due to the detection of the invalid sequence number change, which occurred when the attacker attempted to advance the sequence number beyond that expected from the original GOOSE traffic pattern, shown pre-defined in Figure 19.
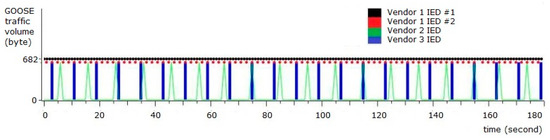
Figure 19.
IEC 61850 GOOSE traffic pattern.
The preceding attack attempts, shown in Figure 20, were detected by a combination of two distinct alerts from the preprocessor rule set derived from the network flow statistical analysis of the GOOSE denial-of-service rule, as well as the IED management and analysis module for validating sequence number of GOOSE messages. However, when the status number was changed, the sensor failed to detect it as an anomaly. The current security sensor cannot distinguish between a normal state number change and an abnormal change in GOOSE messages. The test was initially constructed with a sequence number jump of one. The sequence number jump of one went undetected. The test was modified to increment the sequence number by five. The sequence number jump of the modified test was detected.
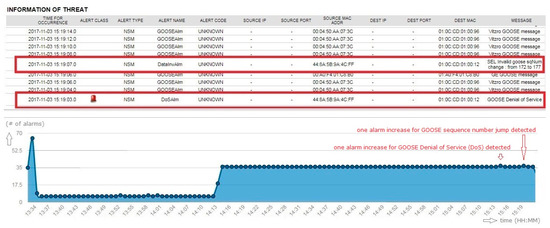
Figure 20.
Testing result of bad GOOSE vulnerability.
6. Conclusions
This paper proposes a new method of network and system management application and integration using a cyber security testbed. Major contributions of this research are summarized as follows.
First, we develop, for the first time, the full phase of network and system management design, implementation, testbed environment, and cyber–physical assessment methodology, in order to monitor the cyber–physical system statistics for intelligent electronic devices within the testbed. This security testbed can be applicable for assessing and monitoring risk in a substation environment.
Second, IEC 61850 protocol specification-based metrics are newly investigated. To this end, GOOSE and MMS specific factors are captured from this experimental data, and are used for the proposed NSM use cases.
Last, we newly integrate real network traffic data integrated from both North American and South Korean digital substation environments. With our best knowledge, this work is the first attempt to analyze real operational network data of both U.S. and Korean smart grid environments, which is globally applicable to any other countries employing IEC 61850 protocol in the smart grids that construct new digital substations, especially with multiple different manufacturers.
The substations that are similar to U.S. and Korean environments will immediately benefit from the study. In this work, we provide a new cyber security deployment design of a central management system, which reflects cyber-physical activities in real time for behavioral analysis and anomaly detection of IEC 61850-based digital substations. We believe that this work will be helpful to enhance cyber security when deploying a similar system to install multiple manufacturers’ IEDs.
The use case tests demonstrate the utility of the NSM for IEC 61850 messaging, and support the visualization of device behavior analysis. This should provide better understanding of the IEC 61850 standard, and how further solution development may assist utilities in increasing situational awareness for their 61805 deployments. We believe that there are many promising avenues for more detailed research on anomaly detection in substation for further studies.
The testing results provide feedback for the usage of the KEPCO NSM sensor, and offer insight into opportunities for algorithm refinement. For example, algorithm refinement could include a change to the message frequency monitoring algorithm, in order to detect abnormal changes much quicker. Future work should include tests of more advanced use cases, to further explore the sensor’s capabilities and aid in the refinement of the detection algorithms.
Author Contributions
All authors contributed to the overall study design and analysis, writing, and validation of the manuscript.
Funding
This research was funded by the Electric Power Research Institute grant number 2002010587 and by Korea Electric Power Research Institute grant number R16IA08 and R16CA04.
Acknowledgments
This research is based on work supported by the Electric Power Research Institute under KEPCO Implementation of the IEC 62351-7 Standard.
Conflicts of Interest
The authors declare no conflict of interest.
Appendix A
IEC 62351-7 NSM data object modeling for a digital substation environment is reviewed and further implemented in this paper. The full list of NSM data modeling is available at https://docs.google.com/spreadsheets/d/1luymRsKNZNb4v4B6EF0zDCaNvW33rYSMFVXS9ZSETYA/edit?usp=sharing.
Appendix B
The full list of cyber–physical test scenarios for a digital substation environment is available at: https://docs.google.com/spreadsheets/d/1fjMJVWH3Kis5HznOIOf1OpHIG12H9v9T9OnCrTphQjA/edit?usp=sharing.
References
- Power Systems Management and Associated Information Exchange—Data and Communications Security—Part 7: Network and System Management (NSM) Data Object Models. IEC TC57 WG15 TS 62351-7:2010. Available online: https://webstore.iec.ch/publication/6910 (accessed on 25 January 2019).
- Network and System Management: Advanced Application of the IEC 62351-7 Standard and Utility Pilot Project. EPRI Report. December 2015. Available online: https://www.epri.com/#/pages/product/3002005944/ (accessed on 25 January 2019).
- Chen, Y.; Hong, J.; Liu, C.C. Modeling of Intrusion and Defense for Assessment of Cyber Security at Power Substations. IEEE Trans. Smart Grid 2018, 9, 2541–2552. [Google Scholar] [CrossRef]
- Cai, J.; Zheng, Y.; Zhou, Z. Review of cyber-security challenges and measures in smart substation. In Proceedings of the 2016 International Conference on Smart Grid and Clean Energy Technologies, Chengdu, China, 19–22 October 2016; pp. 65–69. [Google Scholar]
- Hong, J.; Chen, Y.; Liu, C.C.; Govindarasu, M. Cyber-Physical Security Testbed for Substations in a Power Grid. In Cyber Physical Systems Approach to Smart Electric Power Grid; Springer: Berlin/Heidelberg, Germany, 2015; pp. 261–301. [Google Scholar]
- Sarralde, J.L.; Yarza, J.M. Cyber security applied to Protection & Control IEDs. In Proceedings of the 2014 IEEE PES Transmission & Distribution Conference and Exposition, Medellin, Colombia, 9–13 September 2014; pp. 1–5. [Google Scholar]
- Network System Management: End-System-Related International Electrotechnical Commission (IEC) 62351-7 Object Definitions. EPRI Report. December 2013. Available online: https://www.epri.com/#/pages/product/3002000373/ (accessed on 14 March 2019).
- Elgargouri, A.; Virrankoski, R.; Elmusrati, M. IEC 61850 based smart grid security. In Proceedings of the 2015 IEEE International Conference on Industrial Technology (ICIT), Seville, Spain, 17–19 March 2015; pp. 2461–2465. [Google Scholar]
- Lahza, H.; Radke, K.; Foo, E. Applying domain-specific knowledge to construct features for detecting distributed DOS attacks on GOOSE and MMS protocols. Int. J. Crit. Infrastruct. Prot. 2018, 20, 48–67. [Google Scholar] [CrossRef]
- Kwon, Y.; Kim, H.; Lim, Y.; Lim, J. A Behavior-based Intrusion Detection Technique for Smart Grid Infrastructure. In Proceedings of the 2015 IEEE Eindhoven PowerTech, Eindhoven, The Netherlands, 29 June–2 July 2015. [Google Scholar]
- Network System Management: Implementations and Applications of the IEC 62351-7 Standard. EPRI Technical Report. December 2014. Available online: https://www.epri.com/#/pages/product/3002003738/ (accessed on 25 January 2019).
- Snort Rules and IDS Software. Available online: https://www.snort.org/ (accessed on 25 January 2019).
- Jang, B.; Kim, N.; Abubakari, A. IEC 61850 SCL Validation Using UML Model in Modern Digital Substation. Smart Grid Renew. Energy 2018, 9, 127–149. [Google Scholar] [CrossRef]
- Electric Single Line Diagram—Part Two, Electrical Knowhow. Available online: http://www.electrical-knowhow.com/2012/12/electrical-single-line-diagram-part-two.html (accessed on 25 January 2019).
- Kim, H.K.; Im, K.H.; Park, S.C. DSS for computer security incident response applying CBR and collaborative response. Expert Syst. Appl. 2010, 37, 852–870. [Google Scholar] [CrossRef]
- Lin, H.; Slagell, A.; Kalbarczyk, Z.; Sauer, P.; Iyer, R. Runtime Semantic Security Analysis to Detect and Mitigate Control-related Attacks in Power Grids. IEEE Trans. Smart Grid 2018, 9, 163–178. [Google Scholar] [CrossRef]
- El Hariri, M.; Youssef, T.A.; Mohammed, O.A. On the Implementation of the IEC 61850 Standard: Will Different Manufacturer Devices Behave Similarly under Identical Conditions? Electronics 2016, 5, 85. [Google Scholar] [CrossRef]
- Wu, Y.; Xiao, Y.; Hohn, F.; Nordström, L.; Wang, J.; Zhao, W. Bad Data Detection Using Linear WLS and Sampled Values in Digital Substations. IEEE Trans. Power Deliv. 2018, 33, 150–157. [Google Scholar] [CrossRef]
- Urbina, M.; Moreira, N.; Rodriguez, M.; Acosta, T.; Lázaro, J.; Astarloa, A. Secure Protocol and IP Core for Configuration of Networking Hardware IPs in the Smart Grid. Energies 2018, 11, 510. [Google Scholar] [CrossRef]
- Rahman, M.S.; Mahmud, M.A.; Oo, A.M.T.; Pota, H.R. Multi-Agent Approach for Enhancing Security of Protection Schemes in Cyber-Physical Energy Systems. IEEE Trans. Ind. Inform. 2017, 13, 436–447. [Google Scholar] [CrossRef]
- El Hariri, M.; Faddel, S.; Mohammed, O. Physical-Model-Checking to Detect Switching-Related Attacks in Power Systems. Sensors 2018, 18, 2478. [Google Scholar] [CrossRef] [PubMed]
- Wright, J.G.; Wolthusen, S.D. Access Control and Availability Vulnerabilities in the ISO/IEC 61850 Substation Automation Protocol. In Critical Information Infrastructures Security; Springer: Cham, Switzerland, 2017; Volume 10242, pp. 239–251. [Google Scholar]
- Dazahra, M.N.; Elmariami, F.; Belfqih, A.; Boukhrouaa, J.; Anass, L.; Nazha, C. Decentralized Control of Substations in Smart Cities. In Advances in Ubiquitous Networking; Springer: Singapore, 2017; Volume 397, pp. 299–308. [Google Scholar]
- Liu, Z.; Duan, X.; Liao, M.; Ge, G.; Zou, J. A model-based measurement method for intelligent circuit breaker with data communication. Trans. Inst. Meas. Control 2018, 40, 1854–1862. [Google Scholar] [CrossRef]
- Hoyos, J.; Dehus, M.; Brown, T.X. Exploiting the GOOSE protocol: A practical attack on cyber-infrastructure. In Proceedings of the 2012 IEEE Globecom Workshops, Anaheim, CA, USA, 3–7 December 2012. [Google Scholar]
- Granjal, J.; Silva, J.M.; Lourenço, N. Intrusion Detection and Prevention in CoAP Wireless Sensor Networks Using Anomaly Detection. Sensors 2018, 18, 2445. [Google Scholar] [CrossRef] [PubMed]
- McGrath, J.K. Will Updated Electricity Infrastructure Security Protect the Grid? A Case Study Modeling Electrical Substation Attacks. Infrastructures 2018, 3, 53. [Google Scholar] [CrossRef]
- Wadhawan, Y.; AlMajali, A.; Neuman, C. A Comprehensive Analysis of Smart Grid Systems against Cyber-Physical Attacks. Electronics 2018, 7, 249. [Google Scholar] [CrossRef]
- Sun, C.-C.; Liu, C.-C.; Xie, J. Cyber-Physical System Security of a Power Grid: State-of-the-Art. Electronics 2016, 5, 40. [Google Scholar] [CrossRef]
- Koo, D.; Shin, Y.; Hur, J. Privacy-Preserving Aggregation and Authentication of Multi-Source Smart Meters in a Smart Grid System. Appl. Sci. 2017, 7, 1007. [Google Scholar] [CrossRef]
- Sundararajan, A.; Chavan, A.; Saleem, D.; Sarwat, A.I. A Survey of Protocol-Level Challenges and Solutions for Distributed Energy Resource Cyber-Physical Security. Energies 2018, 11, 2360. [Google Scholar] [CrossRef]
- Yeung, K.H.; Yan, F.; Leung, C. Improving Network Infrastructure Security by Partitioning Networks Running Spanning Tree Protocol. In Proceedings of the International Conference on Internet Surveillance and Protection, Cote d’Azur, France, 26–29 August 2006. [Google Scholar]
- Scott, B.; Xu, J.; Zhang, J.; Brown, A.; Clark, E.; Yuan, X. An interactive visualization tool for teaching ARP spoofing attack. In Proceedings of the IEEE Frontiers in Education Conference (FIE), Indianapolis, IN, USA, 18–21 October 2017. [Google Scholar]
- Meghana, J.S.; Subashri, T.; Vimal, K.R. A survey on ARP cache poisoning and techniques for detection and mitigation. In Proceedings of the Fourth International Conference on Signal Processing, Communication and Networking (ICSCN), Chennai, India, 16–18 March 2017. [Google Scholar]
- Bhirud, S.G.; Katkar, V. Light weight approach for IP-ARP spoofing detection and prevention. In Proceedings of the Second Asian Himalayas International Conference on Internet (AH-ICI), Kathmandu, Nepal, 4–6 November 2011. [Google Scholar]
- Nelson, R. End-to-end encryption at the network layer. In Proceedings of the Fifth Annual Computer Security Applications Conference, Tucson, AZ, USA, 4–8 December 1989. [Google Scholar]
- Sanaiye, O.A. Short Paper: IP spoofing detection for preventing DDoS attack in Cloud Computing. In Proceedings of the 18th International Conference on Intelligence in Next Generation Networks, Paris, France, 17–19 February 2015. [Google Scholar]
- Duan, Z.; Yuan, X.; Chandrashekar, J. Controlling IP Spoofing through Interdomain Packet Filters. IEEE Trans. Dependable Secur. Comput. 2007, 5, 22–36. [Google Scholar] [CrossRef]
- Udhayan, J.; Anitha, R. Demystifying and Rate Limiting ICMP hosted DoS/DDoS Flooding Attacks with Attack Productivity Analysis. In Proceedings of the IEEE International Advance Computing Conference, Patiala, India, 6–7 March 2009. [Google Scholar]
- Coates, G.M.; Hopkinson, K.M.; Graham, S.R.; Kurkowski, S.H. A trust system architecture for SCADA network security. IEEE Trans. Power Deliv. 2010, 25, 158–169. [Google Scholar] [CrossRef]
- Zhang, Y.; Wang, L.; Xiang, Y.; Ten, C.W. Power System Reliability Evaluation with SCADA Cybersecurity Considerations. IEEE Trans. Smart Grid 2015, 6, 1707–1721. [Google Scholar] [CrossRef]
- Anwar, S.; Mohamad Zain, J.; Zolkipli, M.F.; Inayat, Z.; Khan, S.; Anthony, B.; Chang, V. From Intrusion Detection to an Intrusion Response System: Fundamentals, Requirements, and Future Directions. Algorithms 2017, 10, 39. [Google Scholar] [CrossRef]
- Cadini, F.; Agliardi, G.; Zio, E. A modeling and simulation framework for the reliability/availability assessment of a power transmission grid subject to cascading failures under extreme weather conditions. Appl. Energy 2017, 185 Pt 1, 267–279. [Google Scholar] [CrossRef]
- Nmap Security Scanner. Available online: https://nmap.org (accessed on 25 January 2019).
- CVE-2018-18957 IEC61850 v1.3 Stack-Based GOOSE Buffer Overflow. NIST National Vulnerability Database. Available online: https://nvd.nist.gov/vuln/detail/CVE-2018-18957 (accessed on 25 January 2019).
- Abduh, M.A.; Hassan, A.B.; Sheikh, A.U. Saudi Aramco Vision of optimized power system automation. In Proceedings of the IEEE Saudi Arabia Smart Grid (SASG), Jeddah, Saudi Arabia, 6–8 December 2016. [Google Scholar]


© 2019 by the authors. Licensee MDPI, Basel, Switzerland. This article is an open access article distributed under the terms and conditions of the Creative Commons Attribution (CC BY) license (http://creativecommons.org/licenses/by/4.0/).