Article

Learning-Based Screening of Endothelial Dysfunction From Photoplethysmographic Signals

Department of Information Engineering, Universitá Politecnica delle Marche, 60121 Ancona, Italy
*
Author to whom correspondence should be addressed.
Electronics 2019, 8(3), 271; https://doi.org/10.3390/electronics8030271
Submission received: 29 January 2019 / Revised: 19 February 2019 / Accepted: 27 February 2019 / Published: 1 March 2019
(This article belongs to the Special Issue Sensing and Signal Processing in Smart Healthcare)

Abstract

:
Endothelial-Dysfunction (ED) screening is of primary importance to early diagnosis cardiovascular diseases. Recently, approaches to ED screening are focusing more and more on photoplethysmography (PPG)-signal analysis, which is performed in a threshold-sensitive way and may not be suitable for tackling the high variability of PPG signals. The goal of this work was to present an innovative machine-learning (ML) approach to ED screening that could tackle such variability. Two research hypotheses guided this work: (H1) ML can support ED screening by classifying PPG features; and (H2) classification performance can be improved when including also anthropometric features. To investigate H1 and H2, a new dataset was built from 59 subject. The dataset is balanced in terms of subjects with and without ED. Support vector machine (SVM), random forest (RF) and k-nearest neighbors (KNN) classifiers were investigated for feature classification. With the leave-one-out evaluation protocol, the best classification results for H1 were obtained with SVM (accuracy = 71%, recall = 59%). When testing H2, the recall was further improved to 67%. Such results are a promising step for developing a novel and intelligent PPG device to assist clinicians in performing large scale and low cost ED screening.

1. Introduction

Cardiovascular Diseases (CVDs) refer to a class of cardiac disorders that, according to the European Heart Network, cause every year 3.9 million deaths in Europe, with estimated costs up to 210 billion euro per year [1]. As reported in the guidelines of the World Health Organization (https://www.who.int/cardiovascular_diseases/guidelines/Pocket_GL_information/en/) for the assessment and management of cardiovascular risks, several factors (e.g., physical inactivity, tobacco use, and obesity) have been shown to influence CVD onset.
Moreover, when these factors are present, there is also a high probability of Endothelial Dysfunction (ED), which is actually recognized to be of primary importance to early diagnosis of CVDs [2,3,4]. In physiological conditions, the endothelial tissue regulates many functions, among which the most important are to maintain vascular homeostasis and modulate the vascular tone by balancing the production of vasodilators, including nitric oxide, and vasoconstrictors. In presence of ED, the endothelium is liable to anatomical alteration (e.g., smooth muscle cell proliferation and migration, leukocyte adhesion and migration) and its regulation mechanisms are compromised [5,6].
The current gold standard technique for ED diagnosis is the Flow Mediated Dilatation (FMD), which uses high-resolution UltraSound (US) signals acquired on subject arm. FMD is measured after a 5-min arm compression followed by relaxation and measured as the percentage increase of the resulted maximum brachial-artery diameter with respect to the baseline diameter [7]. FMD computation is, however, operator dependent, expensive and requires an expert clinician, thus not suitable for screening purposes.
To overcome these limitations, studies in the clinical literature highlight the efficacy of PhotoPlethysmoGraphy (PPG) in assessing ED [8,9,10,11,12]. PPG is a noninvasive optical technique in which PPG sensors are applied on subject’s fingers to measure changes in blood volume as a function of time [13,14]. From the PPG signal, similar to US-based analysis, the incremental ratio of the PPG signal amplitude (with respect to its baseline) is evaluated by clinicians in a sensitive, threshold-based way (not being compatible with the high variability of the PPG signals).
To successfully tackle data variability, different researchers in similar contexts exploited Machine-Learning (ML) techniques. For example, Weng et al. [15] adopted Random Forest (RF), Logistic Regression (LR), Gradient Boosting Machines (GBM) and Neural Networks (NN) with 30 features extracted from electronic health records (EHRs) (such as blood pressure, Body Mass Index (BMI), gender, etc.) to identify patients at risk of developing CVDs. They obtained overall classification recalls of 65.3% (RF), 67.1% (LR), 67.5% (GBM), and 67.5% (NN). Similarly, Boursalie et al. [16] used Support Vector Machines (SVMs) to classify features from wearable sensors and EHRs, achieving a classification accuracy of 90.5%. Work similar to that proposed in this paper is reported in [17], where several ML classifiers (such as SVM and RF) are investigated for the specific task of ED classification, although it focuses on features extracted from FMD data.
Considering the clinical relevance of early-diagnosing ED from PPG data (over the FMD ones), the goal of this research was to test if ML methodologies are suitable for ED classification starting from PPG-signal analysis, by providing a fast and low cost approach to the problem. Specifically, we investigated the following two hypotheses:
Hypothesis 1 (H1).
ML techniques can classify ED by PPG features.
Hypothesis 2 (H2).
Including anthropometric features may improve classification results.
Due to the lack of work in this field of research to test H1 and H2, a new publicly available dataset, the PPG Endothelial Dysfunction Dataset (ppgEDD), was collected (http://vrai.dii.univpm.it/content/ppgEDD-dataset).
The paper is organized as follows: Section 2 gives details on the EDD and the features used for endothelial dysfunction classification. Results and conclusions are presented in Section 3 and Section 4, respectively.

2. Methods

This section presents the proposed approach to ED screening from PPG data (Section 2.1) and the experimental protocol used to investigate H1 and H2 (Section 2.2).

2.1. Endothelial-Dysfunction Screening Methodology

The proposed method consists of the following steps: (i) data collection (Section 2.1.1); (ii) feature extraction (Section 2.1.2); and (iii) classification (Section 2.1.3). The workflow of the approach is shown in Figure 1.

2.1.1. PPG Endothelial-Dysfunction-Dataset Collection

The ppgEDD was built from 59 voluntary patients. Thirty-one subjects (F/M = 28/31, age = 39 ± 16 years) were healthy and the remaining ones had ED. The PPG-signal acquisition was carried out in the morning, in an environment with comfortable temperature and in absence of noise. Each subject was in the room at least half an hour before the exam to let his/her body to adapt to the temperature. All subjects respected the following instructions:
-
Fasting for at least 8 h
-
No drug consumption in the previous 6 h
-
No smoking in the previous 6 h
-
No intense physical activity in the hours immediately preceding the exam
-
No nail polish
All participants were informed and provided a written agreement in accordance with the Declaration of Helsinki.
As shown in Figure 2, the medical equipment used to measure the PPG signal included:
-
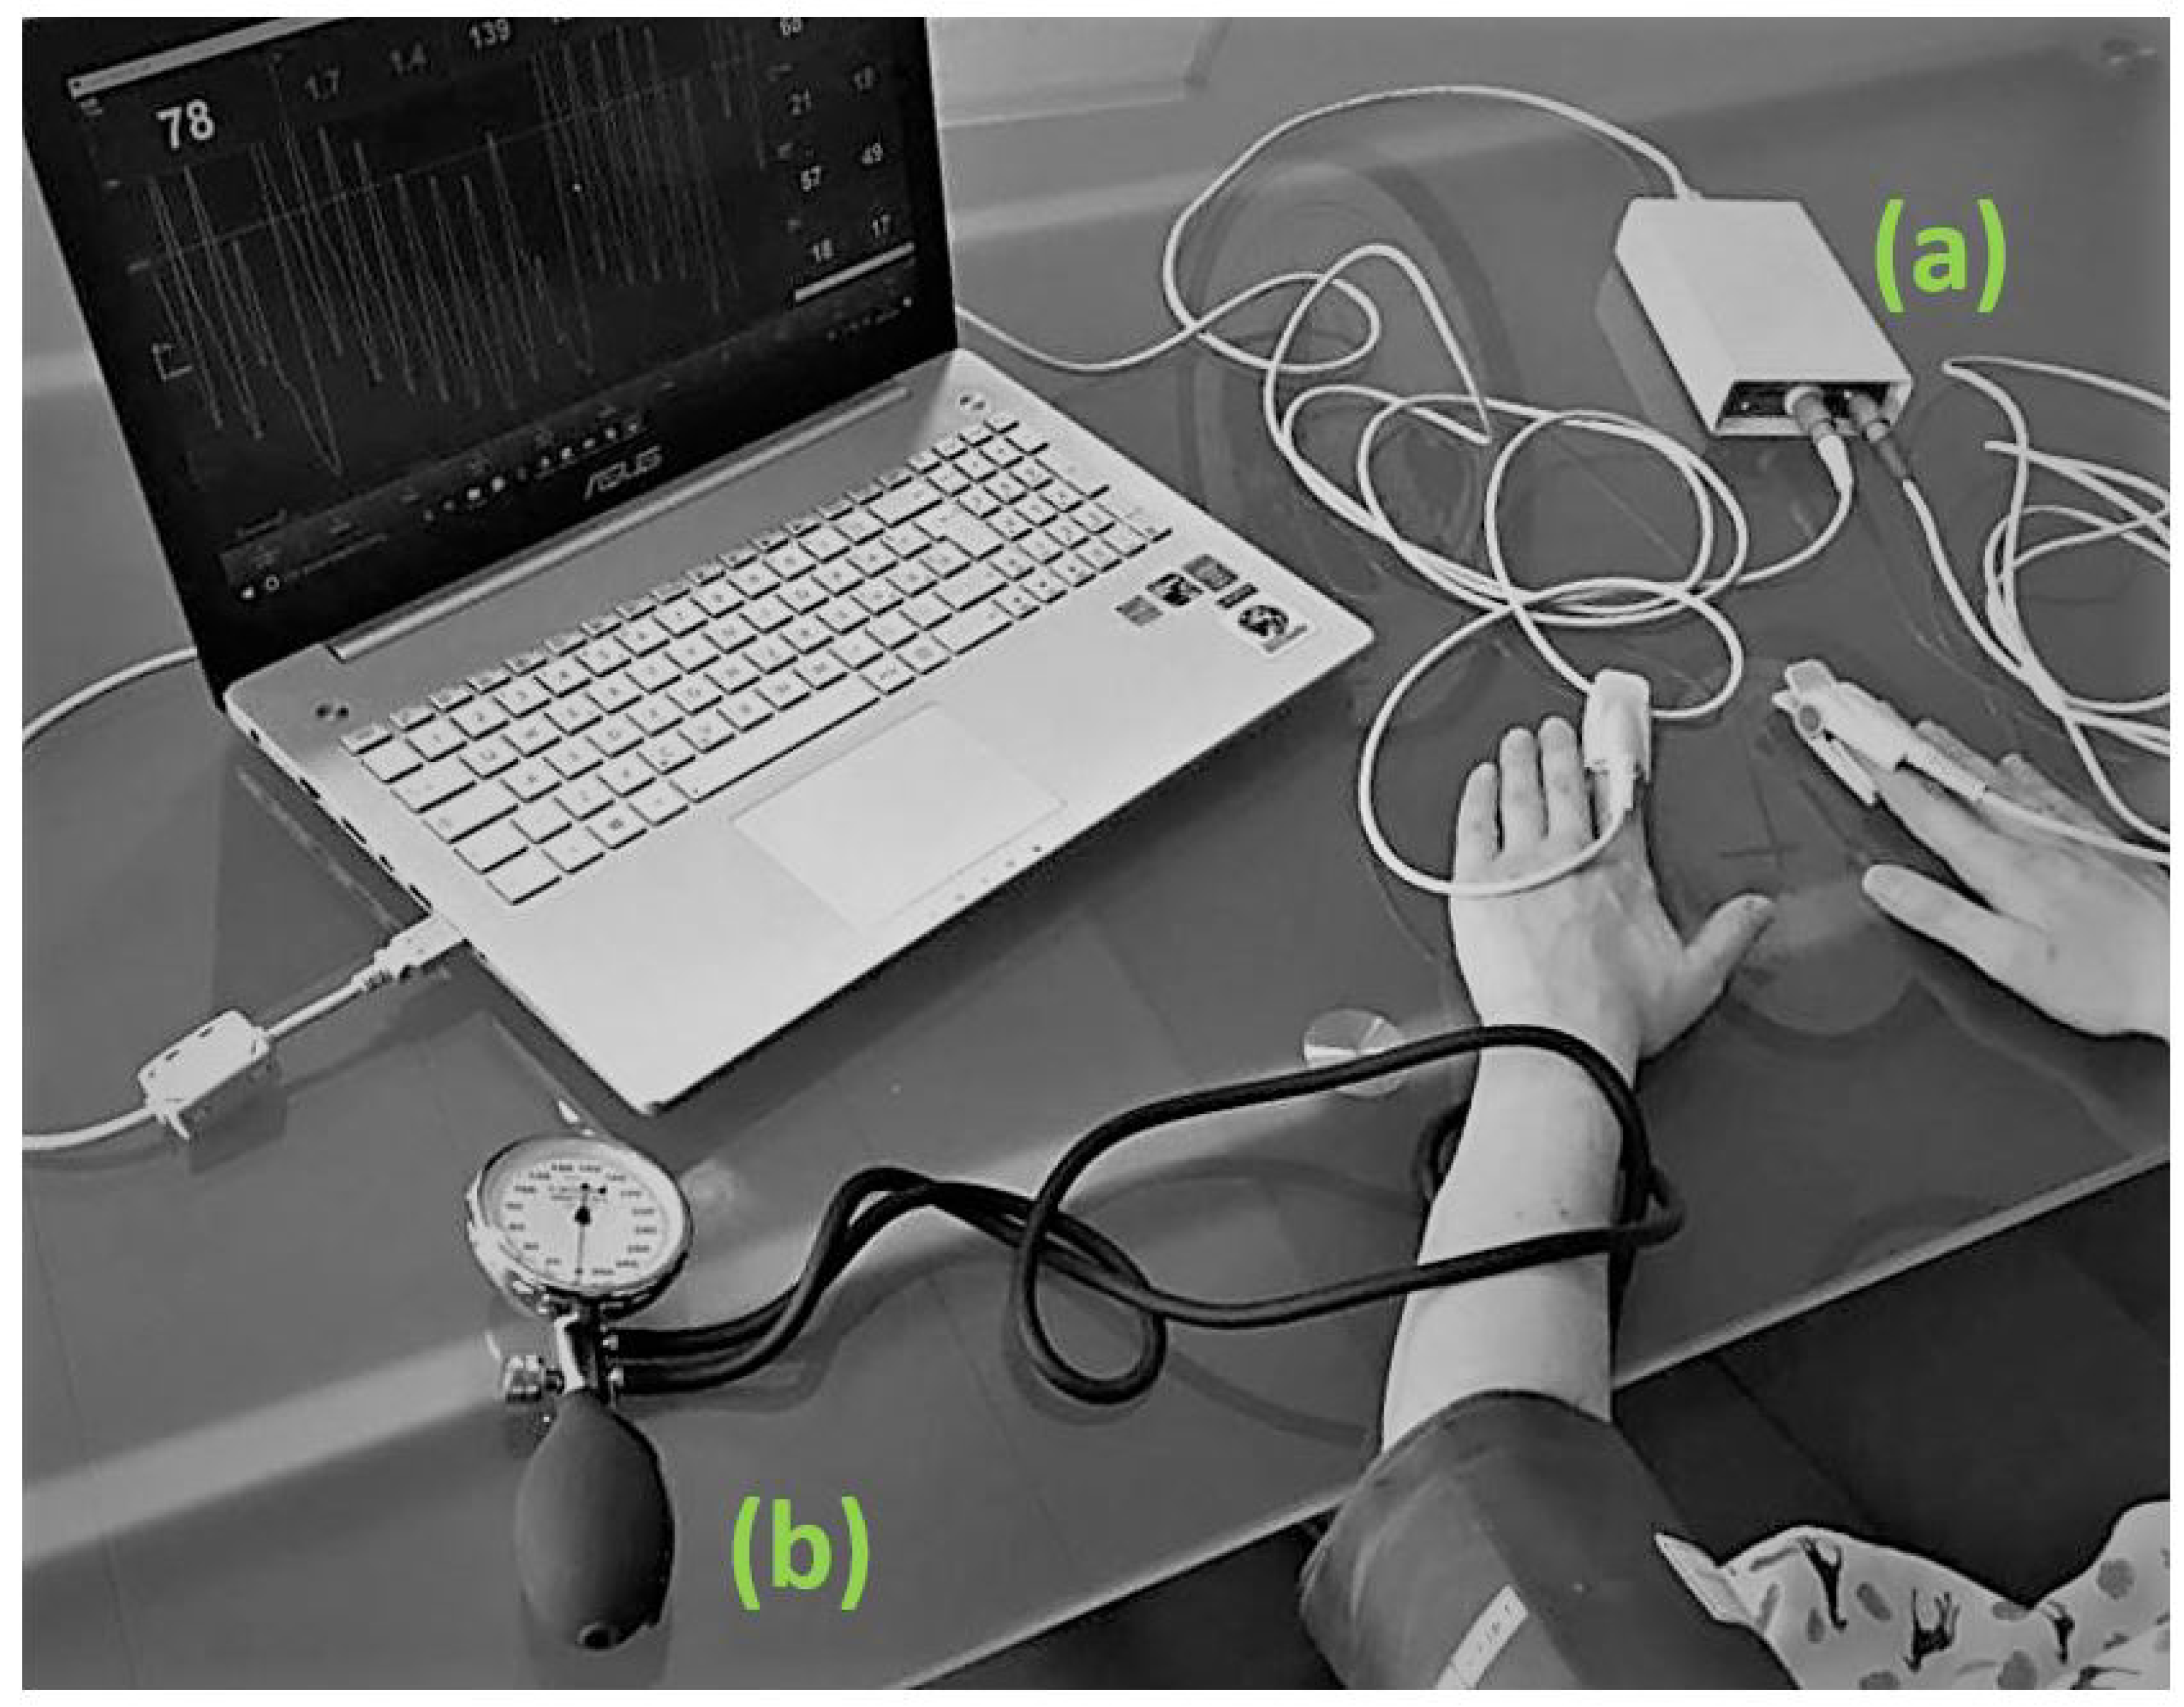
VenoScreen® (medis). VenoScreen was connected via a USB interface to a computer equipped with the CardioVascular Lab software package (MEDIS company, Ilmenau). The software verified, evaluated and displayed the measured PPG signals.
-
Prakticus II aneroid sphygmomanometer® (Friedrich Bosch GmbH & Co. KG). The sphygmomanometer, applied above the elbow on the subject’s left arm, was used to induce blood-flow blockage while measuring the blood pressure.
PPG processing
The PPG signal was obtained by measuring infrared light passing through finger skin. A LED light is diffused through the human tissue and then detected by a photo-detector located at the opposite side of the LED. The transmittance varies over time in accordance with variations in the blood volume. The device that records the PPG signal provides two different type of information: the signal that represents the light that is detected by a photo-detector (light transmitted) and the transmittance, which is the proportion of the incident (approaching) light that travels through the tissue to the photo-detector. The PPG signal is modulated by each cardiac cycle and may be influenced by several factors, such as breathing and movements. Moreover, the PPG signals may vary according to blood-oxygen saturation, skin temperatures, skin structure and external factors such as light in the environment. The aim of the pre-processing phase is reducing the PPG distortions, which may be observed in the wave profiles and may influence the features extraction, thus negatively impacting the subsequent phases of signal processing and the final diagnosis. For this reason, the following filters were applied on the PPG signal:
  • Noise: Inevitably, the PPG signal contained high-frequency noise, which resulted from ambient light, thermal noise and other unclassified noise. The power line represented another noise source characterized by 50 Hz sinusoidal interference, probably accompanied by a number of harmonics [18]. To remove this noise, a simple filtering approach was applied, i.e., low-pass filter with 20 dB attenuation at 8 Hz [19].
  • Baseline wander: Baseline wander filtering was required in order to minimize changes in beat morphology, which did not have cardiac origin [18]. The technique used for baseline wander filtering consisted in down-sampling the PPG signal to 2 Hz, followed by forward/backwards filtering using a second-order low-pass Butterworth filter with a cut-off frequency of 0.5 Hz [20]. After that, the signal was unsampled and subtracted from the original PPG signal.
  • Outliers: To remove outliers, the “isoutlier” function (The MathWorks, Inc., Natick, MA, USA), was applied to the PPG signal. A point was considered outlier when its value was more than three scaled median absolute deviations (MAD) away from the PPG signal median. The outliers were detected every 10 s and they were replaced by the mean value calculated in the same interval.
The sampling frequency of the PPG signal recorded by the VenoScreen device was 200 Hz.
ED gold standard classification was obtained by evaluating the PPG signal as in the actual clinical practice (Section 1).

2.1.2. Feature Extraction

PPG features
Inspired by the authors of [21,22], who proved the heart rate and augmentation index correlate with ED, and considering the work in [23], where a set of PPG features are shown to be potentially related to CVDs, in this work, we identified the following as features:
  • Systolic Amplitude ( S A ):
    S A = M S 1 M F 1
    where M S 1 and M F 1 are the PPG signal amplitude in S 1 (systolic peak) and F 1 (dicrotic point before the systolic peak).
  • Inflection Point Area ratio ( I P A ):
    I P A = A 2 A 1
    where area A1 and area A2 are obtained by dividing the pulse area into two areas at the dicrotic notch.
  • Pulse Interval ( P I ):
    P I = t F 2 t F 1
  • Hearth Rate ( H R ):
    H R = 1 t S 2 t S 1
    where t S 2 is the time at which the second systolic peak occurred.
  • D e l t a T , which is the time between the systolic and diastolic peaks:
    D e l t a T = t E 1 t S 1
    where t E 1 is the time of diastolic peak.
  • Stiffness Index ( S I ):
    S I = H P ( t E 1 t S 1 )
    where H P is the subject’s height.
  • Augmentation Index ( A I ):
    A I = ( M S 2 M F 2 ) ( M E 2 M F 2 ) D e l t a T
    where M S 2 and M F 2 are the PPG signal amplitude in S 2 (systolic peak) and F 2 (dicrotic point before the systolic peak), and M E 2 is the PPG signal amplitude in E 2 (diastolic peak).
  • Recovery Time ( R T ). R T indicates how many seconds, from the maximum value of the PPG during the post-occlusion phase, are required to return to PPG pre-occlusion condition (Figure 3a).
For the extraction of the features from the PPG signal, ten beats were selected randomly during the pre-occlusion phase. The fiducial points were identified for each beat (C1, C2, E1, E2, F1, F2, S1, and S2) to identify and quantify the parameters. Finally, the mean for each feature was calculated.
Anthropometric features
Considering our previous experience in this field [17], the following anthropometric features were investigated: age, BMI and pulse pressure (PP), (i.e., the difference between systolic and diastolic blood pressure at rests measured with the sphygmomanometer) [24].

2.1.3. Classification

To perform feature classification, SVMs were implemented [25]. Indeed, SVM decisions are only determined by the support vectors, which makes SVM robust to noise in training data. Here, SVM with the Gaussian kernel ( Ψ ) was used to prevent parameter proliferation while lowering computational complexity and limiting overfitting. For our binary classification problem, given a training set of N data { y k , x k } k = 1 N , where x k is the kth input feature vector and y k is the kth output label, the SVM decision function takes the form of as follows:
f ( x ) = s i g n k = 1 N a k * y k Ψ ( x , x k ) + b
where
Ψ ( x , x k ) = e x p { γ | | x x k | | 2 2 / σ 2 } , γ > 0
b is a real constant and a k * is retrieved as follow:
a k * = max 1 2 k , l = 1 N y k y l Ψ ( x k , x l ) a k a l + k = 1 N a k
with
k = 1 N a k y k = 0 , 0 a k C , k = 1 , , N
γ and C were retrieved with grid search, as explained more in detail in Section 2.2.
For the sake of completeness, the performance of other classifiers, i.e., k-nearest neighbors (KNN) [26] and RF [27], were investigated too.
Prior to classification, the feature matrices were normalized within each feature dimension.

2.2. Experimental Protocol

To investigate the two hypotheses mentioned in Section 1, different set of features were considered (as introduced in Section 2.1.2):
  • For H1, eight PPG features were used (Table 1).
  • For H2, 11 features (three anthropometric features (Table 2) as well as eight PPG features) were used.
Considering the limited size of ppgEDD, Leave-One-Out (LOO) cross validation (CV) was implemented for testing purposes, as suggested in the ML literature (e.g., [28]). LOO-CV implies that, each time, 58 patients were used for training and the remaining one for testing.
During the training phase, classifier–hyperparameter tuning was implemented using a grid-search and LOO-CV approach. For SVMs, the grid-search space for γ and C was set to [1, 0.1, 0.001, 0.0001] and [1, 10, 100, 1000], respectively. The grid-search space for KNN number of neighbors was [1, 3, 5, 7, 9] and that for the number of trees for RF was [5, 10, 15, 20, 30, 40].
The performance of each classifier was evaluated in terms of accuracy ( A c c ), recall ( R e c ) and precision ( P r e c ):
A c c = T P + T N T P + T N + F P + F N
R e c = T P T P + F N
P r e c = T P T P + F P
where T P and F N refer to subjects with ED that were and were not classified correctly, respectively, and T N and F P refer to subjects without ED that were and were not classified correctly, respectively.
All the experiments were implemented using scikit-learn Python libraries https://scikit-learn.org/stable/index.html.

3. Results

We tested our approach on the ppgEDD dataset to compare the endothelial function differences between patient with ED (n = 28) and patient without the disease (n = 31) based on the PPG signal. A full leave-one-out cross-validation was performed in our experiments procedure described in Section 2.2. In Table 3 and Table 4, the performance of each classifier is shown for H1 and H2, respectively. For H1, the best performance in terms of accuracy ( A c c = 71%) was obtained with SVM, with a recall of 59% and a precision of 73%. The confusion matrices for KNN, RF and SVM are shown in Figure 4a–c.
When investigating H2, as shown in Table 4, the SVM classification results were still the best, with a further improvement to 67% ( R e c ) and 69% ( P r e c ). The normalized confusion matrices for KNN, RF and SVM are shown in Figure 4d.
The tested classifiers achieved encouraging results, with the best performance achieved by SVM (accuracy = 71%, recall = 67%). As reported in the literature [29]), similarity in performance metrics among the ML methods may be due to the fact that the analyzed dataset and the feature space were small.

4. Discussion and Conclusions

In this study, we presented and evaluated an innovative learning-based approach to ED screening from PPG data. Two different hypotheses were investigated for ED classification, i.e., using (H1) only PPG features and (H2) including also anthropometric features. Three ML classifiers (i.e., SVM, KNN and RF) were tested.
With H1 and H2, we showed that the proposed feature set can be promising for ED screening, even though further investigation is needed, e.g., to increase the ppgEDD dataset size numerosity. Results achieved when investigating H2 suggest that including anthropometric features is useful, as in accord with previous work in the literature (e.g., [17]).
The experimental results show that SVM outperformed KNN and RF. This is probably due to the SVM’s ability to tackle: (1) the dimension of our feature space, which was high when compared with the number of ppgEDD subjects; and (2) the noise present in the PPG data.
The main novelty of this study relies on the fact that PPG features were used in combination with anthropometric ones to classify ED. The results verify that the ED SVM classification method significantly improved the generalization capability achievable with the SVM classifier. Another advantage of the SVM approach was found in its high sparseness, explained by the fact that the adopted optimization criterion was based on minimizing the number of support vectors.
As future work, we would like to investigate other anthropometric features, such as dyslipidemia and smoking habits, integrating PPG data with data coming from structured electronic-health-record datasets. Furthermore, we will investigate other features extracted from the PPG signal, such as those proposed in [30] to compute the diastolic and systolic pressure, and in [31,32] to analyze the ECG waveform. Our expectation is that research on this new ML approach based on PPG features will be empowered by the proposed work. Surely the prediction of ED based on this approach should be further explored using machine learning with other large clinical datasets and in other populations.
In conclusion, it is acknowledged that further research is required to ameliorate the algorithm as to offer all possible support for diagnosis, but the results presented here are surely a promising step towards a helpful intelligent PPG system to support the screening of ED.

Author Contributions

Introduction, C.C., E.F., S.M., L.M. and M.P.; Methods, C.C., S.M. and L.M.; Results, C.C., S.M. and L.M.; Discussion and Conclusion, C.C., E.F., S.M., L.M. and M.P. All authors contributed to the development and set up of the general idea.

Funding

This research received no external funding.

Acknowledgments

The work described in this paper was supported by STRUMEDICAL srl that provided us with the VenoScreen devices used in our studies.

Conflicts of Interest

The authors declare no conflicts of interest.

References

  1. Wilkins, E.; Wilson, L.; Wickramasinghe, K.; Bhatnagar, P.; Leal, J.; Luengo-Fernandez, R.; Burns, R.; Rayner, M.; Townsend, N. European Cardiovascular Disease Statistics 2017; European Heart Network: Brussels, Belgium, 2017. [Google Scholar]
  2. Hadi, H.A.; Carr, C.S.; Al Suwaidi, J. Endothelial dysfunction: Cardiovascular risk factors, therapy, and outcome. Vasc. Health Risk Manag. 2005, 1, 183–198. [Google Scholar] [PubMed]
  3. Brunner, H.; Cockcroft, J.R.; Deanfield, J.; Donald, A.; Ferrannini, E.; Halcox, J.; Kiowski, W.; Lüscher, T.F.; Mancia, G.; Natali, A.; et al. Endothelial function and dysfunction. Part II: Association with cardiovascular risk factors and diseases. A statement by the Working Group on Endothelins and Endothelial Factors of the European Society of Hypertension. J. Hypertens. 2005, 23, 233–246. [Google Scholar] [CrossRef] [PubMed]
  4. Anderson, T.J. Arterial stiffness or endothelial dysfunction as a surrogate marker of vascular risk. Can. J. Cardiol. 2006, 22, 72B–80B. [Google Scholar] [CrossRef] [Green Version]
  5. Félétou, M. The endothelium, Part I: Multiple functions of the endothelial cells—Focus on endothelium-derived vasoactive mediators. Colloquium Series on Integrated Systems Physiology: From Molecule to Function. Morgan Claypool Life Sci. 2011, 3, 1–306. [Google Scholar]
  6. van Hinsbergh, V.W. Endothelium role in regulation of coagulation and inflammation. In Seminars in Immunopathology; Springer: Berlin, Germany, 2012; Volume 34, pp. 93–106. [Google Scholar]
  7. Corretti, M.C.; Anderson, T.J.; Benjamin, E.J.; Celermajer, D.; Charbonneau, F.; Creager, M.A.; Deanfield, J.; Drexler, H.; Gerhard-Herman, M.; Herrington, D.; et al. Guidelines for the ultrasound assessment of endothelial-dependent flow-mediated vasodilation of the brachial artery: A report of the International Brachial Artery Reactivity Task Force. J. Am. Coll. Cardiol. 2002, 39, 257–265. [Google Scholar] [CrossRef]
  8. Zahedi, E.; Jaafar, R.; Ali, M.M.; Mohamed, A.; Maskon, O. Finger photoplethysmogram pulse amplitude changes induced by flow-mediated dilation. Physiol. Meas. 2008, 29, 625–637. [Google Scholar] [CrossRef] [PubMed]
  9. Flammer, A.J.; Anderson, T.; Celermajer, D.S.; Creager, M.A.; Deanfield, J.; Ganz, P.; Hamburg, N.M.; Lüscher, T.F.; Shechter, M.; Taddei, S.; et al. The assessment of endothelial function: From research into clinical practice. Circulation 2012, 126, 753–767. [Google Scholar] [CrossRef] [PubMed]
  10. Kuznetsova, T.; Van Vlierberghe, E.; Knez, J.; Szczesny, G.; Thijs, L.; Jozeau, D.; Balestra, C.; Dhooge, J.; Staessen, J.A. Association of digital vascular function with cardiovascular risk factors: A population study. Br. Med J. Open 2014, 4, e004399. [Google Scholar] [CrossRef] [PubMed]
  11. Mashayekhi, G.; Zahedi, E.; Attar, H.M.; Sharifi, F. Flow mediated dilation with photoplethysmography as a substitute for ultrasonic imaging. Physiol. Meas. 2015, 36, 1551–1571. [Google Scholar] [CrossRef] [PubMed]
  12. Moerland, M.; Kales, A.; Schrier, L.; Van Dongen, M.; Bradnock, D.; Burggraaf, J. Evaluation of the EndoPAT as a tool to assess endothelial function. Int. J. Vasc. Med. 2012, 2012, 1–8. [Google Scholar] [CrossRef] [PubMed]
  13. Allen, J. Photoplethysmography and its application in clinical physiological measurement. Physiol. Meas. 2007, 28, 1–39. [Google Scholar] [CrossRef] [PubMed]
  14. Moraes, J.; Rocha, M.; Vasconcelos, G.; Vasconcelos Filho, J.; de Albuquerque, V. Advances in photopletysmography signal analysis for biomedical applications. Sensors 2018, 18, 1894. [Google Scholar] [CrossRef] [PubMed]
  15. Weng, S.F.; Reps, J.; Kai, J.; Garibaldi, J.M.; Qureshi, N. Can machine-learning improve cardiovascular risk prediction using routine clinical data? PLoS ONE 2017, 12, e0174944. [Google Scholar] [CrossRef] [PubMed]
  16. Boursalie, O.; Samavi, R.; Doyle, T.E. M4CVD: Mobile machine learning model for monitoring cardiovascular disease. Procedia Comput. Sci. 2015, 63, 384–391. [Google Scholar] [CrossRef]
  17. Calamanti, C.; Paolanti, M.; Romeo, L.; Bernardini, M.; Frontoni, E. Machine learning-based approaches to analyse and improve the diagnosis of endothelial dysfunction. In Proceedings of the IEEE/ASME International Conference on Mechatronic and Embedded Systems and Applications, New York, NY, USA, 2–4 July 2018; pp. 1–6. [Google Scholar]
  18. Sörnmo, L.; Laguna, P. Bioelectrical Signal Processing in Cardiac and Neurological Applications; Academic Press: Cambridge, MA, USA, 2005; Volume 8. [Google Scholar]
  19. Peng, F.; Zhang, Z.; Gou, X.; Liu, H.; Wang, W. Motion artifact removal from photoplethysmographic signals by combining temporally constrained independent component analysis and adaptive filter. Biomed. Eng. Online 2014, 13, 50. [Google Scholar] [CrossRef] [PubMed] [Green Version]
  20. Solem, K.; Olde, B.; Sornmo, L. Prediction of intradialytic hypotension using photoplethysmography. IEEE Trans. Biomed. Eng. 2010, 57, 1611–1619. [Google Scholar] [CrossRef] [PubMed]
  21. Maio, R.; Miceli, S.; Sciacqua, A.; Leone, G.G.; Bruni, R.; Naccarato, P.; Martino, F.; Sesti, G.; Perticone, F. Heart rate affects endothelial function in essential hypertension. Intern. Emerg. Med. 2013, 8, 211–219. [Google Scholar] [CrossRef] [PubMed]
  22. McEniery, C.M.; Wallace, S.; Mackenzie, I.S.; McDonnell, B.; Yasmin; Newby, D.E.; Cockcroft, J.R.; Wilkinson, I.B. Endothelial function is associated with pulse pressure, pulse wave velocity, and augmentation index in healthy humans. Hypertension 2006, 48, 602–608. [Google Scholar] [CrossRef] [PubMed]
  23. Elgendi, M. On the analysis of fingertip photoplethysmogram signals. Curr. Cardiol. Rev. 2012, 8, 14–25. [Google Scholar] [CrossRef] [PubMed]
  24. Beigel, R.; Dvir, D.; Arbel, Y.; Shechter, A.; Feinberg, M.S.; Shechter, M. Pulse pressure is a predictor of vascular endothelial function in middle-aged subjects with no apparent heart disease. Vasc. Med. 2010, 15, 299–305. [Google Scholar] [CrossRef] [PubMed] [Green Version]
  25. Burges, C.J. A tutorial on support vector machines for pattern recognition. Data Min. Knowl. Discov. 1998, 2, 121–167. [Google Scholar] [CrossRef]
  26. Keller, J.M.; Gray, M.R.; Givens, J.A. A fuzzy k-nearest neighbor algorithm. IEEE Trans. Syst. Man Cybern. 1985, SMC-15, 580–585. [Google Scholar] [CrossRef]
  27. Breiman, L. Random forests. Mach. Learn. 2001, 45, 5–32. [Google Scholar] [CrossRef]
  28. Wong, T.T. Performance evaluation of classification algorithms by k-fold and leave-one-out cross validation. Pattern Recognit. 2015, 48, 2839–2846. [Google Scholar] [CrossRef]
  29. Nasrabadi, N.M. Pattern recognition and machine learning. J. Electron. Imaging 2007, 16, 049901. [Google Scholar]
  30. Rundo, F.; Ortis, A.; Battiato, S.; Conoci, S. Advanced bio-inspired system for noninvasive cuff-less blood pressure estimation from physiological signal analysis. Computation 2018, 6, 46. [Google Scholar] [CrossRef]
  31. Rundo, F.; Conoci, S.; Ortis, A.; Battiato, S. An advanced bio-inspired PhotoPlethysmoGraphy (PPG) and ECG pattern recognition system for medical assessment. Sensors 2018, 18, 405. [Google Scholar] [CrossRef] [PubMed]
  32. Dutt, D.N.; Shruthi, S. Digital processing of ECG and PPG signals for study of arterial parameters for cardiovascular risk assessment. In Proceedings of the 2015 International Conference on Communications and Signal Processing (ICCSP), Melmaruvathur, India, 2–4 April 2015; pp. 1506–1510. [Google Scholar]
Figure 1. Workflow of the proposed learning-based approach to endothelial dysfunction (ED) screening from photoplethysmographic and anthropometric data.
Electronics 08 00271 g001
Figure 2. PPG-signal acquisition setup: (a) VenoScreen®(medis) with two photoplethysmography sensors; and (b) sphygmomanometer with cuff. Acquired signals were processed by the VenoScreen® (medis) software.
Electronics 08 00271 g002
Figure 3. (a) The three phases of the photoplethysmography (PPG) signal acquisition: pre-occlusion (normal blood flow), occlusion (occluded flow), and post-occlusion (restored flow). Dotted lines highlights a zoomed signal portion. (b) From the zoomed signal portion, the parameters useful for computing PPG features are highlighted.
Electronics 08 00271 g003
Figure 4. Confusion matrices (CMs) obtained when classifying photoplethysmography features (H1) with: (a) K-Nearest Neighbor (KNN); (b) Random Forest (RF); and (c) Support Vector Machine (SVM) classifier. (d) CM for SVM obtained when testing H2 (both photoplethysmography and anthropometric features).
Electronics 08 00271 g004
Table 1. PPG feature mean (±Standard Deviation (SD)) of the PPG endothelial dysfunction dataset (ppgEDD).
FeaturesMean ± SD
SA 7.91 ± 5.68
IPA 0.61 ± 0.28
PI 172.92 ± 22.98
HR 69.19 ± 9.67
D e l t a T 202.48 ± 40.29
SI 0.87 ± 0.18
AI 1.45 ± 0.38
RT 5.05 ± 0.66
Table 2. Anthropometric feature mean (±Standard Deviation (SD)) of the PPG endothelial dysfunction dataset (ppgEDD).
FeaturesMean ± SD
Age (years) 39.0 ± 16.0
BMI (Kg/m 2 ) 25.7 ± 4.9
PP (mmHg) 44.15 ± 12.1
Table 3. Investigation of H1: Classification performance obtained when classifying PPG features with K-Nearest Neighbor (KNN), Random Forest (RF) and Support Vector Machine (SVM) classifiers. Classification accuracy ( A c c ), recall ( R e c ) and precision ( P r e c ) are reported.
Classifier Acc Rec Prec
KNN0.640.590.62
RF0.660.630.63
SVM0.710.590.73
Table 4. Investigation of H2: Classification performance obtained when classifying photoplethysmography and anthropometric features with KNN, Random Forest (RF) and SVM classifiers. Classification accuracy ( A c c ), recall ( R e c ) and precision ( P r e c ) are reported.
Classifier Acc Rec Prec
KNN0.640.520.64
RF0.490.440.44
SVM0.710.670.69

