Article

Analysing Students’ Achievement in the Learning of Electronics Supported by ICT Resources

by
David Valiente
1,2,*,†,
Luis Payá
1,†,
Susana Fernández de Ávila
2,†,
Juan C. Ferrer
2,† and
Oscar Reinoso
1,†
1
Systems Engineering and Automation Department, Miguel Hernández University, 03202 Elche (Alicante), Spain
2
Communications Engineering Department, Miguel Hernández University, 03202 Elche (Alicante), Spain
*
Author to whom correspondence should be addressed.
These authors contributed equally to this work.
Electronics 2019, 8(3), 264; https://doi.org/10.3390/electronics8030264
Submission received: 23 January 2019 / Revised: 22 February 2019 / Accepted: 23 February 2019 / Published: 28 February 2019
(This article belongs to the Section Computer Science & Engineering)

Abstract

:
Over the past few decades, the incipient growth of technology applications sustained by electronics has contributed to the adaption of learning programs in many engineering degrees at university, fostering the presence of electronics subjects. This highlights the paramount importance of improving the teaching of electronics, especially in the first years of Bachelor’s degrees in engineering. However, despite the fact that the teaching programs have been periodically renewed with more practical sessions, the students’ outcomes are still noticeably low. So far, results only confirm improvements in the students’ performance in the resolution of electronic circuits. Nonetheless, this is generally subject to the application of repetitive circuit resolution models, to the detriment of the real and active understanding of electronic principles. In this context, this study assesses the actual efficacy of different ICT (Information, Communication and Technology) resources, introduced into an electronics course, taught in an engineering Bachelor’s degree, within the Spanish official university system. These resources have been sequentially introduced during five consecutive years. We have conducted a statistical analysis to infer whether all the resources are equally relevant for the achievement of the students or not. In addition, we have designed a survey to measure the perceived improvement in the understanding of concepts, acquired competences, and reported satisfaction and attitude towards the use of specific resources during the program. Amongst others, LMS (Learning Management System) support, online PBL (Problem-Based Learning) activities, and CSA (Circuit Simulation Applets) have been considered. Overall, the designed learning program has been intended to provide students with long-term references to enrich their resources’ background regarding electronics.

1. Introduction

It is widely acknowledged by the research community that many students present severe misconceptions about the essentials of electronics [1,2]. This is not an exception when it comes to engineering degrees [3,4,5]. In the recent years, many efforts have been made regarding the analysis of the main difficulties experienced by students [6,7]. Different studies have been principally focused on the understanding of the behaviour of simple electronic circuits [8] and the reasoning they tend to apply to general purpose electric and electronic circuits [9], and even under more complex casuistry [10]. It is generally admitted that students are prone to conceive a wrong physic model for simple circuits, which they normally associate with incorrect macro models, assuming that electric current acts as a flow of a given magnitude that circulates throughout a pipe. Undoubtedly, this misconception leads to wrong assumed effects regarding the micro interactions over the circuit, and in presence of active electronic components [11].
Another important aspect to study involves the teaching roles and the influence of the teacher on the significative learning acquired by the students [12]. As described above, many works have focused on the difficulties and misconceptions on the students’ side. However, more recently, some authors have also concentrated on analysing: (i) teachers’ conceptions of electronics [13]; (ii) teachers’ awareness of students’ misconceptions [14]; (iii) teachers’ attitude to new active learning strategies [15]; (iv) introduction of innovative learning programs [16,17].
Amongst the possible interventions to promote active learning in electronics, a variety of acknowledged alternatives have been proposed. On the one hand, most up-to-date approaches rely on the virtualization of laboratories in order to enhance the autonomous learning [18,19], and sometimes through online courses [20,21,22], or even supported by the use of mobile apps [23,24]. On the other hand, former contributions were more determined to the improvement of the learning programs and strategies [25,26,27]. Some other successful results have been reported by designs sustained by collaborative work frameworks [28,29,30]. Another widely accepted solution, which permits extrapolating diverse range of applications [31,32,33], introduces simulation tools in order to aid in the learning process [34,35,36]. To our understanding, there is a long list of possible combinations to integrate the use of such simulation tools to redesign the teaching programs. These have largely demonstrated their effectiveness to achieve promising results regarding the significative and active learning of the students.
Notwithstanding that traditional strategies for teaching electronics cannot be redesigned from scratch. Ohm’s and Kirchhoff’s laws are always essential, and must be taught from the first introductory lessons. In this sense, this work proposes a blended designed of a general program which combines the use of different ICT resources with a traditional teaching approach, during five consecutive academic years. The participants correspond to several undergraduate engineering groups who are immersed into their second year of degree. In particular, the course deals with the basic aspects of electronics. The typical teaching, based on master classes, has been fused with several additional activities: (a) hands-on laboratory sessions; (b) PBL activities to work in groups (both in person and online); (c) materials and activities accesible online through an LMS platform; (d) CSA, developed in Java [37], to provide students with a simulation complement to the theory explanations, to the practical sessions, and to reinforce the student’s autonomous comprehension when dealing with circuit resolution exercises; (e) periodic assignments (several exercises to be solved with both, the online applet, CSA, and analytically). Within this framework, we intend to promote an autonomous and active learning, under the supervision of the instructors.
Finally, we have been able to assess the real enhancement of students on the learning of electronics, considering different indicators of achievement and the use of each resource. To that end, we have statistically analysed different aspects over these five academic years. This work postulates that not all the resources are equally significant for the student’s outcomes. Despite the fact that possible correlations between the use of ICT resources and the grades may be intuited, the real influence of technology resources on the students is rather related to the specific type and use of such technology [38], within the general learning program. Another aspect worth considering is the level of engagement perceived in the students [39,40]. According to this, a specific survey has been designed in order to evaluate the improvement perceived by students on their concepts’ understanding, competences achievement, satisfaction, and attitude towards the use of certain resources within the program. The questions of this survey were validated by a group of experts, constituted by five full professors.
Overall, apart from expecting significant and active learning, and the restructuring of the misconceived understanding of electronics, this design seeks to provide students with long-term background resources, which they can use for their own purpose in the near future.

2. Methodology

2.1. Purpose

The underlying framework of the learning program studied in this work has been established in accordance with the data released by the New Media Consortium (NMC) and the Educause Learning Initiative (ELI) for the last Horizon report in higher education [41]. Hence, this learning program has taken into account the following general milestones:
(a)
Promoting deep and active learning approaches.
(b)
Promoting the experience design of blended learning.
Likewise, as per the Horizon challenges:
(c)
Improving digital literacy and digital skills.

2.2. Objectives

Once the framework has been defined, the following specific objectives have been devised:
(i)
Enhancing active learning regarding physic magnitudes within electronics: voltage, current, power.
(ii)
Solving and comprehending practical exercises and the operation of real electronic circuits.
(iii)
Providing students with ICT support resources for the active learning of electronics.

2.3. Expected Outcomes

The main outcomes initially expected from the implementation of the program are:
(i)
Improving the comprehension of essential electronics concepts and physic magnitudes.
(ii)
Contributing to the enrichment of the student’s background with related resources.
(iii)
Promoting the self-autonomy and entrepreneurship amongst students with blended learning platforms.
(iv)
Introducing digital tools and ICT resources.
(v)
Obtaining a comparative analysis to determine whether specific resources are significant enough for the achievement of the students.

2.4. Course Structure and Participants

This course comprises contents regarding the essentials of electronics. It is taught during the second year of a Bachelor’s engineering degree. The concepts, fundamentals and techniques taught in this course are common to many engineering degrees, and it could be even extrapolated to similar STEM degrees in other education institutions. Due to this fact, this course is simultaneously taught in three different engineering degrees which share core subjects up to the third year: Mechanics, Energy, and Electronics and Automation Bacherlor’s degrees. The students enrolled in this course have also taken a former subject which addresses the key principles of electric circuits resolution, based on the Ohm’s and Kirchhoff’s laws. Nonetheless, the average initial level of the students is reported to be significantly low.
Table 1 synthesizes the contents and the main aspects considered in the structure of the course. It is organized throughout an entire semester whose length is 15 weeks, with 3 h of theory lessons per week. After a brief introduction to semiconductors (unit 1) in the first lesson, the rest of the contents are distributed into three main blocks, which are associated to each unit of content (2-diodes, 3-operational amplifiers and 4-transistors). It is also worth noticing that the theory lessons have a prominent practical side, since we deal with many activities and exercises, solved by the lecturer with the participation of the students. Moreover, CSA, the Java applet for circuit simulation, is used in combination with all the theory lessons to support the analytical explanations. It represents an advantageous tool for explaining and exemplifying many theory aspects during the lesson, but also to confirm and compare with the analytical resolution of the exercises. It can be also noted that, at the end of each unit, an activity assignment is expected to be handed in by students, through a custom LMS platform, owned by the university. The students are encouraged to use the CSA to check the validity of their analytical resolutions for such assignments. Similarly, a final assignment is scheduled to be handed in during the 15th week. This last task consists of a revision dossier of activities and exercises to be expressly solved by using such CSA. Please note that the sort of activities and exercises solved during the lessons are indicated in the footnote of Table 1. As briefly mentioned above, the use and type of activities devised with CSA have been conscientiously designed so as to match with real aspects that students deal with during the hands-on sessions, and in following subjects and courses. All the activities represent real electronic circuits with direct relation to the most common difficulties detected in the students. The straightforward relationship between the activities and further real electronic applications demonstrates positive level of engagement amongst students. Applications such as instrumentation amplifiers for sensor measuring, clipping and clamping circuits for AC/DC conversion, or voltage regulators (see Table 1) are examples of high engagement amongst students.
Finally, 4 tutorials sessions of 2 h each, are scheduled in weeks 6th, 9th, 14th, and 15th, to empower face to face work groups, aiming at the resolution of PBL activities and exercises. Nevertheless, students have additional time to work collaboratively in these tasks through the LMS platform. It is also worth mentioning that a custom survey is passed to students during the initial and final weeks of the course, (1st and 15th, respectively). The intention is to obtain a complete insight of their improvements, seen from the student’s perception. The understanding of concepts, competences acquisition, satisfaction and attitude towards the program are assessed in this survey.
In addition, during the eight last weeks of the semester, 8 hands-on sessions are scheduled in the laboratory of electronics (2 h each). Here, the main principles and theory concepts studied in each unit are experimented in the laboratory by designing and assembling real electronic circuits, and measuring the output variables with the specific instrumentation and acquisition equipments.
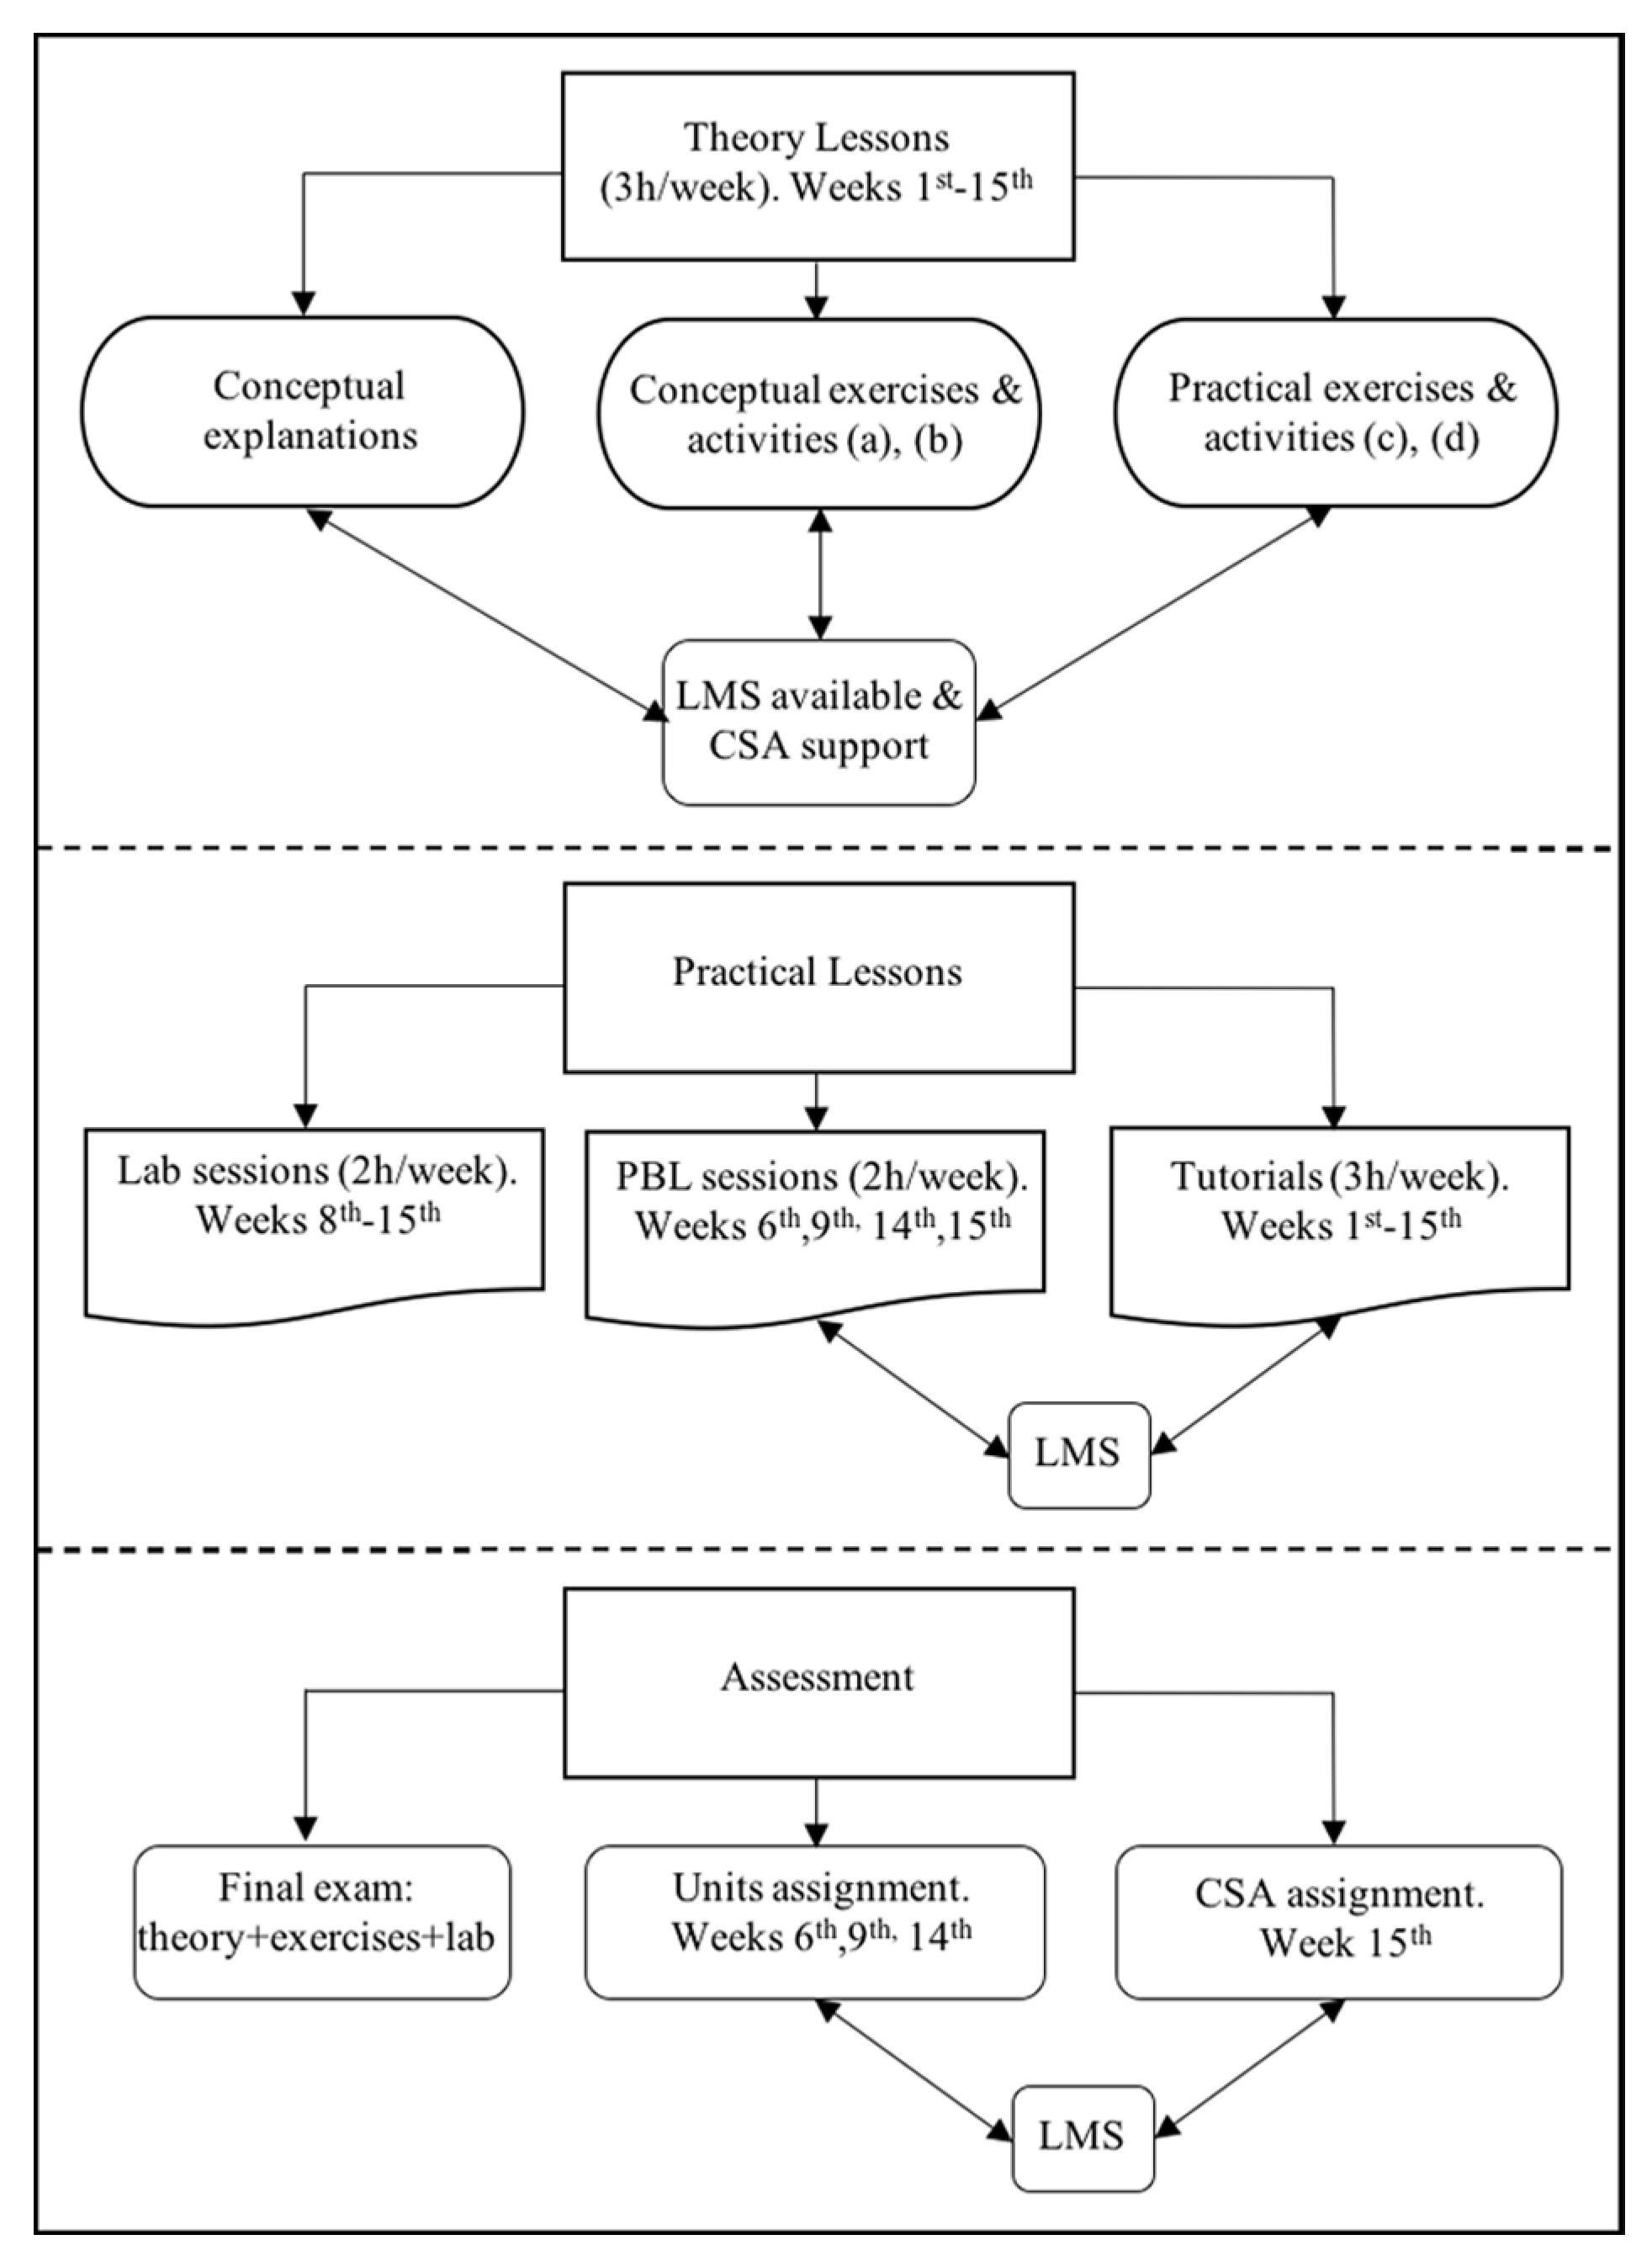
The procedure followed during the 15 weeks of this program may be depicted in terms of a diagram, as represented in Figure 1. It is important to note that students are expected to take a final exam after the course has finished. Despite the fact that students are encouraged to go through the described program with planned assignments, hands-on sessions and tutorials, the only real requisite to pass the course is to obtain a mark of 50 out of 100 in that final exam.

ICT Resources

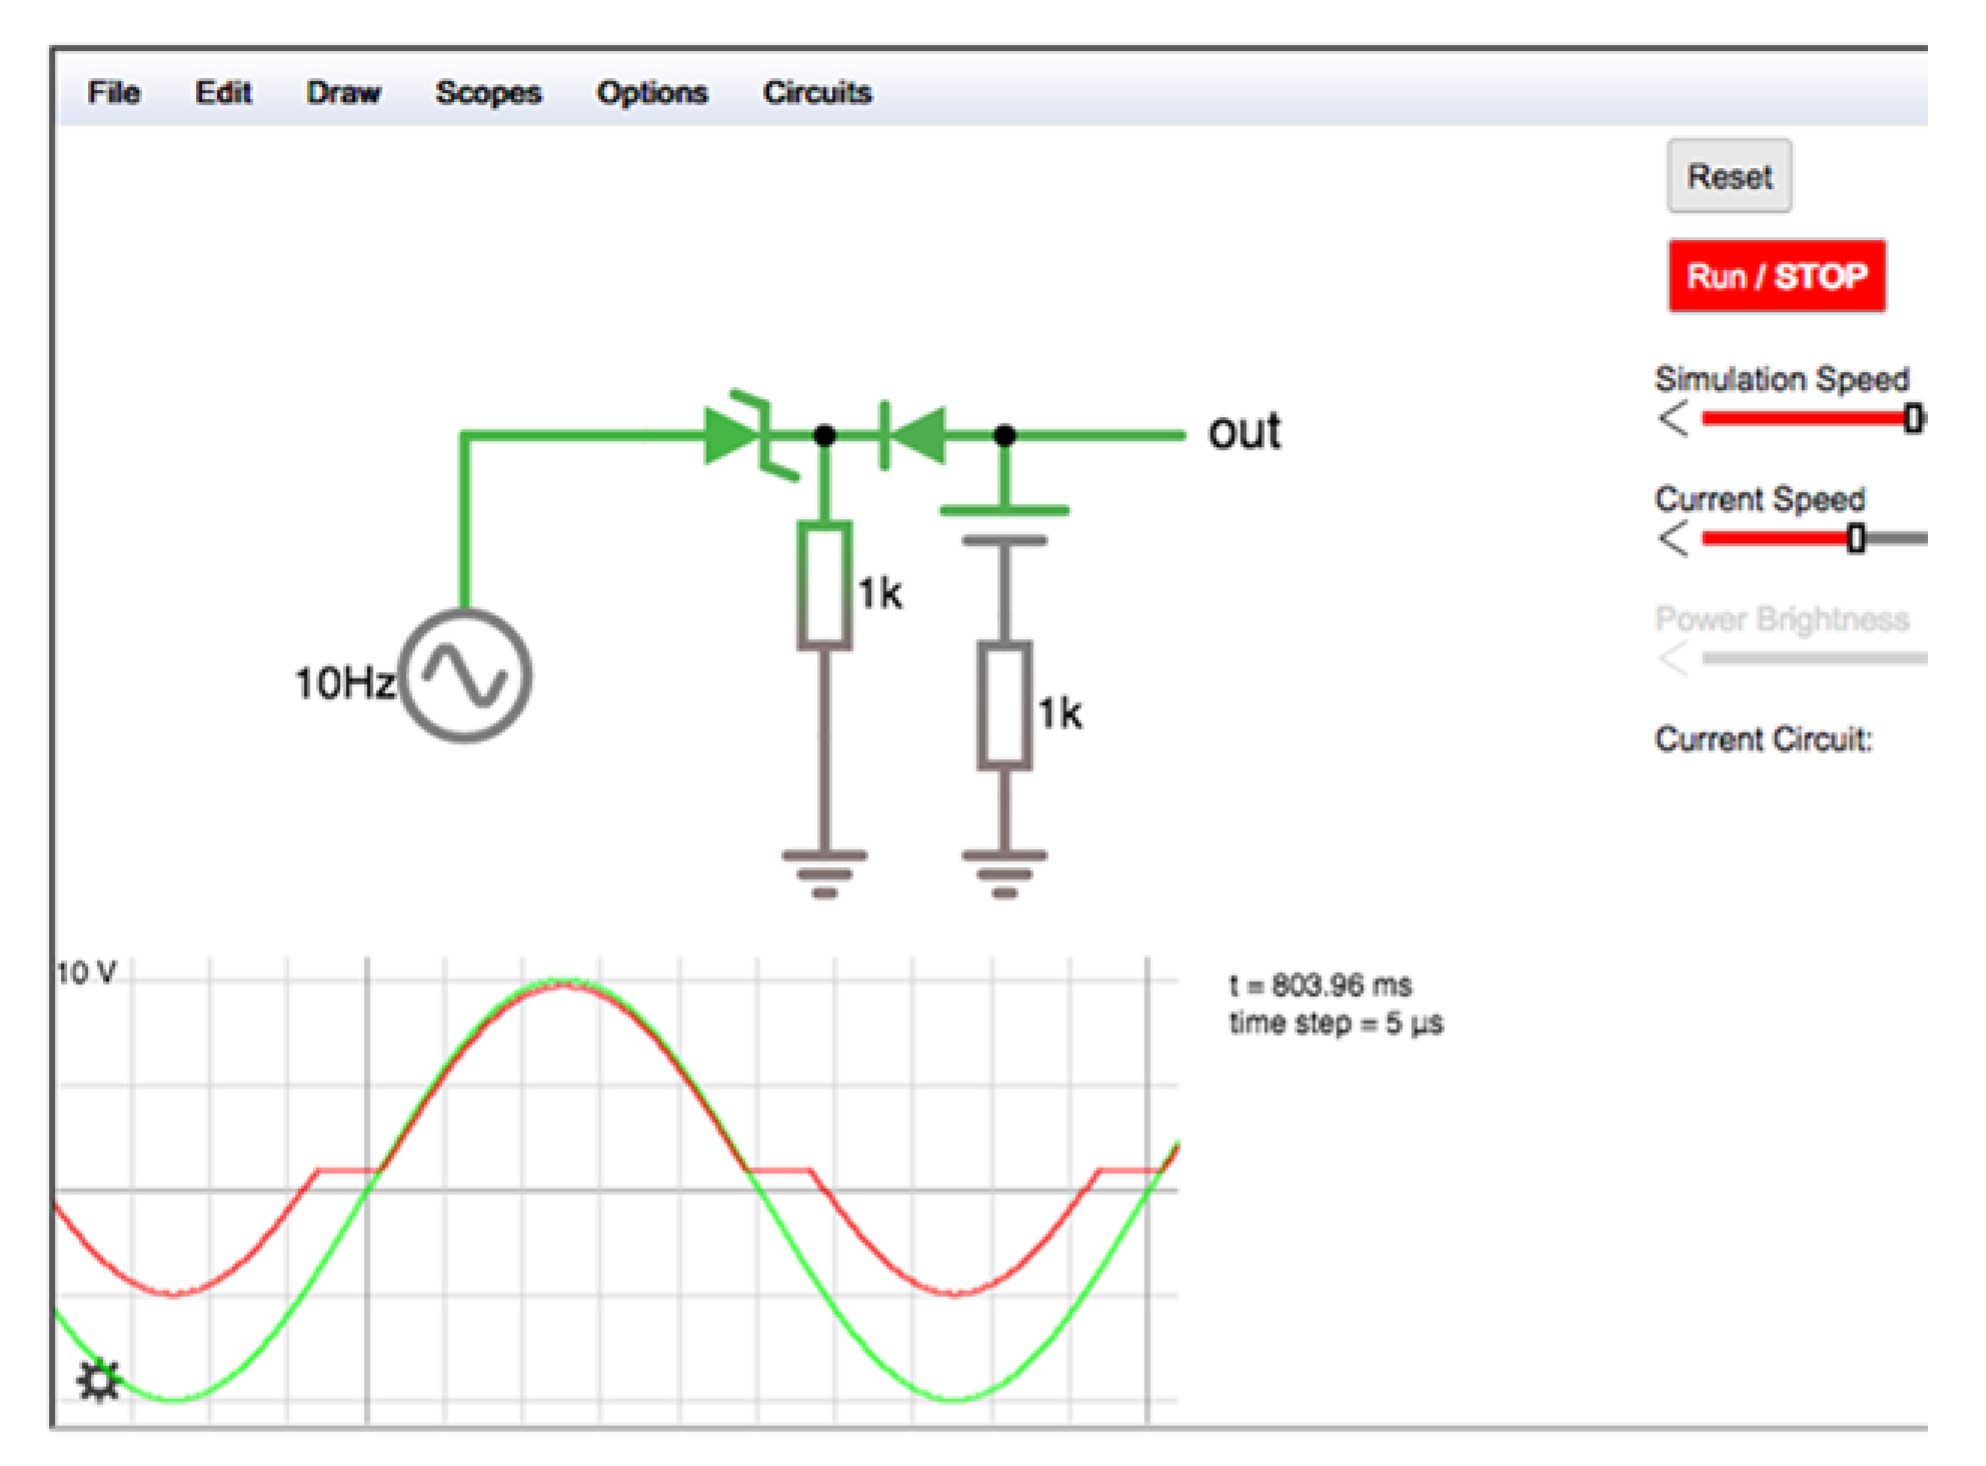
Once the main structure of this program has been overviewed, now Table 2 presents the chronology of the inclusion of ICT resources over the last five academic years, from 2013/14 to 2017/18. As briefly described in Section 1, the ICT resources consist of the following parts: (a) hands-on laboratory sessions; (b) problem-based learning (PBL) sessions, where collaborative resolution of activities and exercises are carried out, in both formats, in person and online sessions (through the LMS platform); (c) interactive materials available on the LMS platform, with documents associated to the theory lessons, solved activities and exercises. This prevents students who cannot attend the in person lessons from losing the plot of the course; (d) circuit simulation applet (CSA) to complement theory lessons; (e) an assignment of a revision dossier of activities, to be handed in during the last week of the course. In particular, this dossier was intended to make students extract further insights into the main electronic concepts involved in the course. Figure 2 shows the Java interface of the CSA, with an example included in the dossier of activities. All these activities supported by ICT resources have been included with the aim of reinforcing the active and autonomous learning. They are also aimed at promoting the students’ autonomy, allowing them to create their own understanding of the concepts, with the supervision of the instructors.

2.5. Assessment: Survey Design

Several assessment strategies can be applied to this program. The most straightforward one is the analysis of data from the grades obtained by the students in the assignments. In addition, a specific survey with two parts has been designed to be filled in during the first and final weeks of the course. The goal is to measure the level of improvement as perceived by the students after they finish the course. Special attention is paid to the understanding of concepts, competences acquisition, satisfaction and attitude to the program with the use of ICT resources such as CSA.
Table 3 summarizes the contents and aspects evaluated by the different subsets of questions included in the survey. The first block (questions 1–5) contains questions about basic electronics principles: physic magnitudes; general circuit laws. The second block (questions 6–10) consists of questions regarding simple circuits resolution; signals interpretation; graphical representation; and behaviour of simple active components. The third block (questions 11–12) is intended to evaluate the background of resources that students possess. The fourth block (questions 13–14) is aimed at assessing the actual use of ICT resources made by students as a support for their learning. Finally, the last block (questions 15–17) is devised to measure the general motivation amongst students towards the learning of electronics, but more particularly, to quantify the benefits experienced during the implementation of the program and their attitude to it. All these questions were answered in a discrete Likert scale from 1 (absolutely disagree) to 5 (absolutely agree). The blocks of questions were validated by a group of experts, formed by five full professors with extensive teaching experience in this field.

3. Results

This section presents the results regarding the main analysis carried out in the study. The purpose is to demonstrate the possible implications between the use of specific ICT resources during the course and the actual improvement of the students on the learning of electronics. Before producing statistical inferences, it is worth observing the evolution of the final grades obtained by students during each academic year, as listed in Table 4. This table presents the grades subdivided into six ranks of achievement. The percentages for such six ranks are expressed as a portion of 100% percent, which equals the total number of students who took the final exam. The dropout rate is expressed as a portion of the total number of students enrolled in the course, as indicated in the second row of the table. It may be noticed that a positive tendency is appreciated over the last third last years (2015/16 to 2017/18). A lower percentage of students who fail to pass the course may be appreciated over these years. Additionally, there is a percentage reduction of the students who drop out of the course and do not take the final exam (up to 11.67% in the last year).
There is also a positive redistribution of grades which is clear in the last year, with a larger number of students obtaining higher grades (within the first rank, 90–100 [A, A+]). Another straightforward deduction may be extracted from inspecting Table 2. It may be assumed that the ICT resources included during the last three years, such as PBL sessions, activity assignments through the LMS platform, and the use of CSA, have had a positive impact on such positive tendency. Nevertheless, these interpretations have to be complemented by formal and consistent analysis. Next subsection presents comparative results sustained by statistical analysis.

3.1. Statistical Analysis

As commented in the previous subsection, some positive results may be extracted from inspecting the grades obtained by students. However, it is necessary to go beyond in a formal statistical analysis to obtain reliable implications between variables. The large number of enrolled students, as depicted in Table 4, permits producing consistent statistical results. Please note that the experimental setup did not consider control groups. This can be part of future work to be established during the next academic courses.
In this context, Table 5 presents several statistical parameters in order to determine possible dependencies between the grades obtained and the total number of ICT resources used during each academic year. The variable n represents the number of resources, from n = 0 in year 2013/14, to n = 4 in years 2016/17 and 2017/18 (see Table 2). Please note that the grades are still subdivided into ranks of achievement, being processed quantitatively as the marks obtained by students, up to the fifth decimal.
To this purpose, Pearson’s and Spearman correlations have been computed, denoted as r p and r s , respectively [42]. It can be noticed that only the first rank of grades (80–100), shows a slight correlation, r p = 0.1784, with the number of ICT resources used during the course. Moreover, the t s t u d e n t test [42] is carried out in order to check whether there is a significant variation between samples. Specifically, the critical level for the test is t t e s t ( α 2 ; n 1 ) = 3.1824, with a confidence value of α = 0.05. n = 4 represents the maximum number of ICT resources included in the course for each academic year. The null hypothesis, H 0 , assumes that there is not a significant variation between the mean and the variance of the samples. Therefore, a linear dependence between grades within such ranks and the number of ICT resources would be confirmed. H 0 is validated by means of the t s t u d e n t test, whose values do not surpass the critical values of the test. That is, t s t u d e n t < t t e s t (0.2560 < 3.1824, 0.1158 < 3.1824, etc). In addition, the associated p-values for such computed t s t u d e n t are greater than the confidence value α (0.1842 > 0.05, 0.1540 > 0.05, etc). As a result, this permits validating the null hypothesis H 0 .
The previous test, presented in Table 5, can be considered as an initial evidence of dependency between the grades and the number of ICT resources used in the course. However, such dependencies are still slight. In consequence, we have produced a more consistent and general test, the χ 2 test ( c h i -squared), for categorical variables [42]. In this case, the grades have been qualitatively computed over a contingency table. We registered the number of ICT resources used by each student within the same ranks of grades expressed in Table 5. Now Table 6 shows the computed χ 2 values, as well as a set of parameters to measure the level of association. Here, the null hypothesis, H 0 , refers to the independence of variables, which are again the grades obtained within each rank, and the number of ICT resources used during the course. Such hypothesis is rejected, since the computed χ 2 values are greater than the critical, χ 2 > χ t e s t 2 , and the corresponding p-value is lower than the confidence value (13.0236 > 7.8147 and 0.0021 <0.05, respectively). This test confirms again the dependency between variables. The rest of the parameters show low levels of association. Either χ 2 / n , (also known as ϕ ), the general and corrected contingency coefficients, C and C * , and the Cramer’s coefficient, V. Ranges for these parameters are indicated inside brackets.
At this point, the statistical tests presented in Table 5 and Table 6 have only proved low level of association and dependency between the grades obtained by the students and the number of ICT resources used during the course. This made us devise more specific tests, in order to check whether certain resources are more relevant than others. In this sense, Table 7 presents similar results than Table 5. Here, we have quantitatively analysed the grades obtained by the students who have used certain resources (activity assignment through the LMS, PBL sessions, and CSA assignments). The attendance has been also considered for this test. It is worth noticing that the grades are now globally computed [0–100], without any particular classification within ranks.
The Pearson’s and Spearman’s correlations, r p and r s , demonstrate intermediate correlations (⪆0.3) between the grades, and the rest of variables considered. In particular, the use of CSA, with r p = 0.7606, provides the highest and more significant level of correlation. This is a more consistent result which allows us to identify CSA as a relevant resource for the achievement of students, with a considerable linear dependency on the grades. Moreover, the rest of the analysis is completed by another t s t u d e n t test. In this case, the null hypothesis, H 0 , implies the independency between variables. The only variable which rejects H 0 is the use of CSA, since t s t u d e n t > t t e s t and its p-value < α (9.2072 > 2.0518 and 9.1 × 10 10 < 0.05, respectively). Therefore, it is proved that, rather than using other resources or attending the sessions of the course, the use of CSA resources provides a significant and linear dependency on the grades of the students. Hence we can preliminary envisage that not all the ICT resources are equally relevant for the achievement of the students.
In addition, we have also produced another qualitative test, in order to evaluate the relationships between the use of the same resources presented in Table 7 and the qualitative grades: pass or fail. According to this, we have generated a contingency table with categoric grades, as a qualitative and dichotomic variable [0 = fail, 1 = pass]. The results of the χ 2 test may be observed in Table 8. These data correspond with the last academic year, 2017/18, since it is the only year in which CSA has been used. In this manner, we intended to avoid possible biases resulting from the variables of other years. We assume H 0 as the null hypothesis for the independency of variables. It can be confirmed that such hypothesis is rejected by the variable associated to the use of CSA resources, since χ 2 > χ t e s t 2 , and its p-value < α (23.7367 > 3.8415 and 5.7391 × 10 7 < 0.05, respectively). Again, the use of CSA demonstrates to be more relevant for the students to pass the course, with the highest value of χ 2 , but also with the highest values for the rest of the association parameters ( χ 2 / n , C, C * , and V). They all show certain level of association between the use of CSA and the pass grade in the course.
Finally, Table 9 depicts a set of statistics regarding the representative grades per academic year. These are computed with the grades obtained by those students who passed the course (>50). First, Table 9 presents the mean grade, its standard deviation (std), the standard error of the mean (sem), and the median grade. These values confirm the same deduction initially extracted from Table 4, in which certain positive tendency on the grades may be observed during the last academic years. Here, the mean grade for the academic year 2017/18 proves to be the highest amongst the five academic years considered in the study. This might be interpreted as another positive outcome of the use of CSA, since this resource has only been used during the academic year 2017/18.
Additionally, the kurtosis coefficient [43], g 2 , and the Pearson’s skewness coefficient [44], S p , have also been listed in the table. In general terms, the grades distributions for each academic year are quite similar. They may be assumed as leptokurtic ( g 2 > 0), hence presenting tails which asymptotically decrease around the mean. The Pearson’s skewness coefficient shows positive values for all the distributions. This implies that there exists a positive accumulation over the mean in the grades distribution. Such fact can be also positively interpreted, since higher marks can be expected over the mean value.
Despite the fact that the results confirm certain correlation between the use of ICT resources and the grades of the students, it has been also proved that not all these technology-based resources are equally significant for the achievement of the students. In particular, the use of CSA is the resource which does provide a real enhancement of their skills, beyond their grades. This has to do with the type of activities designed with CSA, in accordance with the general learning program presented in Section 2, rather than with the grades, exclusively.
3.2. Survey Results

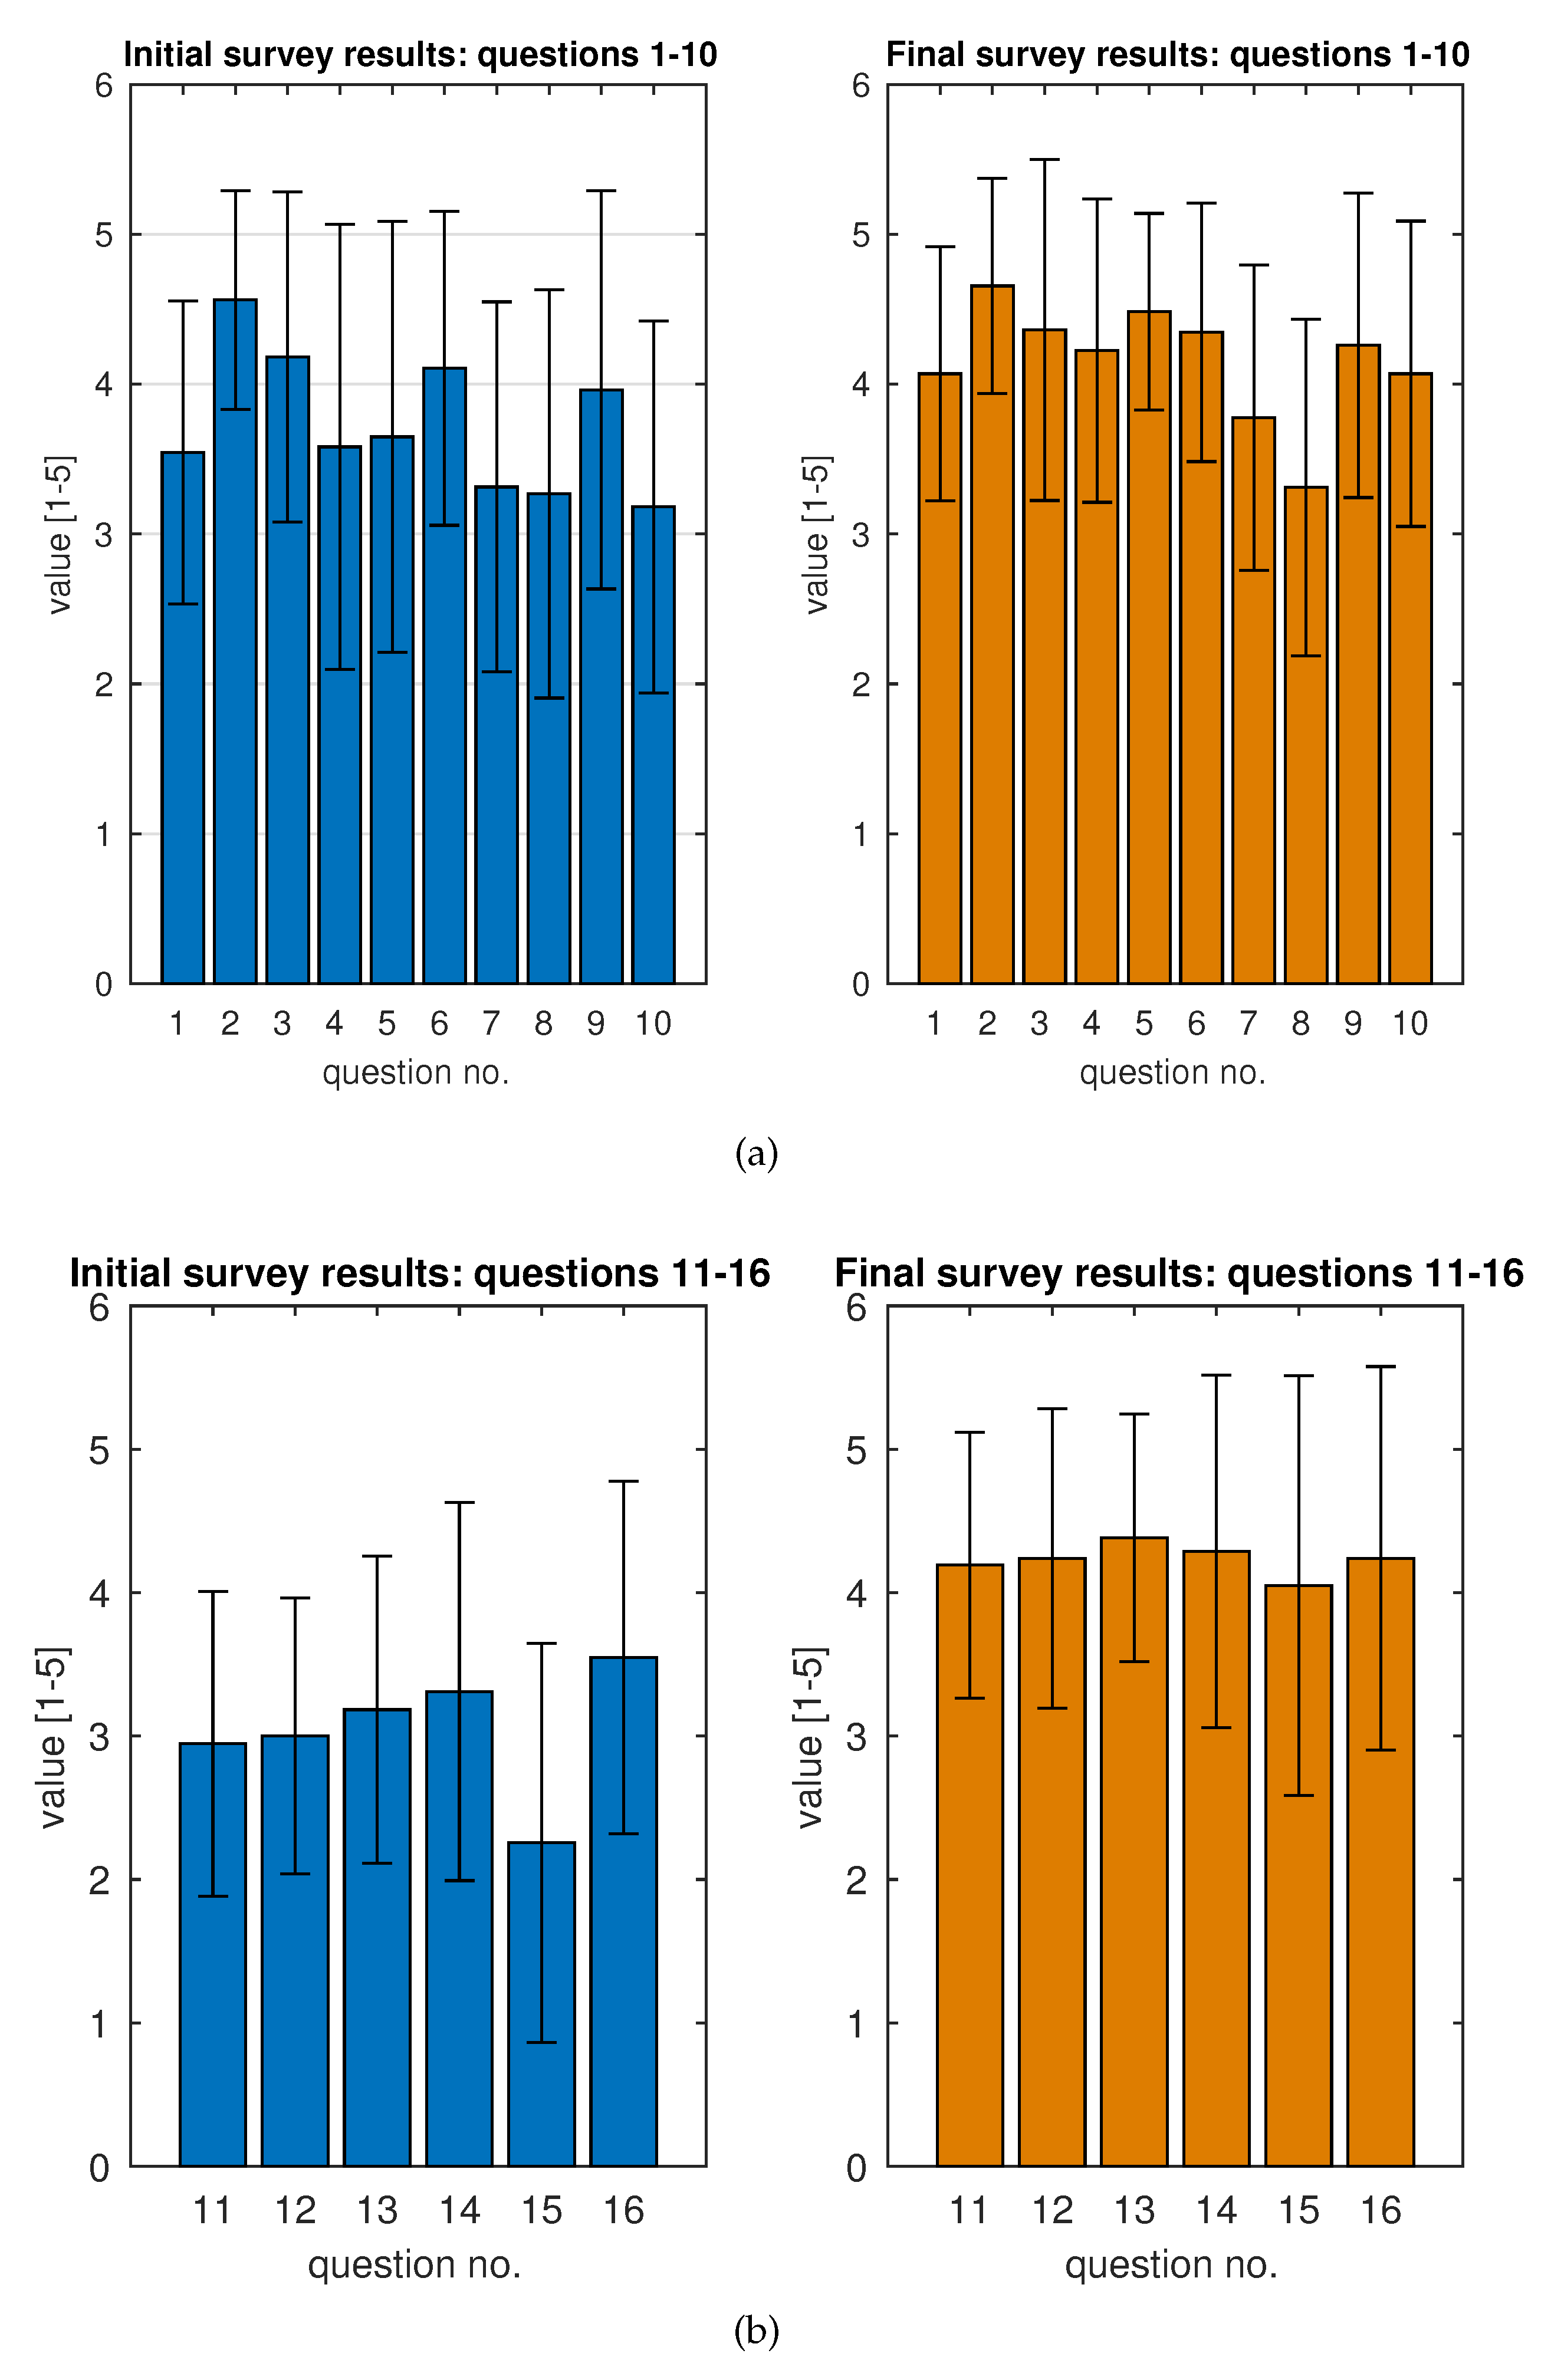
Figure 3 presents the results extracted from the survey, expressed with mean values and their standard deviation. According to Table 3, the questions of the survey have been divided into two sets for representation. Questions 1–10, in Figure 3a, correspond to theory content of the course. Questions 11–16, in Figure 3b, are intended to assess the use of ICT resources. The left axes (in blue) show the results obtained after completing the survey during the first week of the course; the right axes (in orange) show the results obtained after completing the survey during the last week of the course. It can be observed that the mean values reflect a considerable increase in almost all the set of questions. This generally proves the positive perception amongst students. They perceived higher and improved understanding of concepts, competences acquisition, satisfaction and attitude to the use of ICT resources, such as CSA, once the course has finished.

4. Discussion

The previous section has presented an in-depth statistical analysis from which several deductions can be inferred. Firstly, Table 4 revealed a positive tendency on the grades over the recent academic years. It is also worth mentioning the considerable decrease of the dropout rate, over the last three years. This can be assumed as a positive outcome associated to the introduction of specific ICT resources during the recent academic years, as denoted in Table 3.
Secondly, it was necessary to determine whether the use of certain resources was relevant enough for the achievement of the students. In this sense, Table 5 presented correlation results between the grades obtained by the students, and the number of ICT resources used during the course. These results only showed a low correlation for the highest rank of grades. Moreover, a t s t u d e n t test confirmed the linear dependency between the grades and the number of ICT resources used in the course. Similarly, Table 6 depicted results from a categorical analysis, counting students within ranks of grades and the number of ICT resources used during the academic year. Here, the χ 2 test also confirmed the dependency between such variables.
After this dependency was proved, the next step in the analysis seeked to identify whether certain resources were more relevant than others, and if so, which one specifically. Table 7 comprised correlation results between the quantitative grades ([0–100]), and the use of different resources such as: units assignments through the LMS platform; PBL sessions; CSA, and the attendance to the sessions. The highest correlation is observed for CSA, with a more significant value (>0.7) than the others. Furthermore, the use of CSA is the only variable which presents dependency with the obtained grades, according to the t s t u d e n t test. Besides this, Table 8 also supports the same deduction. In this case, the grades were processed categorically, being considered as pass or fail grades. Again, according to the χ 2 test, the use CSA is the only resource which confirms a significant dependency on obtaining the pass grade in the course. These results proved that CSA is the only significant resource for the achievement of the students, in terms of grades.
Next, a final descriptive outline has been represented in Table 9. Like in Table 4, the mean grades demonstrate certain increase over the recent academic years.
Finally, Figure 3 has confirmed the positive outcomes perceived by the students, once the course has finished. The designed survey was completed during the first and the last week of the course, respectively. The comparison results clearly proved the increased perception amongst the students, regarding the understanding of concepts, competences’ acquisition, satisfaction and attitude to the use of CSA resources, once the course has finished.

5. Conclusions

This work has presented a study focused on a learning program designed to promote an active understanding of electronics. It has been extensively reported in the literature that, despite the fact that learning programs are being periodically renewed with more practical contents, programs still fail to provide students with valid outcomes and skills for their near future as engineers. In this sense, this program has intended to promote consistent competences and capabilities associated to an active and significative learning, according to the milestones recently established by the Horizon challenges in Education.
In particular, the course corresponds with an electronics subject, taught in the second year of a Bacherlor’s degree in engineering, within the Spanish official university system. The inclusion of different ICT resources has been devised to enrich the students resources background and to promote their autonomy. In this manner, they are allowed to build their own learning with the support of beneficial resources, with the supervision of the instructors. Different resources have been introduced, such as LMS (Learning Management System) support, online PBL (Problem-Based Learning) activities, and CSA (Circuit Simulation Applets).
Under this framework, a particular study was arranged to assess the efficacy of the different ICT resources, over five consecutive academic years. The statistical analysis of the grades suggests that the use of all the available resources does no necessarily imply that students obtain an improved achievement. Thus we have tested whether some resources are more relevant than others for the final outcomes of the students. The results demonstrate that the use of CSA is the only resource which confirms a significant dependency on the achievement of the students. This is closely related to the type of activities designed, which tried to match real electronic applications and general difficulties that students usually encounter. In consequence, the activities help students construct their own knowledge, by guiding them towards an active learning, supported by the general learning program. The engagement was measured with observation registers. Additionally, we have also designed a survey to measure the students perception regarding their improvement in terms of: understanding of concepts, acquired competences, satisfaction, engagement and attitude to the use of CSA resources during the program. The survey results confirmed the wide acceptance and positivity towards the program amongst the students.

Author Contributions

Conceptualization, D.V. and S.F.d.Á.; methodology, D.V., L.P.; software, D.V. and J.C.F.; validation, S.F.d.Á., L.P. and J.C.F.; formal analysis, L.P. and S.F.d.Á.; investigation, D.V., S.F.d.Á.; resources, L.P., S.F.d.Á. and J.C.F.; data curation, L.P., S.F.d.Á. and O.R.; writing—original draft preparation, D.V.; writing—review and editing, D.V., L.P. and S.F.d.Á.; visualization, D.V., L.P. and J.C.F.; supervision, S.F.d.Á. and O.R.; project administration, S.F.d.Á. and O.R.; funding acquisition, S.F.d.Á., J.C.F., L.P. and O.R.

Funding

This research was funded by: the Spanish Government through the project DPI2016-78361-R (AEI/FEDER, UE); the Valencian Research Council through the project AICO/2017/148; the Valencian Research Council and the European Social Fund through the post-doctoral grant APOSTD/2017/028, held by D. Valiente.

Conflicts of Interest

The authors declare no conflict of interest. The funders had no role in the design of the study; in the collection, analyses, or interpretation of data; in the writing of the manuscript, or in the decision to publish the results.

Abbreviations

The following abbreviations are used in this manuscript:
MDPIMultidisciplinary Digital Publishing Institute
ICTInformation Communication and Technology
PBLProject-Based Learning
LMSLearning Management System
CSACircuit Simulation Applet
NMCNew Media Consortium
ELIEducause Learning Initiative

References

  1. Leniz, A.; Zuza, K.; Guisasola, J. Difficulties Understanding the Explicative Model of Simple DC Circuits in Introductory Physics Courses. In Proceedings of the Physics Education Research Conference 2014, Minneapolis, MN, USA, 30–31 July 2014; pp. 151–154. [Google Scholar]
  2. Engelhardt, P.V.; Beichner, R.J. Students’ understanding of direct current resistive electrical circuits. Am. J. Phys. 2004, 72, 98–115. [Google Scholar] [CrossRef]
  3. Leniz, A.; Zuza, K.; Guisasola, J. University Students Use of Explanatory Models for Explaining Electric Current in Transitory Situations. Univ. J. Phys. Appl. 2015, 9, 258–262. [Google Scholar] [CrossRef]
  4. Trotskovsky, E.; Sabag, N. Engineering Students’ Solutions to Accuracy Problems in Analog Electronics Course. In Teaching and Learning in a Digital World; Springer International Publishing: Berlin, Germany, 2018; pp. 218–223. [Google Scholar]
  5. Sangam, D.; Jesiek, B.K. Conceptual Understanding of Resistive Electric Circuits Among First-year Engineering Students. In Proceedings of the 2012 ASEE Annual Conference & Exposition, San Antonio, TX, USA, 10–13 June 2012; pp. 25.339.1–25.339.11. [Google Scholar]
  6. Stetzer, M.R.; van Kampen, P.; Shaffer, P.S.; McDermott, L.C. New insights into student understanding of complete circuits and the conservation of current. Am. J. Phys. 2013, 81, 134–143. [Google Scholar] [CrossRef]
  7. Husain, H.; Misran, N.; Arshad, N.; Zaki, W.M.D.W.; Sahuri, S.N.S. Analysis on Electrical and Electronics Engineering Students? Academic Achievement. Procedia Soc. Behav. Sci. 2012, 60, 112–118. [Google Scholar] [CrossRef]
  8. Trotskovsky, E.; Sabag, N.; Waks, S. Students’ Achievements and Misunderstandings When Solving Problems Using Electronics Models. A Case Study. IEEE Trans. Educ. 2015, 58, 104–109. [Google Scholar] [CrossRef]
  9. Leniz, A.; Zuza, K.; Guisasola, J. Students? reasoning when tackling electric field and potential in explanation of dc resistive circuits. Phys. Rev. Phys. Educ. Res. 2017, 12, 010128. [Google Scholar] [CrossRef]
  10. Pitterson, N.; Streveler, R.; Brown, C. Exploring undergraduate engineering students’ conceptual learning of complex circuit concepts in an introductory course. In Proceedings of the 2016 IEEE Frontiers in Education Conference (FIE), Erie, PA, USA, 12–15 October 2016; pp. 1–8. [Google Scholar]
  11. Martínez, J.; Rosa, S.; Liminana, R.; Menargues, A.; Nicolás, C.; Savall, F. El circuito eléctrico simple. Un modelo micro. Alambique DidÁctica Cienc. Exp. 2018, 92, 30–37. [Google Scholar]
  12. Solbes, J.; Fernández, J.; Domínguez, M.; Cantó, J.; Guisasola, J. Influence of teacher training and science education research in the teaching practice of science in-service teachers. Ensen. Cienc. 2018, 36, 25–44. [Google Scholar] [CrossRef]
  13. Moodley, K.; Gaigher, E. Teaching Electric Circuits: Teachers’ Perceptions and Learners’ Misconceptions. Res. Sci. Educ. 2017, 49, 73–89. [Google Scholar] [CrossRef]
  14. Gaigher, E. Questions about Answers: Probing Teachers’ Awareness and Planned Remediation of Learners’ Misconceptions about Electric Circuits. Afr. J. Res. Math. Sci. Technol. Educ. 2014, 18, 176–187. [Google Scholar] [CrossRef]
  15. Kekana, M.; Gaigher, E. Understanding Science Teachers’ Classroom Practice after Completing a Professional-development Programme: A Case Study. Eurasia J. Math. Sci. Technol. Educ. 2018, 14, 1–15. [Google Scholar] [CrossRef]
  16. Twissell, A. Modelling and Simulating Electronics Knowledge: Conceptual Understanding and Learning through Active Agency. J. Educ. Technol. Soc. 2018, 21, 111–123. [Google Scholar]
  17. Raud, Z. Active learning Power Electronics: A new assessment methodology. In Proceedings of the 14th International Power Electronics and Motion Control Conference EPE—PEMC 2010, Ohrid, North Macedonia, 6–8 September 2010; pp. 14.1–14.5. [Google Scholar]
  18. Menendez, L.M.; Salaverria, A.; Mandado, E.; Dacosta, J.G. Virtual Electronics Laboratory: A new tool to improve Industrial Electronics Learning. In Proceedings of the IECON 2006—32nd Annual Conference on IEEE Industrial Electronics, Paris, France, 6–10 November 2006; pp. 5445–5448. [Google Scholar]
  19. Ruano, I.R.; García, J.G.; Ortega, J.G. Laboratorio Web SCORM de Control PID con Integración Avanzada. Rev. Iberoam. AutomÁtica Inf. Ática Ind. RIAI 2016, 13, 472–483. [Google Scholar] [CrossRef] [Green Version]
  20. Yalcin, N.A.; Vatansever, F. A Web-based Virtual Power Electronics Laboratory. Comput. Appl. Eng. Educ. 2016, 24, 71–78. [Google Scholar] [CrossRef]
  21. Novianta, M.A. An online lab for digital electronics course using information technology supports. In Proceedings of the 2015 International Conference on Science in Information Technology (ICSITech), Yogyakarta, Indonesia, 27–28 October 2015; pp. 299–302. [Google Scholar]
  22. Cvjetkovic, V.M.; Kovacevic, M.S. Web-based experiment for teaching the electrical characteristics of a solar cell and module. Comput. Appl. Eng. Educ. 2018, 26, 2157–2167. [Google Scholar] [CrossRef]
  23. Musing, A.; Drofenik, U.; Kolar, J.W. New circuit simulation applets for online education in power electronics. In Proceedings of the 2011 5th IEEE International Conference on E-Learning in Industrial Electronics (ICELIE), Melbourne, Australia, 7–10 November 2011; pp. 70–75. [Google Scholar]
  24. Rakhmawati, L.; Firdha, A. The use of mobile learning application to the fundament of digital electronics course. IOP Conf. Ser. Mater. Sci. Eng. 2018, 296, 012015. [Google Scholar] [CrossRef] [Green Version]
  25. Becerra, D. Estrategia de aprendizaje basado en problemas para aprender circuitos eléctricos. Innov. Educ. 2014, 14, 73–99. [Google Scholar]
  26. Ramírez-Echeverry, J.J.; Olarte, A.; García-Carrillo, A. Work in progress—Role of learning strategies in Electrical Circuits and Analog Electronics courses. In Proceedings of the 2014 IEEE Global Engineering Education Conference (EDUCON), Istanbul, Turkey, 3–5 April 2014; pp. 1051–1054. [Google Scholar]
  27. Zapirain, B.G.; Zorrilla, A.M.; Ruiz, I.; Muro, A. Learning electronics using image processing techniques for describing circuits to blind students. In Proceedings of the 10th IEEE International Symposium on Signal Processing and Information Technology, Luxor, Egypt, 15–18 December 2010; pp. 156–160. [Google Scholar]
  28. Amiel, F.; Abboud, D.; Trocan, M. A project oriented learning experience for teaching electronics fundamentals. IEEE Commun. Mag. 2014, 52, 98–100. [Google Scholar] [CrossRef]
  29. Zhang, Z.; Hansen, C.T.; Andersen, M.A.E. Teaching Power Electronics with a Design-Oriented, Project-Based Learning Method at the Technical University of Denmark. IEEE Trans. Educ. 2016, 59, 32–38. [Google Scholar] [CrossRef]
  30. Costa Castelló, R.; Puig Cayuela, V.; Blesa Izquierdo, J. Introducción a la Diagnosis de Fallos basada en Modelos mediante Aprendizaje basado en Proyectos. Rev. Iberoam. AutomÁtica Inf. Ática Ind. RIAI 2016, 13, 186–195. [Google Scholar] [CrossRef] [Green Version]
  31. Valiente, D.; Payá, L.; Jiménez, L.M.; Sebastián, J.M.; Reinoso, O. Visual Information Fusion through Bayesian Inference for Adaptive Probability-Oriented Feature Matching. Sensors 2018, 18, 2041. [Google Scholar] [CrossRef] [PubMed]
  32. Payá, L.; Peidró, A.; Amorós, F.; Valiente, D.; Reinoso, O. Modeling Environments Hierarchically with Omnidirectional Imaging and Global-Appearance Descriptors. Remote Sens. 2018, 10, 522. [Google Scholar] [CrossRef]
  33. Fonseca, N.M.; Freitas, E.D.C. Computer applications for education on industrial robotic systems. Comput. Appl. Eng. Educ. 2018, 26, 1186–1194. [Google Scholar] [CrossRef]
  34. Campbell, J.O.; Bourne, J.R.; Mosterman, P.J.; Brodersen, A.J. The Effectiveness of Learning Simulations for Electronic Laboratories. J. Eng. Educ. 2002, 91, 81–87. [Google Scholar] [CrossRef]
  35. Dickerson, S.J.; Clark, R.M. A classroom-based simulation-centric approach to microelectronics education. Comput. Appl. Eng. Educ. 2018, 26, 768–781. [Google Scholar] [CrossRef]
  36. Valiente, D.; Berenguer, Y.; Payá, L.; Peidró, A.; Reinoso, O. Development of a platform to simulate virtual environments for robot localization. In Proceedings of the INTED 2018, the 12th annual International Technology, Education and Development Conference, Valencia, Spain, 5–7 March 2018; pp. 1232–1241. [Google Scholar]
  37. Falstad, P. Falstad Simulation Applets. Available online: https://www.falstad.com/circuit/ (accessed on 20 January 2019).
  38. Nikolić, V.; Petković, D.; Denić, N.; Milovančević, M.; Gavrilović, S. Appraisal and review of e-learning and ICT systems in teaching process. Phys. A Stat. Mech. Its Appl. 2019, 513, 456–464. [Google Scholar] [CrossRef]
  39. Arrosagaray, M.; González-Peiteado, M.; Pino-Juste, M.; Rodríguez-López, B. A comparative study of Spanish adult students? attitudes to ICT in classroom, blended and distance language learning modes. Comput. Educ. 2019, 134, 31–40. [Google Scholar] [CrossRef]
  40. Zylka, J.; Christoph, G.; Kroehne, U.; Hartig, J.; Goldhammer, F. Moving beyond cognitive elements of ICT literacy: First evidence on the structure of ICT engagement. Comput. Hum. Behav. 2015, 53, 149–160. [Google Scholar] [CrossRef]
  41. New Media Consortium. New Media Consortium Horizon Report. Available online: http://www.nmc.org/publication-type/horizon-report/ (accessed on 20 January 2019).
  42. Lehmann, E.L. Testing Statistical Hypotheses: The Story of a Book. Stat. Sci. 1997, 12, 48–52. [Google Scholar] [CrossRef]
  43. Westfall, P.H. Kurtosis as Peakedness, 1905–2014. R.I.P. Am. Stat. 2014, 68, 191–195. [Google Scholar] [CrossRef] [PubMed]
  44. Von Hippel, P.T. Mean, Median, and Skew: Correcting a Textbook Rule. J. Stat. Educ. 2005, 13. [Google Scholar] [CrossRef] [Green Version]
Figure 1. Synthetic diagram for the learning program.
Electronics 08 00264 g001
Figure 2. Java interface of the CSA (Circuit Simulation Applet). Example of activity considered in the revision dossier to be handed in.
Electronics 08 00264 g002
Figure 3. Left axes Electronics 08 00264 i001: survey results acquired during the 1st week of the course. Right axes Electronics 08 00264 i002: survey results acquired during the 15th week of the course. Questions 1–10 (a). Questions 11–16 (b). Results are expressed with mean values and standard deviation.
Electronics 08 00264 g003
Table 1. Course structure: schedule with theory and practical lessons, contents, assignments and use of resources.
Theory Lessons
WeekUnitContentDescriptionAssignments (LMS)
11SemiconductorsBasic electronics; semiconductor operation and circuital models.Initial survey.
22DiodesPhysical operation and circuital models. Exer. a,b-
32 Rectifier circuits. Exer. c-
42 Filter and modulation circuits. Exer. c-
52 Clipping and clamping circuits. Exer. c,d-
6 *2 Voltage regulator circuits. Exer. c,dUnit 2.
73Operational Amplifiers (AO)AO operation and examples.-
83 AO circuital parameters. Exer. a,b-
9 *3 Application circuits. Exer. c,dUnit 3.
104TransistorsBJT operation, parameters and examples.-
114 BJT AC-configurations. Exer. a,b-
124 BJT amplifiers. Exer. c-
134 Field-effect transistors’ operation. Exer. a,b-
14 *4 MOSFET and JFET amplifiers. Exer. cUnit 4.
15 *4 Application circuits. Exer. c,dCSA activities. Final survey.
Laboratory Hands-on Lessons
81 Review seminar on Circuit Simulation Java applet.-
91 Practical seminar on Circuit Simulation Java applet.-
102 Application circuits with diodes. Rectifier circuits.-
112 Application circuits with diodes. Clippling and clamping circuits.-
123 Application circuits with AOs. Amplifiers circuits.-
133 Application circuits with AOs. Logical circuits.-
144 DC application circuits with transistors. DC sources.-
154 AC application circuits with transistors. AC-amplifier circuits.-
* Problem-Based Learning sessions (PBL). a Conceptual: short answer. b Conceptual: multiple choice answer. c Practical: solving circuits. d Practical: designing circuits.
Table 2. Inclusion (✓) of ICT resources per academic year.
Year2013/142014/152015/162016/172017/18
ICT Resource
LMS: theory lessons
LMS: solved class exercises
PBL sessions
LMS: unit activity assignments
CSA: lesson support and assignment
Table 3. Description of the content in the survey.
Initial/Final Survey
QuestionsAssessed ConceptsIndicators of Achievement
1–5Basic electronics.Have students acquired knowledge about the essentials of electronics?
6–10Circuits resolution.Are students able to apply the fundamental laws of circuit resolution?
11–12ICT resources availability.Do students have enough ICT resources to support their learning on electronics?
13–14Use of ICT resources.Do students often use ICT resources to support their learning on electronics?
15–17Attitude to CSA resources.Do students value positively the CSA activities conducted, as a relevant resource for supporting their learning?
Table 4. Students Grades.
Grades Students2013/142014/152015/162016/172017/18
206286289313258
90–100 (A, A+)2.02%0.56%1.13%1.26%4.31%
80–89 (B+, A−)6.06%4.44%5.08%6.29%11.21%
70–79 (B−, B)5.05%6.67%10.17%8.81%10.34%
60–69 (C−, C, C+)11.11%7.22%10.73%13.84%12.93%
50–59 (D)17.17%18.89%20.90%20.13%13.79%
<50 (E, F)58.59%62.22%51.98%49.69%47.41%
Dropout37.59%39.93%29.74%21.12%11.67%
Table 5. Correlation and t s t u d e n t test between the grades obtained by students, and the number of ICT resources used during each course.
Grades r p r s p -Value t student t test ( α 2 ; n 1 )
80–1000.17840.14510.18420.25603.1824
60–79−0.1207−0.10720.15400.11583.1824
50–590.02210.03410.8006−0.25323.1824
<500.22420.17765.8 × 10 6 −0.13143.1824
Table 6. Association parameters and χ 2 test between the grades obtained by students and the number of ICT resources used during the course. The test has been computed qualitatively, with grades considered as categorical variables.
Variables χ 2 χ test ( α , n ) 2 p -Value χ 2 / n [−1–1] C [0–0.8165] C * [0–1] V [0–1]
No. of ICT resources13.02367.81470.00210.03920.19720.24150.1422
Table 7. Correlation and t s t u d e n t test between the grades obtained by students and the use of units assignments; PBL sessions; CSA; sessions’ attendance.
Variables r p r s p -Value t student t test ( α 2 ; n 1 )
Units assignment0.30990.28390.0716−1.8671.9935
PBL0.39250.25170.38850.19952.0195
CSA0.76060.77789.1 × 10 10 9.20722.0518
Attendance0.25050.22350.093−2.77261.9806
Table 8. Association parameters and χ 2 test between the grades obtained by students (pass or fail) and the use of CSA; units assignments; and PBL sessions.
Variables [0, 1] χ 2 χ test ( α , n ) 2 p -Value χ 2 / n C [0– 2 ] C * [0–1]V [0–1]
CSA23.73673.84155.7391 × 10 7 0.18540.39550.27960.43
Units assignments2.10703.84150.09580.00820.09070.06410.091
PBL sessions1.26973.84150.18760.00790.0890.06290.0894
Table 9. Representative grades for each academic year.
YearMeanStdSemMedian g 2 (Kurtosis) S p (Skewness)
2013/146.6771.3100.2056.8001.9580.382
2014/156.3001.2550.2126.1003.2690.891
2015/166.4801.1980.1306.2402.2440.517
2016/176.6651.1960.1366.2802.2620.543
2017/187.5251.3460.1726.8002.0640.230