1. Introduction
Currently, the demand for solid-state drives (SSDs) based on NAND Flash technology is growing in the consumer market, enterprise market, embedded product market, and so forth, and SSDs have been widely used in various computer systems. From a technical point of view, all major flash memory manufacturers focus on 3D stacking technology and 64-layer or 96-layer solutions. Compared to 2D planar technology, 3D nanotechnology is a step backward but it has reached the 20 nm–30 nm level or even higher. Because of the continuous improvements in manufacturing technology, the cost performance of SSDs has been rapidly improved in the past 10 years, and a large number of data centers have begun to deploy SSDs to further optimize their storage services.
SSDs show multidimensional advantages compared to the hard drive disks that used to be dominant in the storage industry. From the perspective of performance and power consumption, SSDs can provide not only a faster read/write speed but also better random I/O access performance, and SSDs are smaller with lower power consumption. From the perspective of reliability, the lack of moving parts inside SSDs can eliminate reliability problems, such as head collision, dielectric scratch or spindle electromechanical failure and these features can protect the SSD against physical impact. On the other hand, NAND Flash-based SSDs have only a limited number of program/erase(P/E) cycles, which means the aging problem of SSDs is unavoidable. The reliability indexes provided by the manufacturer are only a very general guarantee. Moreover, although the average capacity of SSD increases with the development of the NAND production process, the increasing number of dies also aggravates the interference among flash cells and thus the overall reliability of flash is affected. Even though Hetzler et al. [
1] have questioned the reliability of SSDs, increasingly more enterprises have chosen to store data in SSDs; therefore, it is crucial to understand SSD reliability characteristics.
Recently, there have been several works analyzing the failure behavior of flash devices in production environments under real workloads. Reference [
2] studies the SSD failures in Microsoft’s data center. Reference [
3] focuses on the SSD uncorrectable bit errors in Facebook’s server fleet. Reference [
4] reports on the various software and hardware errors of SSDs from Google. In addition to the studies published by large companies, people also use synthetic workloads and a small number of flash chips to do the research in laboratory environments [
5]. In the past few years, enterprise-class SSDs have mainly been composed of SLC(Single-Level Cell) Flash or eMLC(enterprise Multi-Level Cell) Flash. Now, many manufacturers have released 3D TLC SSDs for the enterprise market. The priority of 3D TLC SSDs in data center storage is becoming higher and higher, but there is a lack of effective preventive measures to further improve SSD reliability in a data center environment. To better understand the reliability characteristics of 3D TLC Flash throughout its lifetime, we first designed an SSD lifetime endurance test method and conducted an accelerated endurance test with a simulated workload from real applications in a laboratory environment (following JEDEC JESD218 [
6] and JESD219 [
7]) for several months, we then studied lifetime SSD reliability characteristics based on 1.5 PB of data.
The purpose of this paper is to summarize the reliability characteristics of 3D TLC Flash that we observed in the test and experiment processes, as well as to provide the relevant basis for improving the storage reliability of SSDs in a data center environment and to study reliability assurance measures, such as SSD failure prediction. By analyzing the data collected from the experiments, we found the following phenomena. Firstly, uncorrectable bit errors do not occur in the early stages of the SSD lifetime, but will suddenly increase to a large number when the SSD is close to its endurance limit, which is impacted by high operating temperatures and the data written to the SSD. Secondly, the controller of the 3D TLC SSD is integrated with a compression algorithm generally, and the write amplification will be less than 1 but there will be a large increase when the SSD is close to its endurance limit. Thirdly, under normal conditions, the SSD working temperature will follow natural temperature fluctuations within a range but a sustained high working temperature state occurs when the SSD is close to the endurance limit. Then, the SSD will change to “write protection” mode so that no more data can be written and will return to a common working temperature. In addition, the Pearson, Spearman, and Kendall correlation coefficients of the SATA downshift count between uncorrectable errors, NAND writes, and so forth, are approximately 0.2 or less; therefore, we believe that the change in these attributes have little to do with the reliability of NAND Flash and they are not suitable to be used as the main metrics to determine whether an SSD will fail.
This paper is organized as follows.
Section 2 reviews the related work.
Section 3 reviews the basic technology.
Section 4 reviews measurement methodology.
Section 5 presents the graphical display and analyses of SMART data.
Section 6 discusses the correlation analyses of SMART attributes.
Section 7 concludes the findings.
2. Related Work
Many studies have focused on the reliability of flash chips which involve many aspects. References [
5,
8,
9,
10,
11,
12,
13] studied the failure trend in flash chips. Other studies analyzed different factors in flash failures, such as read disturb [
14,
15,
16,
17], program disturb [
9,
18], data retention [
10,
19] and power faults [
20,
21]. Additionally, there are studies examining the influence of different factors on the error rate of flash chips [
13]. Meza et al. [
3] explored the SSD failures in Facebook’s server fleet and they used uncorrectable errors as an important metric to identify SSD failures. Schroeder et al. [
22] studied the SSD failures in Google’s data center and have the opposite opinion to that of Meza [
3]; they believe that the generation of uncorrectable errors is not closely related to the program and the erasure of SSDs, so UBER(uncorrectable bit error rate) is not a proper failure metric. Many studies analyzed SSD failures from multiple perspectives but there are also some works that focused on one specific SSD problem and provided the relevant optimization techniques, such as Cai et al. [
8,
9,
10,
11,
14,
18,
19,
23] focusing on the MLC Flash chip error model and proposing some improved technologies to reduce the impact of flash errors and improve flash reliability.
As 3D NAND technology matures gradually, many manufacturers have started to develop SSDs based on 3D NAND Flash [
24,
25,
26,
27]. Some studies have discussed the architecture and working principles of 3D NAND Flash cells [
28,
29,
30,
31,
32,
33,
34]. Parat [
35] introduced the Intel-Micron first generation 3D NAND Flash with a vertical channel surround gate structure which has better cell characteristics than 2D NAND and presented some technical challenges in endurance and reliability that 3D NAND will face. Venkatesan [
36] discussed the fundamentals and electron properties of 3D NAND Flash from the view of fabrication process integration and equipment engineering. References [
11,
37,
38] compared 2D NAND Flash and 3D NAND Flash in terms of physical structure and working principle, and analyzed the advantages and problems brought by 3D technology. Seo [
39] studied the interference between flash cells in terms of the composition of 3D NAND Flash cells.
Although many studies have shown that 3D NAND Flash has advantages such as high storage density and low price, the shortcomings in endurance and data error rate are also obvious. Ma [
40] tested and analyzed the RBER(raw bit error rate) of 3D TLC NAND Flash and also proposed a life prediction scheme of 3D TLC NAND Flash based on RBER and SVM(support vector machine), the experiment results showed that the prediction scheme can significantly extend the lifetime of flash blocks. Q. Xiong et al. [
37] studied the delay and raw bit error rate of 3D NAND based on floating gate and they obtained similar results with 2D NAND. Toru [
41] studied and analyzed the problems that should be paid attention to when developing the next generation of 3D NAND Flash from the perspective of power consumption, performance and reliability. Luo [
42] described the effect of temperature, the program interval and the program accuracy on 3D NAND Flash. According to the characteristics of 3D NAND Flash, recent studies [
16,
17] have proposed remapping read-hot pages to SLC blocks, which effectively alleviated the reliability impact caused by read disturb. The classification of the above studies is organized in
Table 1.
However, these studies lack macro analyses of the variations in SSD reliability indexes throughout the entire lifetime of the SSD. As far as we know, most of the previous related research has focused on MLC, SLC, and other Flash types. This work is the first one that focuses on an endurance test of 3D TLC SSDs throughout their entire lifetime. The work shows and analyzes changes in SSD reliability data. Through the analysis of SSD reliability data, our opinions are similar to those in Reference [
3]. We believe that uncorrectable errors are related to the flash program and UE is a good metric to judge SSD failures. Meanwhile, we also believe that the special change in temperature is also valuable for determining whether the SSD is about to fail.
3. Basic Technology
To better describe the measurement process implemented in this article, we provide a brief overview of several basic techniques in this section.
3.1. PostMark
PostMark [
43] is a single-threaded synthetic benchmark program invented by NetApp in 1997. It is designed to measure the performance of file systems with workloads dominated by small file operations and a short file lifetime. This type of workload is typical for mail services, online news, web business transactions and other application scenarios. Postmark does not perform any program processing and only approximates the activity of the file system.
The PostMark starts by creating a random file pool, where the files are composed of characters, numbers, and so on. The file size is evenly distributed within the specified range. After the file is created, a series of “transactions” (this is a PostMark term referring to something similar to an operation, not a database concept) are executed. The number of files, subdirectories, file size range, and number of transactions are all set by the user. Each PostMark transaction has two parts—file creation/deletion and file reading/appending. The incidence of each transaction type and the files affected by it are randomly selected to minimize the impact of file system caching, read-ahead files, disk-level caching and trace caching. Additionally, PostMark is able to adjust that correlation by setting read parameters or creating deviation parameters to produce the desired results. The file creation operation creates random text content and writes it to the file. The file deletion operation randomly selects files from the active set for deletion. The file read operation randomly selects the file and reads the entire file (using the set block size). The file write operation randomly selects a file and appends a random length to it. The user can also choose whether or not to use buffered I/O.
3.2. SMART Technology
SMART (Self-Monitoring, Analysis and Reporting Technology) is a kind of disk self-analysis and detection Technology [
44]. It monitors the disk hardware (head, platters, motor et al.) status by the test commands in disk firmware and compares it with the threshold value set by the manufacturers. If a monitored value has exceeded the threshold, a warning will be sent to the users by the hardware/software monitors in the host and an automatic repair will be slightly done to ensure the reliability of data. Except for some old hard drive disks, most hard drive disks have this technology. SMART is also found in most SSDs and it can access some SSD parameters, such as model number, capacity, working temperature, data volume, error count, and so on.
4. Measurement Methodology
This measurement-driven study aims to better understand the reliability characteristics of 3D TLC Flash. To make the measurement process as realistic as possible, the measurement needs a workload that matches the real scenario. The rest of this section details our measurement methodology.
4.1. Overview of an SSD Sample
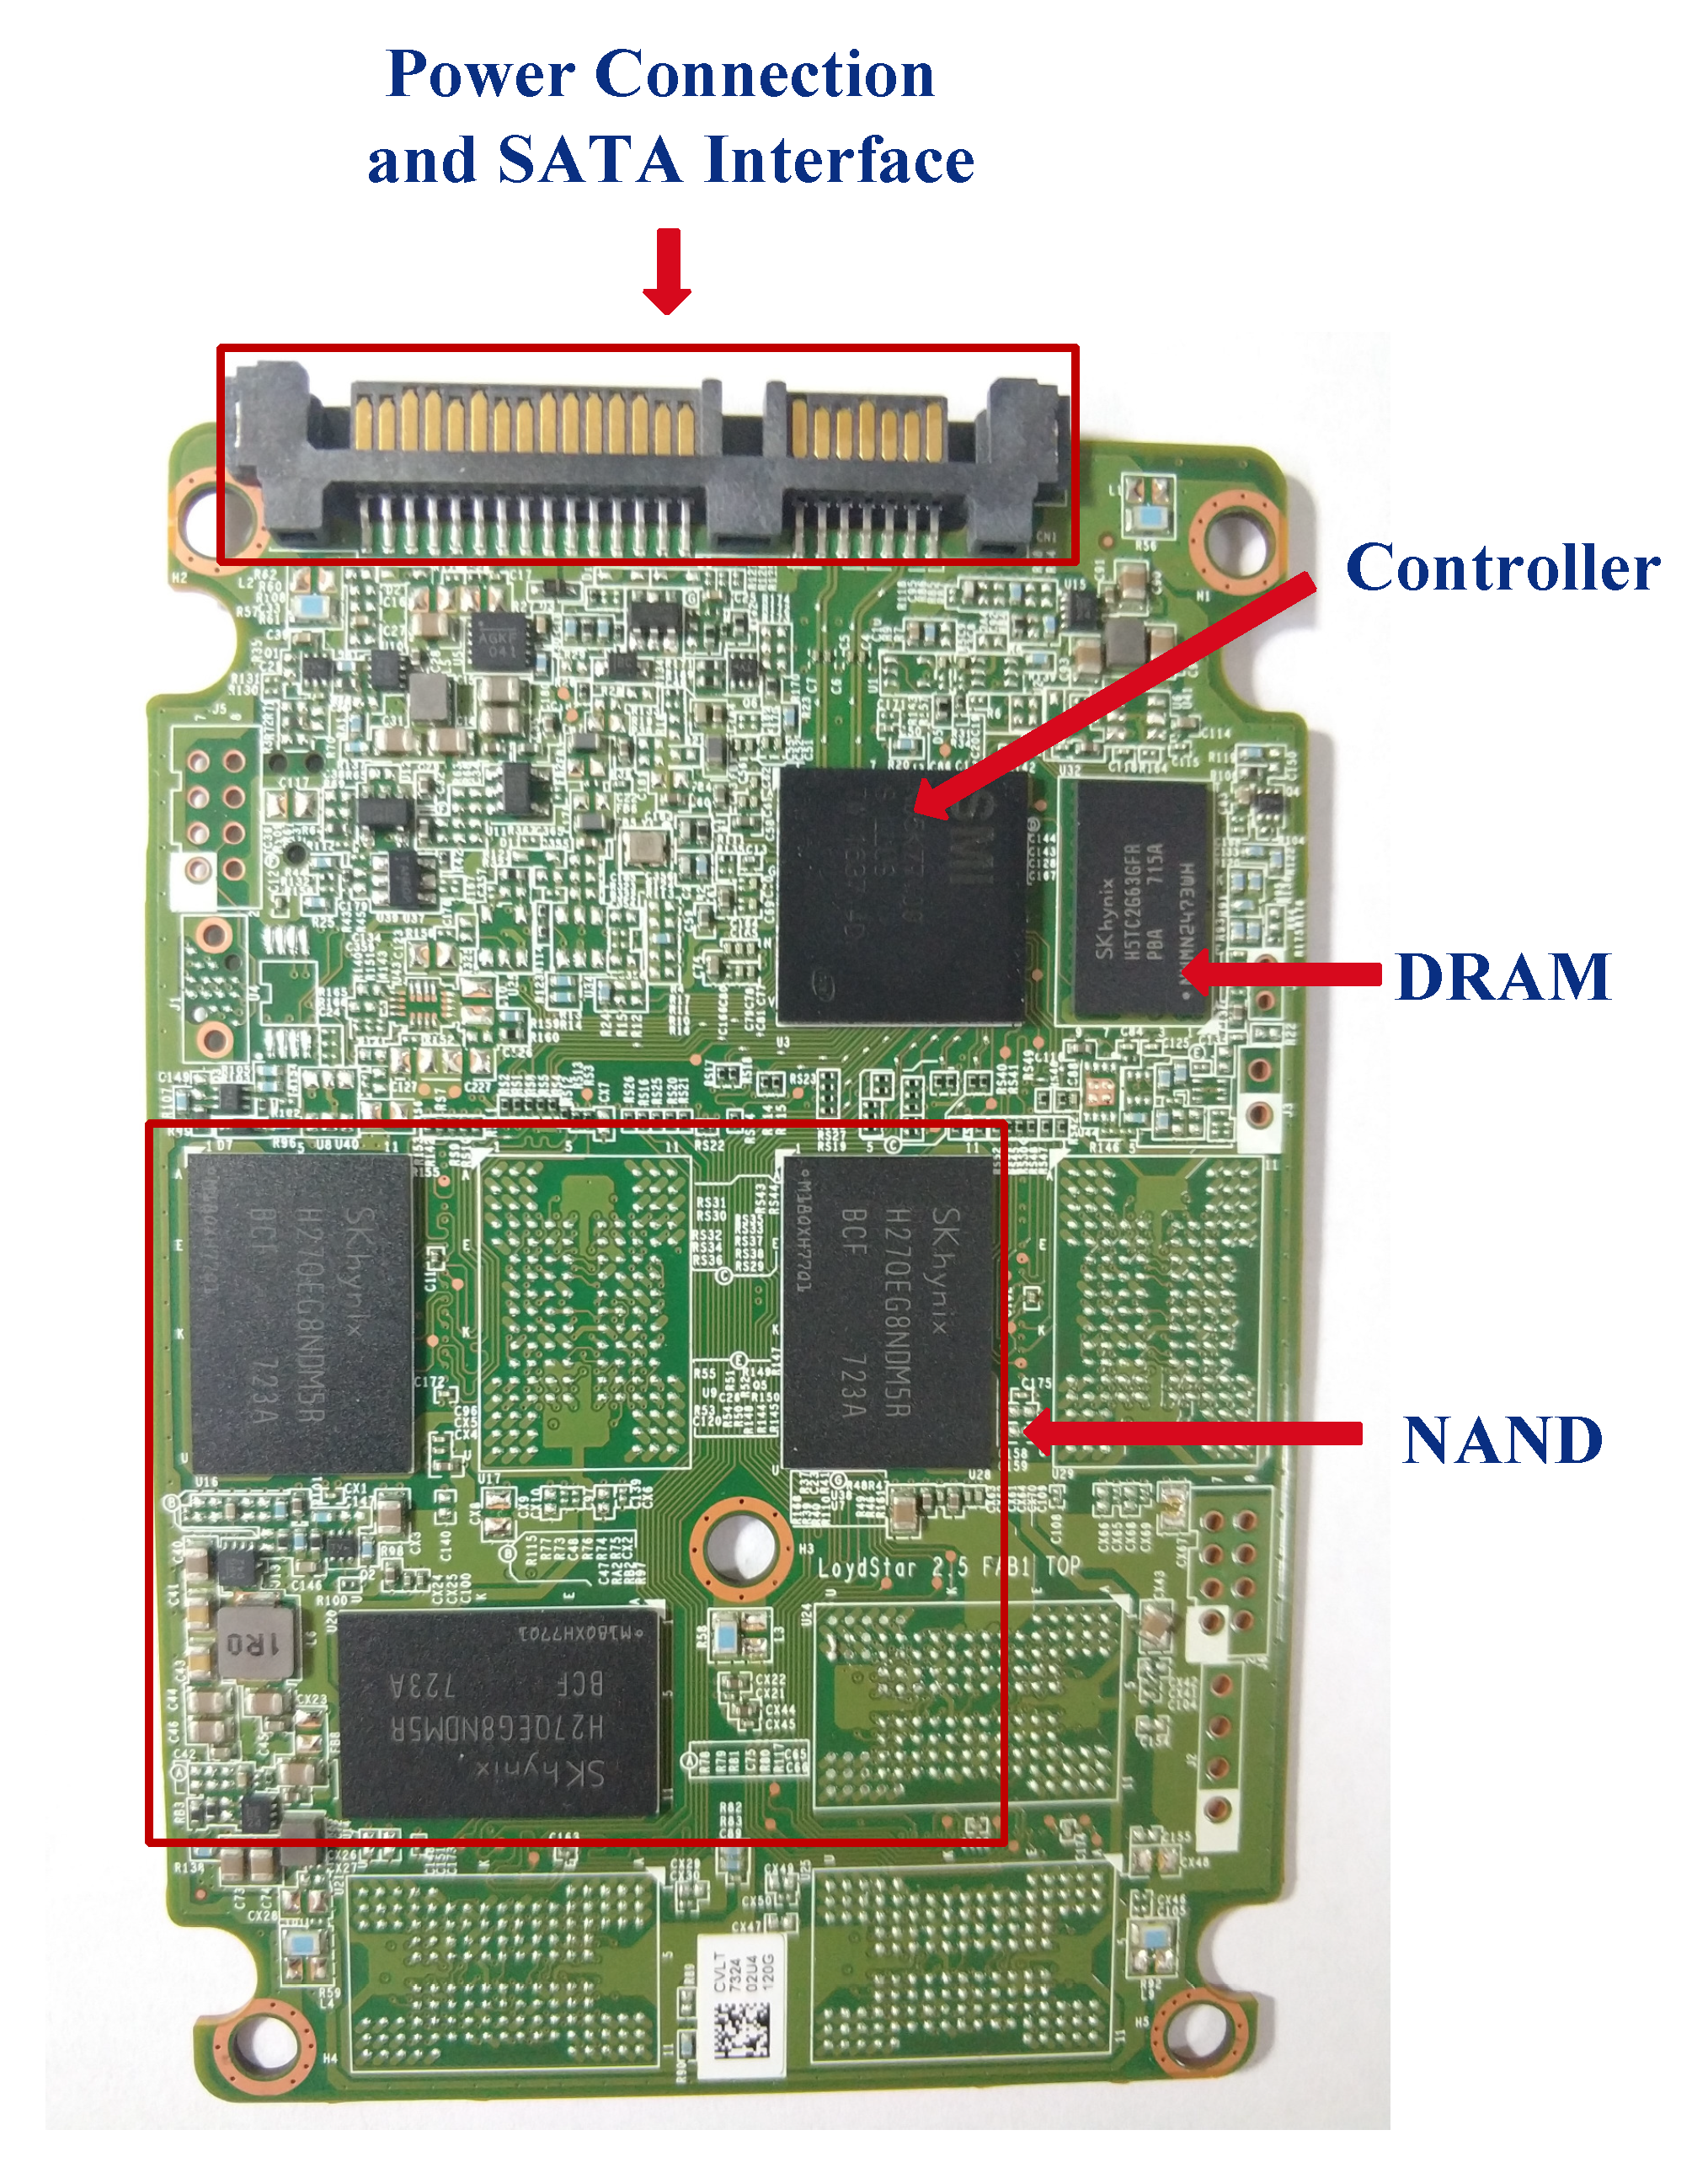
We selected 3D TLC SSDs with the capacity of 120G from Intel (
Figure 1) as the samples for endurance test. There are several major components on the board like power and data interfaces, controller, DRAM, NAND, and so forth. All the components may contain multiple NAND ICs(integrated circuits). The controller is a microprocessor using an external DRAM for its working memory and running the logic in firmware. The controller communicates with both NAND and host, it is responsible for converting the read and write requests from the host to the I/O operations of the NAND. The NAND flash chips were connected by a channel and each chip consists of one or more dies and each die consists of multiple planes. Normally a plane is composed of a number of blocks which are the units for erase operation and a block is composed of multiple pages, which are the smallest unit to read or write. The parallelism of data transfer contains four main levels which are channel-level, chip-level, die-level and plane-level. The DRAM is typically used to temporarily buffer the write requests or accessed data and the mapping table, which is used to map the logical address from the file system and the physical address on the flash. The other basic parameters of SSD are shown in
Table 2. These parameters show the type of SSD and the corresponding NAND process.
4.2. Measurement Setup
Each SSD was connected to a single machine in order to avoid interference from other devices or programs. There was only one HDD (for data storage) and one SSD mounted on each machine, and no other tasks occupied the CPU or disk I/O resources. The whole process was an accelerated SSD aging process, so we wanted the process to simulate a real scenario and also be as quickly as possible. While setting the workload for a benchmark, we consulted the characteristics of the Oracle Archive system’s workload [
45] in which the write operation, more than read operation, can accelerate SSD circulation. Oracle Archive is the archiving mode of an Oracle database. In this mode, the database will back up the previous online redo logs first then erase the backup logs and start writing new online redo logs (redo files). The characteristics of this application’s workload are typically writing dominant. The read operation accounts for approximately 0–20%, and most of the random read and the write operations account for approximately 80–100%, most of which are random writes. The processed files were mainly small files with file sizes distributed in ranges of 0–2 kb, 8–16 kb and 32–64 kb.
According to the characteristics of Oracle Archive’s workload, we set up related parameters for the PostMark benchmark, as shown in
Table 3, and the file sizes were randomly generated and they ranged from 32–64 KB, with a read/write ratio of 2/8, the read and write operations block size was 8 KB, the number of concurrent file operations was 100,000, the number of transactions was 400,000 and the number of working directories was 50. The default PostMark parameters were not large enough; therefore, the parameters we set were scaled up.
4.3. Measurement Flow
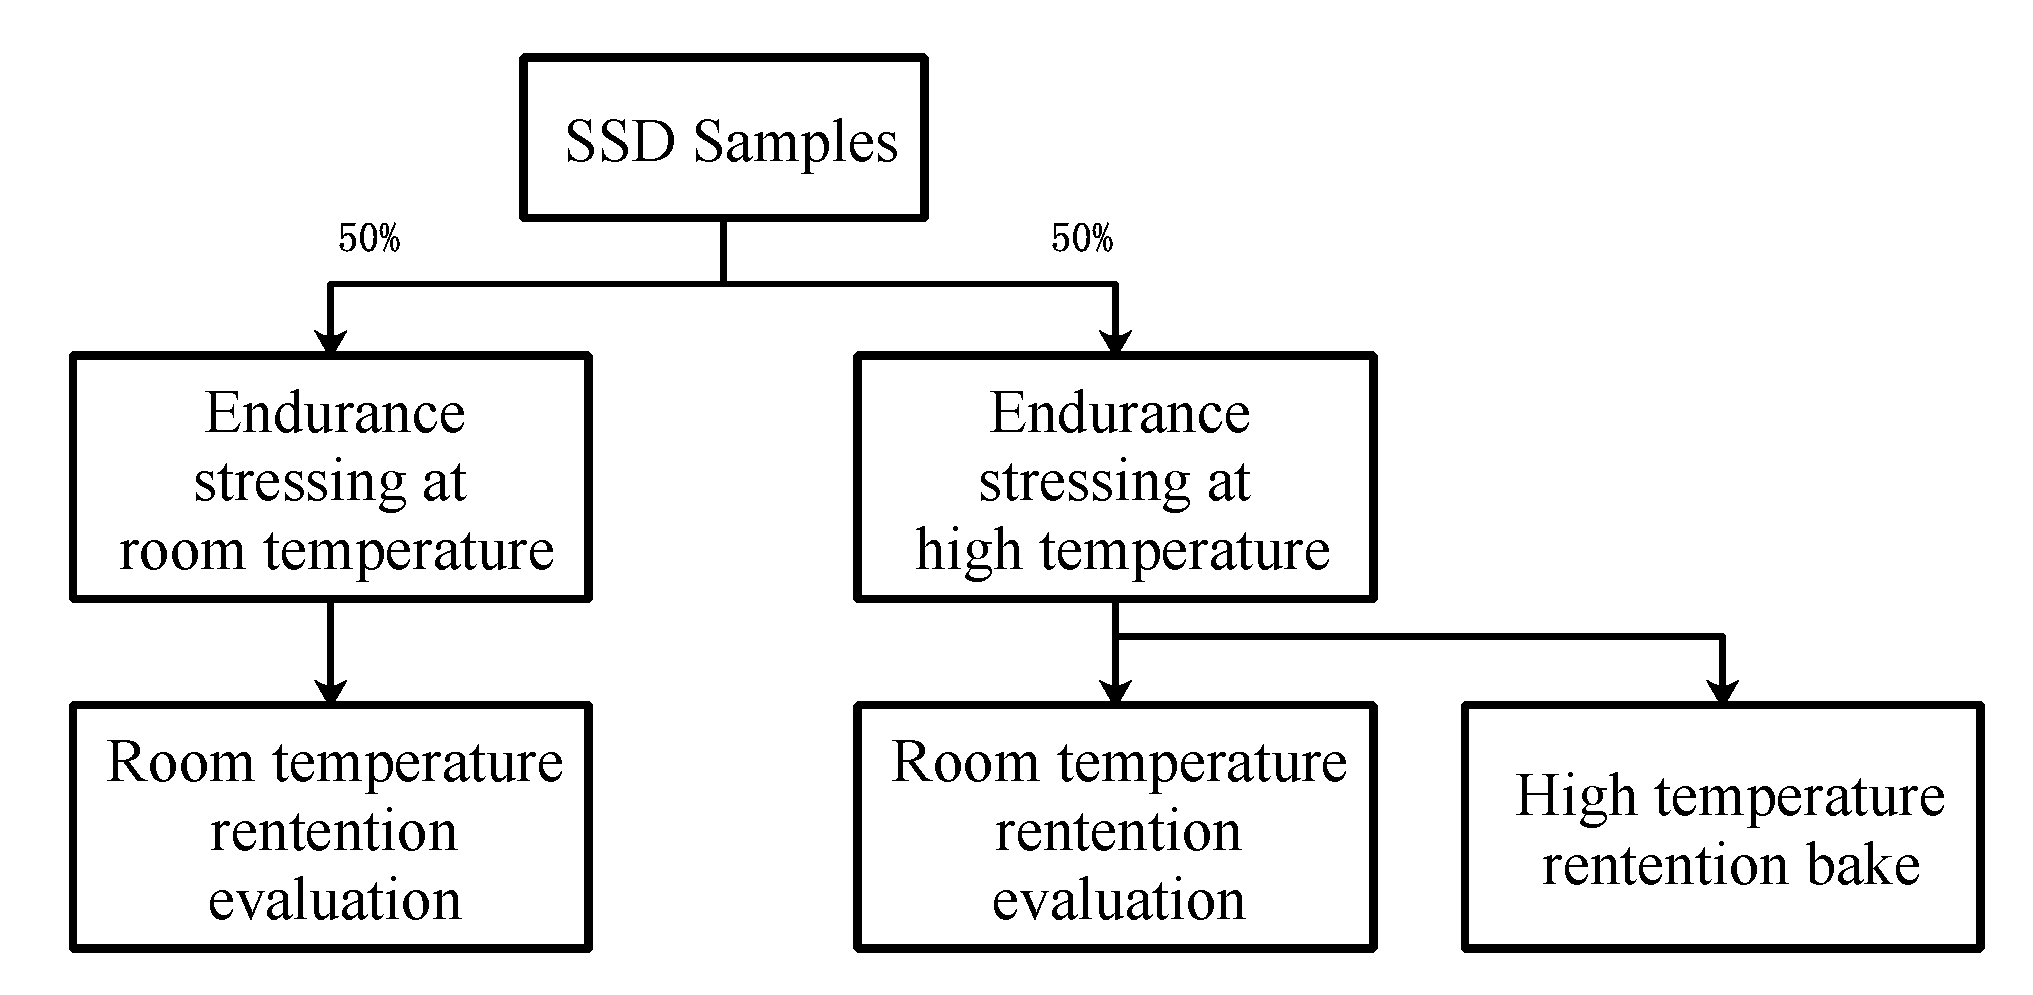
The JESD218 standard aims to provide an endurance test of SSDs. This standard covers the complete endurance test and data retention test for SSDs
Figure 2 but it does not cover all aspects of SSD reliability, such as circuit board failures, controller failures or soft errors caused by radiation. The purpose of our measurement was to obtain a series of reliability data when SSDs were worn to their endurance limit; therefore, we only conducted the accelerated endurance test at room temperature and excluded the data retention test.
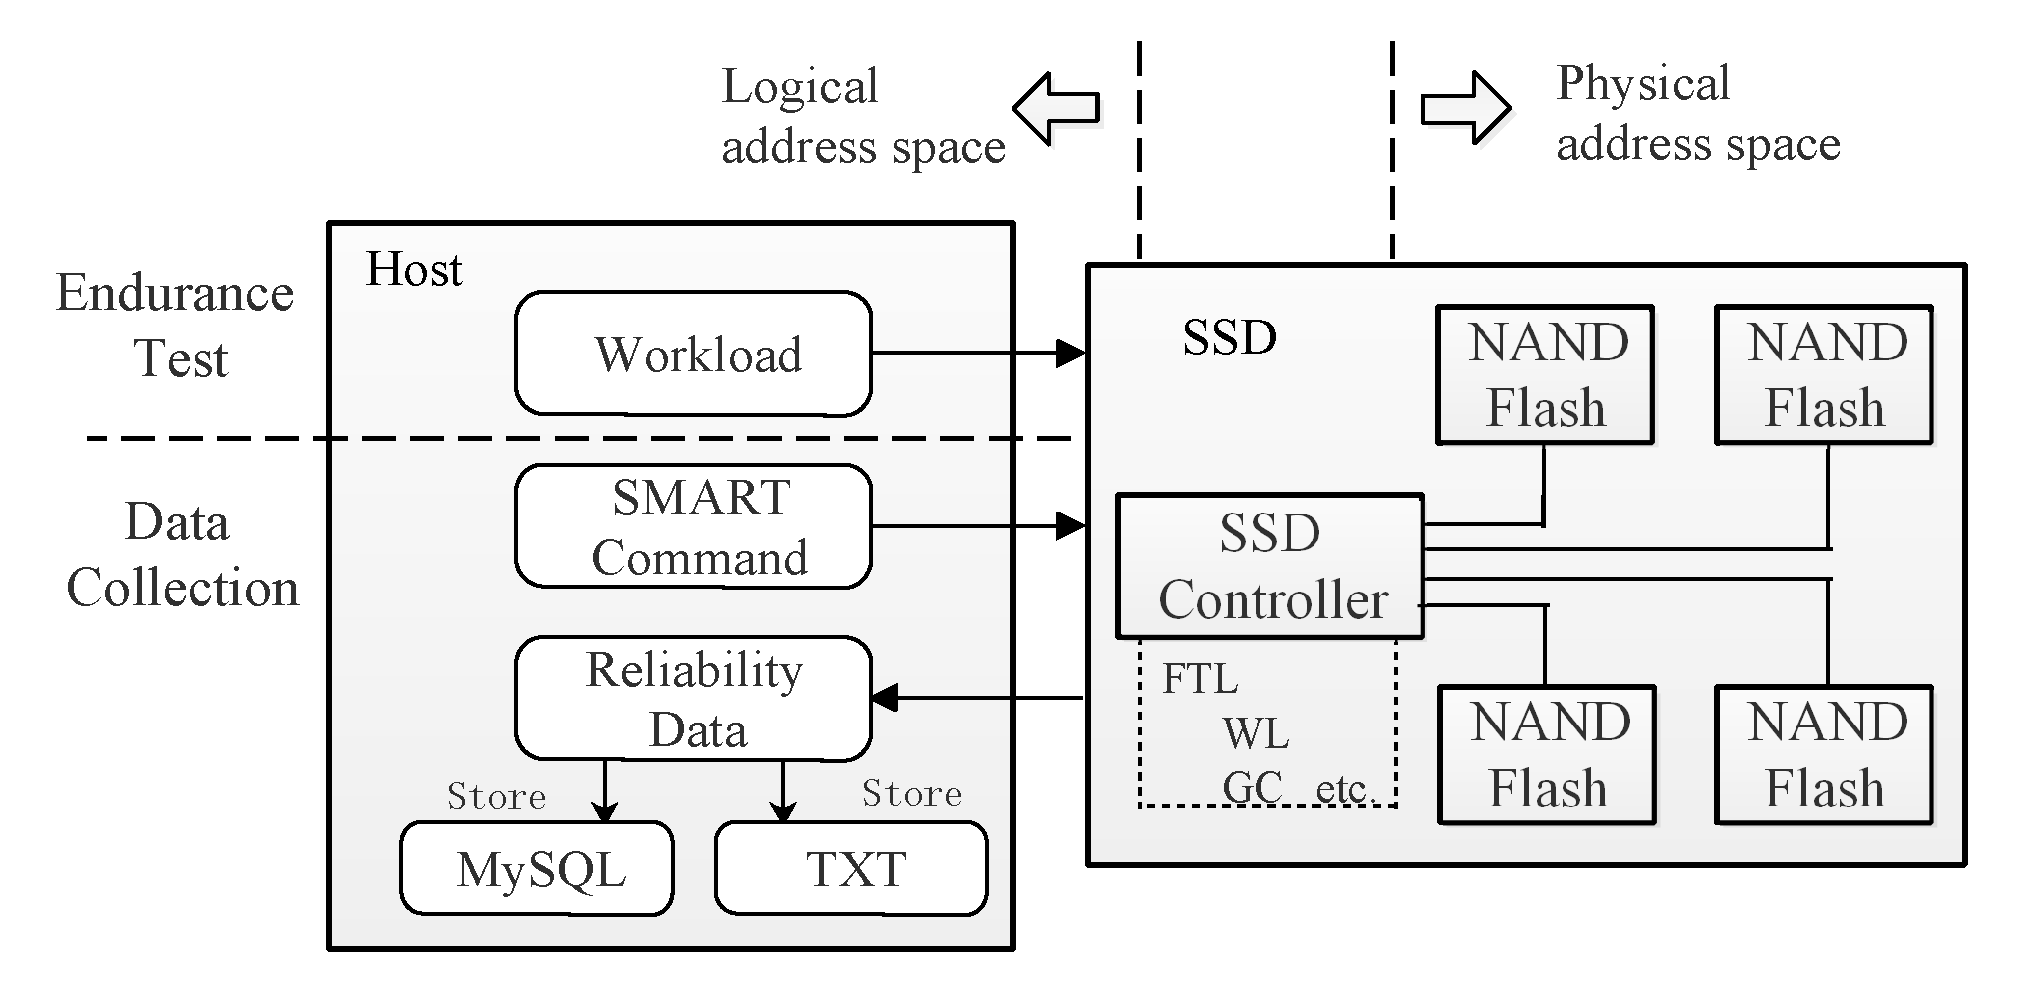
We designed a control process of the measurement flow including the procedure to generate the workload to perform the test and data collection. The benchmark was continuously executed and the SSD reliability data was collected until the data could no longer be written into SSDs within a few months. The overview of measurement flow and data collection is shown in
Figure 3.
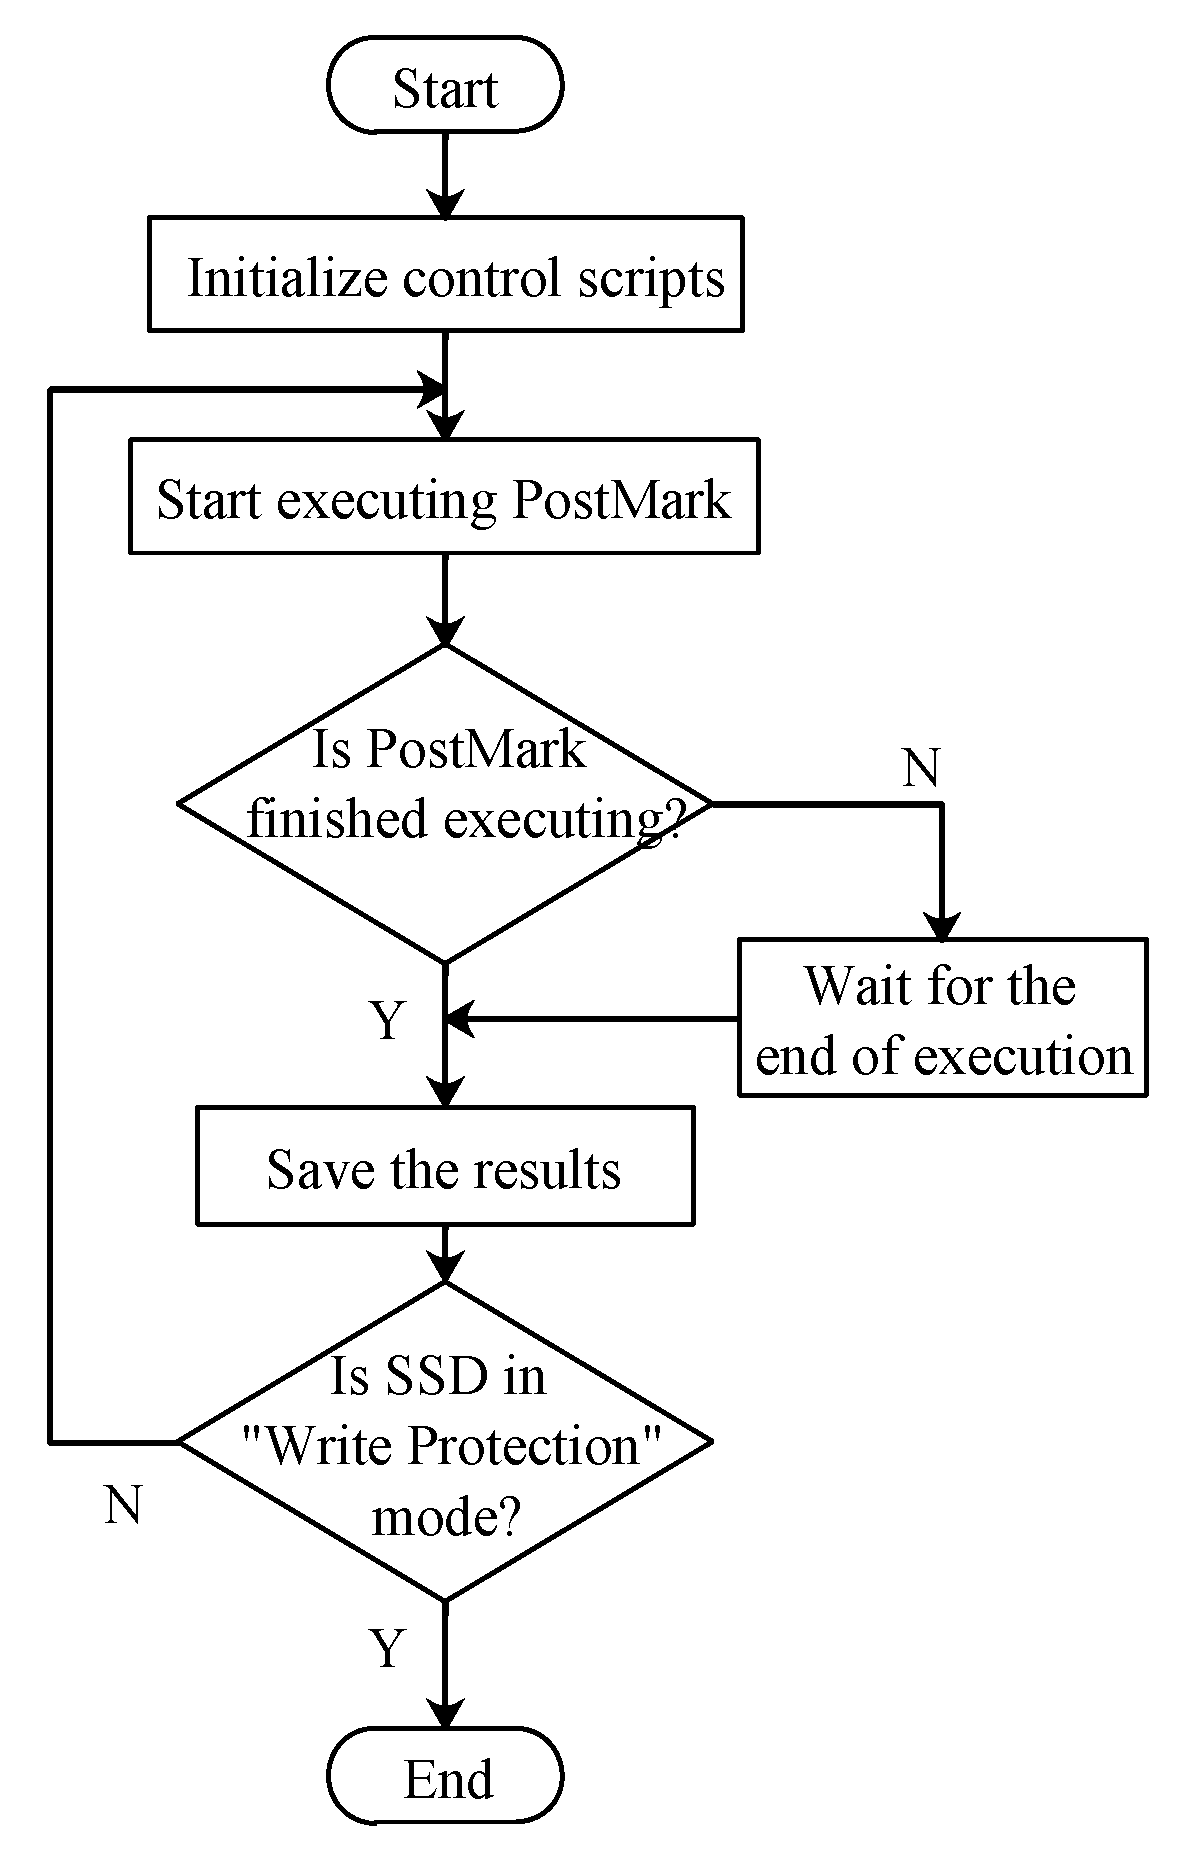
During the endurance test, the workloads were generated continuously by the PostMark to keep the SSDs in working state, and the execution of the program was an automated process, which is shown in
Figure 4. Firstly, the control scripts for setting the parameters of PostMark and other related programs were initialized. Secondly, the execution of PostMark was started and the results were saved when the execution finishes. Then the program would check whether the SSD entered the “write protection” mode. If it was “Yes,” it meant that SSD had reached its endurance limit, the test process of this SSD sample was ended. If it was “No,” the execution of PostMark was triggered again to keep testing.
4.4. Data Collection
During the measurement procedure, the SMART data and the device statistics data from the SSD were acquired using Smartmontools [
44]. Because the SSDs from different manufacturers have different SMART attributes, some SMART attributes could not be obtained. Some SMART attributes only had a name and there were no corresponding values.
The problem is similar for the device statistics data. In the list of the statistics, some attributes do not contain any values, and these kinds of SMART attributes or device statistics attributes are not included in the scope of this work.
Table 4 lists some SMART attributes that were collected and used in this research, and type represents the types of information collected, cumulative represents aging over time, and normalized values represent the ranges of 1–100 in which the lower values are worse and the higher values are better.
A portion of the device statistics data collected and used in the research is listed in
Table 5, which reflects the statistical information from devices such as temperature statistics, error statistics, transmission statistics and summary statistics. We implemented the program in Python to process the data into MySQL format and save them in the database. We also developed some Linux Shell scripts to store the execution results for PostMark and the corresponding data in file format. The collection interval is one hour.
5. Graphical Display and Analyses of SMART Data
NAND Flash cells can undergo a limited number of P/E cycles that vary with the process, which is also referred to as its endurance rating. The flash wears out permanently when its P/E cycles are all consumed. Generally, an SSD adopts wear-leveling to distribute the wear evenly in each flash cell to average the overall wear. However, as time goes by, the overall wear will eventually lead to SSD failures.
In this section, we present some SMART attributes collected from the measurements and analyze the changes in the attributes and related phenomena. There were 10 machines used for the test including three different hardware configurations, Type-A × 4, Type-B × 4 and Type-C × 2. All the machines used the same version of the operating system and other related software, the detail of the configuration is shown in
Table 6. The SSDs were used for testing and have been described in
Section 4. The measurement in this work contains 10 SSDs, but 3 of them failed during the measurement due to a sudden power cut. Therefore, we only show and analyze the changing trends of SSD SMART attributes from 7 samples. The attributes are displayed in
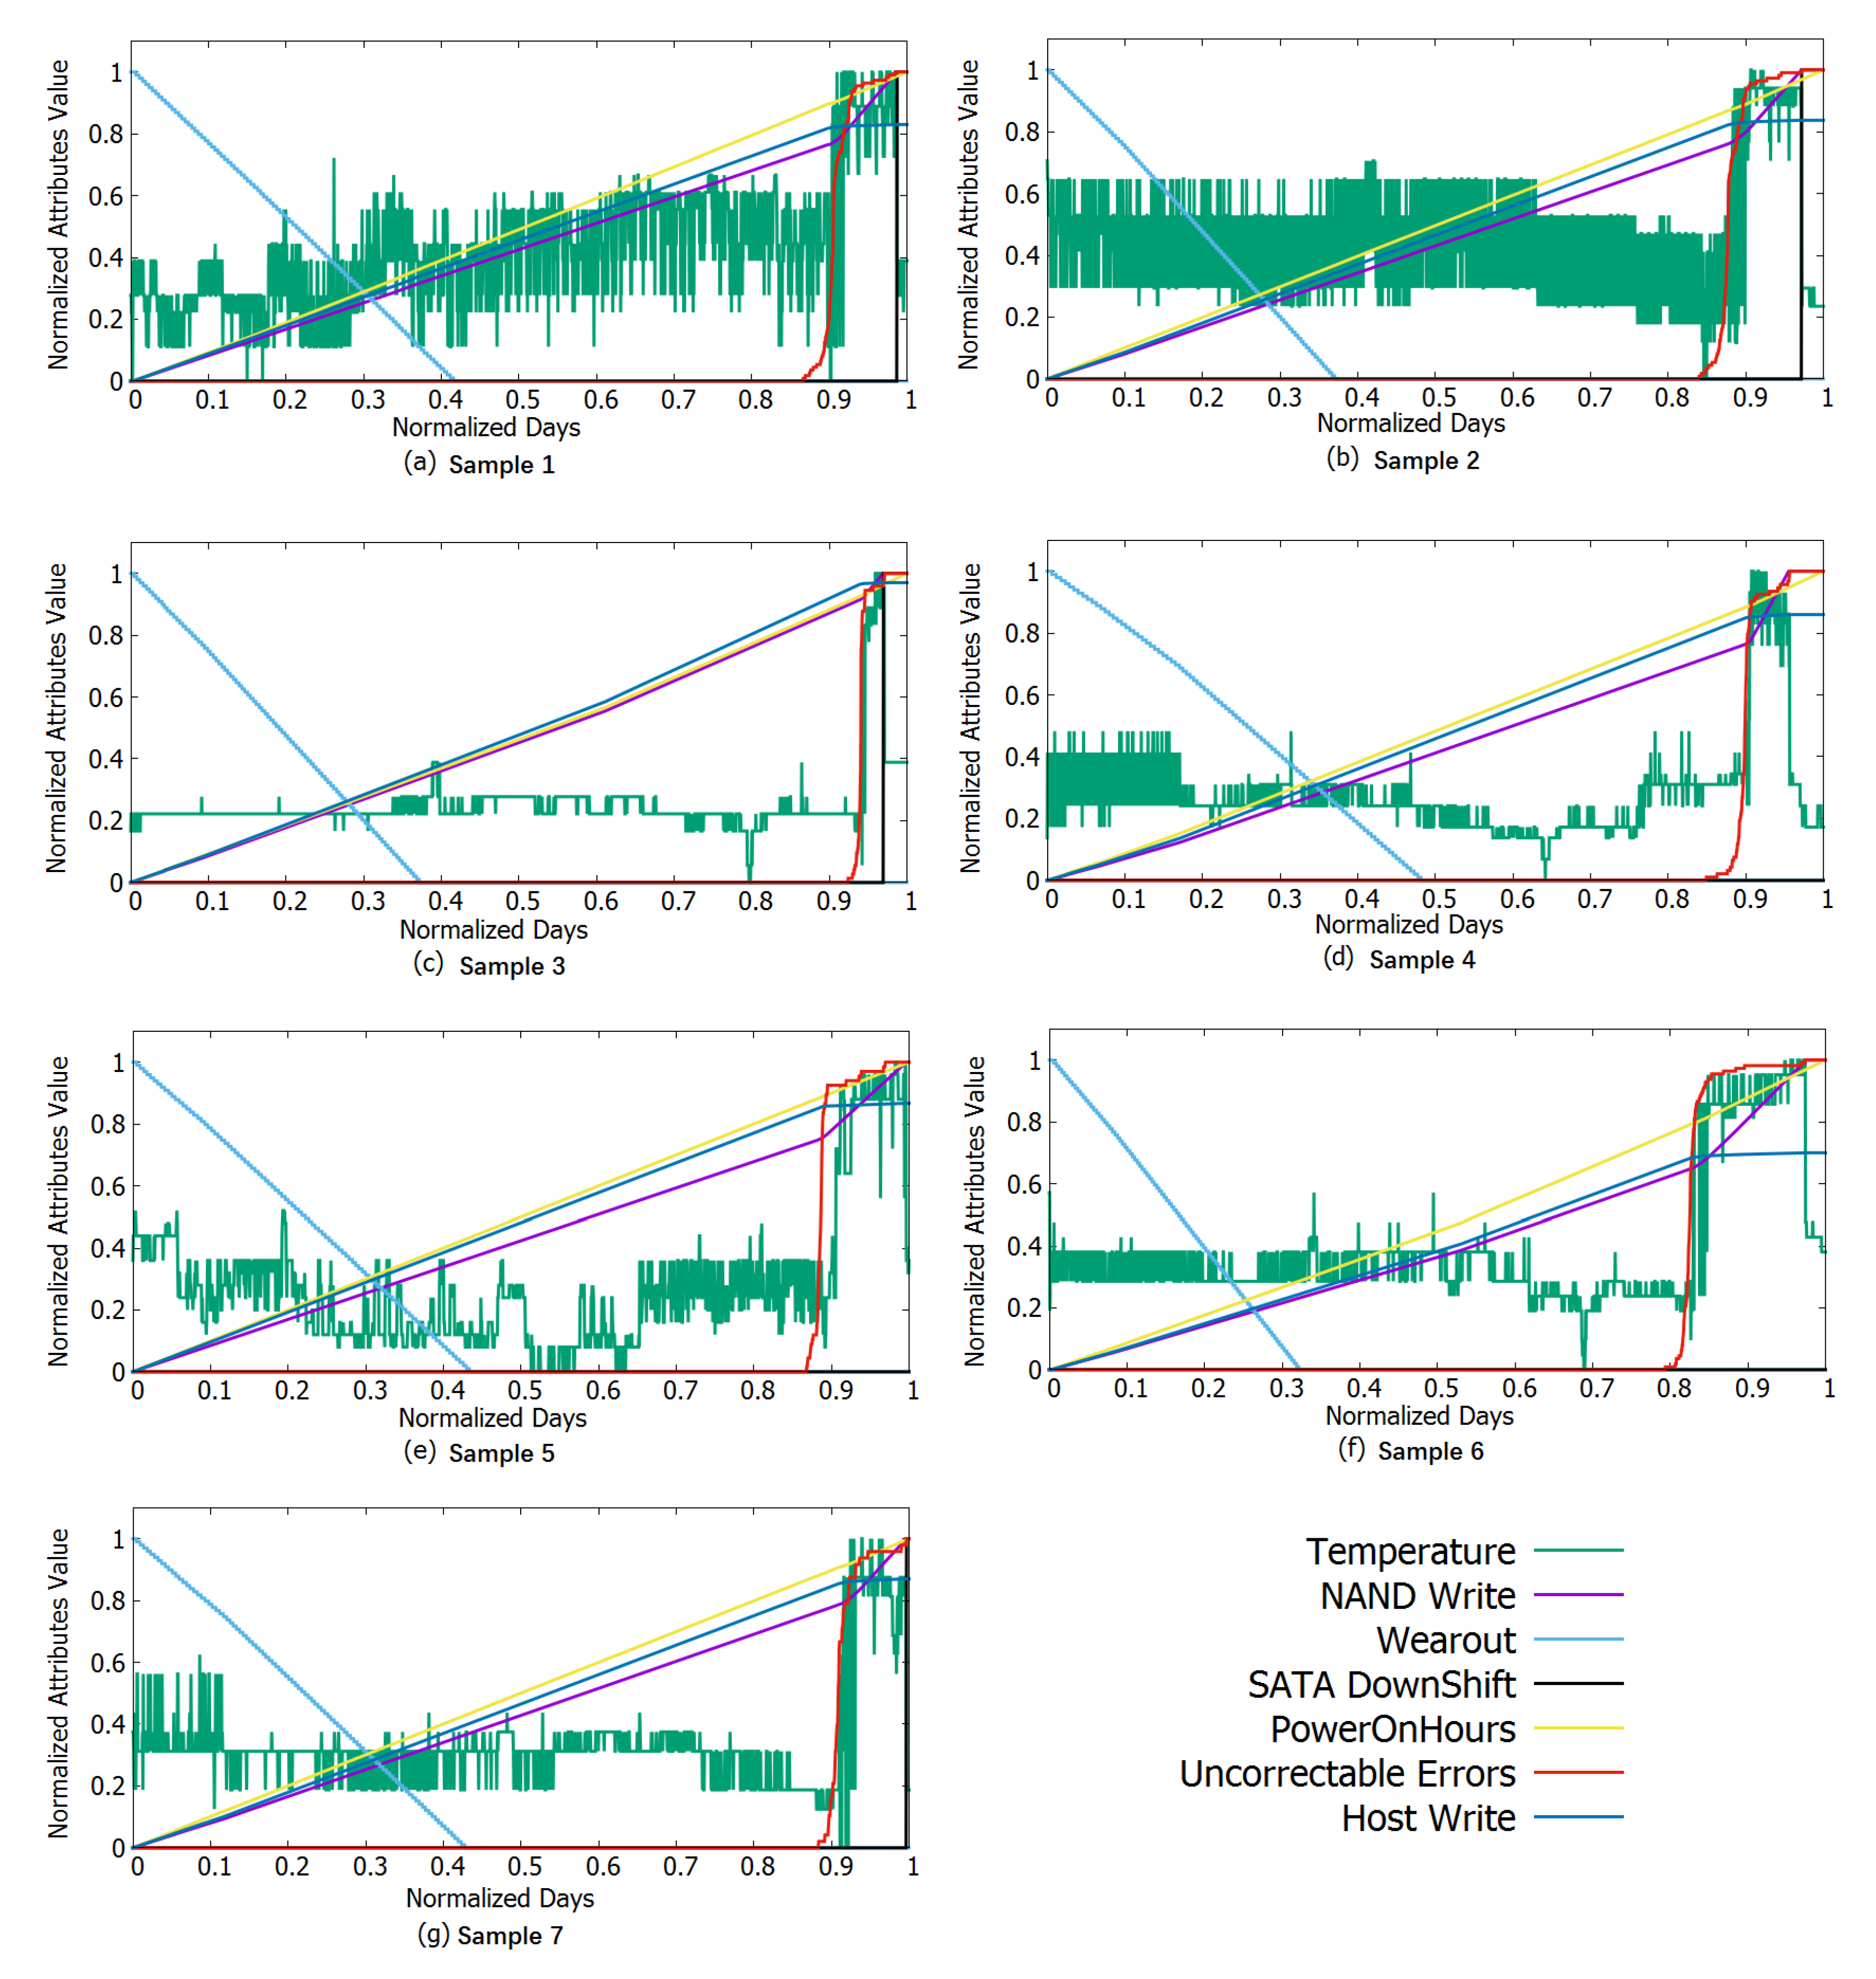
Figure 4 where the x-axis is time and the y-axis is the normalized values of each attribute.
5.1. Host Writes and NAND Writes
As explained earlier, the endurance rating of flash cells is related to the number of P/E cycles they can consume. The accumulative P/E cycles of an SSD are directly affected by the volume of the data written to it. The accumulative P/E cycles of an SSD can be estimated according to the amount of data written to an SSD. In a sense, the amount of data written to an SSD can be equivalent to P/E cycles.
There are two types of data written to an SSD. One is the host writes, which represents the amount of data to be written to an SSD transmitted by the operating system through the interface. Another one is NAND writes, which represents the amount of data actually written to the NAND Flash.
Figure 5 shows the variations in the host writes and NAND writes for an SSD sample. Under normal program conditions, since the controller of 3D TLC SSD has a compression algorithm, the write amplification (WAF) can be less than 1, that is, the amount of NAND writes is less than the host writes.
For a long period, SSDs present a stable state of programming and, as the execution of benchmark, the host writes keep increasing up to about the 80–90% stage of the measurement, the growing rate of host writes slows down and, due to the wear, SSDs cannot accept the previously requested volume of data. At the same time, the growing rate of NAND writes is dramatically increased. The reason for this increase is that when the SSD approaches permanent wear-out, most blocks are actually worn out already, and only a few blocks can still be programmed. In this phase, the available space in an SSD cannot meet the program request generated by the benchmark program.
5.2. Write Amplification
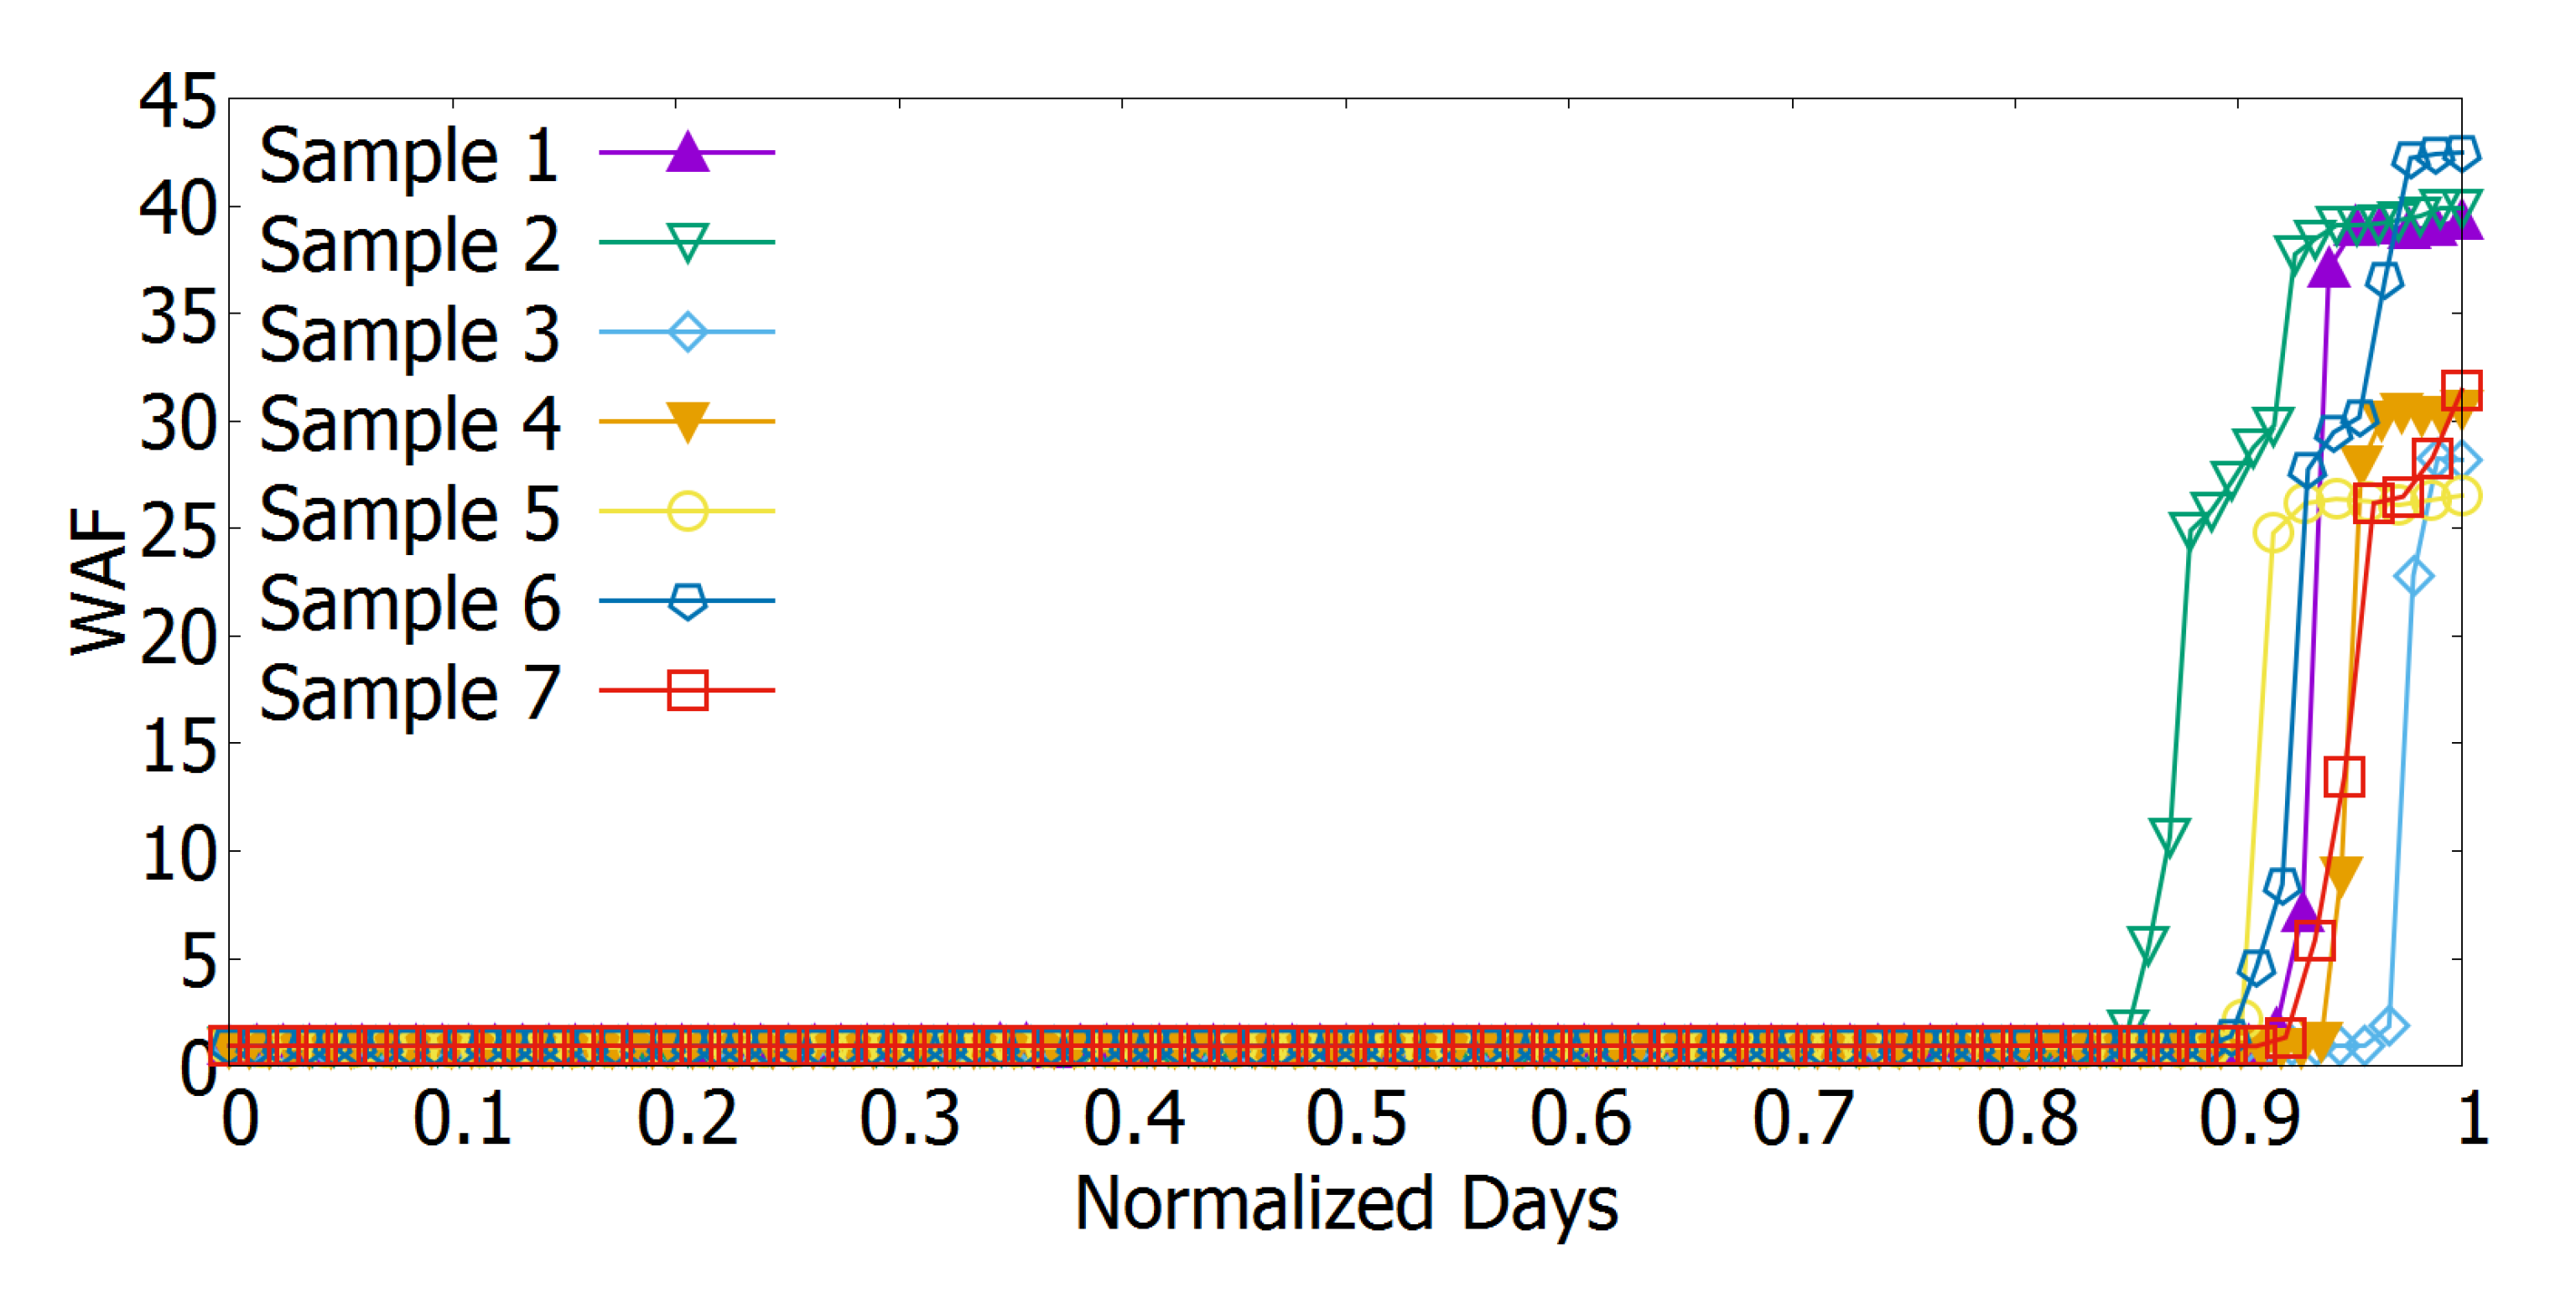
For the sake of writing the same volume of data as written previously, the SSD needs to perform more garbage collection to provide empty space within blocks that have not been thoroughly worn out for data programs. This process also leads to a rapid increase in an SSD’s WAF(write amplification). When the NAND writes grow towards the end in
Figure 5, the SSD is extremely close to wearing out and any more program operations may lead to SSD failures. In cases of losing data, an SSD enters the “write protection” mode and cannot perform any program operations (NAND writes stop growing). The variation process of WAF is shown in
Figure 6. It can be seen from the figure that the WAF of each sample is in a relatively stable state for a long time but they increase significantly at similar rates when the SSDs are close to their endurance limit. Equation (
1) is used to calculate the WAF corresponding to the daily data volume, where
i represents days,
represents NAND writes,
represents host writes.
5.3. Media Wear-Out Indicator
Each SSD manufacturer has multiple types of products for different markets and sets the basic parameters based on the rating. Due to the limited lifetime of SSDs, manufacturers often define the terabytes written (TBW) of an SSD according to flash type, capacity, warranty period and other indicators and use it as the endurance rating for an SSD.
Media wear-out indicator is a normalized value that indicates the SSD wear degree. The value of a new SSD starts from 100 and decreases to 1 with an increase in P/E cycles.
Figure 5 illustrates the changes in this attribute, it can be seen that the value has decreased to 1 after approximately 40% of the measurement and the volume of the data written to the SSD has reached the threshold declared by the manufacturer. In a later time, SSDs still maintain a stable state of the data program; thus, we believe the threshold declared by manufacturers is too conservative. The value of the media wear-out indicator falling to 1 is insufficient to declare that an SSD has reached the end of its lifetime.
5.4. Uncorrectable Errors
The Facebook study [
3] focuses on the MLC NAND Flash due to its lower age and less usage of SSDs; the SSD age is between 0.5 to 2.4 years on average across different hardware platforms, and SSDs have less than 100 P/E cycles. Their report shows that the “old” SSDs have more uncorrectable errors than the “young” SSDs and for each platform, most of the errors are produced by a few SSDs while the uncorrectable bit error rates (UBERs) are between
and
.
Google counted the proportion of SSDs affected by uncorrectable errors within four years in their study [
4] and showed that it is common for SSDs to have uncorrectable errors. According to different types of SSDs, 26% to 90% of SSDs experience at least one uncorrectable error.
We observe that uncorrectable errors are inevitable along with the wear of SSDs, and all samples in the measurement more or less have uncorrectable errors. The uncorrectable errors do not occur immediately when SSDs are put into use and they will suddenly increase to a large number when an SSD is close to its endurance limit, as shown in
Figure 5, for a long period of time and the SSDs have no uncorrectable errors. The uncorrectable errors appear at approximately 80% stage of the measurement and, in the following stage, the cumulative number of uncorrectable errors increases rapidly and finally stops at a value. The UBERs of our samples are 3
according to the observation, which are similar to the results from Microsoft and Facebook that show all rates are more than an order of magnitude above the
and
that are required by the JEDEC standard [
6] for consumer and enterprise class drives, respectively. The reasons for these wide ranges of UBERs might be different from our conjecture.
5.5. Temperature
There is a common view that high temperatures may have negative effects on SSD performance and accelerate the aging of flash cells. The influence of external temperature is particularly important to SSDs and data centers have appropriate cooling methods according to the characteristics of the flash. In addition to the factors of external temperature, it is also necessary to understand the variation characteristics of SSD internal temperature, since the drives are deployed until final wear-out. We can obtain the real-time working temperature of the SSD controller through the sensor set by the manufacturer inside the SSD, which can better indicate the changes in SSD internal temperature.
Figure 5 shows the variation of SSD internal temperature, since we initialize the measurement until SSDs wear to their endurance limit. The overall trend is similar to uncorrectable errors, NAND writes and other attributes. For a long period of time, the temperature fluctuates steadily in a range of
–
, and at approximately 90% of the measurement, the temperature begins to increase significantly and rises to a range of
–
. After SSD controllers are in this temperature range and last for about half a week, the SSDs enter “write protection” mode and are unable to be written anymore, then the temperature returns to the previous range spanning
–
. The specific reasons will be discussed in the following paragraphs.
5.6. SATA Downshift Error
The SATA interface may downgrade to a lower signaling rate (e.g., from 6 Gbps to 3 Gbps) when too many errors are encountered. Such a low signaling rate will result in SSD performance degradation. The reason for this phenomenon could be temporary or permanent errors. According to our observations, some SSDs select a lower signaling rate when they are reaching their endurance limit. Furthermore, as listed in
Table 7, more than half of the SSDs downgraded once and a few of the SSDs never downgraded. The time points for this phenomenon’s appearance usually occur after the SSDs enter the “write protection” mode and
Figure 5 displays the changing processes in the SATA downshift error count for an SSD in its lifetime.
5.7. Joint Analysis of SMART Attributes
As shown in
Figure 5, some attributes such as temperature, NAND writes, wear-out, SATA downshift error count, uncorrectable errors and power-on-hours are displayed to better compare some changes and phenomena of different attributes. Some obvious changes can be seen from the figure. The change of the wear-out has been explained earlier, so we will not explain it too much here.
There are strong connections among NAND writes, temperature and uncorrectable errors, and NAND writes experienced a rapid increase at approximately 80–90% of the measurement process. As mentioned before, the SSDs need to perform more garbage collection to provide enough empty space for a data program while their P/E cycles have been frequently consumed. However, the program process for NAND Flash requires applying a high voltage at the control gate of the floating gate transistor to allow the charge to pass through the oxide layer from the channel into the floating gate layer. Due to the wear of an SSD, the oxide layer of flash cells is unable to effectively provide the function to isolate the charge. After a program operation, the controller will find that the flash cells cannot effectively distinguish the voltage represented by the data, which results in a program failure. The program process will be longer, even though the volume of data is the same as before.
The frequent voltage adjustment for the program operation makes the SSD controller very busy, so the overall temperature of the chips will increase significantly. At the last stage, SSDs have reached their endurance limit completely and enter “write protection” mode; thus, no more data could be programmed. The value of NAND writes stops growing and only read operations could be done; thus, the overall temperature of SSD drops back to a normal state.
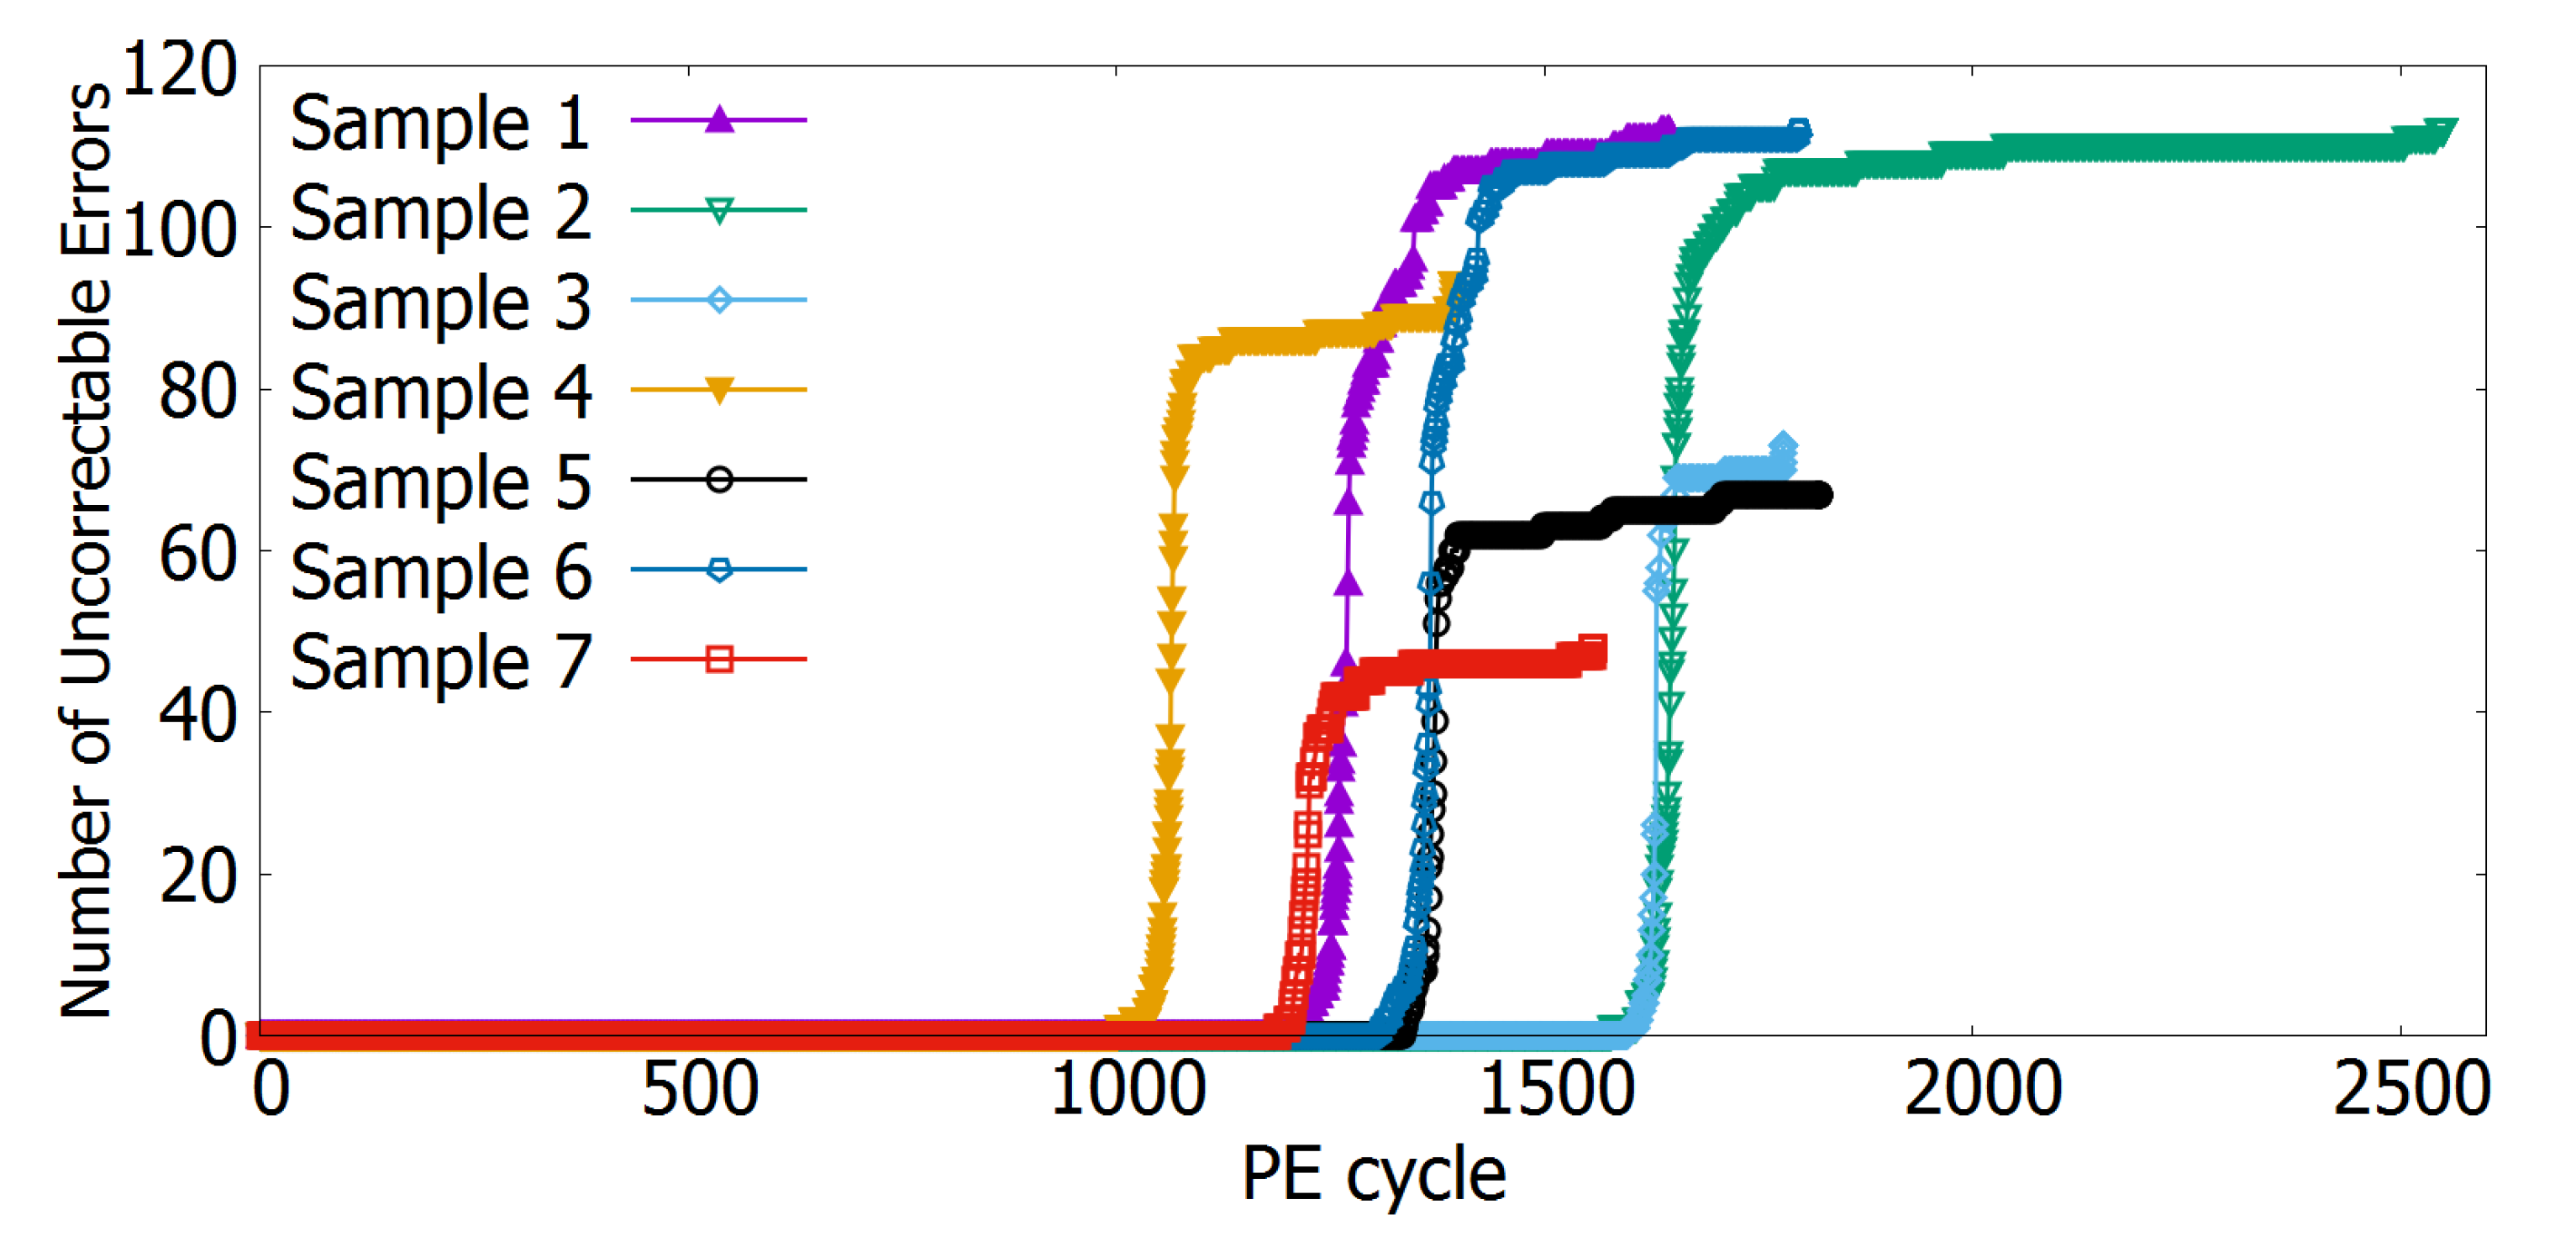
Figure 7 shows the relationship between uncorrectable errors and P/E cycles for all of the samples. It can be seen that the P/E cycles experienced by the samples are around 1500 to 2000, the one with the most P/E cycles is more than 2500; they are all in line with the characteristics of TLC NAND Flash with an average P/E cycles of 1000 to 3000. The uncorrectable errors of each SSD appear at a later stage of its lifetime, it is also the time point that temperature and NAND writes show sharp increases. The sudden increase in uncorrectable errors in the following short time is also due to severe SSD wear. Most of the cells are still usable before they reach their endurance limits, but they are also very vulnerable. Data errors may occur more frequently than before when reading or programming the flash cells.
To verify the influence of environment temperature fluctuation on the changing trends of SSD reliability, two SSDs are in the condition of normal room temperature and others are in the condition of constant room temperature, which is
. As shown in
Figure 5, the temperatures of first two SSDs (a and b) fluctuate over a wider range than others but the overall trends are similar, so we believe that the environment temperature fluctuation has little impact on the changing trends of SSD reliability.
The analysis of the diagrams in the above paragraphs clearly show that many SMART attributes change significantly as SSDs are close to their endurance limits. A number of phenomena such as the rapid growth of UE and the continuous high operating temperature of the controller, all indicate that SSDs are going to fail.
Some studies compared and analyzed the features of different types of flash chips. Cai et al. [
11] studied the characteristics of TLC NAND Flash and MLC NAND Flash in terms of threshold voltage distribution trends, program errors, data retention errors, read disturb errors and others; they think that TLC NAND Flash and MLC NAND Flash show similar behaviors. Mielke et al. [
13] studied two series of SSDs (S3500 and S3610) in data retention, bit errors, failure mechanisms and they showed similar characteristics. Schroeder et al. [
4] and Narayanan et al. [
2] studied various SSD drive models with different types of flash chips in Google and Microsoft data centers respectively and discussed multiple SSD reliability characteristics. The conclusion indicated that a number of different types of SSDs showed similar reliability characteristics or trends partially. Therefore, we believe that the changing trends of reliability characteristics of 3D TLC NAND Flash presented in this paper have a certain representativeness and can reflect some reliability characteristics of other types of flash chips to a certain extent.
In addition, NAND Flash-based SSDs have a great possibility of failure due to sudden power faults. Although manufacturers can deploy a protective capacity on the SSD motherboard to cope with this problem, it is still necessary to enhance the protection mechanism.
6. Correlation Analyses of SMART Attributes
In this section, we aim to explore the internal relations among SMART attributes and whether some SMART attributes are dominant in SSD failures and we also provide support for parameter selection of SSD failure prediction, which will be researched soon. We analyze the relationships among different SMART attributes filtered by our analysis and through visual inspection of the Pearson, Spearman, Kendall correlation coefficients.
6.1. Pearson Correlation Coefficient
In statistics, the Pearson correlation coefficient is widely used in the sciences as a measure of the linear correlation between two variables
X and
Y as follows:
where the
is the covariance,
is the variance of
X,
is the variance of
Y. The Pearson correlation coefficient is symmetric:
, and according to the Cauchy-Schwarz inequality, it has a value between 1 and
, where 1 is total positive linear correlation, 0 is no linear correlation and
is total negative linear correlation.
6.2. Spearman’s Rank Correlation Coefficient
In statistics, the Spearman’s rank correlation coefficient is a nonparametric index to measure the dependence of two variables, and it uses monotonic functions to evaluate the relationship between two variables. If there are no repeated data values, a perfect Spearman correlation of 1 or occurs when each of the variables is a perfect monotone function of the other.
For two variables,
X and
Y (or two sets), the number of elements in them are all
N. The
i-
values of the two variables are represented by
and
. The two ranked sets
x and
y are obtained after sequencing
X and
Y (ascending or descending), where
and
are the rank of
in
X and
in
Y, respectively. A ranking difference set
d is obtained by subtracting the corresponding elements in set
x and
y, where
,
. The Spearman’s rank correlation coefficient is calculated as follows:
6.3. Kendall Rank Correlation Coefficient
In statistics, the Kendall rank correlation coefficient—which is commonly referred to as Kendall’s tau coefficient—is a statistic used to measure the ordinal association between two measured quantities. A tau test is a nonparametric hypothesis test for statistical dependence based on the tau coefficient. The Kendall correlation coefficient value ranges from to 1, and it means that the two variables have consistent or opposite rank correlation when is 1 or , respectively, and it means the two variables are independent when is 0.
For two variables,
X and
Y (or two sets), the number of elements in them are all
N. The
i-
values of the two variables are represented by
and
. The corresponding elements in
X and
Y form a pair of set
, in which the elements are
. When any two elements
and
from the set
have the same rank, that is, case 1 or case 2 (case 1:
and
, case 2:
and
), these two elements are consistent. When case 3 or case 4 occurs (case 3:
and
, case 4:
and
), the two elements are inconsistent. When case 5 or case 6 occurs (case 5:
, case 6:
), the two elements are neither consistent nor inconsistent. The Kendall’s tau coefficient is calculated as follows:
where
C is the number of consistent element pairs in
and
D is the number of the inconsistent element pairs in
.
6.4. Analysis of Three Correlation Coefficients
We select SATA downshift counts, uncorrectable errors, temperature, NAND writes, wear-out and host writes for the correlation analysis. We implement the program in Matlab [
46] with reference to Equations (
2)–(
4) to calculate the correlation coefficients. The value of Pearson, Spearman and Kendall correlation coefficients between the selected SMART attributes are shown in
Table 8,
Table 9, and
Table 10 respectively. As shown in the tables, the three correlation coefficients of NAND writes and host writes are all close to or equal to 1, which shows a strong positive correlation that is consistent with our intuitive comprehension. The three correlation coefficients of NAND writes and wear-out are all close to
, which shows a strong negative correlation and is also consistent with the intuitive observation results. The SATA downshift error appears relatively late in visual inspection and the three correlation coefficients between SATA downshift count and uncorrectable errors are approximately 0.2, which is weak, and the relationship between SATA downshift count and other attributes are weaker or even irrelevant.
The three correlation coefficients between uncorrectable errors and NAND writes or host writes range from 0.4 to 0.6, which indicates a moderate degree of correlation. The Pearson correlation coefficient between uncorrectable errors and temperature is 0.77, which indicates a strong correlation. However, the Spearman and Kendall correlation coefficients are in a range of 0.2 to 0.4, which is only a weak correlation. So, the overall volume of the data written to the SSD has a significant impact on the uncorrectable errors. There is a strong relationship between temperature with both NAND writes and uncorrectable errors in the visual inspection. The Pearson correlation coefficient of temperature and NAND writes is approximately 0.3, but the Spearman and the Kendall correlation coefficient are very low, and the reason should be that the Spearman and Kendall correlation coefficient are rank correlation coefficients, whereas the temperature fluctuates in a small range, so the corresponding rank’s change is not obvious.
In summary, as the correlation between the SATA downshift counts and other attributes is weak, we believe that the change in the SATA downshift counts is not related to the NAND Flash reliability, and it is not suitable as the main metric to identify SSD failures. The wear-out only has a strong correlation with the attributes related to data writes and the manufacturer’s estimation of the threshold value is conservative, which is also not a proper metric to determine the SSD reliability. Some attributes related to data volume are normally affected by the workload, but they can more or less reflect the overall SSD reliability. The uncorrectable errors show a certain degree of correlation with other attributes, the correlation coefficients between uncorrectable errors and other attributes are around 0.5–0.8, which are strong. Specifically, the correlation coefficients among uncorrectable errors, NAND write and temperature are obviously higher than the others and they are closely related to the SSD reliability changes. Therefore, we believe that uncorrectable errors, NAND write and temperature are dominant metrics for identifying SSD failures and are of great value to monitor in estimating the SSD reliability.
7. Conclusions
This paper designs an SSD lifetime endurance test method and conducts an endurance test for 3D TLC SSDs throughout their lifetime and analyzes the phenomena caused by the changes of SSD reliability data. We first present the endurance test flow, the data collection method and the introduction of SSD reliability data. Next, we analyze the data collected from the measurements and the results reveal some valuable phenomena about the changes in the reliability data for SSDs throughout their lifetime, some of which have not been provided by the existing research. We also conducted the correlation analysis for some SMART attributes. By analyzing the correlation coefficients between different values, we show some internal relationships between the SMART attributes of SSDs, which are helpful for understanding the characteristics of SSD failures.
The findings in this paper are helpful for performing the model analysis and parameter selection when building the SSD failure prediction model, which can improve the reliability of the storage services in a data center by reducing the risk of data loss. Furthermore, the analysis of SSD reliability changing trends and the corresponding correlation analysis can provide directions for the SSD flash translation layer design optimization. Although our work focuses on TLC NAND Flash, data are collected from real flash chips and we believe that the findings will also be applicable to the emerging 3D NAND technology.
Author Contributions
Conceptualization, Y.W. and X.D.; methodology, Y.W.; software, Y.W.; validation, Y.W. and X.D.; formal analysis, Y.W.; investigation, Y.W.; writing–original draft preparation, Y.W.; writing–review and editing, X.D., X.Z. and L.W.; funding acquisition, X.D.
Funding
This research was funded by the National Key Research and Development Plan of China under grant No. 2016YFB1000303.
Acknowledgments
Y.W. would like to thank Xiaoshe Dong, Xingjun Zhang, Longxiang Wang and Weiguo Wu, for their valuable advice and reviews of this paper.
Conflicts of Interest
The authors declare no conflict of interest.
Notation
| write amplification |
| NAND Writes |
| Host Writes |
| Pearson correlation coefficient |
| Spearman rank correlation coefficient |
| Kendall rank correlation coefficient |
Acronyms
| solid-state drives |
| terabytes written |
| program/erase |
| raw bit error rate |
| uncorrectable bit error rate |
| uncorrectable errors |
| self-monitoring, analysis and reporting technology |
References
- Hetzler, S. System Impacts of Hdd and Flash Reliability. In IDEMA Techn. Symp. 2008. Available online: http://www.idema.org/wpcontent/downloads/1918.pdf (accessed on 9 May 2008).
- Narayanan, I.; Wang, D.; Jeon, M.; Sharma, B.; Caulfield, L.; Sivasubramaniam, A.; Cutler, B.; Liu, J.; Khessib, B.; Vaid, K. SSD failures in datacenters: What? when? and why? In Proceedings of the 9th ACM International on Systems and Storage Conference (SYSTOR), Haifa, Israel, 6–8 June 2016; pp. 1–7. [Google Scholar]
- Meza, J.; Wu, Q.; Kumar, S.; Mutlu, O. A large-scale study of flash memory failures in the field. In Proceedings of the 2015 ACM SIGMETRICS International Conference on Measurement and Modeling of Computer Systems (SIGMETRICS), Portland, ON, USA, 15–19 June 2015; pp. 177–190. [Google Scholar]
- Schroeder, B.; Lagisetty, R.; Merchant, A. Flash reliability in production: The expected and the unexpected. In Proceedings of the 14th USENIX Conference on File and Storage Technologies (FAST), Santa Clara, CA, USA, 27 February–2 March 2016; pp. 67–80. [Google Scholar]
- Grupp, L.; Davis, J.; Swanson, S. The bleak future of nand flash memory. In Proceedings of the 10th USENIX Conference on File and Storage Technologies (FAST), San Jose, CA, USA, 14–17 February 2012. [Google Scholar]
- JEDEC Standard: Solid-State Drive (SSD) Requirements and Endurance Test Method: JESD 218B.01; JEDEC Solid State Technology Association: ARLINGTON, VA, USA, 2016.
- JEDEC Standard: Solid-State Drive (SSD) Endurance Workloads: JESD219A; JEDEC Solid State Technology Association: ARLINGTON, VA, USA, 2012.
- Cai, Y.; Haratsch, E.; Mutlu, O.; Mai, K. Error patterns in mlc nand flash memory: Measurement, characterization, and analysis. In Proceedings of the Design, Automation and Test in Europe Conference and Exhibition (DATE), Dresden, Germany, 12–16 March 2012; pp. 521–526. [Google Scholar]
- Cai, Y.; Mutlu, O.; Haratsch, E.; Mai, K. Program interference in mlc nand flash memory: Characterization, modeling, and mitigation. In Proceedings of the IEEE 31st International Conference on Computer Design (ICCD), Asheville, NC, USA, 6–9 October 2013; pp. 123–130. [Google Scholar]
- Cai, Y.; Luo, Y.; Haratsch, E.; Mai, K.; Mutlu, O. Data retention in mlc nand flash memory: Characterization, optimization, and recovery. In Proceedings of the IEEE 21st International Symposium on High Performance Computer Architecture (HPCA), Burlingame, CA, USA, 7–11 February 2015; pp. 551–563. [Google Scholar]
- Cai, Y.; Ghose, S.; Haratsch, E.; Luo, Y.; Mutlu, O. Error characterization, mitigation, and recovery in flash-memory-based solid-state drives. Proc. IEEE 2017, 9, 1666–1704. [Google Scholar] [CrossRef]
- Yamaga, Y.; Matsui, C.; Sakaki, Y.; Takeuchi, K. Reliability analysis of scaled nand flash memory based ssds with real workload characteristics by using real usage-based precise reliability test. IEICE Trans. Electron. 2018, 4, 243–252. [Google Scholar] [CrossRef]
- Mielke, N.; Frickey, R.; Kalastirsky, I.; Quan, M.; Ustinov, D.; Vasudevan, V. Reliability of solid-state drives based on nand flash memory. Proc. IEEE 2017, 9, 1725–1750. [Google Scholar] [CrossRef]
- Cai, Y.; Luo, Y.; Ghose, S.; Mutlu, O. Read disturb errors in mlc nand flash memory: Characterization, mitigation, and recovery. In Proceedings of the 2015 45th Annual IEEE/IFIP International Conference on Dependable Systems and Networks (DSN), Rio de Janeiro, Brazil, 22–25 June 2015; pp. 438–449. [Google Scholar]
- Papandreou, N.; Parnell, T.; Pozidis, H.; Mittelholzer, T.; Eleftheriou, E.; Camp, C.; Griffin, T.; Tressler, G.; Walls, A. Using adaptive read voltage thresholds to enhance the reliability of mlc nand flash memory systems. In Proceedings of the 24th Edition of the Great Lakes Symposium on VLSI (GLSVLSI), Houston, TX, USA, 21–23 May 2014; pp. 151–156. [Google Scholar]
- Liu, C.; Chang, Y.; Chang, Y. Read leveling for flash storage systems. In Proceedings of the 8th ACM International Systems and Storage Conference (SYSTOR), Haifa, Israel, 26–28 May 2015; pp. 1–5. [Google Scholar]
- Zhu, Y.; Wu, F.; Xiong, Q.; Lu, Z.; Xie, C. Alarm: A locationaware redistribution method to improve 3d fg nand flash reliability. In Proceedings of the International Conference on Networking, Architecture, and Storage (NAS), Shenzhen, China, 7–9 August 2017; pp. 1–10. [Google Scholar]
- Cai, Y.; Yalcin, G.; Mutlu, O.; Haratsch, E.; Unsal, O.; Cristal, A.; Mai, K. Neighbor-cell assisted error correction for mlc nand flash memories. In Proceedings of the 2014 ACM International Conference on Measurement and Modeling of Computer Systems (SIGMETRICS), Austin, TX, USA, 16–20 June 2014; pp. 491–504. [Google Scholar]
- Cai, Y.; Yalcin, G.; Mutlu, O.; Haratsch, E.; Cristal, A.; Unsal, O.; Mai, K. Flash correct-and-refresh: Retention-aware error management for increased flash memory lifetime. In Proceedings of the IEEE 30th International Conference on Computer Design (ICCD), Montreal, QC, Canada, 30 September–3 October 2012; pp. 94–101. [Google Scholar]
- Zheng, M.; Tucek, J.; Qin, F.; Lillibridge, M. Understanding the robustness of ssds under power fault. In Proceedings of the 11th USENIX Conference on File and Storage Technologies (FAST), San Jose, CA, USA, 12–15 February 2013; pp. 271–284. [Google Scholar]
- Zheng, M.; Tucek, J.; Qin, F.; Lillibridge, M.; Zhao, B.; Yang, E. Reliability analysis of ssds under power fault. ACM Trans. Comput. Syst. 2017, 4, 1–28. [Google Scholar] [CrossRef]
- Schroeder, B.; Merchant, A.; Lagisetty, R. Reliability of nand-based ssds: What field studies tell us. Proc. IEEE 2017, 9, 1751–1769. [Google Scholar] [CrossRef]
- Cai, Y.; Ghose, S.; Luo, Y.; Mai, K.; Mutlu, O.; Haratsch, E. Vulnerabilities in mlc nand flash memory programming: experimental analysis, exploits, and mitigation techniques. In Proceedings of the IEEE International Symposium on High Performance Computer Architecture (HPCA), Austin, TX, USA, 4–8 February 2017; pp. 49–60. [Google Scholar]
- Im, J.; Jeong, W.; Kim, D.; Nam, S.; Shim, D.; Choi, M.; Yoon, H.; Kim, D.; Kim, Y.; Park, H.; et al. 7.2 a 128gb 3b/cell v-nand flash memory with 1gb/s i/o rate. In Proceedings of the IEEE International Solid-State Circuits Conference (ISSCC), San Francisco, CA, USA, 22–26 February 2015; pp. 1–3. [Google Scholar]
- Kang, D.; Jeong, W.; Kim, C.; Kim, D.; Cho, Y.; Kang, K.; Ryu, J.; Kang, K.; Lee, S. 256 gb 3 b/cell v-nand flash memory with 48 stacked wl layers. IEEE J. Solid-State Circuits 2017, 1, 210–217. [Google Scholar] [CrossRef]
- Micheloni, R.; Aritome, S.; Crippa, L. Array architectures for 3-d nand flash memories. Proc. IEEE 2017, 9, 1634–1649. [Google Scholar] [CrossRef]
- Park, K.; Nam, S.; Kim, D.; Kwak, P.; Lee, D.; Choi, Y.; Choi, M.; Kwak, D.; Kim, D.; Kim, M.; et al. Three-dimensional 128 gb mlc vertical nand flash memory with 24-wl stacked layers and 50 mb/s high-speed programming. IEEE J. Solid-State Circuits 2015, 1, 204–213. [Google Scholar] [CrossRef]
- Kim, C.; Cho, J.; Jeong, W.; Park, I.; Park, H.; Kim, D.; Kang, D.; Lee, S.; Lee, J.; Kim, W.; et al. 11.4 A 512Gb 3b/cell 64-stacked WL 3D V-NAND flash memory. In Proceedings of the IEEE International Solid-State Circuits Conference (ISSCC), San Francisco, CA, USA, 5–9 February 2017; pp. 202–203. [Google Scholar]
- Tanaka, T.; Helm, M.; Vali, T.; Ghodsi, R.; Kawai, K.; Park, J.; Yamada, S.; Pan, F.; Einaga, Y.; Ghalam, A.; et al. 7.7 A 768Gb 3b/cell 3D-floating-gate NAND flash memory. In Proceedings of the IEEE International Solid-State Circuits Conference (ISSCC), San Francisco, CA, USA, 31 January–4 February 2016; pp. 142–144. [Google Scholar]
- Micheloni, R.; Crippa, L. 3D Stacked NAND Flash Memories. In 3D Flash Memories; Micheloni, R., Ed.; Publishing House: Dordrecht, The Netherlands, 2016; pp. 63–83. [Google Scholar]
- Katsumata, R.; Kito, M.; Fukuzumi, Y.; Kido, M.; Tanaka, H.; Komori, Y.; Ishiduki, M.; Matsunami, J.; Fujiwara, T.; Nagata, Y.; et al. Pipe-shaped BiCS flash memory with 16 stacked layers and multi-level-cell operation for ultra high density storage devices. In Proceedings of the Symposium on VLSI Technology, Honolulu, HI, USA, 15–17 June 2009; pp. 136–137. [Google Scholar]
- Lue, H.; Hsu, T.; Hsiao, Y.; Hong, S.; Wu, M.; Hsu, F.; Lien, N.; Wang, S.; Hsieh, J.; Yang, L.; et al. A highly scalable 8-layer 3D vertical-gate (VG) TFT NAND Flash using junction-free buried channel BE-SONOS device. In Proceedings of the Symposium on VLSI Technology, Honolulu, HI, USA, 15–17 June 2010; pp. 131–132. [Google Scholar]
- Whang, S.; Lee, K.; Shin, D.; Kim, B.; Kim, M.; Bin, J.; Han, J.; Kim, S.; Lee, B.; Jung, Y.; et al. Novel 3-dimensional Dual Control-gate with Surrounding Floating-gate (DC-SF) NAND flash cell for 1Tb file storage application. In Proceedings of the International Electron Devices Meeting (IEDM), San Francisco, CA, USA, 6–8 December 2010; pp. 1–4. [Google Scholar]
- Compagnoni, C.; Goda, A.; Spinelli, A.; Feeley, P.; Lacaita, A.; Visconti, A. Reviewing the Evolution of the NAND Flash Technology. Proc. IEEE 2017, 9, 1609–1633. [Google Scholar] [CrossRef]
- Parat, K.; Dennison, C. A floating gate based 3D NAND technology with CMOS under array. In Proceedings of the IEEE International Electron Devices Meeting (IEDM), Washington, DC, USA, 7–9 December 2015; pp. 1–4. [Google Scholar]
- Venkatesan, S.; Aoulaichem, M. Overview of 3D NAND Technologies and Outlook Invited Paper. In Proceedings of the Non-Volatile Memory Technology Symposium (NVMTS), Sendai, Japan, 22–24 October 2018; pp. 1–5. [Google Scholar]
- Xiong, Q.; Wu, F.; Lu, Z.; Zhu, Y.; Zhou, Y.; Chu, Y.; Xie, C.; Huang, P. Characterizing 3d floating gate nand flash: Observations, analyses, and implications. ACM Trans. Storage 2018, 2, 1–31. [Google Scholar] [CrossRef]
- Spinelli, A.; Compagnoni, C.; Lacaita, A. Reliability of NAND Flash Memories: Planar Cells and Emerging Issues in 3D Devices. Computers 2017, 2, 16. [Google Scholar] [CrossRef]
- Seo, M.; Lee, B.; Park, S.; Endoh, T. Novel Concept of the Three-Dimensional Vertical FG nand Flash Memory Using the Separated-Sidewall Control Gate. IEEE Trans. Electron. Devices 2012, 8, 2078–2084. [Google Scholar] [CrossRef]
- Ma, R.; Wu, F.; Zhang, M.; Lu, Z.; Wan, J.; Xie, C. RBER-Aware Lifetime Prediction Scheme for 3D-TLC NAND Flash Memory. IEEE Access 2019, 7, 696–708. [Google Scholar] [CrossRef]
- Tanzawa, T. Design considerations on power, performance, reliability and yield in 3d nand technology. IEICE Trans. Electron. 2018, 1, 78–81. [Google Scholar] [CrossRef]
- Luo, Y.; Ghose, S.; Cai, Y.; Haratsch, E.; Mutlu, O. Heatwatch: Improving 3d nand flash memory device reliability by exploiting selfrecovery and temperature awareness. In Proceedings of the IEEE International Symposium on High Performance Computer Architecture (HPCA), Vienna, Austria, 24–28 February 2018; pp. 504–517. [Google Scholar]
- Katcher, J. Postmark: A New File System Benchmark Technical Report; NetApp: Sunnyvale, CA, USA, 1997. [Google Scholar]
- Allen, B. Monitoring hard disks with smart. Linux J. 2004, 117, 74–77. [Google Scholar]
- Basak, J.; Wadhwani, K.; Voruganti, K. Storage workload identification. ACM Trans. Storage 2016, 3, 1–14. [Google Scholar] [CrossRef]
- MathWorks Documentation R2019a. Available online: https://ww2.mathworks.cn/help/stats/corr.html (accessed on 12 March 2006).
© 2019 by the authors. Licensee MDPI, Basel, Switzerland. This article is an open access article distributed under the terms and conditions of the Creative Commons Attribution (CC BY) license (http://creativecommons.org/licenses/by/4.0/).


