A Prototype Photoplethysmography Electronic Device that Distinguishes Congestive Heart Failure from Healthy Individuals by Applying Natural Time Analysis

 ,
,  ,
,  ,
,  , ,
, ,
Abstract
1. Introduction
2. Materials and Methods
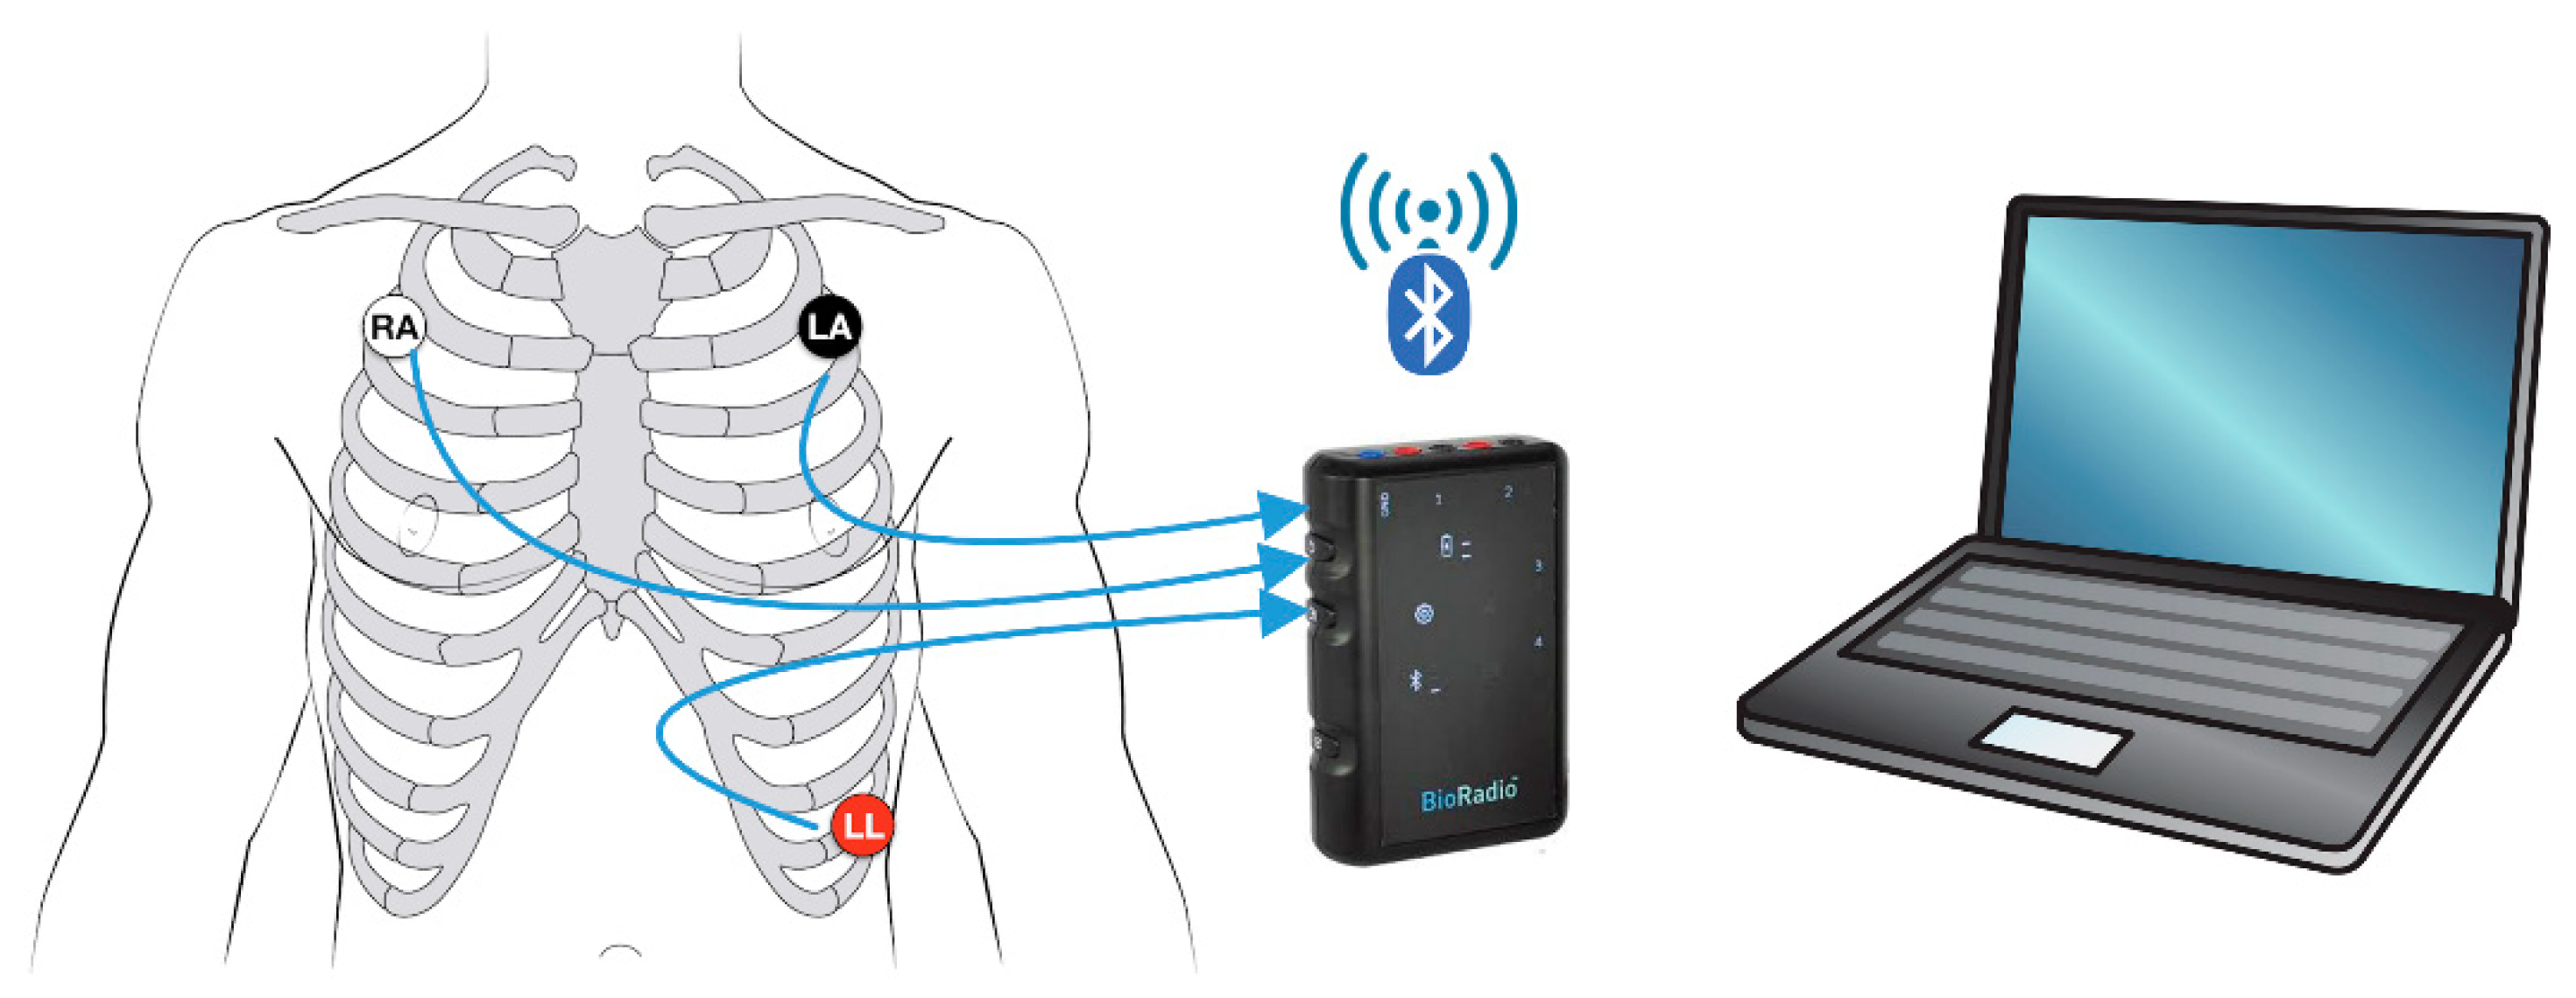
2.1. Conventional ECG System
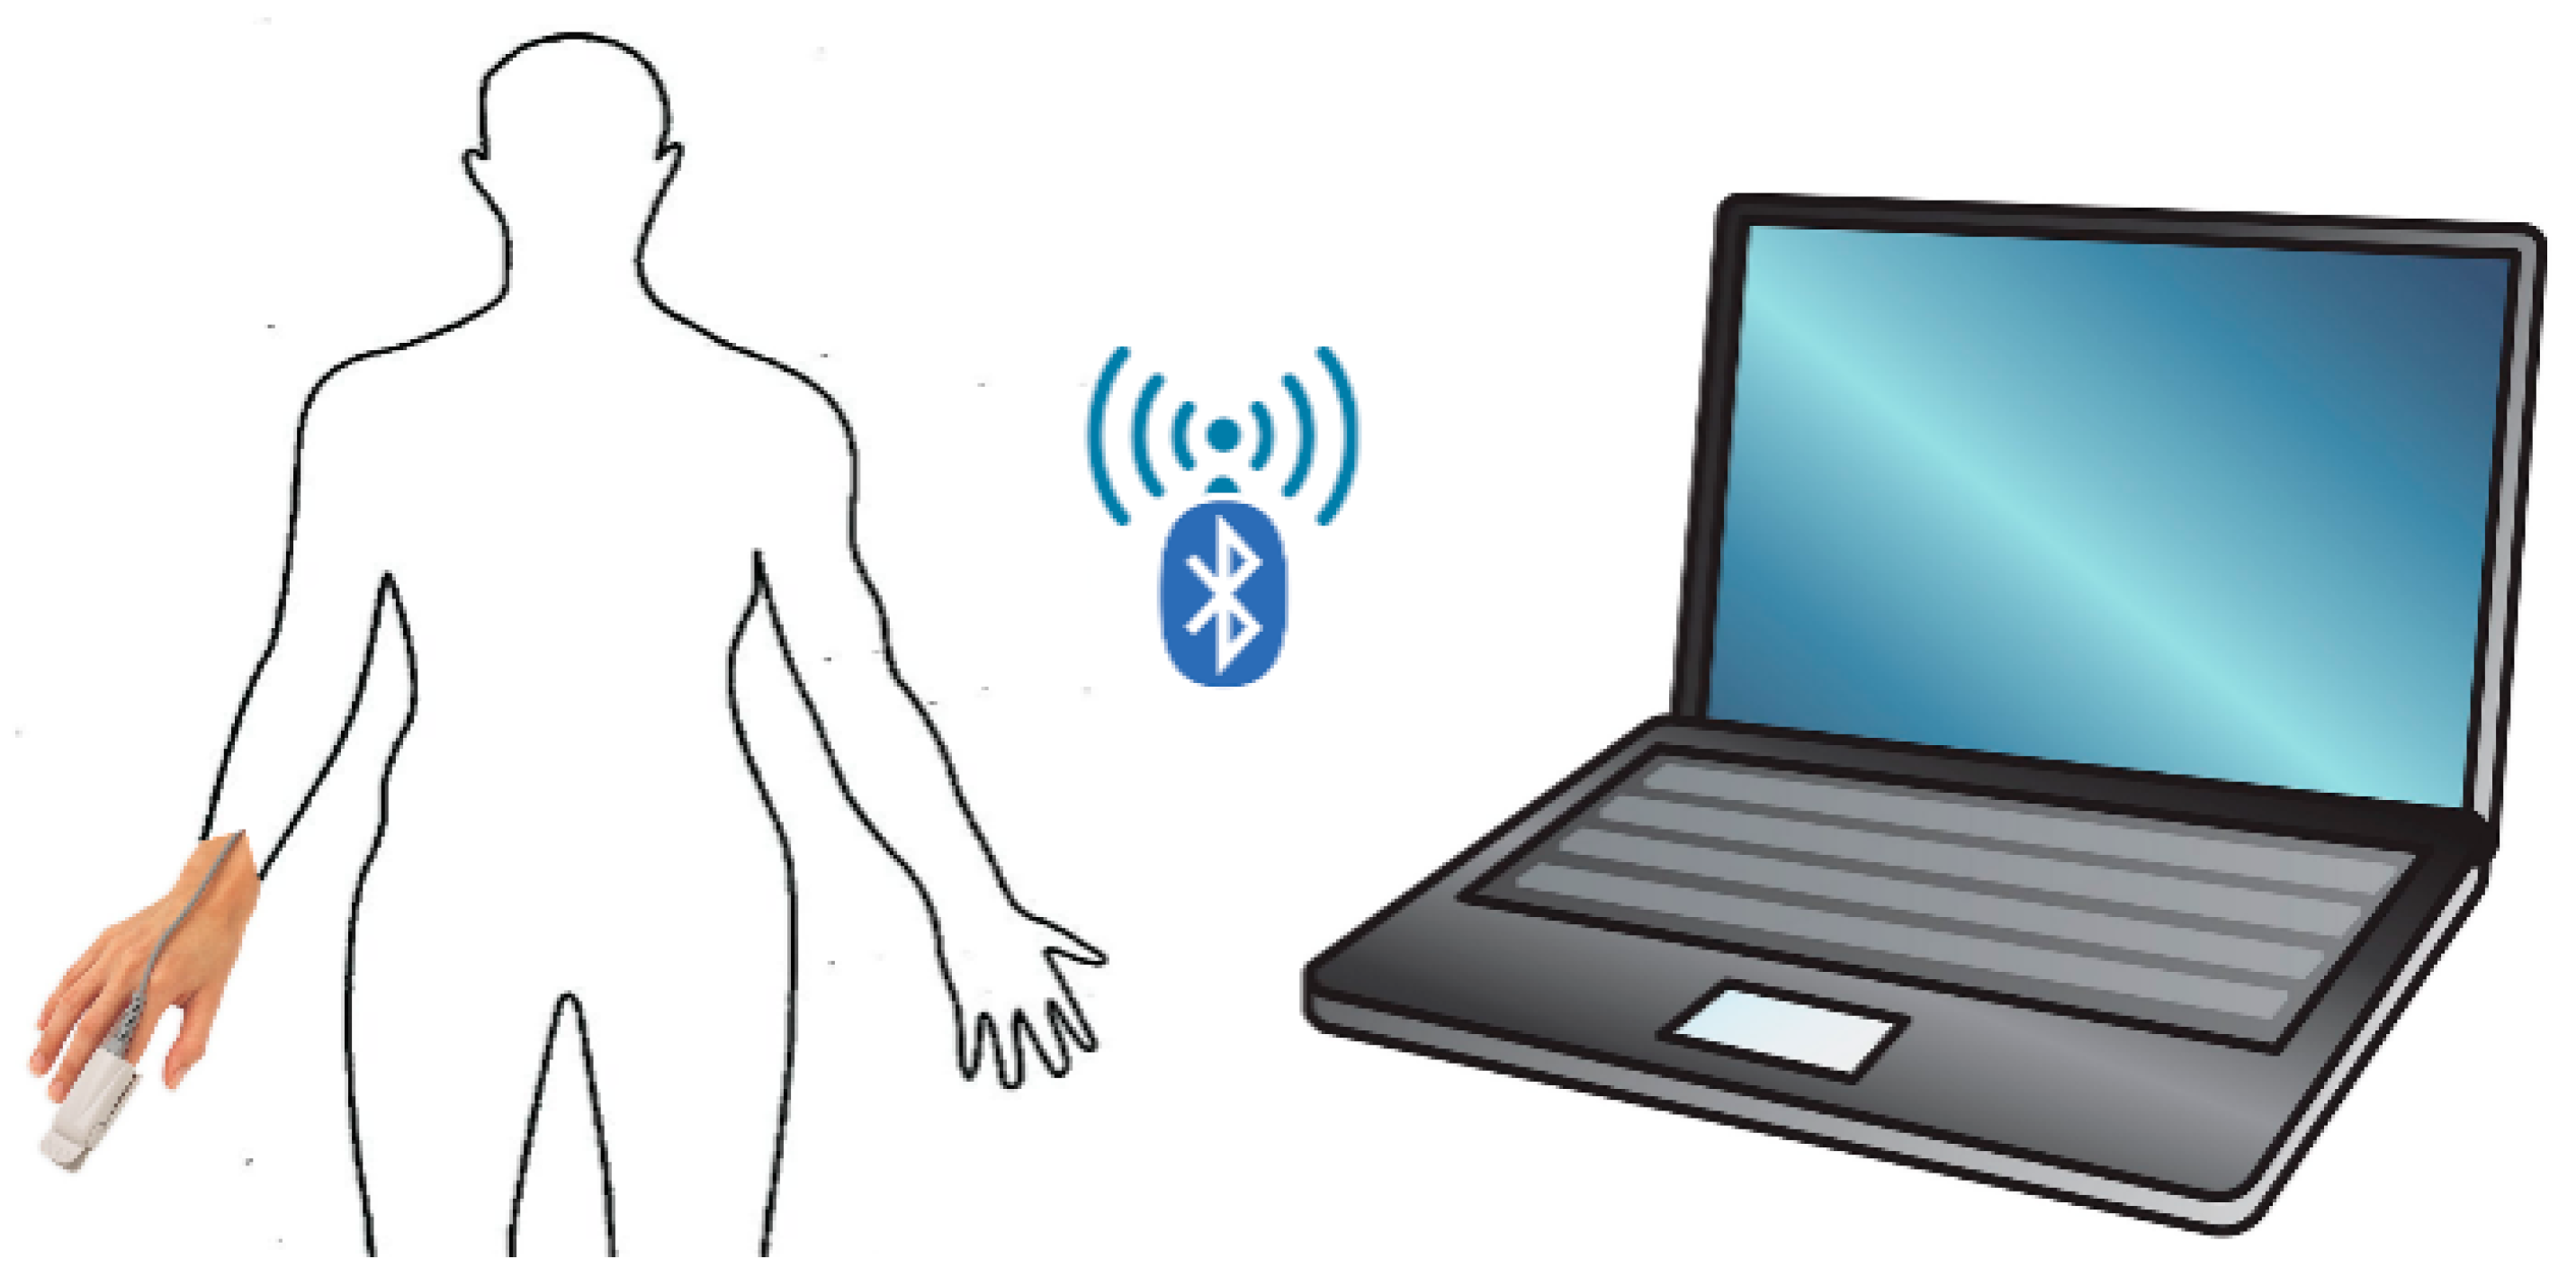
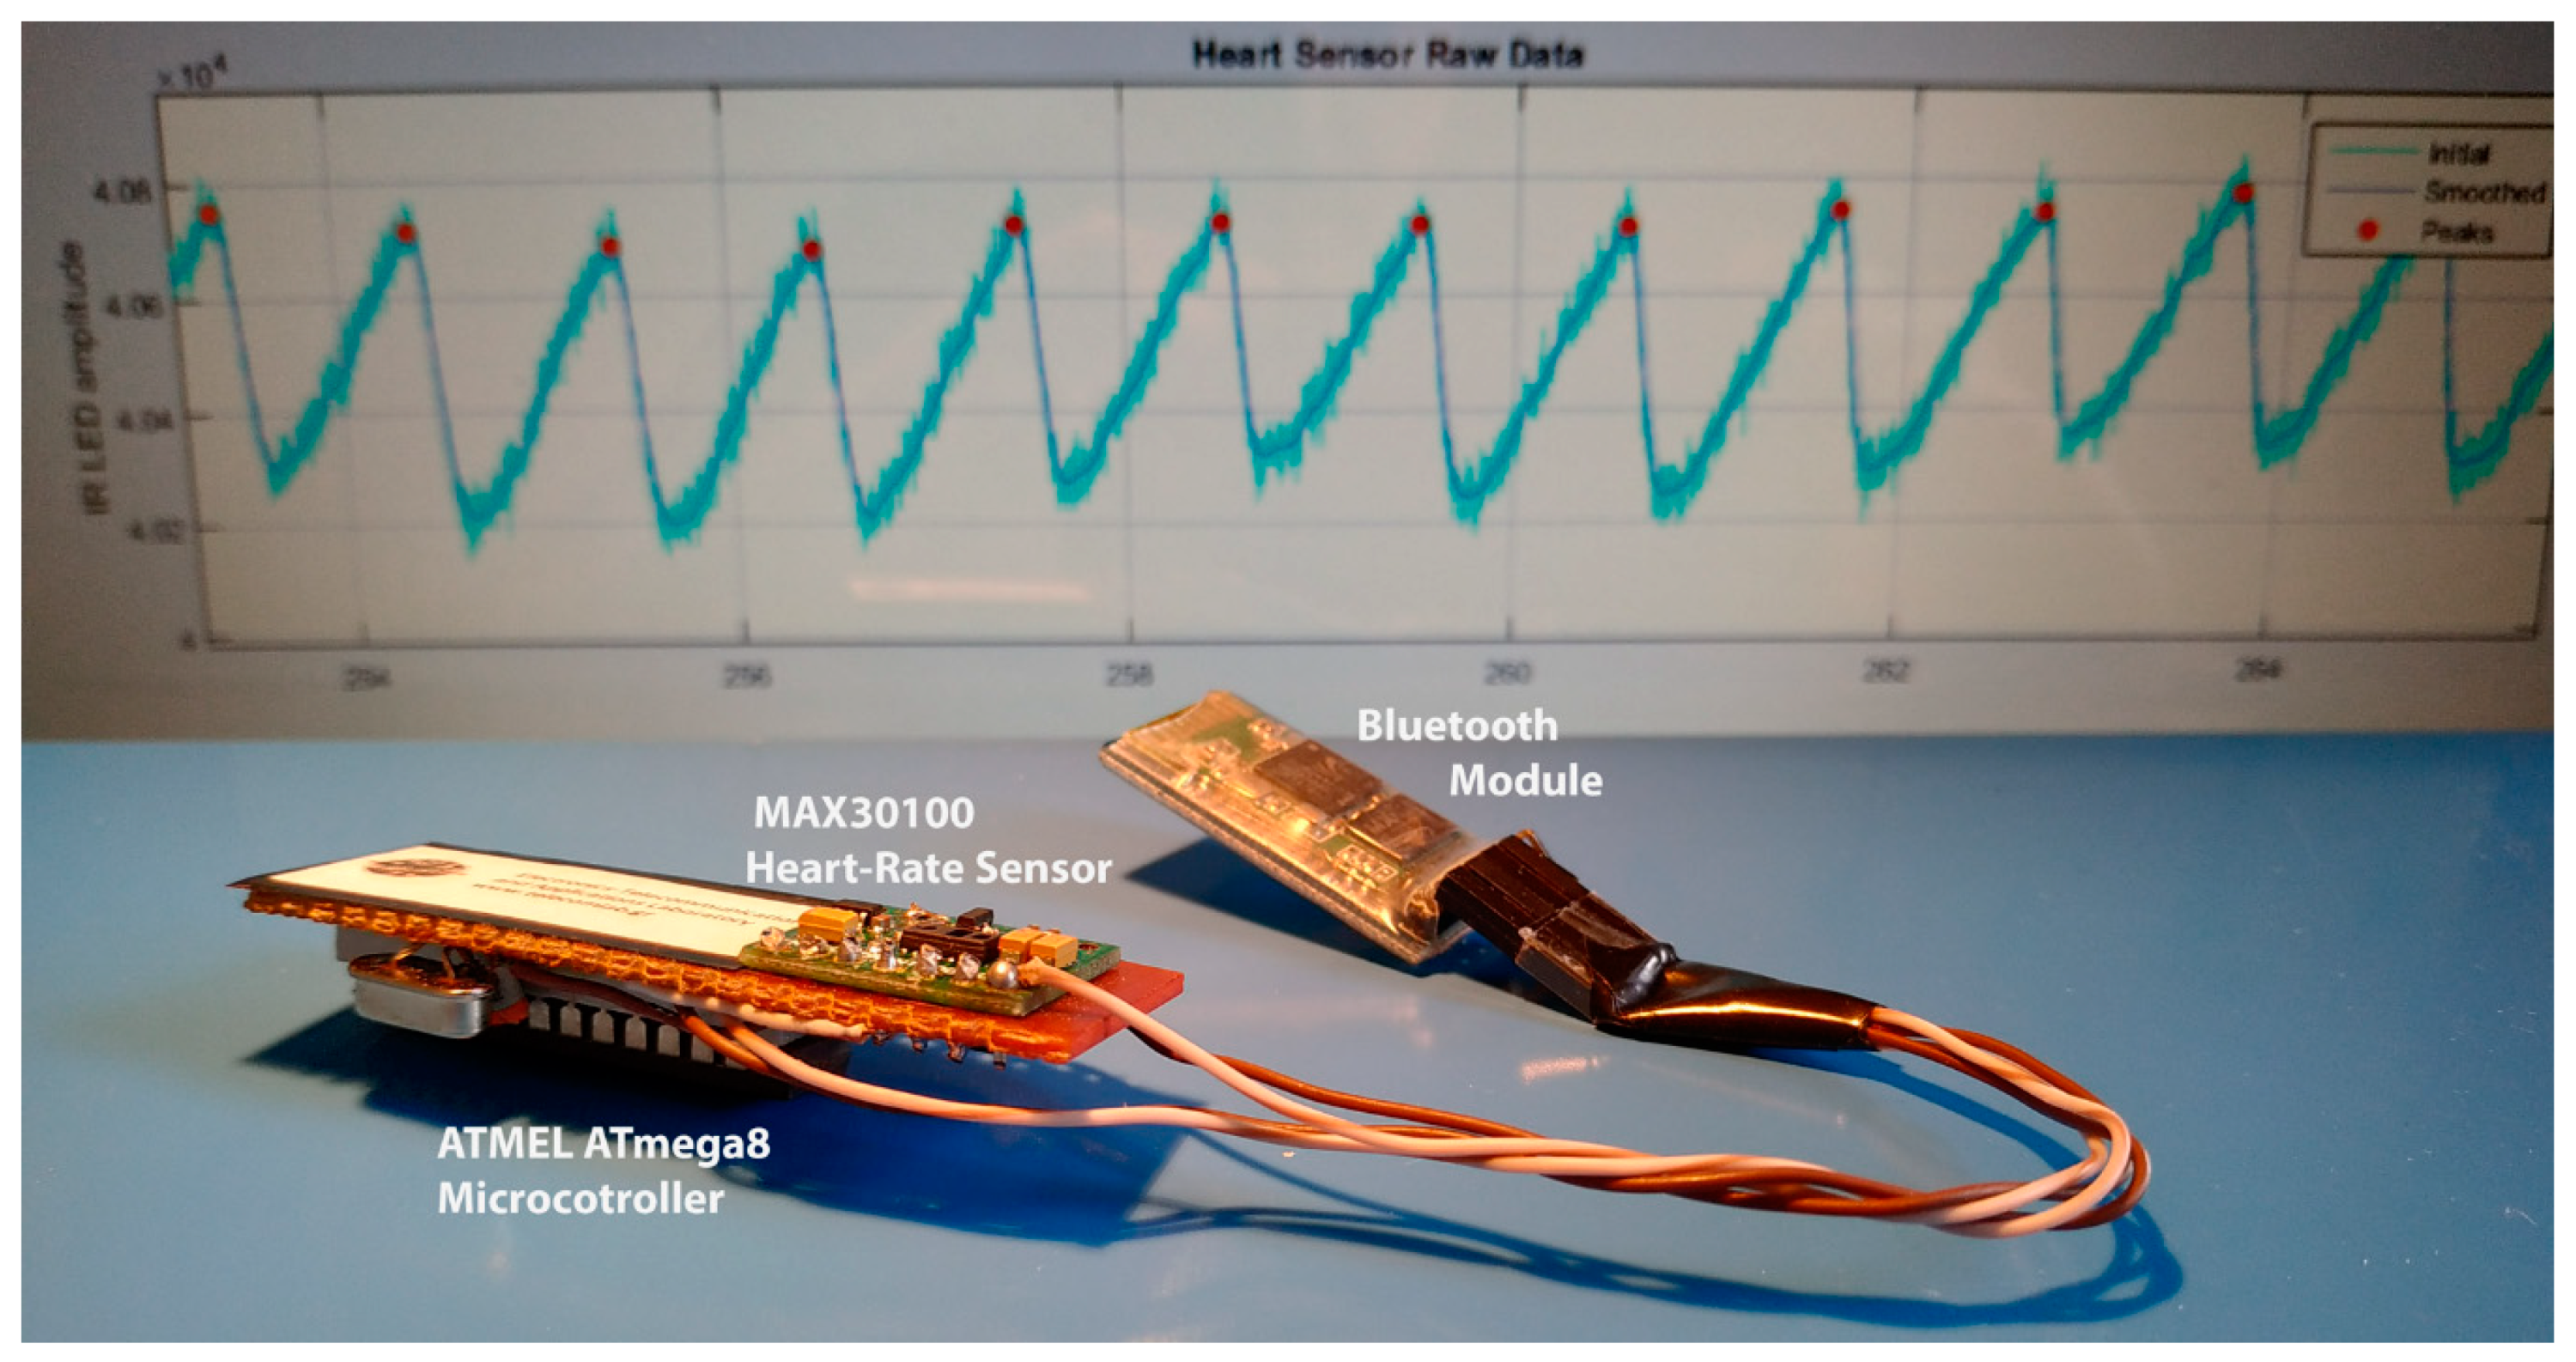
2.2. Prototype PPG System
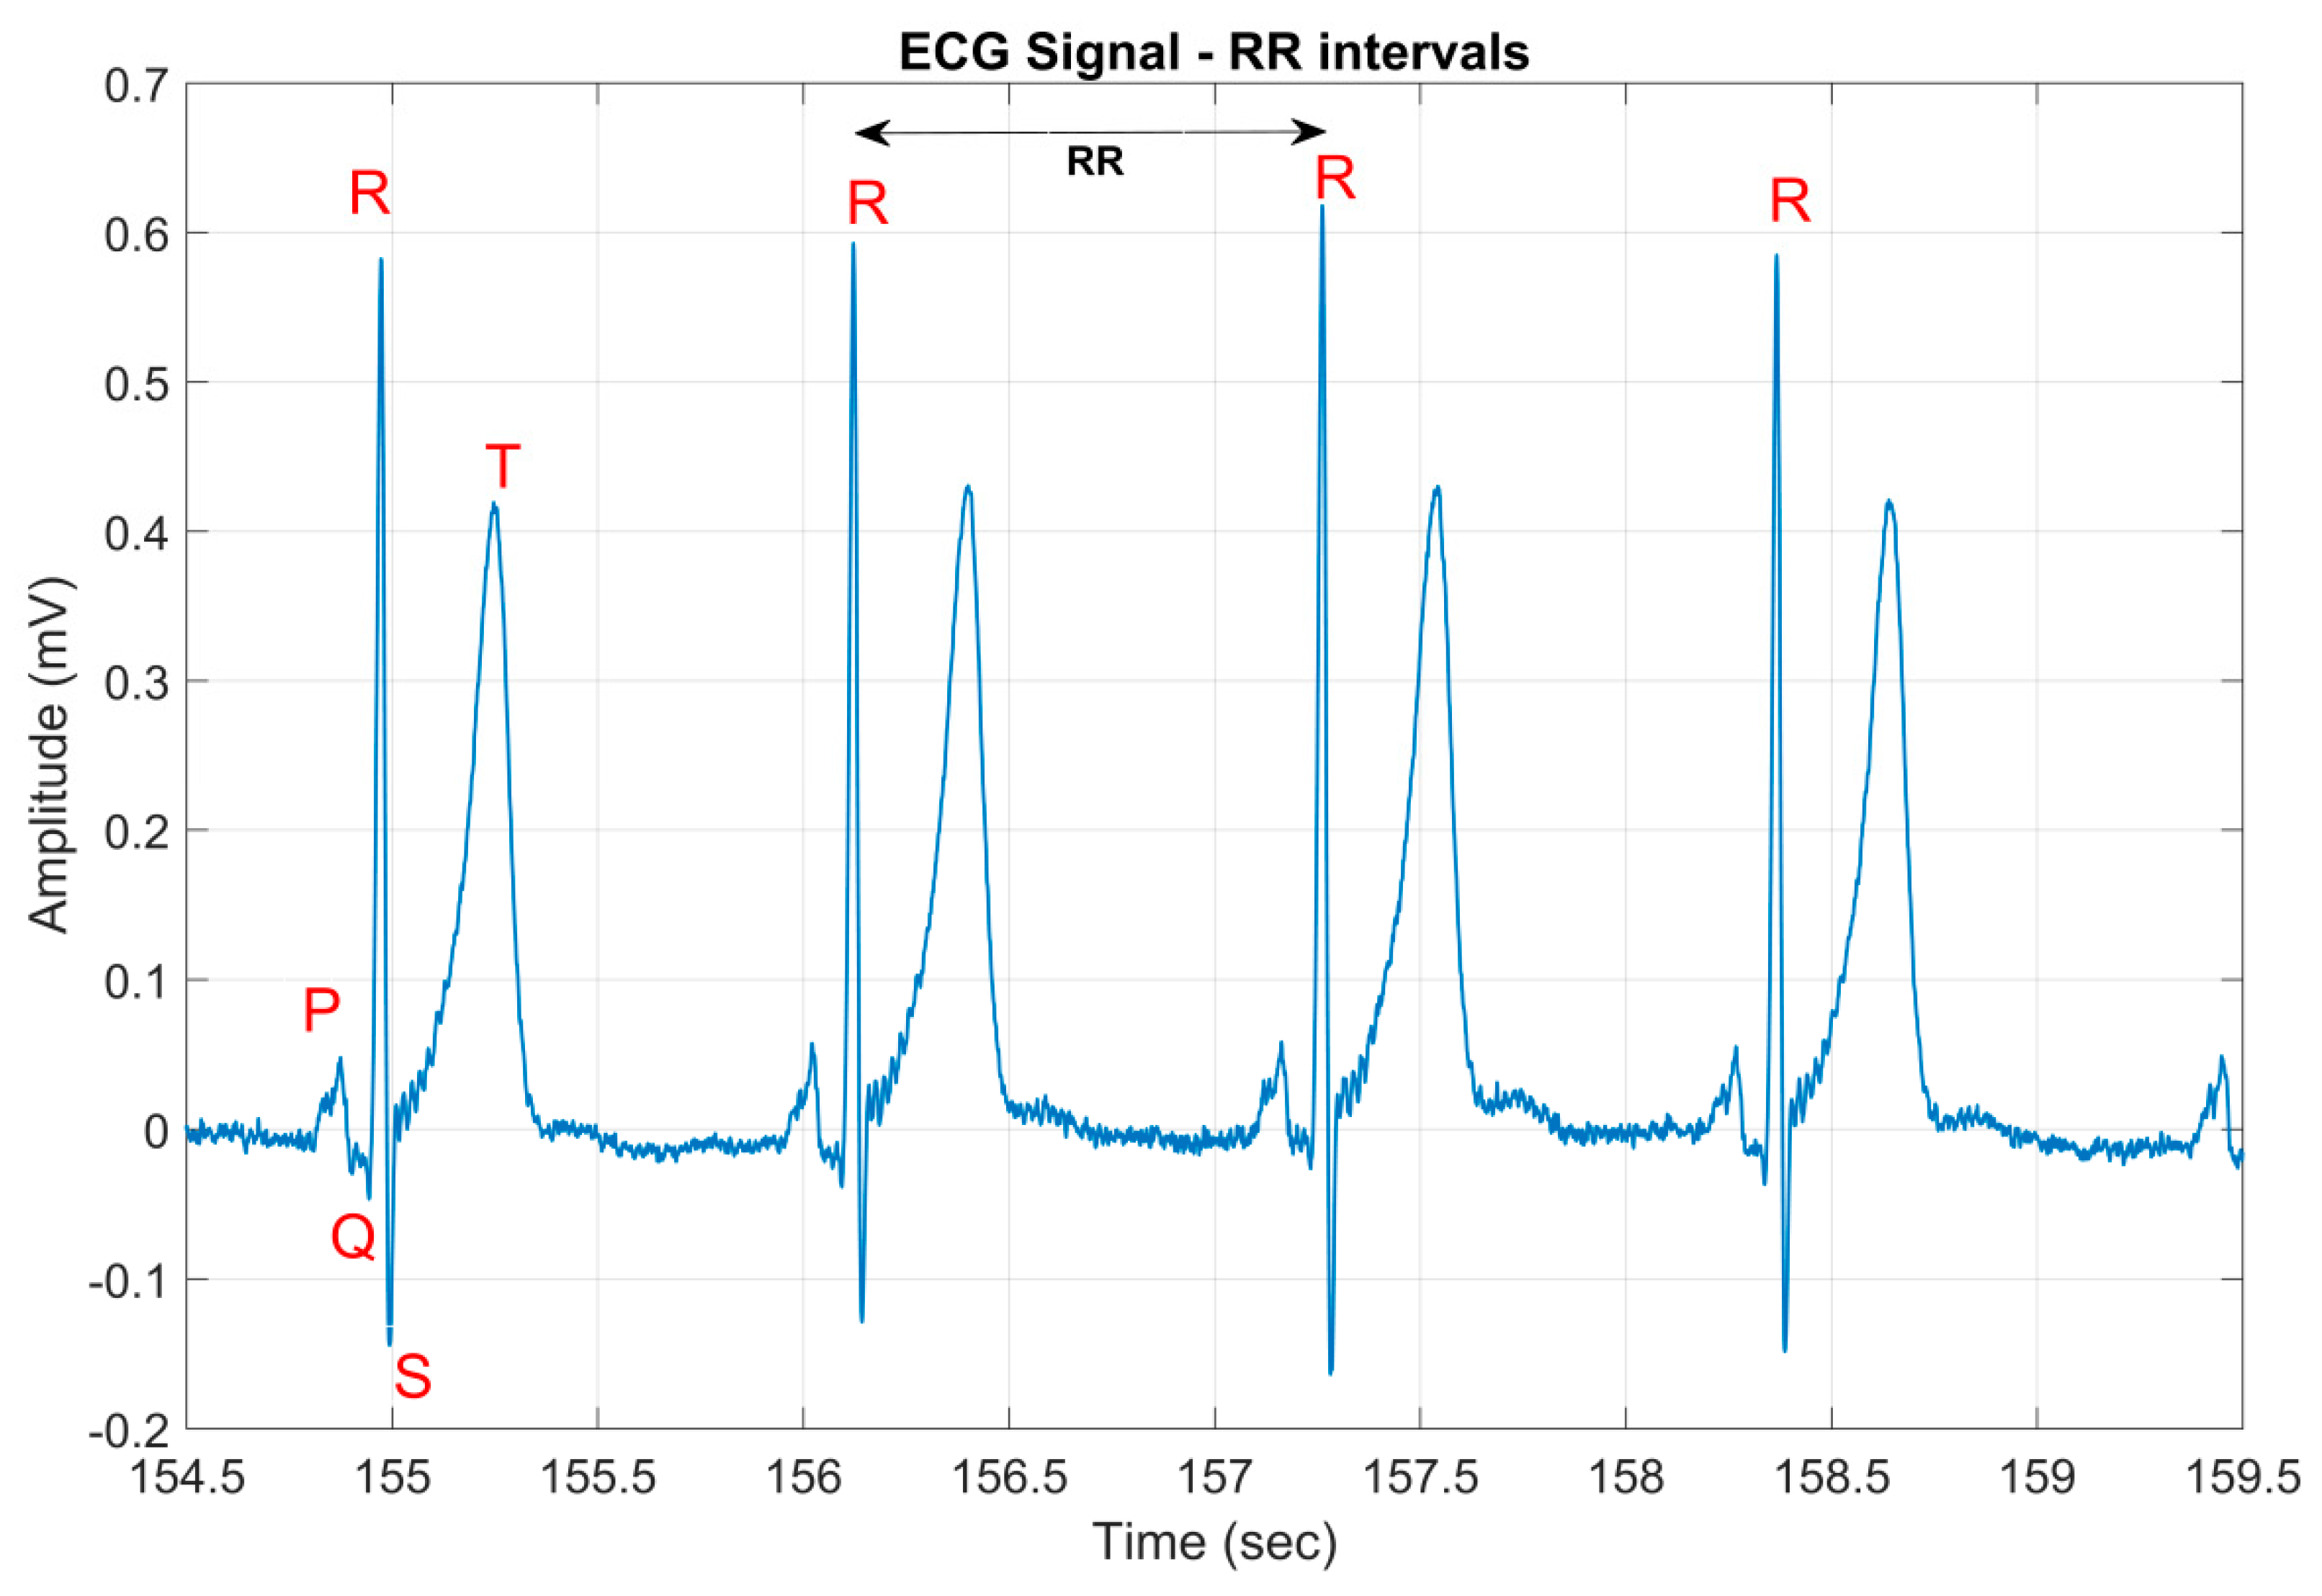
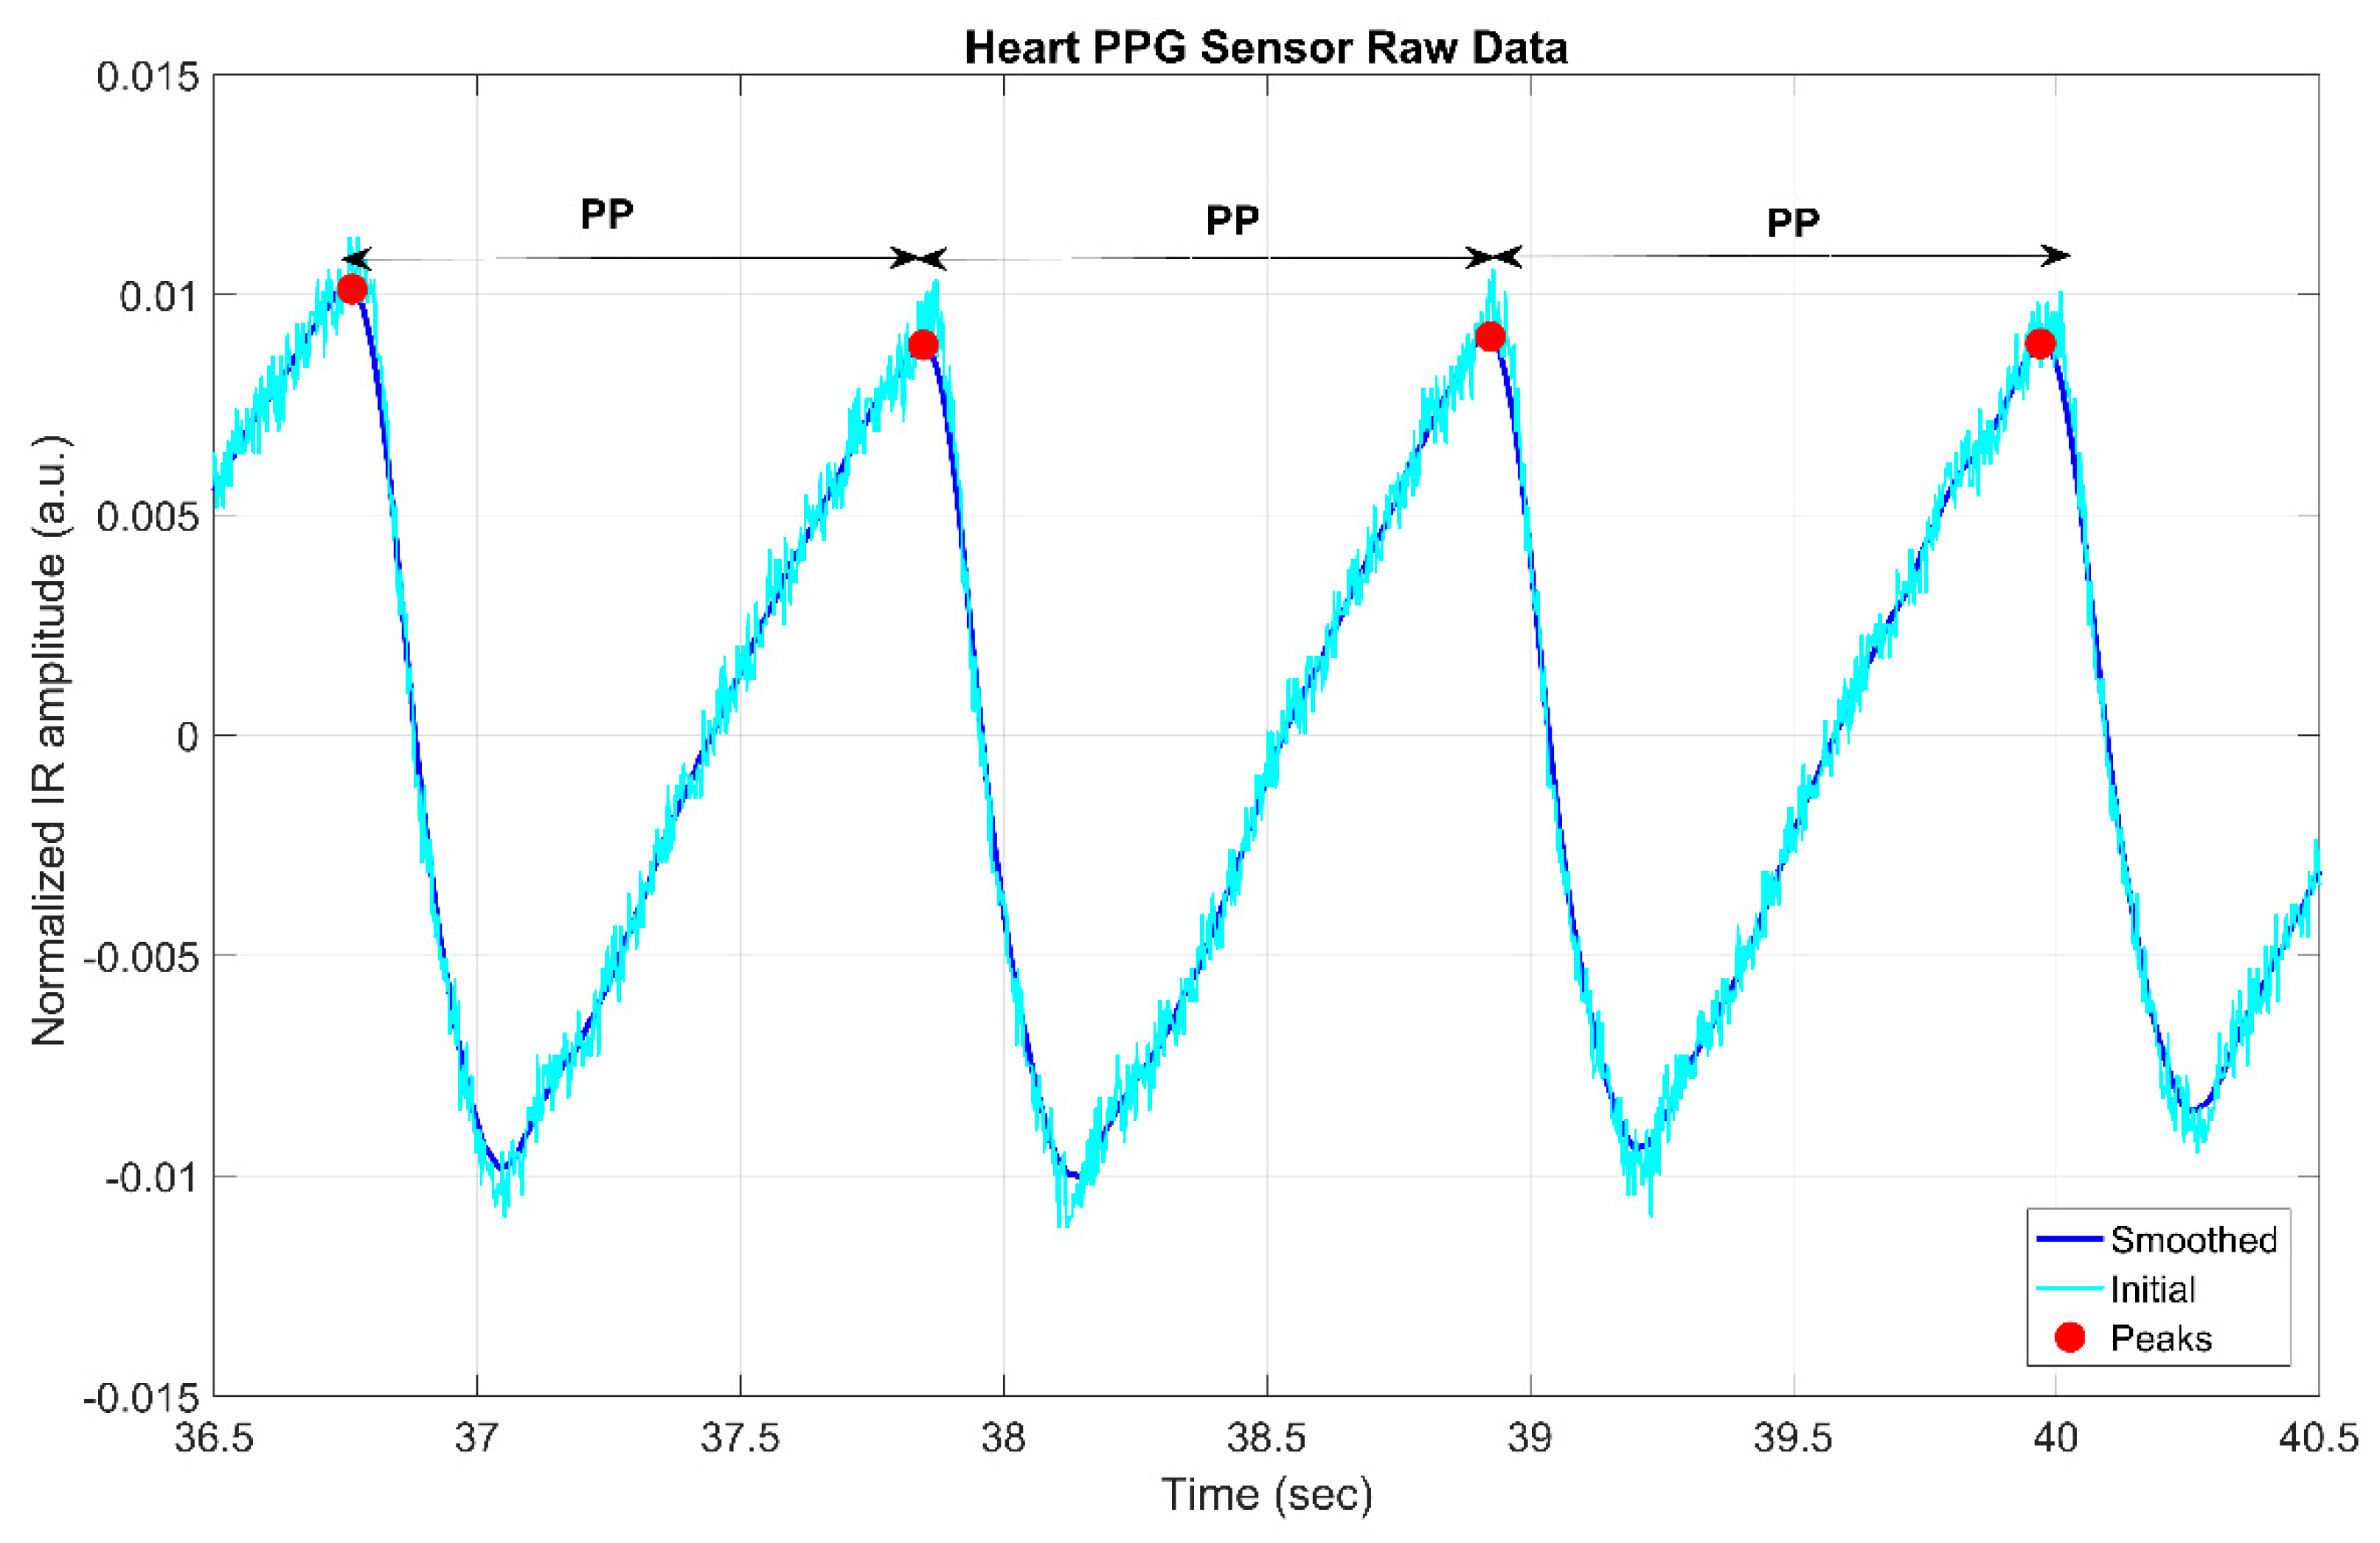
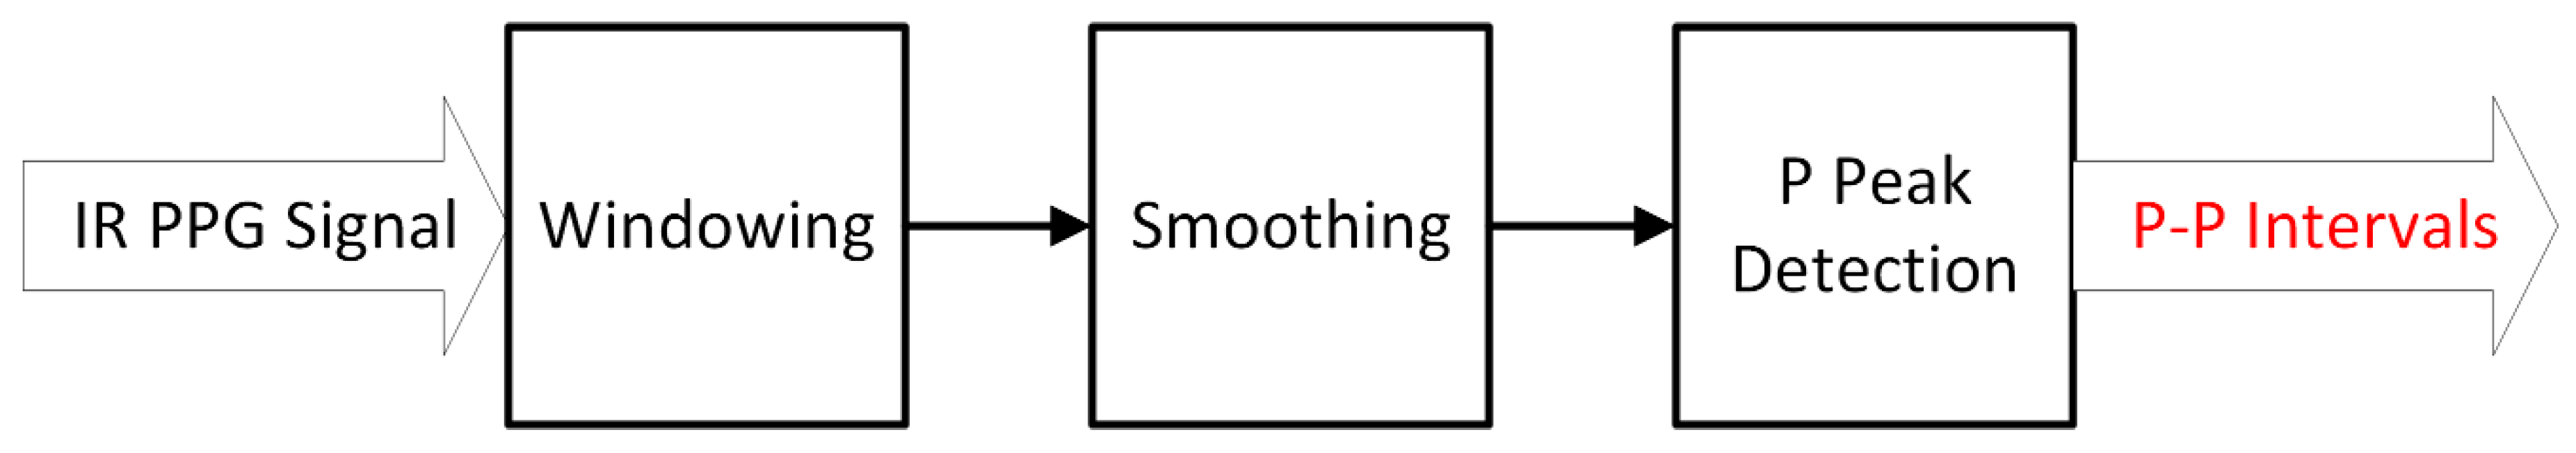
2.3. Signal Processing
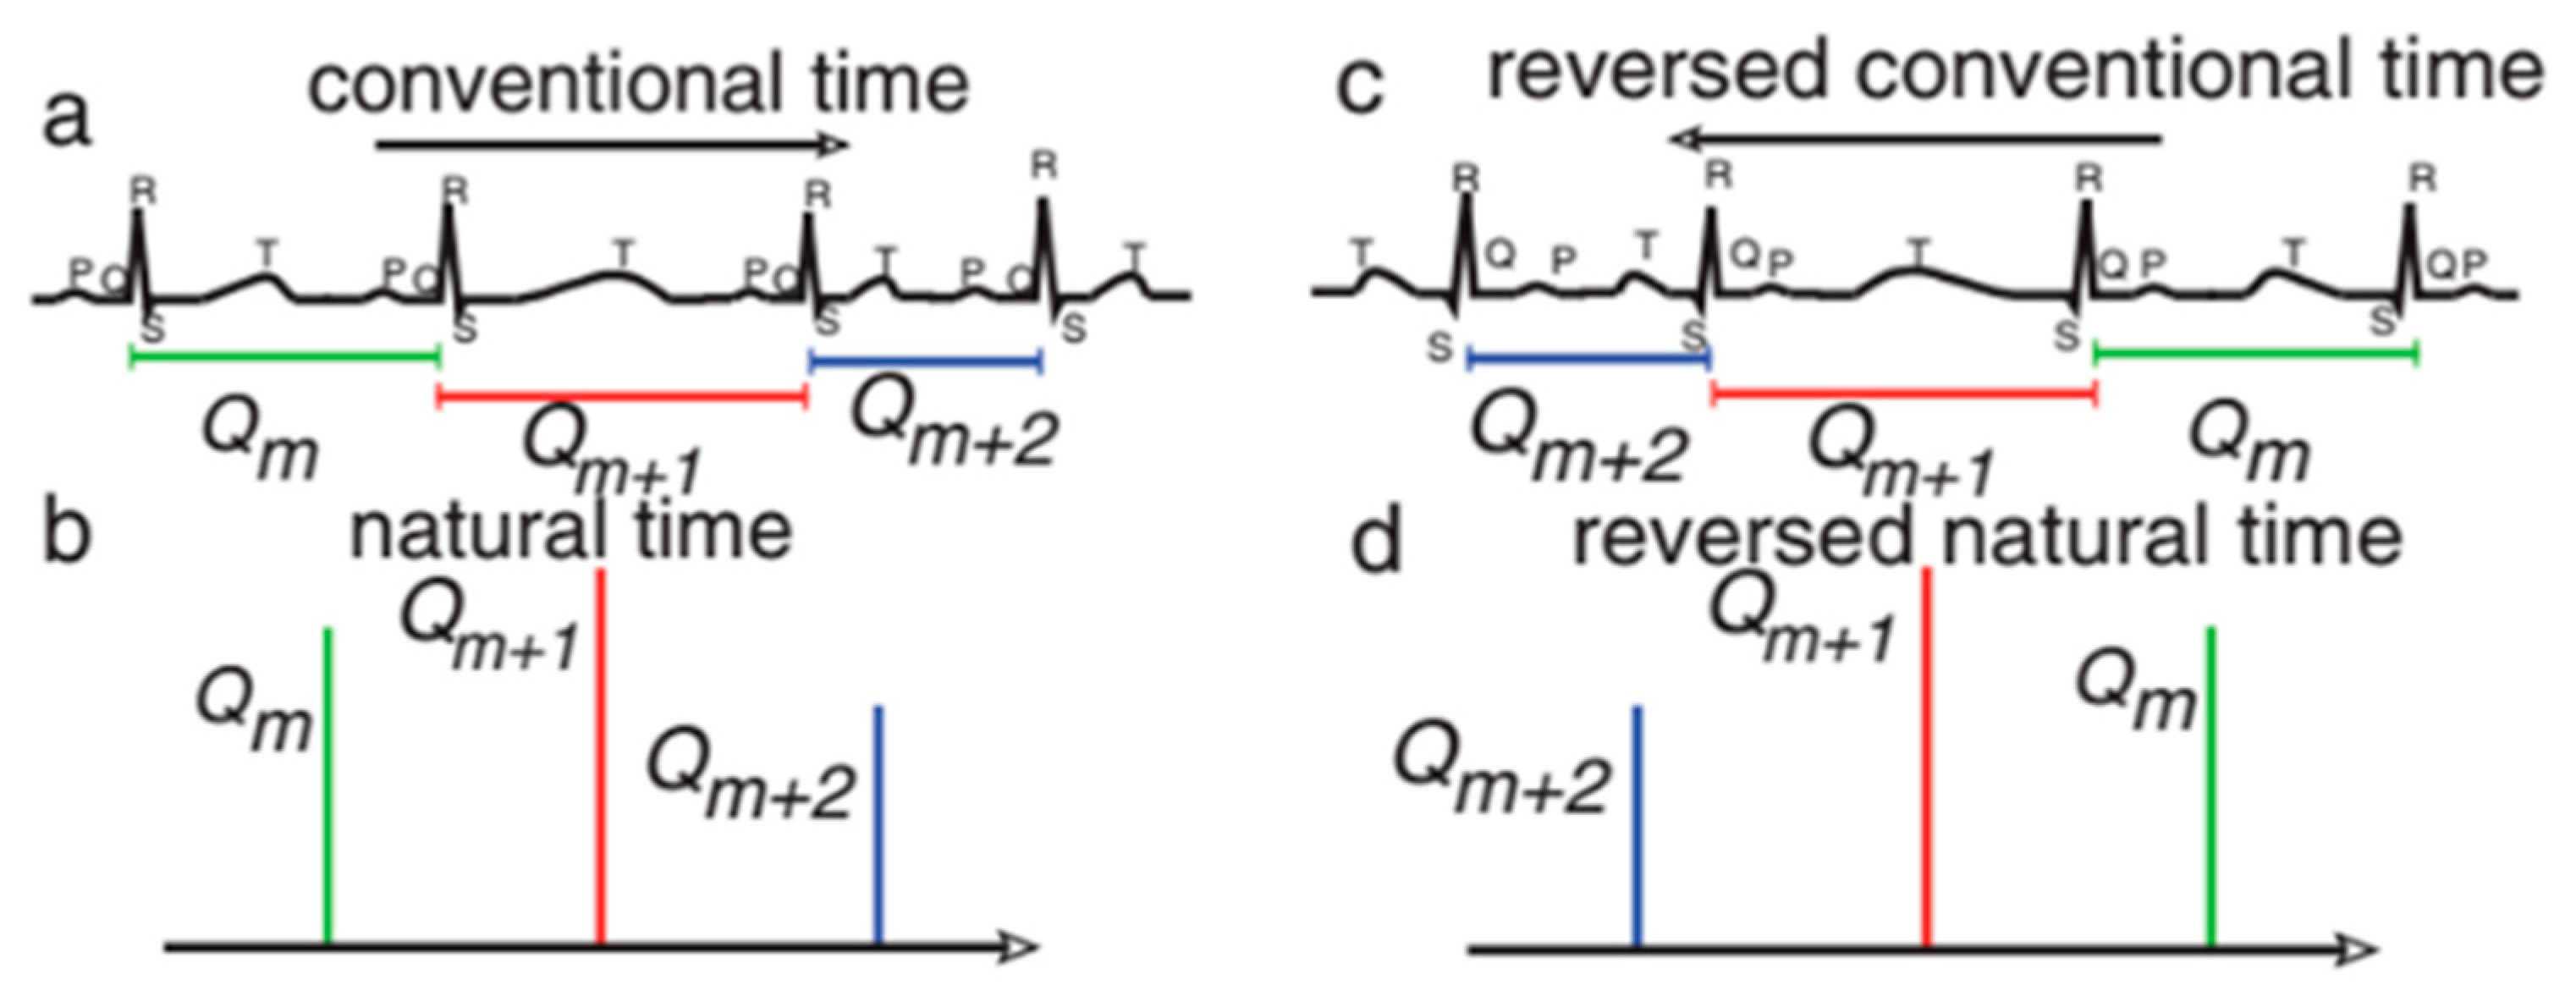
2.4. Natural Time Analysis
2.5. Clinical Study Protocol—Data Collection
2.6. Receiver Operating Characteristics (ROC) Method
2.7. Support Vector Machines (SVM)
3. Results
4. Discussion and Conclusions
Author Contributions
Funding
Conflicts of Interest
References
- Allen, J. Photoplethysmography and its application in clinical physiological measurement. Physiol. Meas. 2007, 28, R1–R39. [Google Scholar] [CrossRef] [PubMed]
- Tamura, T.; Maeda, Y.; Sekine, M.; Yoshida, M. Wearable Photoplethysmographic Sensors—Past and Present. Electronics 2014, 3, 282–302. [Google Scholar] [CrossRef]
- Park, S.; Jayaraman, S. Enhancing the Quality of Life Through Wearable Technology. IEEE Eng. Med. Biol. Mag. 2003, 22, 41–48. [Google Scholar] [CrossRef] [PubMed]
- Elgendi, M. On the Analysis of Fingertip Photoplethysmogram Signals. Curr. Cardiol. Rev. 2012, 8, 14–25. [Google Scholar] [CrossRef] [PubMed]
- Savarese, G.; Lund, L.H. Global Public Health Burden of Heart Failure. Card. Fail. Rev. 2017, 3, 7–11. [Google Scholar] [CrossRef]
- Giannitsi, S.; Bougiakli, M.; Bechlioulis, A.; Naka, K. Endothelial dysfunction and heart failure: A review of the existing bibliography with emphasis on flow mediated dilation. JRSM Cardiovasc. Dis. 2019, 8, 2048004019843047. [Google Scholar] [CrossRef]
- Han, J.; Trumble, D.R. Cardiac Assist Devices: Early Concepts, Current Technologies, and Future Innovations. Bioengineering 2019, 6, 18. [Google Scholar] [CrossRef]
- Ponikowski, P.; Voors, A.A.; Anker, S.D.; Bueno, H.; Cleland, J.G.F.; Coats, A.J.S.; Falk, V.; González-Juanatey, J.R.; Harjola, V.P.; Jankowska, E.A.; et al. 2016 ESC Guidelines for the diagnosis and treatment of and chronic heart failure: The Task Force for the diagnosis and treatment of acute and chronic heart failure of the European Society of Cardiology (ESC)Developed with the special contribution of the Heart Failure Association (HFA) of the ESC. Eur. Heart J. 2016, 37, 2129–2200. [Google Scholar] [CrossRef]
- Hua, Z.; Chen, C.; Zhang, R.; Liu, G.; Wen, W. Diagnosing Various Severity Levels of Congestive Heart Failure Based on Long-Term HRV Signal. Appl. Sci. 2019, 9, 2544. [Google Scholar] [CrossRef]
- Jahmunah, V.; Oh, S.L.; Wei, J.K.E.; Ciaccio, E.J.; Chua, K.; San, T.R.; Acharya, U.R. Computer-aided diagnosis of congestive heart failure using ECG signals—A review. Phys. Med. 2019, 62, 95–104. [Google Scholar] [CrossRef]
- Baldoumas, G.; Peschos, D.; Tatsis, G.; Votis, C.I.; Chronopoulos, S.K.; Christofilakis, V.; Kostarakis, P.; Sarlis, N.V.; Skordas, E.S.; Naka, K.K.; et al. Comparison of the R-R intervals in ECG and Oximeter signals to be used in complexity measures of Natural Time Analysis. In Proceedings of the 2018 7th International Conference on Modern Circuits and Systems Technologies (MOCAST), Thessaloniki, Greece, 7–9 May 2018. [Google Scholar] [CrossRef]
- Zebrowski, J.J.; Poplawska, W.; Baranowski, R.; Buchner, T. Symbolic dynamics and complexity in a physiological timeseries. Chaos Solitons Fractals 2000, 11, 1061–1075. [Google Scholar] [CrossRef]
- Varotsos, P.A.; Sarlis, N.V.; Skordas, E.S. Natural Time Analysis: The New View of Time; Springer: Berlin/Heidelberg, Germany, 2011. [Google Scholar]
- Varotsos, P.A.; Sarlis, N.V.; Skordas, E.S. Long-range correlations in the electric signals that precede rupture. Phys. Rev. E 2002, 66, 011902. [Google Scholar] [CrossRef] [PubMed]
- Varotsos, P.A.; Sarlis, N.V.; Skordas, E.S.; Lazaridou, M.S. Fluctuations, under time reversal, of the natural time and the entropy distinguish similar looking electric signals of different dynamics. J. Appl. Phys. 2008, 103, 014906. [Google Scholar] [CrossRef]
- Lazaridou-Varotsos, M.S. Earthquake Prediction by Seismic Electric Signals; Springer: Berlin/Heidelberg, Germany, 2013. [Google Scholar]
- Varotsos, P.A.; Sarlis, N.V.; Skordas, E.S.; Lazaridou, M.S. Seismic Electric Signals: An additional fact showing their physical interconnection with seismicity. Tectonophysics 2013, 589, 116–125. [Google Scholar] [CrossRef]
- Varotsos, P.A.; Sarlis, N.V.; Skordas, E.S.; Tanaka, H.K.; Lazaridou, M.S. Attempt to distinguish long-range temporal correlations from the statistics of the increments by natural time analysis. Phys. Rev. E 2006, 74, 021123. [Google Scholar] [CrossRef] [PubMed]
- Sarlis, N.V.; Varotsos, P.A.; Skordas, E.S. Flux avalanches in YBa2Cu3O7−x films and rice piles: Natural time domain analysis. Phys. Rev. B 2006, 73, 054504. [Google Scholar] [CrossRef]
- Varotsos, P.A.; Sarlis, N.V.; Skordas, E.S.; Lazaridou, M.S. Natural entropy fluctuations discriminate similar-looking electric signals emitted from systems of different dynamics. Phys. Rev. E 2005, 71, 011110. [Google Scholar] [CrossRef]
- Varotsos, P.A.; Sarlis, N.V.; Skordas, E.S.; Lazaridou, M.S. Identifying sudden cardiac death risk and specifying its occurrence time by analyzing electrocardiograms in natural time. Appl. Phys. Lett. 2007, 91, 064106. [Google Scholar] [CrossRef]
- Sarlis, N.V.; Skordas, E.S.; Varotsos, P.A. Heart rate variability in natural time and 1/f “noise”. EPL 2009, 87, 18003. [Google Scholar] [CrossRef]
- Varotsos, P.A.; Sarlis, N.V.; Skordas, E.S.; Lazaridou, M.S. Entropy in the natural time domain. Phys. Rev. E 2004, 70, 011106. [Google Scholar] [CrossRef]
- Sarlis, N.V.; Christopoulos, S.-R.G.; Bemplidaki, M.M. Change ΔS of the entropy in natural time under time reversal: Complexity measures upon change of scale. EPL 2015, 109, 18002. [Google Scholar] [CrossRef]
- Tun, H.M.; Moe, W.K.; Naing, Z.M. Analysis of Computer Aided Identification System for ECG Characteristic Points. Int. J. Biomed. Sci. Eng. 2015, 3, 49–61. [Google Scholar] [CrossRef][Green Version]
- Moraes, J.L.; Rocha, M.X.; Vasconcelos, G.G.; Vasconcelos Filho, J.E.; de Albuquerque, V.H.C.; Alexandria, A.R. Advances in Photopletysmography Signal Analysis for Biomedical Applications. Sensors 2018, 18, 1894. [Google Scholar] [CrossRef] [PubMed]
- Jayadevappa, B.M.; Holi, M.S. Photoplethysmography: Design, Development, Analysis and Applications in Clinical and Physiological Measurement—A Review. Int. J. Innov. Res. Sci. Eng. Technol. 2016, 5, 3519–3531. [Google Scholar] [CrossRef]
- Sedghamiz, H. Matlab Implementation of Pan Tompkins ECG QRS Detector; DataCite: Cambridge, UK, 2014. [Google Scholar] [CrossRef]
- Pan, J.; Tompkins, W.J. A Real-Time QRS Detection Algorithm. IEEE Trans. Biomed. Eng. 1985, BME-32, 230–236. [Google Scholar] [CrossRef]
- Goldberger, A.L.; Amaral, L.A.N.; Hausdorff, J.M.; Ivanov, P.C.; Peng, C.-K.; Stanley, H.E. Fractal dynamics in physiology: Alterations with disease and aging. Proc. Natl. Acad. Sci. USA 2002, 99, 2466–2472. [Google Scholar] [CrossRef] [PubMed]
- Sarlis, N.V. Entropy in Natural Time and the Associated Complexity Measures. Entropy 2017, 19, 177. [Google Scholar] [CrossRef]
- Costa, M.; Goldberger, A.L.; Peng, C.-K. Broken Asymmetry of the Human Heartbeat: Loss of Time Irreversibility in Aging and Disease. Phys. Rev. Lett. 2005, 95, 198102. [Google Scholar] [CrossRef]
- Costa, M.; Peng, C.-K.; Goldberger, A.L. Multiscale Analysis of Heart Rate Dynamics: Entropy and Time Irreversibility Measures. Cardiovasc. Eng. 2008, 8, 88–93. [Google Scholar] [CrossRef]
- Peng, C.-K.; Mietus, J.; Hausdorff, J.M.; Havlin, S.; Stanley, H.E.; Goldberger, A.L. Long-range anticorrelations and non-Gaussian behavior of the heartbeat. Phys. Rev. Lett. 1993, 70, 1343. [Google Scholar] [CrossRef]
- Kotani, K.; Struzik, Z.R.; Takamasu, K.; Stanley, H.E.; Yamamoto, Y. Model for complex heart rate dynamics in health and diseases. Phys. Rev. E 2005, 72, 041904. [Google Scholar] [CrossRef] [PubMed]
- Ivanov, P.C.; Amaral, L.A.N.; Goldberger, A.L.; Stanley, H.E. Stochastic feedback and the regulation of biological rhythms. Europhys. Lett. 1998, 43, 363. [Google Scholar] [CrossRef] [PubMed]
- Amaral, L.A.N.; Ivanov, P.C.; Aoyagi, N.; Hidaka, I.; Tomono, S.; Goldberger, A.L.; Stanley, H.E.; Yamamoto, Y. Behavioral-Independent Features of Complex Heartbeat Dynamics. Phys. Rev. Lett. 2001, 86, 6026. [Google Scholar] [CrossRef] [PubMed]
- Malpas, S.C. Neural influences on cardiovascular variability: Possibilities and pitfalls. Am. J. Physiol. Heart Circ. Physiol. 2002, 282, H6. [Google Scholar] [CrossRef] [PubMed]
- Prokhorov, M.D.; Ponomarenko, V.I.; Gridnev, V.I.; Bodrov, M.B.; Bespyatov, A.B. Synchronization between main rhythmic processes in the human cardiovascular system. Phys. Rev. E 2003, 68, 041913. [Google Scholar] [CrossRef]
- Bigger, J.T., Jr.; Fleiss, J.L.; Steinman, R.C.; Rolnitzky, L.M.; Schneider, W.J.; Stein, P.K. RR Variability in Healthy, Middle-Aged Persons Compared with Patients With Chronic Coronary Heart Disease or Recent Acute Myocardial Infarction. Circulation 1995, 91, 1936–1943. [Google Scholar] [CrossRef]
- Mc Sharry, P.E.; Clifford, G.D.; Tarassenko, L.; Smith, L.A. A dynamical model for generating synthetic electrocardiogram signals. IEEE Trans. Biomed. Eng. 2003, 50, 289–294. [Google Scholar] [CrossRef]
- Taskforce of the European Society of Cardiology and the North American Society of Pacing and Electrophysiology. Heart Rate Variability. Circulation 1996, 93, 1043–1065. [Google Scholar] [CrossRef]
- Fawcett, T. An introduction to ROC analysis. Pattern Recogn. Lett. 2006, 27, 861–874. [Google Scholar] [CrossRef]
- Sarlis, N.V.; Christopoulos, S.R.G. Visualization of the significance of Receiver Operating Characteristicsbased on confidence ellipses. Comput. Phys. Commun. 2014, 185, 1172–1176. [Google Scholar] [CrossRef]
- Cortes, C.; Vapnik, V. Support-vector networks. Mach. Learn. 1995, 20, 273–297. [Google Scholar] [CrossRef]
- Vapnik, V.N. An overview of statistical learning theory. IEEE Trans. Neural Netw. 1999, 10, 988–999. [Google Scholar] [CrossRef] [PubMed]
- Joachims, T. Advances in Kernel Methods—Support Vector Learning; Schölkopf, B., Burges, C., Smola, A., Eds.; MIT-Press: Cambridge, MA, USA, 1999; Chapter 11; pp. 169–184. [Google Scholar]
- Vapnik, V. The Nature of Statistical Learning Theory, 2nd ed.; Springer: New York, NY, USA, 2000; pp. 138–169. [Google Scholar]
- Cristianini, N.; Scholkopf, B. Support Vector Machines and Kernel Methods: The New Generation of Learning Machines. AI Mag. 2002, 23, 31–41. [Google Scholar] [CrossRef]
- Lewes, G.H. Efficient Learning Machines. Theories, Concepts, and Applications for Engineers and System Designers; Awad, M., Khanna, B., Eds.; Apress: Berkeley, CA, USA, 2015; Chapter 3; pp. 39–66. [Google Scholar]
- Joachims, T. SVMlight Support Vector Machine Version 6.02. 14 August 2008. Available online: http://svmlight.joachims.org (accessed on 10 October 2019).
- Schäfer, A.; Vagedes, J. How accurate is pulse rate variability as an estimate of heart rate variability?: A review on studies comparing photoplethysmographic technology with an electrocardiogram. Int. J. Cardiol. 2013, 166, 15–29. [Google Scholar] [CrossRef] [PubMed]
- Lu, G.; Yang, F.; Taylor, J.A.; Stein, J.F. A comparison of photoplethysmography and ECG recording to analyse heart rate variability in healthy subjects. J. Med. Eng. Technol. 2009, 33, 634–641. [Google Scholar] [CrossRef] [PubMed]
- Kwon, J.M.; Kim, K.H.; Jeon, K.H.; Kim, H.M.; Kim, M.J.; Lim, S.M.; Song, P.S.; Park, J.; Choi, R.K.; Oh, B.H. Development and Validation of Deep-Learning Algorithm for Electrocardiography-Based Heart Failure Identification. Korean Circ. J. 2019, 49, 629–639. [Google Scholar] [CrossRef] [PubMed]
- Attia, Z.I.; Kapa, S.; Yao, X.; Lopez-Jimenez, F.; Mohan, T.L.; Pellikka, P.A.; Carter, R.E.; Shah, N.D.; Friedman, P.A.; Noseworthy, P.A. Prospective validation of a deep learning electrocardiogram algorithm for the detection of left ventricular systolic dysfunction. J. Cardiovasc. Electrophysiol. 2019, 30, 668–674. [Google Scholar] [CrossRef]
- Tripathy, R.K.; Paternina, M.R.A.; Arrieta, J.G.; Zamora-Méndez, A.; Naik, G.R. Automated detection of congestive heart failure from electrocardiogram signal using Stockwell transform and hybrid classification scheme. Comput. Methods Prog. Biomed. 2019, 173, 53–65. [Google Scholar] [CrossRef]
- Sudarshan, V.K.; Acharya, U.R.; Oh, S.L.; Adam, M.; Tan, J.H.; Chua, C.K.; Chua, K.P.; Tan, R.S. Automated diagnosis of congestive heart failure using dual tree complex wavelet transform and statistical features extracted from 2s of ECG signals. Comput. Biol. Med. 2017, 83, 48–58. [Google Scholar] [CrossRef]
- Wang, L.; Zhou, X. Detection of Congestive Heart Failure Based on LSTM-Based Deep Network via Short-Term RR Intervals. Sensors (Basel) 2019, 19, 1502. [Google Scholar] [CrossRef]
- Gallagher, J.; McCormack, D.; Zhou, S.; Ryan, F.; Watson, C.; McDonald, K.; Ledwidge, M.T. A systematic review of clinical prediction rules for the diagnosis of chronic heart failure. ESC Heart Fail. 2019, 6, 499–508. [Google Scholar] [CrossRef] [PubMed]
- Pan, W.; He, A.; Feng, K.; Li, Y.; Wu, D.; Liu, G. Multi-frequency components entropy asnovel heart rate variability indices in congestive heart failure assessment. IEEE Access. 2019, 7, 37708–37717. [Google Scholar] [CrossRef]
- Roalfe, A.K.; Mant, J.; Doust, J.A.; Barton, P.; Cowie, M.R.; Glasziou, P.; Mant, D.; McManus, R.J.; Holder, R.; Deeks, J.J.; et al. Development and initial validation of a simple clinical decision tool to predict the presence of heart failurein primary care: The MICE (male, infarction, crepitations, edema) rule. Eur. J. Heart Fail. 2012, 14, 1000–1008. [Google Scholar] [CrossRef] [PubMed]
- Fahey, T.; Jeyaseelan, S.; McCowan, C.; Carr, E.; Goudie, B.M.; Pringle, S.D.; Donnan, P.; Sullivan, F.; Struthers, A. Diagnosis of left ventricular systolic dysfunction (LVSD): Development and validation of a clinical prediction rule in primary care. Fam. Pract. 2007, 24, 628–635. [Google Scholar] [CrossRef] [PubMed]
- Boonman-de Winter, L.J.; Rutten, F.H.; Cramer, M.J.; Landman, M.J.; Zuithoff, N.P.; Liem, A.H.; Hoes, A.W. Efficiently screeningheart failure in patients with type 2 diabetes. Eur. J. Heart Fail. 2015, 17, 187–195. [Google Scholar] [CrossRef]
- Yamamoto, K.; Burnett, J.C., Jr.; Bermudez, E.A.; Jougasaki, M.; Bailey, K.R.; Redfield, M.M. Clinical criteria and biochemical markers for the detection of systolic dysfunction. J. Card. Fail. 2000, 6, 194–200. [Google Scholar] [CrossRef]


| t | df | Sig. (Two-Tailed) | Mean Difference | 95% Confidence Interval of the Difference | ||
|---|---|---|---|---|---|---|
| Lower | Upper | |||||
| ECG (RR) | 1077.070 | 1116 | 0.000 | 1.07295859 | 1.0710040 | 1.0749132 |
| PPG (PP) | 991.153 | 1116 | 0.000 | 1.0729118 | 1.070788 | 1.075036 |
| N | Correlation | Sig. | |
|---|---|---|---|
| ECG (RR) and PPG (PP) | 1117 | 0.825 | 0.000 |
| F | Sig. | t | df | Sig. (Two-Tailed) | Mean Difference | Std. Error Difference | |
|---|---|---|---|---|---|---|---|
| Levene’s Test for Equality of Variances | |||||||
| t-Test for Equality of Means | |||||||
| Equal variances assumed | 8.059 | 0.005 | 0.032 | 2232 | 0.975 | 0.00004678 | 0.00147111 |
| Not equal variances assumed | 0.032 | 2216.767 | 0.975 | 0.00004678 | 0.00147111 | ||
| Parameter | Group | n | Mean | Std. Deviation | Std. Error Mean |
|---|---|---|---|---|---|
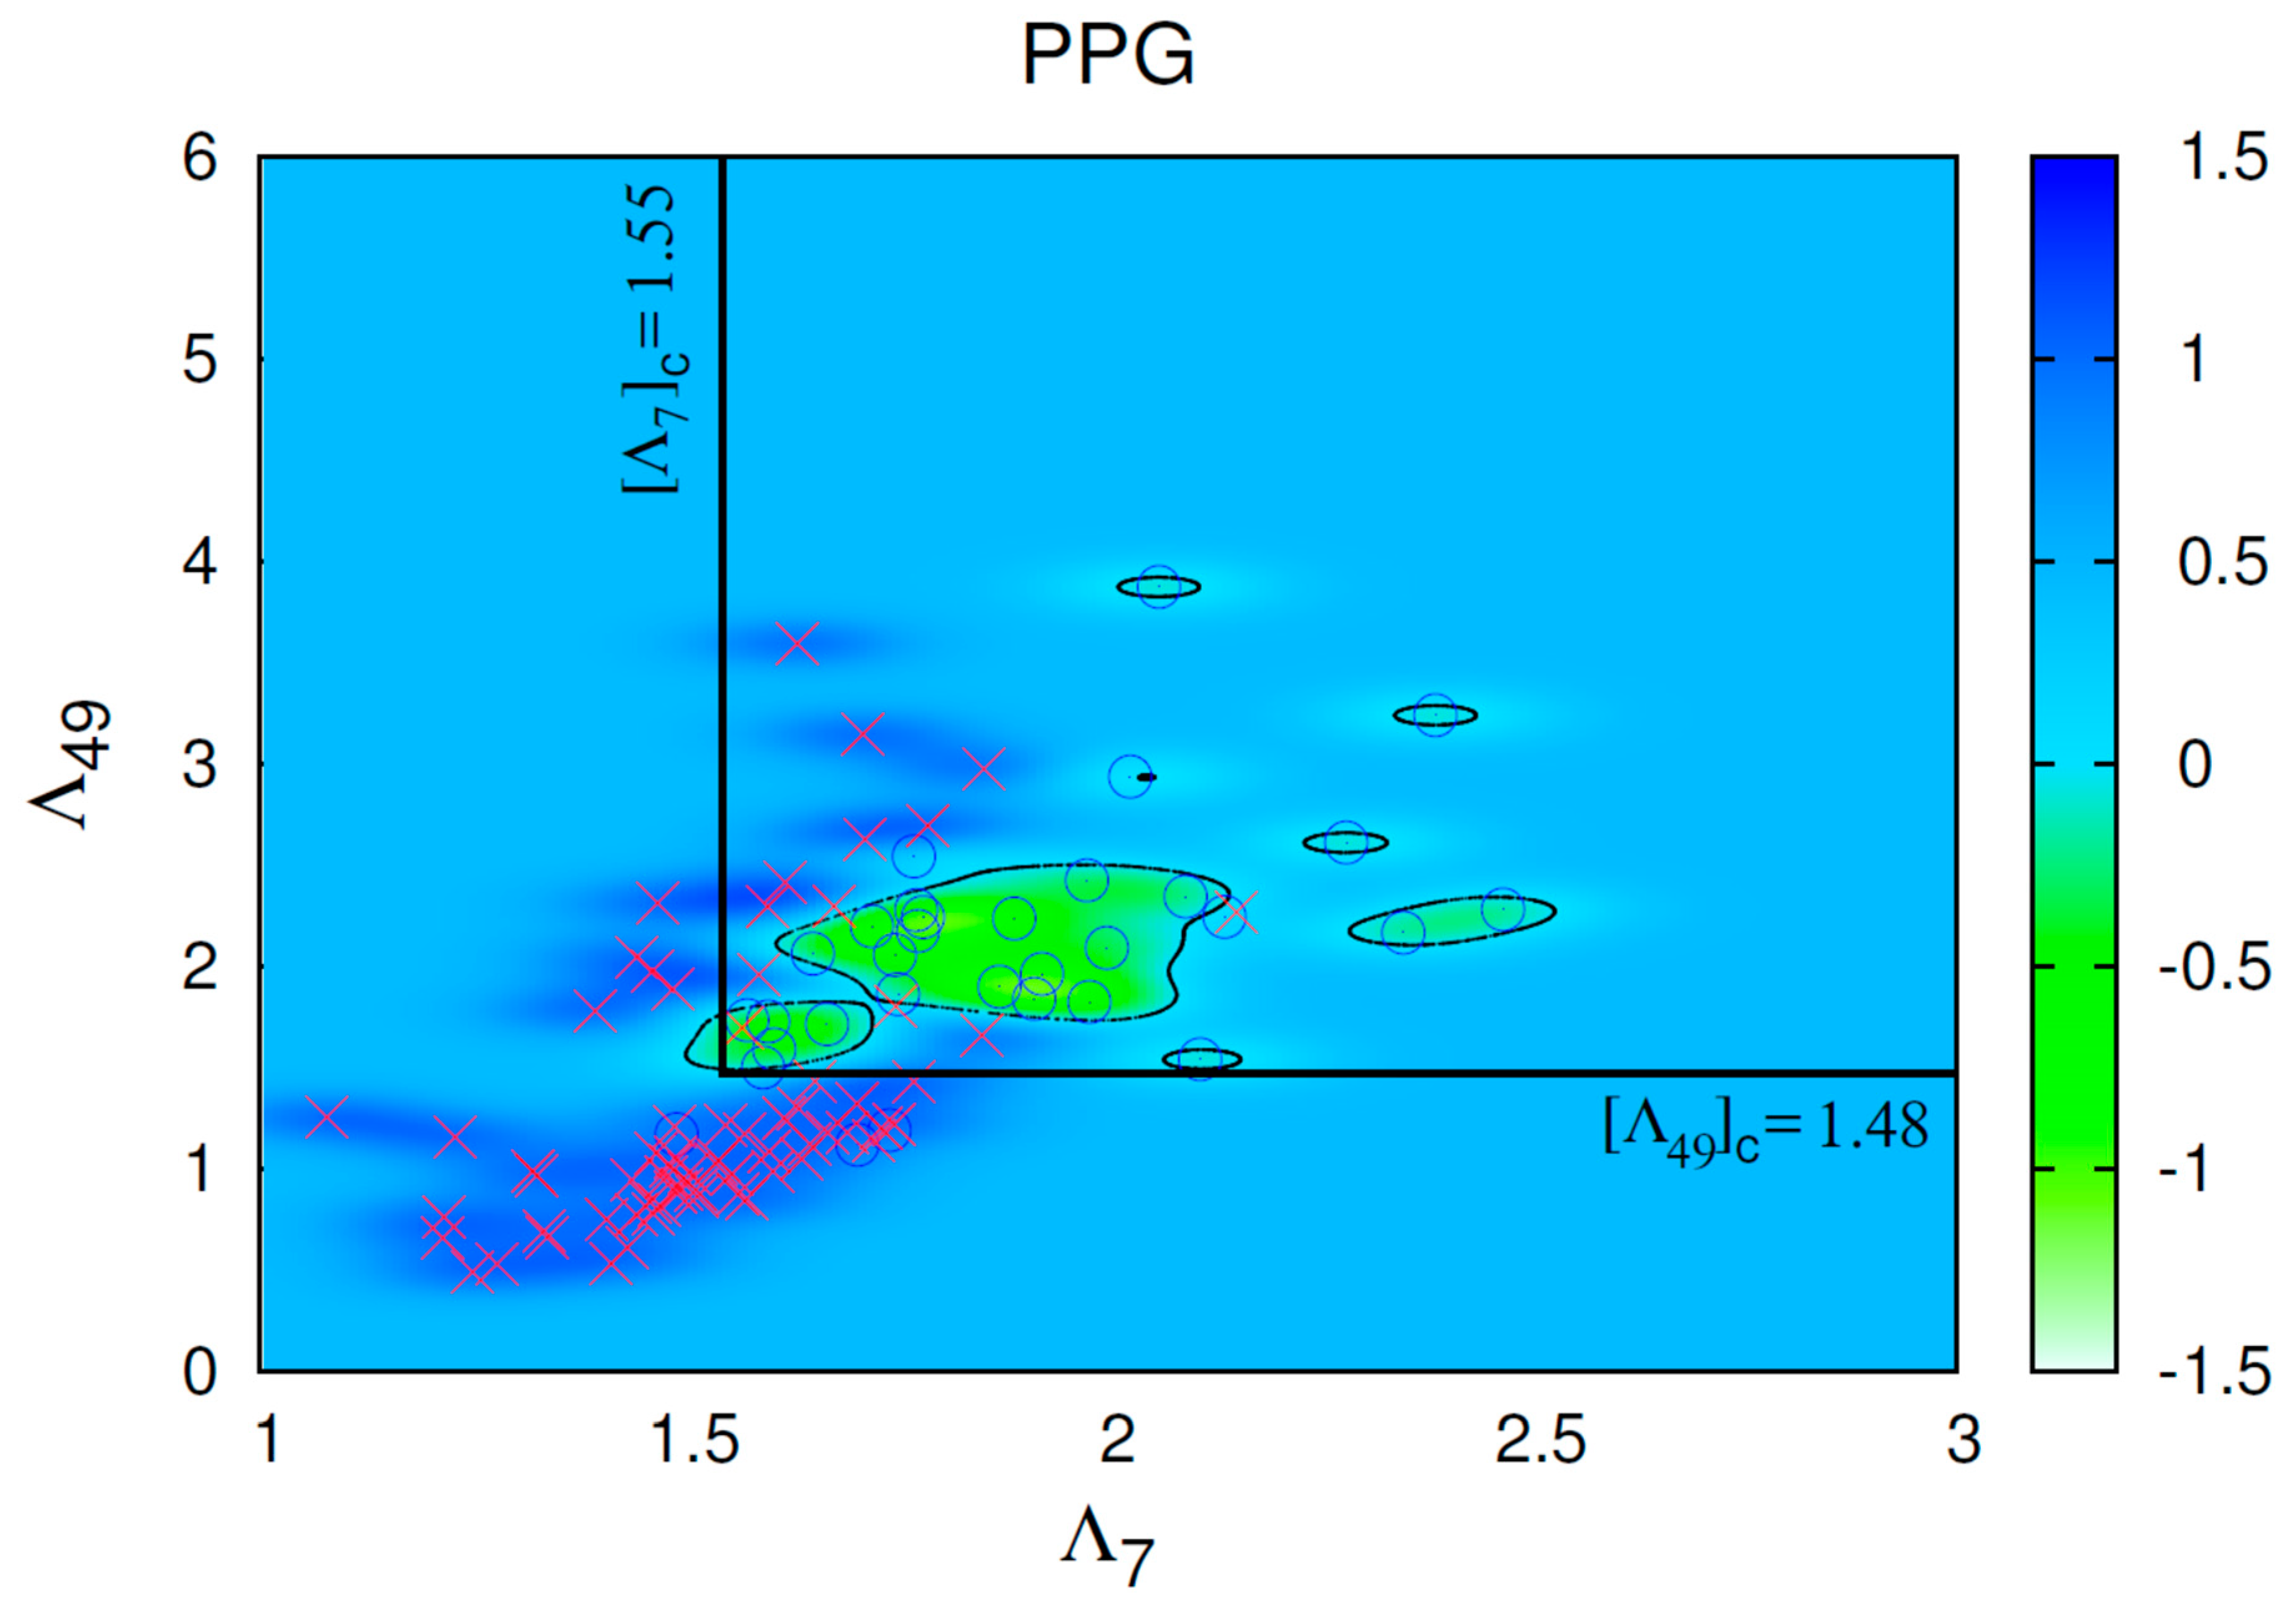
| Λ7 | Healthy | 32 | 1.888 | 0.251 | 0.044 |
| CHF | 67 | 1.539 | 0.177 | 0.022 | |
| Λ49 | Healthy | 32 | 2.085 | 0.573 | 0.101 |
| CHF | 67 | 1.337 | 0.678 | 0.083 |
| Parameter. | t | df | Sig. (Two-Tailed) | Mean Difference | Std. Error Difference | 95% Confidence Interval of the Difference | |
|---|---|---|---|---|---|---|---|
| Lower | Upper | ||||||
| Λ7 | 7.049 | 46.166 | 0.000 | 0.348 | 0.049 | 0.249 | 0.448 |
| Λ49 | 5.381 | 97.000 | 0.000 | 0.748 | 0.139 | 0.472 | 1.023 |
| Parameter | Group | n | Mean | Std. Deviation | Std. Error Mean |
|---|---|---|---|---|---|
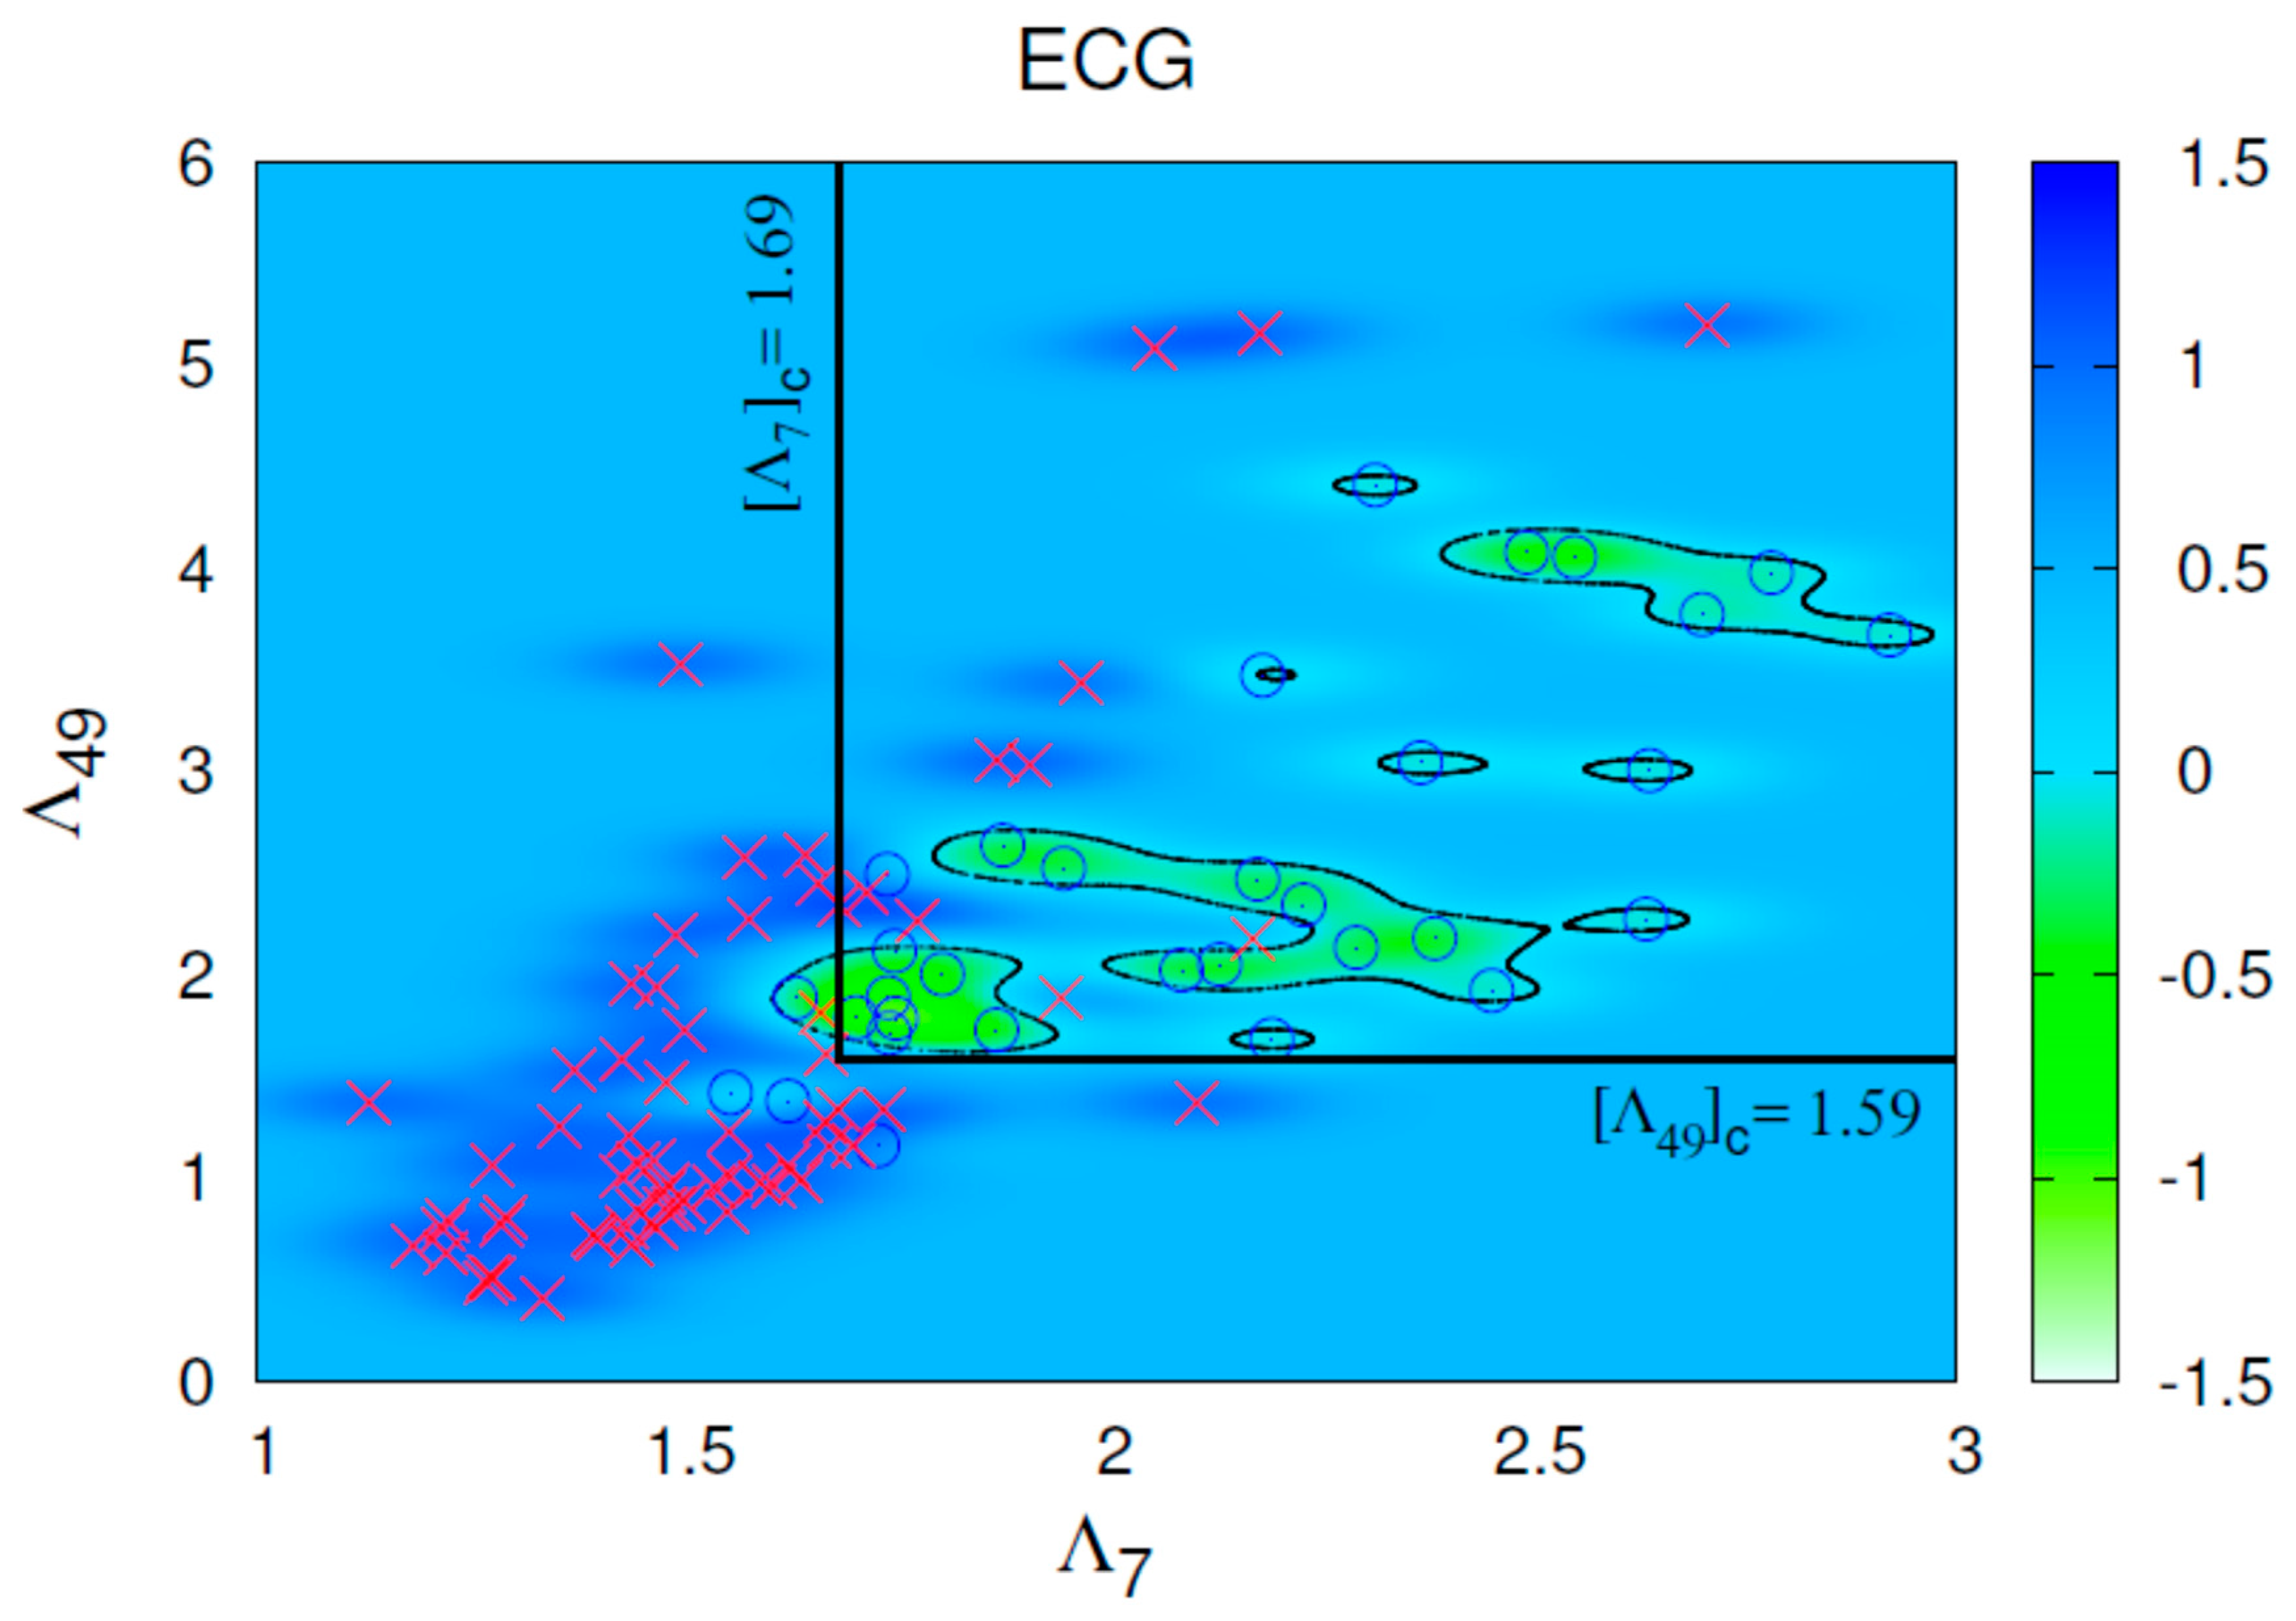
| Λ7 | Healthy | 32 | 2.127 | 0.389 | 0.069 |
| CHF | 68 | 1.567 | 0.270 | 0.033 | |
| Λ49 | Healthy | 32 | 2.474 | 0.891 | 0.157 |
| CHF | 68 | 1.566 | 1.069 | 0.130 |
| Parameter | t | df | Sig. (Two-Tailed) | Mean Difference | Std. Error Difference | 95% Confidence Interval of the Difference | |
|---|---|---|---|---|---|---|---|
| Lower | Upper | ||||||
| Λ7 | 7.355 | 45.626 | 0.000 | 0.560 | 0.076 | 0.407 | 0.713 |
| Λ49 | 4.167 | 98.000 | 0.000 | 0.908 | 0.218 | 0.475 | 1.340 |
| Reference | Parameters Used | Sensitivity sCHF |
|---|---|---|
| Hua et al. [9] (see Table 8) | Various HRV classifiers | 85.37% to 97.56% |
| Pan et al. [60] (see Table 3) | Multi-Frequency Components Entropy (or LF/HF) | 63.6% to 79.5% (or 86.4%) |
| Gallagher et al. [59] (see Table 4) | BNP alone | 75.6% to 84.7% |
| Roalfe et al. [61] | MICE, MICE and ECG, MICE and BNP, MICE and ECG and BNP | 58.5% to 86.2% (see Table 4 of [59]) |
| Fahey et al. [62] | CPR, CPR and ECG, CPR and BNP, CPR and ECG and BNP | 55.3% to 86.2% (see Table 4 of [59]) |
| Boonman-de Winter et al. [63] | Clinical score | 67.7% to 75.6% (see Table 4 of [59]) |
| Yamamoto et al. [64] | Clinical score (and BNP) | 54.2% to 76.1% (see Table 4 of [59]) |
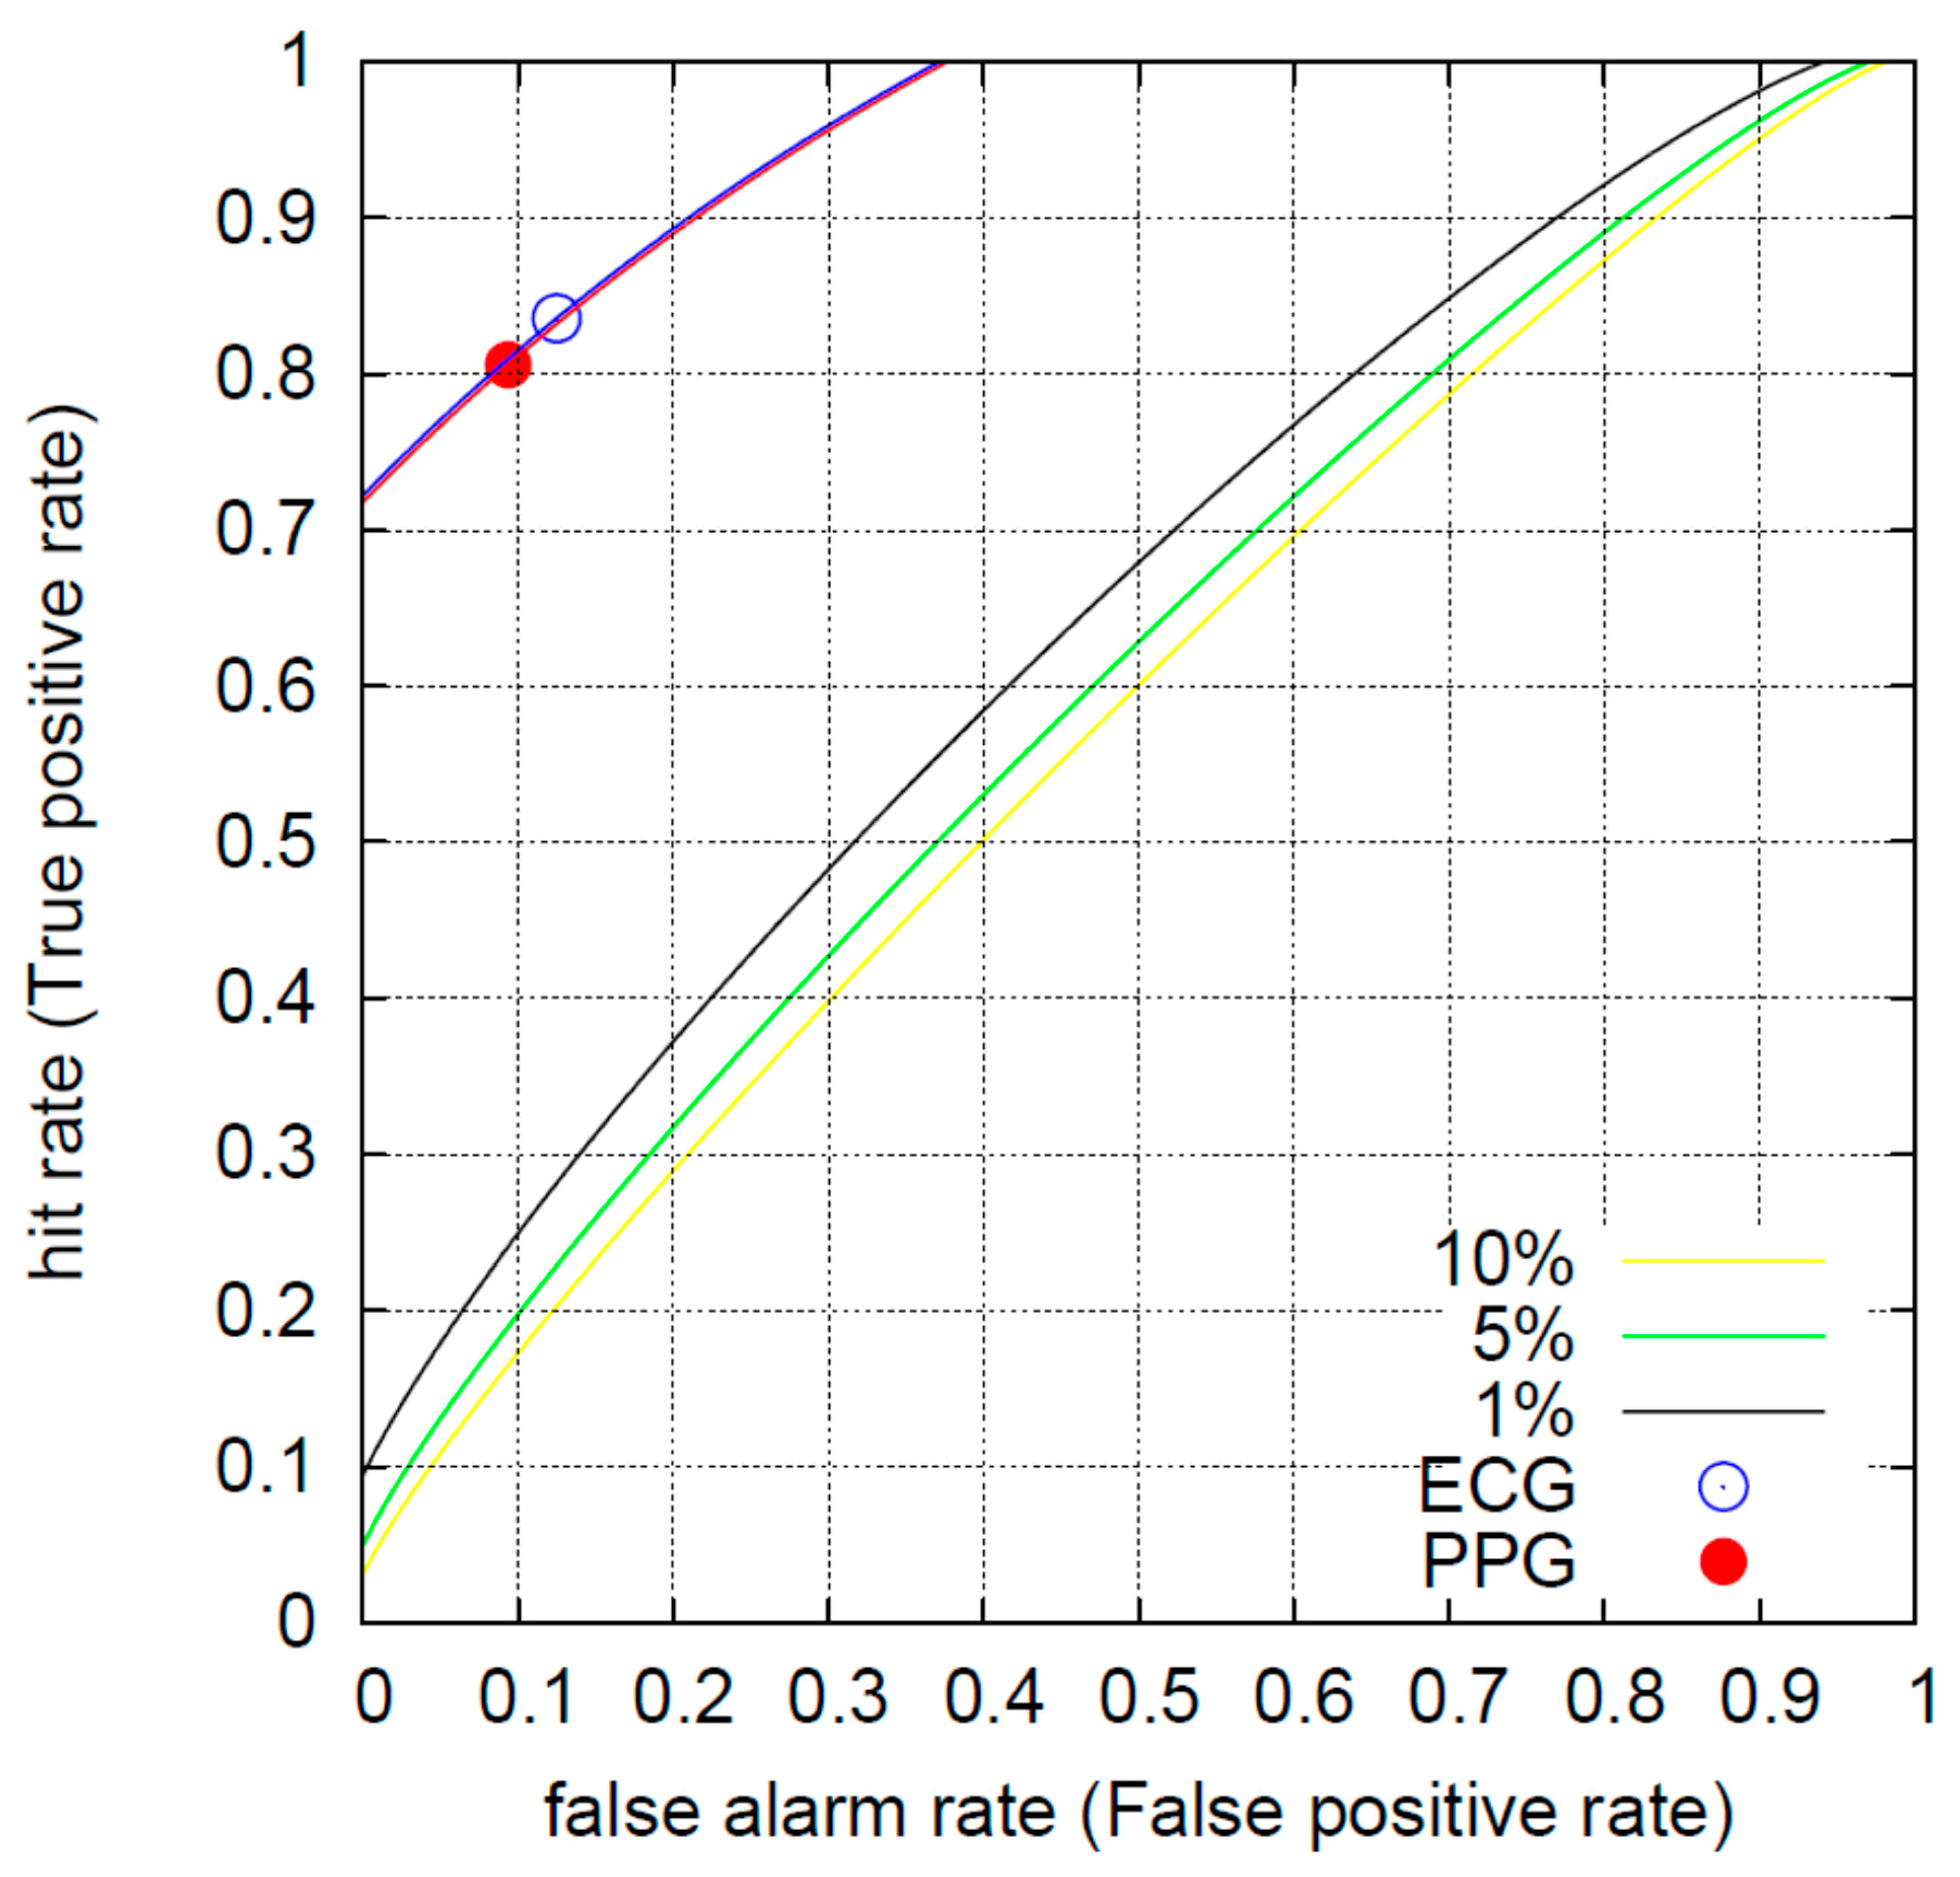
| This work | Λ7(PP), Λ49 (PP) | 80.6% (97.7% when employing SVM) |
| Λ7(RR), Λ49 (RR) | 83.5% (97.7% when employing SVM) |
| Reference | Parameters Used | Sensitivity sCHF |
|---|---|---|
| Varotsos et al. [21] (see Figure 3a) | N3(NN), σ[ΔS7](NN) | 61.4% |
| Sarlis et al. [24] (see Table 1) | Λ7(ΝΝ), Λ49(ΝΝ), σ[ΔS3](NN) | 68.2% |
| This work | Λ7(PP), Λ49(PP) | 80.6% (97.7% when employing SVM) |
| Λ7(RR), Λ49(RR) | 83.5% (97.7% when employing SVM) |
© 2019 by the authors. Licensee MDPI, Basel, Switzerland. This article is an open access article distributed under the terms and conditions of the Creative Commons Attribution (CC BY) license (http://creativecommons.org/licenses/by/4.0/).
Share and Cite
Baldoumas, G.; Peschos, D.; Tatsis, G.; Chronopoulos, S.K.; Christofilakis, V.; Kostarakis, P.; Varotsos, P.; Sarlis, N.V.; Skordas, E.S.; Bechlioulis, A.; et al. A Prototype Photoplethysmography Electronic Device that Distinguishes Congestive Heart Failure from Healthy Individuals by Applying Natural Time Analysis. Electronics 2019, 8, 1288. https://doi.org/10.3390/electronics8111288
Baldoumas G, Peschos D, Tatsis G, Chronopoulos SK, Christofilakis V, Kostarakis P, Varotsos P, Sarlis NV, Skordas ES, Bechlioulis A, et al. A Prototype Photoplethysmography Electronic Device that Distinguishes Congestive Heart Failure from Healthy Individuals by Applying Natural Time Analysis. Electronics. 2019; 8(11):1288. https://doi.org/10.3390/electronics8111288
Chicago/Turabian StyleBaldoumas, George, Dimitrios Peschos, Giorgos Tatsis, Spyridon K. Chronopoulos, Vasilis Christofilakis, Panos Kostarakis, Panayiotis Varotsos, Nicholas V. Sarlis, Efthimios S. Skordas, Aris Bechlioulis, and et al. 2019. "A Prototype Photoplethysmography Electronic Device that Distinguishes Congestive Heart Failure from Healthy Individuals by Applying Natural Time Analysis" Electronics 8, no. 11: 1288. https://doi.org/10.3390/electronics8111288
APA StyleBaldoumas, G., Peschos, D., Tatsis, G., Chronopoulos, S. K., Christofilakis, V., Kostarakis, P., Varotsos, P., Sarlis, N. V., Skordas, E. S., Bechlioulis, A., Michalis, L. K., & Naka, K. K. (2019). A Prototype Photoplethysmography Electronic Device that Distinguishes Congestive Heart Failure from Healthy Individuals by Applying Natural Time Analysis. Electronics, 8(11), 1288. https://doi.org/10.3390/electronics8111288