Abstract
In this study, the Fourier series expansion method (FSEM) was employed to calculate the complex propagation constants of plasma structures consisting of infinitely long, silver nanorod arrays in the range of 180–1900 nm, and the characteristics of the complex propagation constant were analyzed in depth. According to the results of FSEM using dielectric constants from Johnson experimental data, a multi-mode frequency band appears in the propagation stage, which can be adopted to achieve a multi-mode communication, multi-mode transceiver, integrated filter with single multi-mode combination. In the meantime, the comparison between the three sets of results with only single mode transmission of the generalized multipole technique (GMT) using dielectric constants from Johnson experimental data, FSEM using dielectric constants from Palik experimental data, and FSEM using dielectric function from Drude–Lorentz model suggested that the results of the four sets of complex propagation constants were well consistent with each other. Furthermore, a finite array of only 40 silver nanorods was studied, and the ability of guided waves when a finite array is excited by a plane wave at a specific wavelength was explored. According to different guiding abilities—propagation, attenuation, and cut off, it can be applied to waveguides, sensor, filters, etc.
1. Introduction
In the past few decades, numerous studies have focused on the research and the development of novel structures based on multi-layer arrays of the periodic distributions of photonic crystals [1,2]. After that discovery, the field of photonic crystals garnered great interest among researchers, and various analytical methods and numerical methods have been proposed to analyze photonic crystal waveguides [3,4,5,6,7,8,9]. The periodic distribution of scattering elements (a simple single-layer structure) that may effectively guide electromagnetic waves along the chain aroused attention from scientists, so has been extensively studied [10,11,12]. The systematic study on the bandgap structure of two-dimensional periodic dielectric materials is conducted using different methods [13,14,15,16,17,18]. Simple design and manufacturing can be considered a major advantage of this structure. However, to verify its good guiding attributes, detailed theoretical and numerical studies are necessary.
In recent years, in the direction of reducing the size of photonic devices below the diffraction limit, it was not enough to take dielectric material as the object of research. Therefore, it led to the development of metal plasma-resonant waveguides. From the structural perspective, the waveguide consists of several coupled nanoparticles arranged in the array. Near-field interactions between these closely spaced nanoparticles causes light to propagate along the array’s axis. The structures that guide these collective oscillations have been analyzed in numerous papers [19,20,21,22,23]. However, since metallic losses are rather large in these waveguides, the calculation of the attenuation constant needs to be considered. Numerous studies (e.g., the analysis of the optical interactions of nanostructures formed on metal films) focus on the application of metals to photonic crystals. The absorption characteristics of one-dimensional quasi-periodic photonic crystals with thin metal layers and dielectric Fibonacci layers were investigated. The full-vector modal solver, using the finite element method, was employed to numerically study the polarization characteristics of wire-selectively filled photonic crystal fibers into the cladding pores. The possibility of selective polarization in photonic crystal structure was analyzed using a single molecular layer of metal nanoparticles. Using the transfer matrix method and some studies of photonic crystals in three dimensions, the transmission properties of a one-dimensional photonic crystal made of alternate layers of an isotropic ordinary dielectric and a graphene-based hyperbolic metamaterial were studied theoretically [24,25,26,27,28,29].
In the previous study, a Fourier series expansion method was proposed as a feasible method to study the propagation mode and leaky mode of an infinitely long circular chain structure. Additionally, to study the propagation characteristics and electric field distribution characteristics in three Bragg propagation periods, the model of an infinitely long square single-chain and multi-chain periodic structure was used.
In this paper, the complex propagation constants of an infinitely long silver chain structure with a wavelength in the range of 180–1900 nm are studied in detail. The correctness of the method (FSEM) can be verified by the four results that are very consistent. A special phenomenon of single frequency multimode was found in the results of FSEM using dielectric constants from Johnson experimental data (FSEM(J)), and the complex propagation constants of the three methods of generalized multipole technique using dielectric constants from Johnson experimental data (GMT(J)), FSEM using dielectric constants from Palik experimental data (FSEM(P)), and FSEM using dielectric function from Drude–Lorentz model (FSEM(D-L)) with only the single mode transmission were compared. It was found that the results of the four sets of complex propagation constants agree well. Furthermore, the guided wave capability of different nanowavelengths under the finite-length chain structure of 40 circular nano-columns was studied. By studying the waveguide capabilities of a particular wavelength, different stages can be applied to different devices. Propagation phase can be used for waveguide, sensor, etc. The cut-off phase can be used for filters, nanomirrors, nanoprobes, etc. In particular, the multi-mode stage that occurs in FSEM (J) can be used for multi-mode, communication integrated filters of a single and multi-mode combination, etc.
2. Formulation of the Problem
A two-dimensional infinite periodic chain composed of circular rods is periodic along the x-axis and with the lattice constant h (Figure 1). The scatters are infinitely long in the z-direction, and they are parallel to each other. The circular rods, having radius r, are assumed to be pure dielectrics, with a relative dielectric permittivity ε. An array with this structure repeats the same configuration with a fictitious period Λ along the y-direction, and then the original structure is approximated by the array’s unit cell located in 0 ≤ y ≤ Λ. Assume that we induce the propagation of E (Ez, Hx, Hy) and H (Hz, Ex, Ey) waves. The details of the formulation are omitted in this communication due to the space limitations; see our previous reports for details [30,31]. Surface plasmon is a large amount of collective free-electron vibration occurring at the metal–medium interface and excited only by H waves (magnetic field components perpendicular to the nanowire cross section) [32].
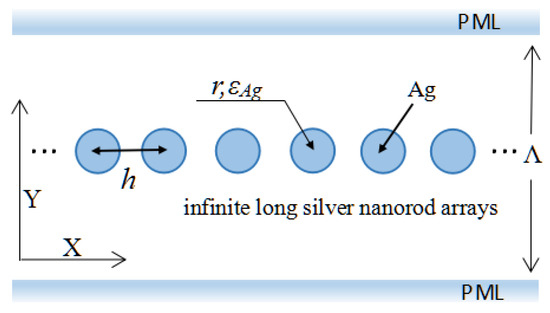
Figure 1.
Infinite periodic chain of circular rods along the x-axis with lattice constant h. Radius and dielectric permittivity of rods are r and ε, respectively.
First, the major idea of the formulation should be described. In the case of the H wave, Maxwell equations are written as follows:
where H’z = (μ0/ε0)1/2Hz, v(y) = [1 + iσ(y)]−1 denotes the stretched coordinate variable [24] characterizing the assumed Perfectly Matched Layers (PMLs), where σ(y) = σmax (1 − y/w)d is the conductivity function. Under the fictitious periodicity of the system, the electric and magnetic fields are approximated by a truncated Fourier series:
where Dy is the electric displacement vector, φm = 2πm/Λ. Equation (2) is substituted into (1), and the orthogonality of the Fourier bases is exploited. For H modes with field components (Hz, Ex, Ey), Hz acts as the leading field. To overcome the discontinuity of the electric field normal to the core-cladding boundaries, Li’s factorization rule [33] should be followed by the Fourier series expansion of Ey field. A set of linear equations to determine the Fourier coefficients, {hz,m (x)} and {ey,m (x)} are derived as
where δmm’ denotes Kronecker’s delta; the superscript T denotes the transpose of the indicated vector; k0 is the wavenumber in a free space; and ε(y) is the dielectric permittivity along the y-axis within the period 0 ≤ y ≤ Λ. The eigenvalue kn = ξn2 (n = 1, 2, 3, ···, 2M + 1) of matrix C and the eigenvectors Pn determine the propagation constant ξn and the field distributions for the guided and radiation modes in the assumed waveguide, respectively. The solutions to Equations (8) and (9) are written as
where an(±)(x) denotes the amplitudes of the forward and backward propagating n-th modes. The elements of U(x), P, and a(±)(x) are rearranged in the order of guided and radiation modes with decreasing Re[ξn].
Next, each circular rod is divided into a sufficient number of thin, parallel rectangular rods, as shown in Figure 2, and the unit cell of the periodic chain in the x-direction replaced by a cascading connection of layered, parallel, planar waveguides [31]. In each waveguide section, the solutions to Equations (1)–(8) are given by Equations (18)–(25). The boundary conditions for Hz and Ey at each step-discontinuity are fulfilled by equating the Fourier coefficients on both sides of the section. This relation leads to the scattering matrix Sj defined at the interface x = xj as follows:
where
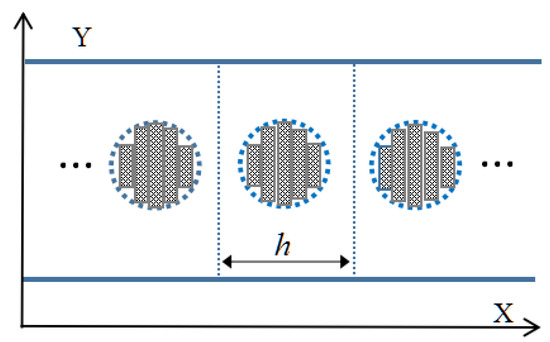
Figure 2.
Discretization of circular rods by a sufficient number of thin, parallel rectangular rods.
Using the scattering matrix Sj+1 at the interface x = xj+1 defined in the same way as Equation (25) and considering the modes propagation over the distance xj+1 − xj, it yields:
with
where I denotes the unit matrix; U(+)(x) is defined by Equation (22). Equations (29)–(31) express the recursive relations to connect the scatterings matrices defined at each step of discontinuity of the waveguide.
When the waveguide changes continuously along the optical propagation, the transition section is approximated by a considerable number of step-discontinuities. If N step discontinuities at x = xj (j = 1, 2, …, N) exist along the waveguide, (N − 1) times the recursion process will lead to the generalized scattering matrices SN [31] for the whole system as follows:
The generalized scattering matrix over one period h in the x direction is calculated following the procedure, where N denotes the number of the thin rectangular rods within a unit cell. The result is adopted to obtain the transfer matrix K over the unit cell that satisfies the following relation [31]:
Thus, the propagation constant γk = βk + iαk of the k-th mode is determined by
where χk denotes the k-th eigenvalue of the transfer matrix K.
3. Results and Discussion
This section compares the trend of complex propagation constants of the four methods and explore the differences and specificities of the four outcomes first. The four methods are: FSEM using dielectric constants from Johnson experimental data (FSEM(J)), generalized multipole technique using dielectric constants from Johnson experimental data (GMT(J)), FSEM using dielectric constants from Palik experimental data (FSEM(P)), and FSEM using dielectric function from Drude–Lorentz model (FSEM(D-L)).
The phase constants and attenuation constants of the infinitely long circular chain structure in H mode were analyzed. The radius of the circle was 25 nm, and the period length h was 55 nm. The fictitious period Λ was set to 60h, the truncation number was M = 150, the number of thin parallel rectangular rods was 20, and the thickness, σmax, and d of the PML were chosen to be h, 8.0, and 2.1, respectively.
Two different experimental datasets of metallic silver were used: the wavelength ranges of Johnson experimental data and the Palik experimental data were from 180–1900 nm, and from 180–1300 nm, respectively [34,35].
In this paper, the Drude–Lorentz model was used to characterize the optical dielectric function ε(ω) of the silver nanowire, and an optimized fit of silver dispersion was used [36,37,38]:
where ΩL and ΓL denote the frequency and the spectral width of the Lorentz oscillator, respectively; ωp and γ are the usual constants of the Drude model; Δ is the strength of the Lorentz oscillator. These parameters were optimized to fit the experimental permittivity data of silver [34]. The results of this optimization are listed in Table 1.

Table 1.
Values of the optimized parameters to fit the experimental data of silver.
In order to make the method of this paper more persuasive and correct, first, the same Johnson experimental data was used, and the results of the complex propagation constants of the FSEM(J) was compared with those of the complex propagation constant of GMT(J) in the comparative paper [39]. The parameters used were consistent with the paper [39]. Second, the results of complex propagation constants obtained from two different metal silver experimental datasets (Johnson and Palik) and D-L were compared by the method of FSEM (the radius of the circle was 25 nm, and the period length h was 55 nm), as shown in Figure 2. The permittivity values of the two sets of silver experimental data and Drude–Lorentz model were also obtained. The inset of Figure 3 shows the values for the dielectric function of silver, as used in these computations.
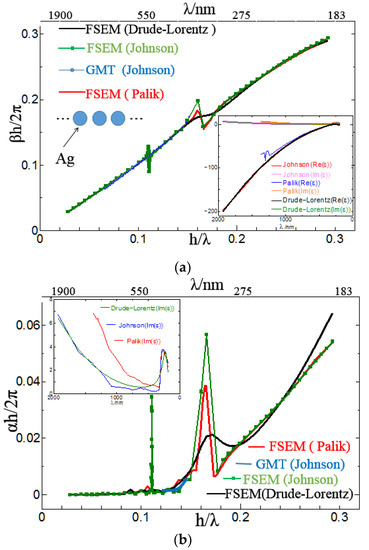
Figure 3.
Phase constant and attenuation constant of infinite long silver nanorod arrays with r = 25 nm and h = 55 nm corresponding to the four results. The inset shows the dielectric function, as reported in [34,35,36,37,38]. (a) Phase constant; (b) attenuation constant.
It can be seen from the comparison results in Figure 3 that whether the method is different or the experimental data of the dielectric constant is different, the complex propagation constants obtained by the four methods are quite consistent, with only slight differences in the details, which can confirm the correctness of the method used in this paper. By contrast, we can find special physical phenomena such as multimode. According to the study on the FSEM (J) method, the phase constant and the attenuation constant have jumps in two places: the first jump’s range is around 496 nm, which is caused by multimode causes; the second jump’s range is around 340 nm, attributed to fluctuations of the permittivity and the effects of the structure. The jump variation of the dielectric constant can be seen in the illustration in Figure 3. A special phenomenon of single frequency multimode in the result of FSEM (J) is a special physical phenomenon. The results of GMT(J), FSEM(P), and FSEM(D-L) are only single mode. The reason why there are no multimodes in the results of the GMT(J) and FSEM(P) is that the frequency points measured by the experiment are different and the method is different.
The reason why FSEM using the Drude–Lorentz model especially, whose parameters are optimized to fit the Johnson experimental permittivity data of silver, does not have the same multimode as FSEM (J), is that there is a certain gap between values of the two dielectric constants. That can be seen from the inset-graph of Figure 3. In general, the emergence of multimode is due to different methods, different frequency points of measurement, and different values of dielectric constant.
In the meantime, through Figure 3a, when the FSEM method was used to study two different experimental data (Johnson and Palik), it was found that propagation constants were consistent.
The comparison of the above four ways suggest that only the FSEM (J) data of the four sets of data show the new physical phenomenon of multi-mode, and the distribution of the other three sets of data are in single-mode form. On the whole, the calculation results of the four sets of complex propagation constants can be of high consistency even using different research methods, different sets of experimental data, and calculated dielectric constant data.
Next, to study the guided wave ability of the finite array excited by plane waves at a specific wavelengths, 40 silver cylinders were selected as experimental objects. The results of the four methods show that h/λ < 0.145 is the propagation stage, and it is in an attenuated or cut-off state when h/λ > 0.145. The results obtained by FSEM(J) were analyzed in detail. To make the analysis more convincing, field pattern distribution and the propagation distribution of a few special points and the representative points at different stages are presented; 0.1101 < h/λ < 0.1116 (that is 500 nm > λ > 492 nm) is a multi-mode stage. At that stage, the even mode distribution map for each frequency has 2–4 different modes. When h/λ = 0.1108, i.e., the point 496 nm where the phase constant value is the largest in the first jump portion, its even mode distribution map displays four different modes; the order is 10−3 and 10−2, though there are orders 10−2. At this frequency, the light can be propagated because the formation of the propagation map may cover four modes, or the first mode (order 10−3) may be selected. The field pattern distribution and the propagation distribution representing the wavelength of 496 nm are given below, as shown in Figure 4 and Figure 5. It can be used for multi-mode communication, integrated filters of single multi-mode combination, etc., in that frequency range. The other propagation stages, only exist in the form of a single mode that can be used for a waveguide, sensor, etc. Below, we give an example: at h/λ = 0.133; i.e., λ = 413 nm; field pattern distribution and propagation distribution representing the wavelength of 413 nm (Figure 6 and Figure 7). The second jump is caused by the jitter variation of the permittivity and the effect of the structure. In this jump range, the highest point is h/λ = 0.165, the wavelength is 330 nm, and the order is 10−1. It is suggested that when h/λ > 0.145, the trend of the imaginary part increases, decreases, and then increases, so the corresponding propagation distribution is attenuation–cutoff–attenuation–cutoff. Figure 8 and Figure 9 show the field pattern distribution and propagation distribution at a wavelength of 292 nm, and the propagation distribution of this frequency is attenuated. The field pattern distribution and propagation distribution for a wavelength of 191 nm are shown in Figure 10 and Figure 11, suggesting that light does not propagate at this frequency. It can be used for filters, nanomirrors, nanoprobes, etc., when h/λ > 0.145. For the other three sets of results, it was found that they just exist in the form of single mode, and that there is no multimode. When using the Palik experimental data, by observing the dielectric constant, it was found that there are two places to jump: one of them is around the wavelength of 340 nm, which can be clearly seen from the complex propagation constant of Figure 2; the other part of the jump is around 1200 nm. Those results are because the wavelength is relatively large, the frequency is very small, and the corresponding order is about 10−5, so no obvious jump change can be seen from the complex propagation-constant graph. Figure 12 and Figure 13 show the field pattern distribution and propagation distribution corresponding to the frequency of 496 nm using the Palik experimental data with only single mode, which can be compared with Figure 4 and Figure 5.
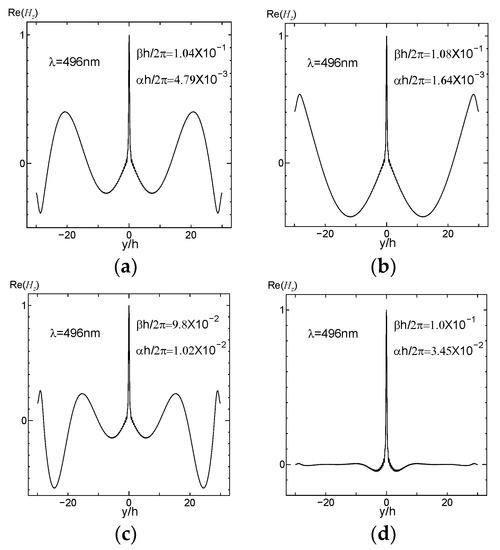
Figure 4.
Distribution of the Hz field as a function of the y coordinate representing the wavelength of 496 nm. (a) Even mode 1; (b) even mode 2; (c) even mode 3; (d) even mode 4.
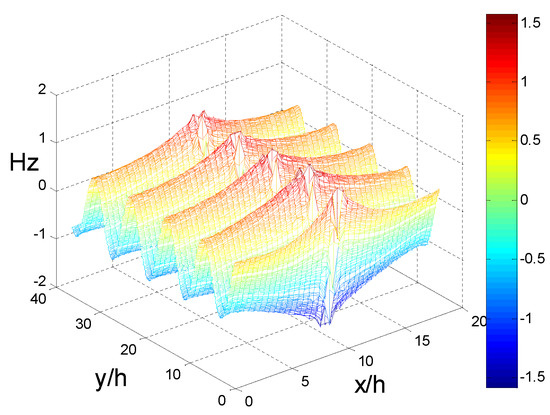
Figure 5.
Near field propagation distribution representing the wavelength of 496 nm.
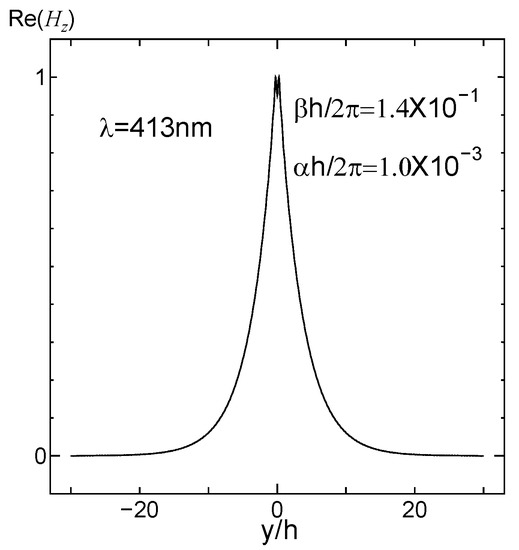
Figure 6.
Distribution of the Hz field as a function of the y coordinate representing the wavelength of 413 nm.
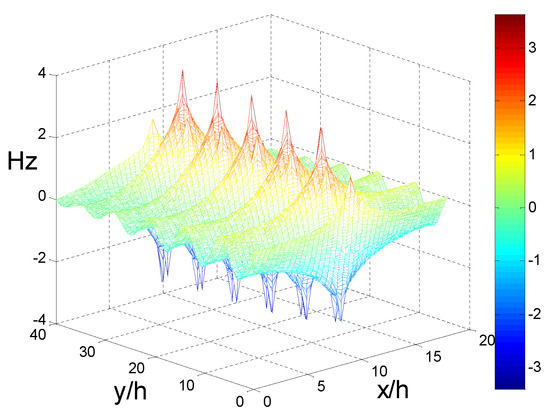
Figure 7.
Near field propagation distribution representing the wavelength of 413 nm.
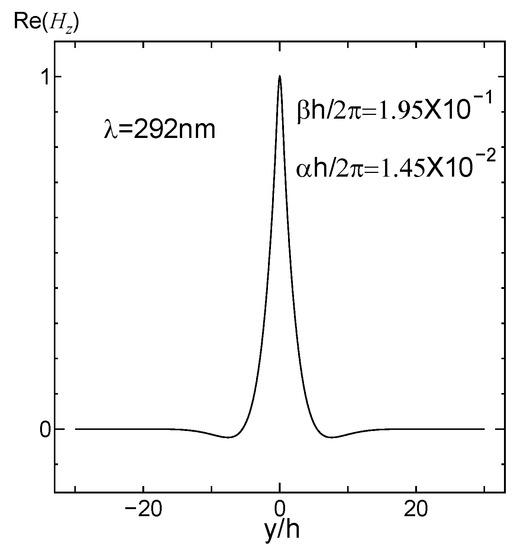
Figure 8.
Distribution of the Hz field as a function of the y coordinate representing the wavelength of 292 nm.
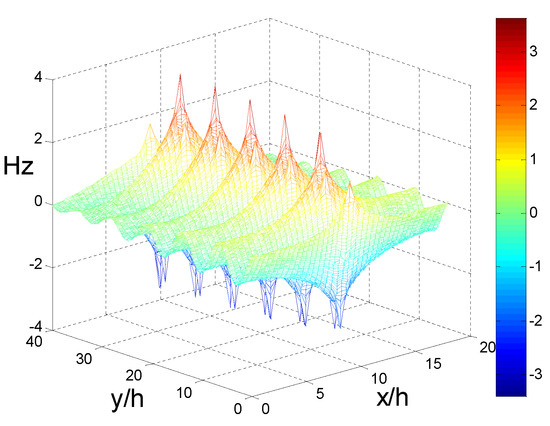
Figure 9.
Near field propagation distribution representing the wavelength of 292 nm.
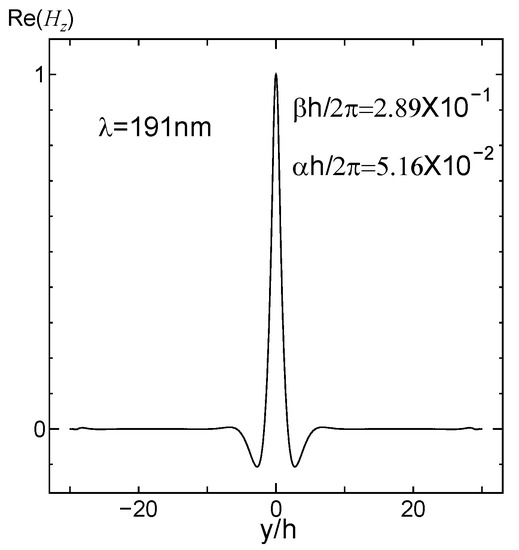
Figure 10.
Distribution of the Hz field as a function of the y coordinate representing the wavelength of 191 nm.
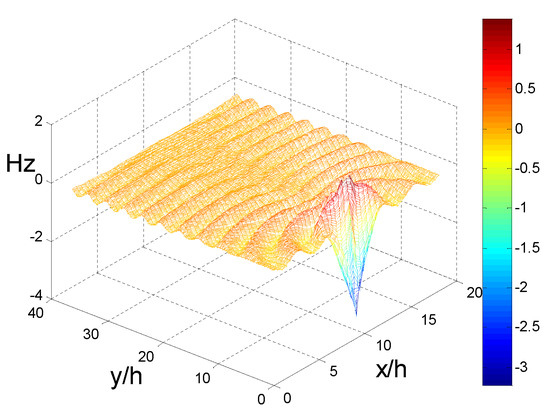
Figure 11.
Near field propagation distribution representing the wavelength of 191 nm.
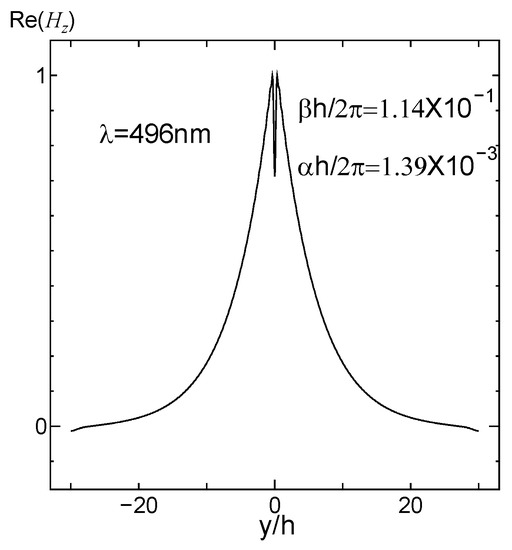
Figure 12.
Distribution of the Hz field as a function of the y coordinate representing the wavelength of 496 nm (Palik experimental data).
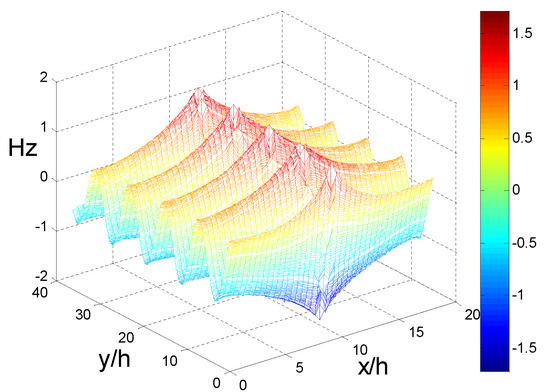
Figure 13.
Near field propagation distribution representing the wavelength of 496 nm (Palik experimental data).
4. Conclusions
In this paper, the complex propagation constants of metallic silver circular chain structures were studied in depth. According to the complete result plot, the propagation region (h/λ < 0.145) and the attenuation-cutoff region (h/λ > 0.145) were obtained. In the case of FSEM(J), it was found that in the frequency range of 492 nm < λ < 500 nm, there is a special phenomenon of multi-mode, which can be applied to new multi-mode communication and multi-mode transceivers, single-mode combined integrated filters, and other devices. However, in the other three results of FSEM(P), GSM(J), and FSEM(D-L), only single mode exists. In the study on a limited array of only 40 silver nanorods, the ability of the finite array to be guided by plane waves at specific wavelengths was explored. According to different guided wave capabilities (e.g., propagation, attenuation, and cutoff), it can be used in waveguide, multi-mode communication, integrated filters of a single and multi-mode combination, sensor, filters, nanomirrors, and other devices.
Author Contributions
Data curation, C.Z.; Project administration, D.Z.
Funding
This research was funded by the National Natural Science Foundation of China, grant number 31170668, and the Postgraduate Research and Practice Innovation Program of Jiangsu Province.
Conflicts of Interest
The authors declare no conflicts of interest.
References
- Yasumoto, K.; Miyamoto, T.; Momoda, M. Full-Wave Analysis of Optical Waveguides Using Periodic Boundary Conditions; SPIE: Bellingham, WA, USA, 1999; Volume 3666, pp. 170–176. [Google Scholar]
- Miyamoto, T.; Momoda, M.; Yasumoto, K. Full-vectorial analysis of connection problem in optical fiber. IEEJ Trans. Fundam. Mater. 2002, 122, 39–46. [Google Scholar] [CrossRef]
- Twersky, V. Multiple scattering of waves and optical phenomena. J. Opt. Soc. Am. 1962, 52, 145. [Google Scholar] [CrossRef] [PubMed]
- Ohtaka, K.; Numata, H. Multiple scattering effects in photon diffraction for an array of cylindrical dielectric. Phys. Lett. A 1979, 73, 411–413. [Google Scholar] [CrossRef]
- Cao, Q.; Lalanne, P. Negative Role of Surface Plasmons in the Transmission of Metallic Gratings with Very Narrow Slits. Phys. Rev. Lett. 2002, 88, 057403. [Google Scholar] [CrossRef] [PubMed]
- Yasumoto, K. (Ed.) Electromagnetic Theory and Applications for Photonic Crystals; CRC Press: Boca Raton, FL, USA, 2005. [Google Scholar]
- Yasumoto, K.; Jandieri, V.; Liu, Y. Coupled-mode formulation of two-parallel photonic-crystal waveguides. J. Opt. Soc. Am. A 2013, 30, 96–101. [Google Scholar] [CrossRef] [PubMed]
- Takakura, Y. Optical Resonance in a Narrow Slit in a Thick Metallic Screen. Phys. Rev. Lett. 2001, 86, 5601–5603. [Google Scholar] [CrossRef] [PubMed]
- Yang, F.; Sambles, J.R. Resonant transmission of microwaves through a narrow metallic slit. Phys. Rev. Lett. 2002, 89, 063901. [Google Scholar] [CrossRef] [PubMed]
- Nemec, H.; Kuzel, P.; Coutaz, J.-L.; Ctyroky, J. Transmission properties and band structure of a segmented dielectric waveguide for the terahertz range. Opt. Commun. 2007, 273, 99–104. [Google Scholar] [CrossRef]
- Zhang, D.; Mase, A. A Formula for Fourier Series Expansion Method with Complex Coordinate Stretching Layers. J. Infrared Millim. Terahertz Waves 2011, 32, 196–203. [Google Scholar]
- Yasumoto, K.; Watanabe, K.; Ishihara, J. Numerical analysis of optical waveguides using Fourier series expansion: Application of perfectly matched layer. Proc. Int. Symp. Recent Adv. Microw. Technol. 1999, 1999, 589–592. [Google Scholar]
- Zhang, D.; Jandieri, V.; Yasumoto, K. Modal analysis of wave guidance by a periodic chain of circular rods. In Proceedings of the 2016 Progress in Electromagnetics Research Symposium (PIERS), Shanghai, China, 8–11 August 2016. [Google Scholar]
- Benisty, H. Modal analysis of optical guides with two-dimensional photonic band-gap boundaries. J. Appl. Phys. 1996, 79, 7483–7492. [Google Scholar] [CrossRef]
- Yasumoto, K.; Jia, H.; Sun, K. Rigorous analysis of two-dimensional photonic crystal waveguides. Radio Sci. 2005, 40, 1–7. [Google Scholar] [CrossRef]
- Xu, Y.; Lee, R.K.; Yariv, A. Adiabatic coupling between conventional dielectric wave-guides and waveguide with discrete translational symmetry. Opt. Lett. 2000, 25, 755–757. [Google Scholar] [CrossRef] [PubMed]
- Happ, T.D.; Kamp, M.; Forchel, A. Photonic crystal tapers for ultracompact mode conversion. Opt. Lett. 2001, 26, 1102–1104. [Google Scholar] [CrossRef] [PubMed]
- Talneau, A.; Lalanne, P.; Agio, M.; Soukoulis, M.C. Low-reflection photonic-crystal taper for efficient coupling between guide sections of arbitrary widths. Opt. Lett. 2002, 27, 1522–1524. [Google Scholar] [CrossRef] [PubMed]
- Akahara, J.; Yamagishi, S.; Taki, H.; Morimoto, A.; Kobayashi, T. Guiding of a one-dimensional optical beam with nanometer diameter. Opt. Lett. 1997, 22, 475–477. [Google Scholar] [CrossRef] [PubMed]
- Maier, S.A.; Kik, P.G.; Atwater, H.A.; Meltzer, S.; Harel, E.; Koel, B.E.; Requicha, A.A.G. Local detection of electromagnetic energy transport below the diffraction limit in metal nanoparticle plasmon waveguides. Nat. Mater. 2003, 2, 229–232. [Google Scholar] [CrossRef] [PubMed]
- Quinten, M.; Leitner, A.; Krenn, J.R.; Aussenegg, F.R. Electromagnetic Energy Transport via Linear Chains of Silver Nanoparticles. Opt. Lett. 1998, 23, 1331–1333. [Google Scholar] [CrossRef] [PubMed]
- Brongersma, M.L.; Hartman, J.W.; Atwater, H.A. Electromagnetic Energy Transfer and Switching in Na noparticle Chain Arrays below the Diffraction Limit. Phys. Rev. B 2000, 62, R16356–R16359. [Google Scholar] [CrossRef]
- Krenn, J.R.; Lamprecht, B.; Ditlbacher, H.; Schider, G.; Salerno, M.; Leitner, A.; Aussenegg, F.R. Non-diffraction-limited light transport by gold nanowires. Europhys. Lett. 2002, 60, 663–669. [Google Scholar] [CrossRef]
- Kim, J.W.K. Excitation and Propagation of Surface Plasmons in a Metallic Nanoslit Structure. IEEE Trans. Nanotechnol. 2008, 7, 229–236. [Google Scholar]
- Gong, Y.K.; Liu, X.M.; Wang, L.R.; Lu, H.; Wang, G.X. Multiple responses of TPP-assisted near-perfect absorption in metal/Fibonacci quasiperiodic photonic crystal. Opt. Express 2011, 19, 9759–9769. [Google Scholar] [CrossRef] [PubMed]
- Nagasaki, A.; Saitoh, K.; Koshiba, M. Polarization characteristics of photonic crystal fibers selectively filled with metal wires into cladding air holes. Opt. Express 2011, 19, 3799–3808. [Google Scholar] [CrossRef] [PubMed]
- Madani, A.; Entezar, S.R. Optical properties of one-dimensional photonic crystals containing graphene-based hyperbolic metamaterials. Photonics Nanostruct.-Fundam. Appl. 2017, 25, 58–64. [Google Scholar] [CrossRef]
- Zhang, H.F. Three-dimensional function photonic crystals. Phys. B Phys. Condens. Matter 2017, 525, 104–113. [Google Scholar] [CrossRef]
- Miyamoto, T.; Momoda, M.; Yasumoto, K. Numerical Analysis for Three-Dimensional Optical Waveguides with Periodic Structure Using Fourier Series Expansion Method. Electron. Commun. Jpn. 2003, 86, 22–31. [Google Scholar] [CrossRef]
- Jia, H.; Zhang, D.; Yasumoto, K. Fast analysis of optical waveguides using an improved Fourier series method with perfectly matched layer. Microw. Opt. Technol. Lett. 2005, 46, 263–268. [Google Scholar] [CrossRef]
- Zhang, D.; Jia, H. Numerical analysis of leaky modes in two-dimensional photonic crystal waveguides using Fourier series expansion method with perfectly matched layer. IEICE Trans. Electron. 2007, 90, 613–622. [Google Scholar] [CrossRef]
- William, L.B.; Alain, D.; Thomas, W.E. Surface plasmon subwavelength optics. Nature 2003, 424, 824–830. [Google Scholar]
- Li, L. Use of Fourier series in the analysis of discontinuous periodic structures. J. Opt. Soc. Am. A 1996, 13, 1870–1876. [Google Scholar] [CrossRef]
- Palik, E.D. Handbook of Optical Constants of Solids; Academic: San Francisco, CA, USA, 1998. [Google Scholar]
- Johnson, P.; Christy, R. Optical Constants of the Noble Metals. Phys. Rev. B 1972, 6, 4370–4379. [Google Scholar] [CrossRef]
- Laroche, T.; Girard, C. Near-field optical properties of single plasmonic nanowires. Appl. Phys. Lett. 2006, 89, 233119. [Google Scholar] [CrossRef]
- Jiang, H.L.; Liu, Q.N. Study on characteristics of optical tamm state by drude-lorentz model. Semicond. Optoelectron. 2016, 37, 218–222. [Google Scholar]
- Su, J.; Sun, C.; Wang, X.Q. A metallic dispersion model for numerical simulation. J. Optoelectron. Laser 2013, 24, 408–411. [Google Scholar]
- Rahbarihagh, Y.; Kalhor, F.; Rashed-Mohassell, J.; Shahabadi, M. Modal Analysis for a Waveguide of Nanorods Using the Field Computation for a Chain of Finite Length. Appl. Comput. Electromagn. Soc. J. 2014, 29, 140–148. [Google Scholar]
© 2019 by the authors. Licensee MDPI, Basel, Switzerland. This article is an open access article distributed under the terms and conditions of the Creative Commons Attribution (CC BY) license (http://creativecommons.org/licenses/by/4.0/).