Article

Design of Electroporation Process in Irregularly Shaped Multicellular Systems

by
Luciano Mescia
1,*,†,
Michele Alessandro Chiapperino
1,†,
Pietro Bia
2,†,
Claudio Maria Lamacchia
1,†,
Johan Gielis
3,† and
Diego Caratelli
4,†
1
Department of Electrical and Information Engineering, Politecnico di Bari, via E. Orabona 4, 70125 Bari, Italy
2
Design Solution Department, Elettronica S.p.A., Via Tiburtina Valeria Km 13,700, 00131 Rome, Italy
3
Department of Bioengineering, University of Antwerp, Groenenborgerlaan 171, 2020 Antwerp, Belgium
4
The Antenna Company Nederland B.V., HighTech Campus 41, 5656 AE Eindhoven, The Netherlands
*
Author to whom correspondence should be addressed.
These authors contributed equally to this work.
Electronics 2019, 8(1), 37; https://doi.org/10.3390/electronics8010037
Submission received: 16 November 2018 / Revised: 19 December 2018 / Accepted: 20 December 2018 / Published: 1 January 2019
(This article belongs to the Section Bioelectronics)

Abstract

:
Electroporation technique is widely used in biotechnology and medicine for the transport of various molecules through the membranes of biological cells. Different mathematical models of electroporation have been proposed in the literature to study pore formation in plasma and nuclear membranes. These studies are mainly based on models using a single isolated cell with a canonical shape. In this work, a space–time (x,y,t) multiphysics model based on quasi-static Maxwell’s equations and nonlinear Smoluchowski’s equation has been developed to investigate the electroporation phenomenon induced by pulsed electric field in multicellular systems having irregularly shape. The dielectric dispersion of the cell compartments such as nuclear and plasmatic membranes, cytoplasm, nucleoplasm and external medium have been incorporated into the numerical algorithm, too. Moreover, the irregular cell shapes have been modeled by using the Gielis transformations.

1. Introduction

Acoustic, electric, magnetic or optical fields are used for the physical manipulation of biological cells. AC, DC or pulsed electric fields (PEFs) are adopted for the electromanipulation of biological cells in various applications, such as dielectrophoresis, electrorotation, electrodeformation, electrodisruption and electroporation [1]. Several methods including mechanical (microinjection), chemical (lipofection reagents), biological (viral vectors) and physical (sonoporation, magnetofection, electroporation) phenomena have been developed to facilitate the transport of molecules through the cell membrane [2]. In particular, during the past four decades electroporation (EP) technique has gained increasing importance in biology and in medicine [3]. EP is a non-thermal electric phenomenon in which an external PEF triggers the creation of pores on cellular membranes leading to an increase of the membrane permeability [4]. This phenomenon has been used in biotechnology to incorporate various molecules such as genes [5], DNA [3], RNA [6], proteins [7], drugs [8], antibodies [9] and fluorescent probes [10] into many different types of cells, like bacterial [11], yeast [12], plant [13] and mammalian [14] cells. Moreover, EP can be used for achieving selective killing of cancer cells, tissue ablation as well as for water preservation and non-thermal food processing [1,15,16,17]. Although EP is commonly used in biotechnology and medical applications, the molecular and cellular mechanisms of pore formation and stabilization during the electropermeabilization of membranes are still not fully understood and there are often discrepancies between experimental data and theoretical descriptions of pores creation [18]. Furthermore, the EP effectiveness depends on the cell type, specific structure of the biological membrane, the arrangement of the multicellular system as well as it is associated to the parameters defining the applied electric pulses such as the number, duration, frequency and intensity of the electric field [19,20]. Taking into account the EP effectiveness constraints and considering that the experimental measurements of the transmembrane voltage (TMV) is essentially limited by the thinness of the cell membrane as well as by the range of pulse duration, a numerical approach is often chosen to give a realistic description of the electric phenomena involved during EP process. A number of numerical models are available in the literature [21,22,23,24] but, to overcome computational difficulties, each one suffers of some limitations. More precisely, the main problems concerning the calculation of the local electric field and the TMV lie in the thinness of the membrane, in the high contrast between the electric properties of the cytoplasm and the cell membrane, and in the different time-domain dielectric response of the cell compartments. In fact, even if the high frequency electric permittivities of cell media are of the same order of magnitude, the static permittivity as well as the conductivity of the plasma and nuclear membranes are much lower than the cytoplasm, nucleoplasm, and extracellular medium ones. Other approximations refer to the cells media having stationary dielectric properties which could lead to significant errors especially when nanosecond PEFs are used. On the other hand, the relaxation times characterizing the dielectric response of the plasma and nuclear membranes are much higher than those of the cytoplasm, nucleoplasm and extracellular media. As a result, further model complexity needs to be taken into account when subnanosecond electric pulses are applied. Finally, most of the numerical computations deal with unrealistic spherical and ellipsoidal cells. Such approximation, strongly affects the model effectiveness since the cell geometry and shape as well as its orientation respect to the direction of the applied electric field have a significant influence on the electric field and current distributions [25,26,27]. Because of these modeling weaknesses and with the aim to perform computations on complex cell systems, we present here a full-dispersive and space–time multiphysics numerical model for computing the electric potential, current density, TMV, and pore density in multicellular structures with irregular shaped cells. In particular, it is based on the space–time (x,y,t) quasistatic formulation of the Maxwell’s equations and the nonlinear Smoluchowski’s equation describing the pore dynamics. The irregular cell geometry has been modelled by incorporating in the numerical algorithm the unified geometrical description provided by the Gielis’ superformula [28,29,30]. The dielectric dispersion of each cell medium has been modelled considering the multi-relaxation Debye-based relationship. The packed and sparse cell systems consisting of irregular nucleated cells have been investigated. In particular, the effects of the neighboring cells on TMV, pore density, and electroporation relative length (EPRL) have been studied in detail.

2. Mathematical Formulation

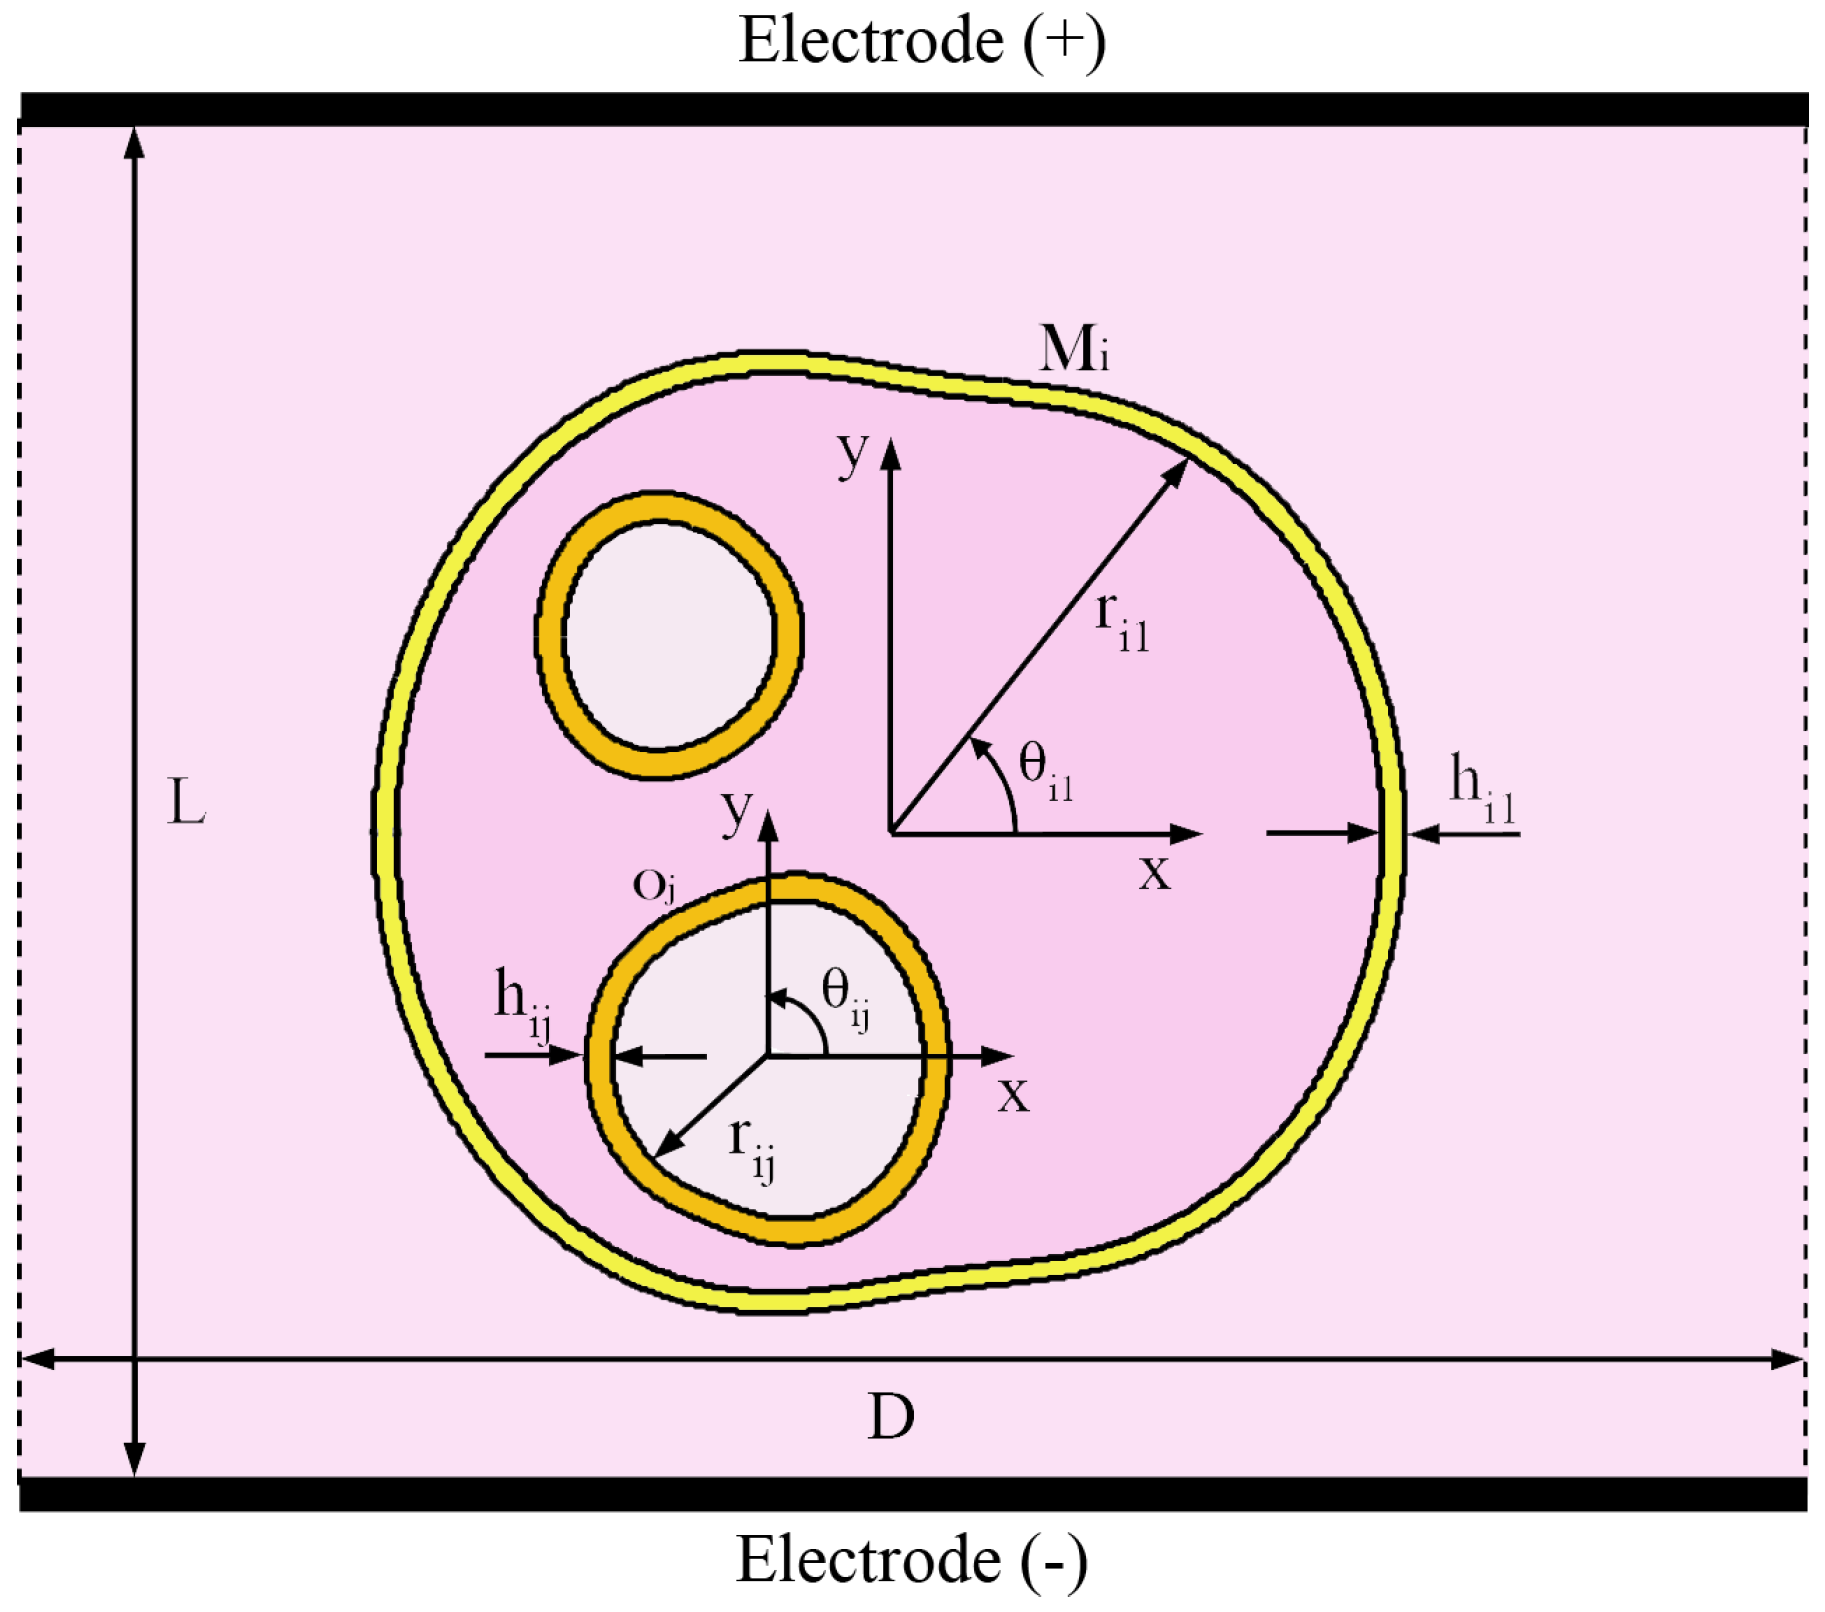
2.1. Cells Geometry Model

Actually, in most numerical computations, the cell is modeled as a medium of regular shape without any corner. To overcome such drawback, in the developed numerical modeling a realistic multicellular structures having irregular geometry have been investigated. In particular, it consists of p cells with an inner membrane system, which constitutes boundary membranes of various organelles such as nucleus, mitochondria, endoplasmic reticulum, etc. Figure 1 shows the detail of the generic i-th cell having the plasma membrane and q intracellular organelle membranes. The radius vector describing each membrane profile has been modeled by using the Gielis’ superformula [28,29,30] given by:
r i , j = r ^ i , j x i , j 2 + y i , j 2
x i , j = A i , j R i , j θ i , j cos θ i , j
y i , j = B i , j R θ i , j sin θ i , j
R i , j θ i , j = | cos m i , 2 j 1 θ i , j / 4 a i , 2 j 1 | n i , 2 j 1 + | sin m i , 2 j θ i , j / 4 a i , 2 j | n i , 2 j 1 b i , j
where i = 1 , , p and j = 1 , , q , p and M = p q being the total number of cells and membranes, respectively, θ i , j π , π is the polar angle characterizing the local coordinates system, m i , 2 j 1 , m i , 2 j , n i , 2 j 1 , n i , 2 j and b i , j R + (positive real numbers), a i , 2 j 1 and a i , 2 j R 0 + (strictly positive real numbers), A i , j and B i , j are appropriate scaling factors. The unified geometrical description provided by Gielis’ transformation allows the tailoring of the irregular membrane shape using analytical formula as well as it translates into the possibility of building a flexible tool to carry out a sensitive analysis to geometrical parameter variations. However, including an offset angle θ i , j 0 , Equations (2)–(4) can be easily extended to study cells with different orientation. Finally, taking into account that the superformula has been used to model the shape and size of each cell forming the whole multicellular system, it is also possible to build more complex arrangements employing multishape cells.

2.2. Complex Permittivity Model

The interaction between PEF and the dielectric cell media takes place in different relaxation processes such as reorientation of dipolar molecules (water molecules, headgroups of membrane lipids), interfacial polarization, ionic diffusion (with respect to ions of different signs of charges), conductivity of surface cell structures (cytoplasmic membrane and electrical double layer), and motion of the molecules. Their resulting behavior causes a frequency dispersion pattern of permittivity and conductivity of the materials forming the cell compartments [31,32]. The membrane relaxation at low frequency ( α -dispersion) is caused by the sarcoplasmic reticulum, gap junctions, and counterion relaxation. Instead, the relaxation at radio frequency ( β -dispersion) is mainly due to Maxwell–Wagner effect at the interface between the intra or extracellular solution and the phospholipid membrane. Moreover, because of their smaller size the dispersion of organelles gives an additional contribution to the tail of the β -dispersion [33].
The analytical theory of the permittivity dispersion of biological cells covering a variety of frequency ranges and bandwidths is constructed using the generalized response function, R ( ω ) , through the following relation
R ( ω ) = ε ( ω ) ε Δ ε
where ε ( ω ) is the frequency-dependent complex relative permittivity, ε is the asymptotic permittivity ( ω ), Δ ε is the dielectric strength. Many efforts have been made to model the dielectric spectra of biological cells and a well reproduction of the experimental measurements can be obtained by using the multi–relaxation Debye expression
R ( ω ) = s = 1 S 1 1 + j ω τ s
where τ s is the relaxation time relevant to s-th relaxation process, S is the number of dielectric relaxation processes.
The developed numerical model takes into account the time-dependent dielectric response of the cell media. In particular, with reference to the generic cell, the dielectric response of the extracellular medium (Ex), cytoplasm and plasma of internal organelles (Pc) has been modeled using the first order Debye relationship ( S = 1 ). On the other hand, the dielectric response of the cell membranes (Mn) has been modeled employing the second order Debye relationship ( S = 2 ). In linear and isotropic medium, the frequency domain equation defining the polarization field, P, as a function of the electric field, E, is
P ( ω ) = [ ε ( ω ) ε 0 ] E ( ω )
where ε 0 is the permittivity of the free space. Considering that the proposed algorithm solves equations directly in time domain it is essential to derive the time-dependent dielectric response of the cell media. To this aim, by putting Equation (6) in Equation (7) and taking the inverse Fourier transform, the time domain differential equation relating the fields P and E can be obtained. In particular, the temporal evolution of the polarization vectors has been calculated by solving the following differential equations for each cell compartment
P Ex + τ Ex P Ex t = ( Δ ε Ex + ε ε 0 ) E + ( ε ε 0 ) τ Ex E t
P Pc i , j + τ Pc i , j P Pc i , j t = ( Δ ε Pc i , j + ε ε 0 ) E + ( ε ε 0 ) τ Pc i , j E t
a 2 , Mn 2 P Mn t 2 + a 1 , Mn P Mn t + P Mn = b 2 , Mn 2 E t 2 + b 1 , Mn E t + b 0 , Mn E
where
a 1 , Mn = τ 1 , Mn + τ 2 , Mn
a 2 , Mn = τ 1 , Mn τ 2 , Mn
b 0 , Mn = Δ ε 1 , Mn + Δ ε 2 , Mn + ε ε 0
b 1 , Mn = ( Δ ε 2 , Mn + ε ε 0 ) τ 1 , Mn + ( Δ ε 1 , Mn + ε ε 0 ) τ 2 , Mn
b 2 , Mn = ( ε ε 0 ) τ 1 , Mn τ 2 , Mn
In Equations (9)–(15), Mn = M i , i = 1 , , p , indicates the plasma membrane of the i-th cell and Mn = O j , j = 1 , , M p , indicates the organelles membrane as well as Pc i , j denotes the plasma. The coefficients of the differential Equations (8)–(10) depend on the dielectric properties of each cell compartment. As a result, the developed numerical code can be used to study different cells with various electric and dispersive features.

2.3. Electromagnetic Model

Maxwell equations for a dispersive dielectric material can be written as
× H = ε 0 E t + P t + σ E
× E = μ 0 H t
This vector system is quite complex to solve, especially for realistic multicellular structures. However, due to the cell small size the time-variation of the magnetic field can be neglected leading to a × E = 0 . As a consequence, the electric field E can be derived from a scalar potential ϕ using the equation
E = ϕ
Then, rearranging Equation (16), the following partial differential equation can be derived
· ε 0 ϕ t + σ ϕ P t = 0
where σ is the static ionic conductivity. Moreover, because of the equation of continuity · J = 0 has to be satisfied, the following boundary conditions are imposed
n ^ · J | Γ + J | Γ = 0
where
J = σ + ε 0 t E + P t
Γ + , Γ are the outer and inner boundaries of the cell membranes, respectively, and the normal vector n ^ is taken outgoing the membrane boundary. In the simulations, the pulsed electric field is generated by using two parallel-plate electrodes placed at the top and bottom of the cell system (see Figure 1) and the electric potential for each cell compartment has been calculated by numerically solving Equation (19). Finally, the TMV is calculated as the difference between the electric potential on the inner and outer boundaries of each cell membrane:
TMV i , j ( x , y , t ) = ϕ i , j ( x , y , t ) ϕ i , j + ( x , y , t )

2.4. Pore Model

Exposure to applied external electrical field leads to an increase of the TMV, which by means of the membrane poration phenomenon induces an increase of the membrane conductivity. Increased membrane conductivity, in turn, affects the TMV temporal evolution. Modeling both membrane poration and permeabilization consists in deriving equations governing the changes of pore density and membrane conductivity. To this aim, in the developed numerical modeling the dynamic of pore formation is described by the asymptotic Smoluchowski’s equation [34]:
N i , j t = α e TMV i , j V e p 2 1 N i , j N 0 e β TMV i , j V e p 2
where N i , j is the pore density, α and β are EP parameters, V e p is the threshold membrane voltage above which electroporation occurs, N 0 is the pore density at rest, when TMV = 0.
The membranes conductivity due to the pore formation non-linearly depends on the TMV. In particular, it is evaluated at each time step and spatial coordinate as follows [21,22]:
σ m i , j ( x , y , t ) = σ 0 , Mn + K N i , j ( x , y , t ) σ p , Mn π r p 2
where σ 0 , Mn is the membrane conductivity at rest, σ p , Mn and r p are the internal conductivity and radius of a single pore, respectively, and
K = e ν m i , j 1 w 0 e w 0 η ν m i , j η ν m i , j w 0 η ν m i , j e ν m i , j w 0 e w 0 + η ν m i , j + η ν m i , j w 0 + η ν m i , j
where w 0 is the energy barrier inside the pore, η is the relative length of pore entrance area, ν m i , j = ( q e / k T ) TMV i , j is the non-dimensional TMV, where q e is the electron charge and k the Boltzmann constant.

3. Results and Discussion

Using the numerical model previously described, the electroporation process has been studied for two types of multicellular arrangements: packed system (see Figure 2a) and sparse system (see Figure 2b).
Each system is constituted by seven nucleated muscular-like cells ( p = 7 ) and M = 14 membranes. The smooth muscle cell has been chosen as it is nucleated. Moreover, its complex shape justifies the need to implement the Gielis’ superformula for a detailed geometrical modelling using a simple mathematical formulation. The shape of the plasma membrane has been modeled by using the superformula parameters A 1 = 4 μ m , B 1 = 7.5 μ m , m 1 = m 2 = 2 , n 1 = n 2 = 0.8 , a 1 = a 2 = 1 and b 1 = 0.6 . As underlined in Section 2, the implementation of the superformula enables a broad capability to model the geometry of multicellular systems with different shaped plasma membranes and organelles. Such task can be realized by a suitable choice of the superformula parameters characterizing each membrane. Moreover, employing a series of superformulas with non-linear special functions [35] it may be possible to reproduce the borders of more complex shape as endoplasmatic reticulum. In the present study, a nucleus centered in the middle of each cell having a superellipse shape with semi-axis A 2 = 0.75 μ m , B 2 = 1.5 μ m has been implemented. Table 1 reports the Cartesian coordinates ( x s , y s ) of the center of each cell with respect to the origin for both the packed and the sparse systems.
In our study, both the packed and sparse systems are inside a square computational domain with size 100 × 100 μ m 2 . The dispersion properties of all M membranes have been modeled using the same second order Debye expression. This choice can be justified considering that the relaxation phenomena of the nuclear membrane are likely due to the same polarization mechanisms of the plasma membrane. For the extracellular medium, cytoplasm and nucleoplasm the first order Debye expression has been used. The polarization, geometric, electric and electroporation parameters used in the simulations are summarized in Table 2. The pulse parameters, such as frequency spectrum and power, can be adjusted to obtain the most efficient electroporation for plasma and nuclear membranes. In a previous work [27], an extensive parametric study was carried out with the aim to evaluate the effects of the electric field intensity, number and pulse duration on the EP process. Therefore, in our specific case the biological systems are exposed to a PEF having rectangular shape with amplitude E = 100 k V / c m , duration T = 10 n s , rise time t r = 0.9 n s and fall time t f = 0.9 n s .
Firstly, considering the isolated nucleated muscular cell, the temporal evolutions of plasma and the nuclear pore density for θ = 75 have been evaluated using the dispersive and nondispersive model. This angle has been chosen because at such angular position the plasma and the nuclear membrane are both significantly electroporated. By the obtained results shown in Figure 3a, it can be inferred a relevant difference between the dispersive and nondispersive model. With reference to the packed system, Figure 4 shows the time response of the TMV and pore density at the angular placement θ = 75 for both plasma and nuclear membranes. As a consequence of the external pulse application, the TMV increases approximately to 1.4 V for each cell. In particular, by an inspection of Figure 4a,c it is evident that the TMV and the resulting activation of electroporation occur faster in the nuclear membranes. This occurrence is emphasized when nanoseconds pulses are used. In the present discussion, the cells membranes are considered to be significantly electroporated when the pore density reaches a value of 10 14 m 2 [21]. As a consequence, the plasma membrane of each cell is electroporated with exception of the cell 5 (see Figure 4b). Furthermore, the electroporation activation for the plasma membrane of each cell occurs in different time instants resulting in the following sequence: cell 7 and cell 6, cell 2, cell 3, cell 4, cell 1, cell 5 (no electroporated). Instead, from Figure 4d it can be inferred that the nuclear membranes are all significantly electroporated at the same time instant and just after the pulse rising ends. In detail, the pores creation drives a growth of the membrane conductivity leading to a fast depletion of the TMV during the pulse fall time. The quickness of TMV decrease depends on the cell placement, geometrical shape and size of the considered membrane as well as by the mutual interaction between the cells. In the specific, as the nuclear membranes have a regular geometry, small size and a relevant electroporation, they are characterized by a more evident TMV depletion than plasma membranes.
Figure 5 shows the spatial distribution of the TMV and pore density on cell membranes at time instant t = 20 n s . Furthermore, Figure 6 and Figure 7 report the pore density versus the polar angle at time instant t = 20 ns for the plasma and the nuclear membranes of each cell, respectively. As reported in Figure 5b, the EP process originates within of the smoothed region of the plasma membrane of each cell becoming negligible at the equatorial ( θ = 0 and θ = 180 ) and sharp ( θ = ± 90 ) zones. Moreover, it is worth to notice that the pore density on the plasma perimeter concerning the cell 1, cell 2, cell 3, cell 5, cell 6, and cell 7 has an asymmetric distribution. In fact, the electric field and current paths strongly depend on the cell shape and arrangement. Moreover, because of the cell packing, the electric field shielding and coupling phenomena affect the TMV distribution (see Figure 5a). On the other hand, since the central position of the cell 4 the corresponding pore density of the plasma membrane has a symmetric distribution (see Figure 6d). The EPRL, i.e., the ratio between the length of the electroporated region and the total length of the cell membrane, changes, too. In fact, the cell 1, cell 2, cell 3, cell 5, cell 6, and cell 7 have an EPRL value of about 37% and a lower value of about 24% characterizes the cell 4. For the nuclear membranes, the pore density has a peak at the top and the bottom ( θ = ± 90 ) being entirely negligible at the equatorial ( θ = 0 and θ = 180 ). The nuclear EPRL of cell 1 and cell 7 is about 56.5%. Furthermore the nuclear EPRL of cell 2, cell 3, cell 5 and cell 6 is about 58%. Finally, the pore density of the nuclear membrane is symmetric only for cell 4 (see Figure 7d), exhibiting an EPRL value of about 53.6%. Table 3 summarizes the simulation results pertaining both the plasma and nuclear EPRL.
With reference to the sparse system, Figure 8 illustrates the temporal evolution of TMV and pore density at the angular placement θ = 75 for both plasma and nuclear membranes. Also in this case, the increase of TMV and the resulting activation of EP occur faster in the nuclear membranes. As it can be inferred by an inspection of Figure 8b, the time instant corresponding to the full electroporation of the plasma membrane depends on the cell placement and the activation sequence is cell 6, cell 3, cell 7, cell 4, cell 2, cell 1, cell 5. In contrast to the packed system, in the sparse one all the cells are electroporated. This occurrence can be explained by considering that both the electric field shielding and coupling are weakened. However, also in this case, the nuclear membranes are significantly electroporated at the same time instant.The spatial distribution of the TMV and pore density on cell membranes at time instant t = 20 n s are reported in Figure 9. Moreover, Figure 10 and Figure 11 report the pore density versus the polar angle at time instant t = 20 n s for the plasma and the nuclear membranes of each cell, respectively. Also in this case, the electroporation process takes place within the smoothed region of the plasma membranes but, respect to the packed system, a symmetric spatial distribution occurs. In fact, because of the lower density the interference due to neighboring cells is mitigated. In order to better justify such statement, in Figure 12 and Figure 13 have been reported the numerical results concerning the spatial distribution of the electric field and current density, respectively. The obtained numerical results highlight in the packed system the electric field and current flow are strongly affected by the neighboring cells.
The cell arrangement also affects the EPRL of the plasma membrane and, in Table 4 the calculated values have been reported. It can be observed that in the sparse system the plasma membranes have an higher value of EPRL around 48%. On the other hand, the EPRL of the nuclear membranes slightly increases respect the values characterizing the packed system.
Finally, with the aim to highlight the broad capability of the developed numerical model to manage more complex cellular configurations in Figure 14 has been reported an example having cells with different geometric shapes, orientation and nucleus position.

4. Conclusions

In this work, a nonlinear dispersive numerical model describing the electroporation phenomenon in irregularly shaped multicellular systems has been developed and implemented. The electroporation process has been studied for two types of multicellular arrangements: packed and sparse systems. For each one, seven nucleated muscular-like cells have been considered, as well as a nanosencond pulsed electric field has been used as excitation source. The shape of each cell has been carefully modeled by using the Gielis’ superformula. The model solves the asymptotic Smoluchowski’s equation in conjunction with the Maxwells equations to calculate the pores evolution. Furthermore, in order to accurately evaluate the temporal variation of TMV and pore density, the dispersive properties of each cell media have been taken into account using the Debye relationship. By the computational analysis it has been inferred that the electroporation process is more evident in the sparse system. For their particular geometric shape, all muscle cells show a negligible pore density within the sharp region facing the electrodes. In both systems, the activation of electroporation occurs faster in the nuclear membranes. Moreover, the plasma membranes EP activation of each cell occurs in different time instants. Instead the nuclear membranes are all significantly electroporated at the same time instant. For each system, the electroporation relative length has been calculated, too. With reference to the packed system, the EPRL of the plasma membranes of the cell 1, cell 2, cell 3, cell 5, cell 6 and cell 7 is about 37% and a lower value of about 24% characterizes the plasma membrane of cell 4. The nuclear EPRL of the cell 1 and cell 7 is about 56.5%. Furthermore, the nuclear EPRL of cell 2, cell 3, cell 5 and cell 6 is about 58%. Cell 4 has a nuclear EPRL of about 53%. In the sparse system, an EPRL improvement is evident for the plasma membranes. In particular, the EPRL of the plasma membranes of the cell 1 and cell 7 is about 47%. An higher value of about 49% has been calculated for the cell 2, cell 3, cell 5 and cell 6, and a lower value of about 45% characterize the cell 4. Furthermore, the nuclear EPRL of all the cells is about 58%. As a conclusion, the sparse system being characterized by a lower interference between the neighbouring cells exhibits higher plasma and nuclear EPRL values than the packed system. Finally, this lower mutual interference between the cells in the sparse system is further highlighted by the symmetry of the spatial distribution of the plasma pore density that is absent in the case of the packed system.

Author Contributions

Conceptualization L.M. and M.A.C., methodology L.M., D.C. and J.G., software M.A.C., validation M.A.C. and P.B., formal analysis L.M., M.A.C. and P.B., investigation M.A.C., resources L.M., data curation M.A.C., C.M.L., writing-original draft preparation L.M.,writing-review and editing L.M., P.B., visualization M.A.C., C.M.L., supervision L.M., D.C. and J.G., funding acquisition L.M.

Acknowledgments

This work has been partially supported within the Bando INNONETWORK—sostegno alle attività di R&S per lo sviluppo di nuove tecnologie sostenibili, di nuovi prodotti e servizi plan: T-CARE—Tele assistenza e monitoraggio innovativi dei parametri vitali a domicilio con biosensori indossabili, A.D. n. 160 del 15/12/2017 e n. 34 del 11/04/2018.

Conflicts of Interest

The authors declare no conflict of interest.

Abbreviations

The following abbreviations are used in this manuscript:
ACAlternating Current
DCDirect Current
DNADeoxyriboNucleic Acid
EPElectroporation
EPRLElectroporation Relative Length
PEFPulsed Electric Field
RNARiboNucleic Acid
TMVTransmembrane Voltage

References

  1. MacQueen, L.A.; Thibault, M.; Buschmann, M.D.; Wertheimer, M.R. Electro-manipulation of Biological Cells in Microdevices. IEEE Trans. Dielectr. Electr. Insul. 2012, 19, 1261–1268. [Google Scholar] [CrossRef]
  2. Chow, Y.T.; Chen, S.; Wang, R.; Liu, C.; Kong, C.; Li, R.A.; Cheng, S.H.; Sun, D. Single cell transfection through precise microinjection with quantitatively controlled injection volumes. Sci. Rep. 2016, 6, 1–9. [Google Scholar] [CrossRef] [PubMed]
  3. Yarmush, M.L.; Golberg, A.; Sersa, G.; Kotnik, T.; Miklavcic, D. Electroporation-based technologies for medicine: Principles, applications and challenges. Annu. Rev. Biomed. Eng. 2014, 16, 295–320. [Google Scholar] [CrossRef] [PubMed]
  4. Santra, T.S.; Lee, C.W.; Kar, S.; Borana, J.; Wang, P.C.; Tseng, F.G. Nanolocalized single cell membrane nanoelectroporation: For higher efficiency with high cell viability. IEEE Nanotechnol. Mag. 2014, 8, 30–34. [Google Scholar] [CrossRef]
  5. Gehl, J. Electroporation: Theory and methods, perspectives for drug delivery, gene therapy and research. Acta Physiol. Scand. 2003, 177, 437–447. [Google Scholar] [CrossRef] [PubMed]
  6. Rao, M.; Baraban, J.; Rajaii, F.; Sockanathan, S. In vivo comparative study of rnai methodologies by in ovo electroporation in the chick embryo. Dev. Dyn. 2004, 231, 592–600. [Google Scholar] [CrossRef] [PubMed]
  7. Sustarsic, M.; Plochowietz, A.; Aigrain, L.; Yuzenkova, Y.; Zenkin, N.; Kapanidis, A. Optimized delivery of fluorescently labeled proteins in live bacteria using electroporation. Histochem. Cell Biol. 2014, 142, 113–124. [Google Scholar] [CrossRef] [Green Version]
  8. Yan, K.; Todo, H.; Sugibayashi, K. Transdermal drug delivery by in-skin electroporation using a microneedle array. Int. J. Pharm. 2010, 397, 77–83. [Google Scholar] [CrossRef] [Green Version]
  9. Baron, S.; Poast, J.; Rizzo, D.; McFarland, E.; Kieff, E. Electroporation of antibodies, DNA, and other macromolecules into cells: A highly efficient method. J. Immunol. Methods 2000, 242, 115–126. [Google Scholar] [CrossRef]
  10. Yumura, S. Rapid redistribution of myosin ii in living dictyostelium amoebae, as revealed by fluorescent probes introduced by electroporation. Protoplasma 1996, 192, 217–227. [Google Scholar] [CrossRef]
  11. Liu, C.; Xie, X.; Zhao, W.; Liu, N.; Maraccini, P.A.; Sassoubre, L.M.; Boehm, A.B.; Cui, Y. Conducting nanosponge electroporation for affordable and highefficiency disinfection of bacteria and viruses in water. Am. Chem. Soc. Nano Lett. 2013, 13, 4288–4293. [Google Scholar] [CrossRef] [PubMed]
  12. Lin, H.Y.; Lin, S.E.; Chien, S.F.; Chern, M.K. Electroporation for three commonly used yeast strains for two-hybrid screening experiments. Anal. Biochem. 2011, 416, 117–119. [Google Scholar] [CrossRef] [PubMed]
  13. Bates, G.W. Genetic transformation of plants by protoplast electroporation. Mol. Biotechnol. 1994, 2, 135–145. [Google Scholar] [CrossRef] [PubMed]
  14. Fujimoto, H.; Kato, K.; Iwata, H. Electroporation microarray for parallel transfer of small interfering RNA into mammalian cells. IEEE Trans. Dielectr. Electr. Insul. 2008, 392, 1309–1316. [Google Scholar] [CrossRef] [PubMed]
  15. Guo, F.; Yao, C.; Li, C.; Mi, Y.; Wen, Y.; Tang, J. Dependence on pulse duration and number of tumor cell apoptosis by nanosecond pulsed electric fields. IEEE Trans. Dielectr. Electr. Insul. 2013, 20, 1195–1200. [Google Scholar]
  16. Lamberti, P.; Tucci, V.; Romeo, S.; Sannino, A.; Scarfi, M.R.; Zeni, O. nsPEF-induced effects on cell membranes: Use of electrophysical model to optimize experimental design. IEEE Trans. Dielectr. Electr. Insul. 2013, 20, 1231–1238. [Google Scholar] [CrossRef]
  17. Beebe, S.J. Bioelectrics in basic science and medicine: Impact of electric fields on cellular structures and functions. J. Nanomed. Nanotechol. 2013, 4, 1–8. [Google Scholar] [CrossRef]
  18. Pakhomov, A.G.; Miklavcic, D.; Markov, M.S. Advanced Electroporation Techniques in Biology and Medicine; CRC Press: Boca Raton, FL, USA, 2010. [Google Scholar]
  19. Denzi, A.; Camera, F.; Merla, C.; Benassi, B.; Consales, C.; Paffi, A.; Apollonio, F.; Liberti, M. A microdosimetric study of electropulsation on multiple realistically shaped cells: Effect of neighbours. J. Membr. Biol. 2016, 249, 691–701. [Google Scholar] [CrossRef] [PubMed]
  20. Pucihar, G.; Krmelj, J.; Rebersek, M.; Napotnik, T.B.; Miklavicic, D. Equivalent pulse parameters for electroporation. IEEE Trans. Biomed. Eng. 2011, 58, 3279–3288. [Google Scholar] [CrossRef]
  21. Retelj, L.; Pucihar, G.; Miklavcic, D. Electroporation of intracellular liposomes using nanosecond electric pulses—A theoretical study. IEEE Trans. Biomed. Eng. 2013, 60, 2624–2635. [Google Scholar] [CrossRef]
  22. Salimi, E.; Thomson, D.J.; Bridges, G.E. Membrane dielectric dispersion in nanosecond pulsed electroporation of biological cells. IEEE Trans. Dielectr. Electr. Insul. 2013, 20, 1256–1265. [Google Scholar] [CrossRef]
  23. Murovec, T.; Sweeney, D.C.; Latouche, E.; Davalos, R.V.; Brosseau, C. Modeling of transmembrane potential in realistic multicellular structures before electroporation. Biophys. J. 2016, 111, 2286–2295. [Google Scholar] [CrossRef] [PubMed]
  24. Mescia, L.; Bia, P.; Chiapperino, M.A.; Caratelli, D. Fractional Calculus Based FDTD Modeling of Layered Biological Media Exposure to Wideband Electromagnetic Pulses. Electronics 2017, 6, 106. [Google Scholar] [CrossRef]
  25. Towhidi, L.; Kotnik, T.; Pucihar, G.; Firoozabadi, S.M.P.; Mozdaran, H.; Miklavcic, D. Variability of the minimal transmembrane voltage resulting in detectable membrane electroporation. Electromagn. Biol. Med. 2008, 27, 372–385. [Google Scholar] [CrossRef]
  26. Qiu, H.; Xiao, S.; Joshi, R.P. Simulations of voltage transients across intacellular mitochondrial membranes due to nanosecond electrical pulses. IEEE Trans. Dielectr. Electr. Insul. 2014, 42, 3113–3120. [Google Scholar]
  27. Mescia, L.; Chiapperino, M.A.; Bia, P.; Gielis, J.; Caratelli, D. Modeling of electroporation induced by pulsed electric fields in irregularly shaped cells. IEEE Trans. Biomed. Eng. 2018, 65, 414–423. [Google Scholar] [CrossRef]
  28. Gielis, J. A generic geometric transformation that unifies a wide range of natural and abstract shapes. Am. J. Bot. 2003, 90, 333–338. [Google Scholar] [CrossRef] [Green Version]
  29. Bia, P.; Caratelli, D.; Mescia, L.; Gielis, J. Analysis and synthesis of supershaped dielectric lens antennas. IET Microw. Antennas Propag. 2015, 9, 1497–1504. [Google Scholar] [CrossRef]
  30. Mescia, L.; Bia, P.; Caratelli, D.; Chiapperino, M.A.; Stukach, O.; Gielis, J. Electromagnetic mathematical modeling of 3D supershaped dielectric lens antennas. Math. Probl. Eng. 2016, 2016, 8130160. [Google Scholar] [CrossRef]
  31. Kotnik, T.; Miklavcic, D. Theoretical evaluation of the distributed power dissipation in biological cells exposed to electric fields. Bioelectromagnetics 2000, 21, 385–394. [Google Scholar] [CrossRef] [Green Version]
  32. Caratelli, D.; Mescia, L.; Bia, P.; Stukach, O.V. Fractional-calculus-based FDTD algorithm for ultrawideband electromagnetic characterization of arbitrary dispersive dielectric materials. IEEE Trans. Antennas Propag. 2016, 64, 3533–3544. [Google Scholar] [CrossRef]
  33. Martinsen, O.G.; Grimmes, S.; Schwan, H.P. Interface phenomena and dielectric properties of biological tissue. In Encyclopedia of Surface and Colloid Science; Taylor & Francis: New York, NY, USA, 2002; pp. 2643–2652. [Google Scholar]
  34. Krassowska, W.; Filev, F.D. Modeling electroporation in a single cell. Biophys. J. 2007, 92, 404–417. [Google Scholar] [CrossRef] [PubMed]
  35. Gielis, J. The Geometrical Beauty of Plants; Atlantis Press: Paris, France, 2017. [Google Scholar]
  36. Rems, L.; Uaj, M.; Kanduer, M.; Reberek, M.; Miklavcic, D.; Pucihar, G. Cell electrofusion using nanosecond electric pulses. Sci. Rep. 2013, 3, 3382. [Google Scholar] [CrossRef] [PubMed]
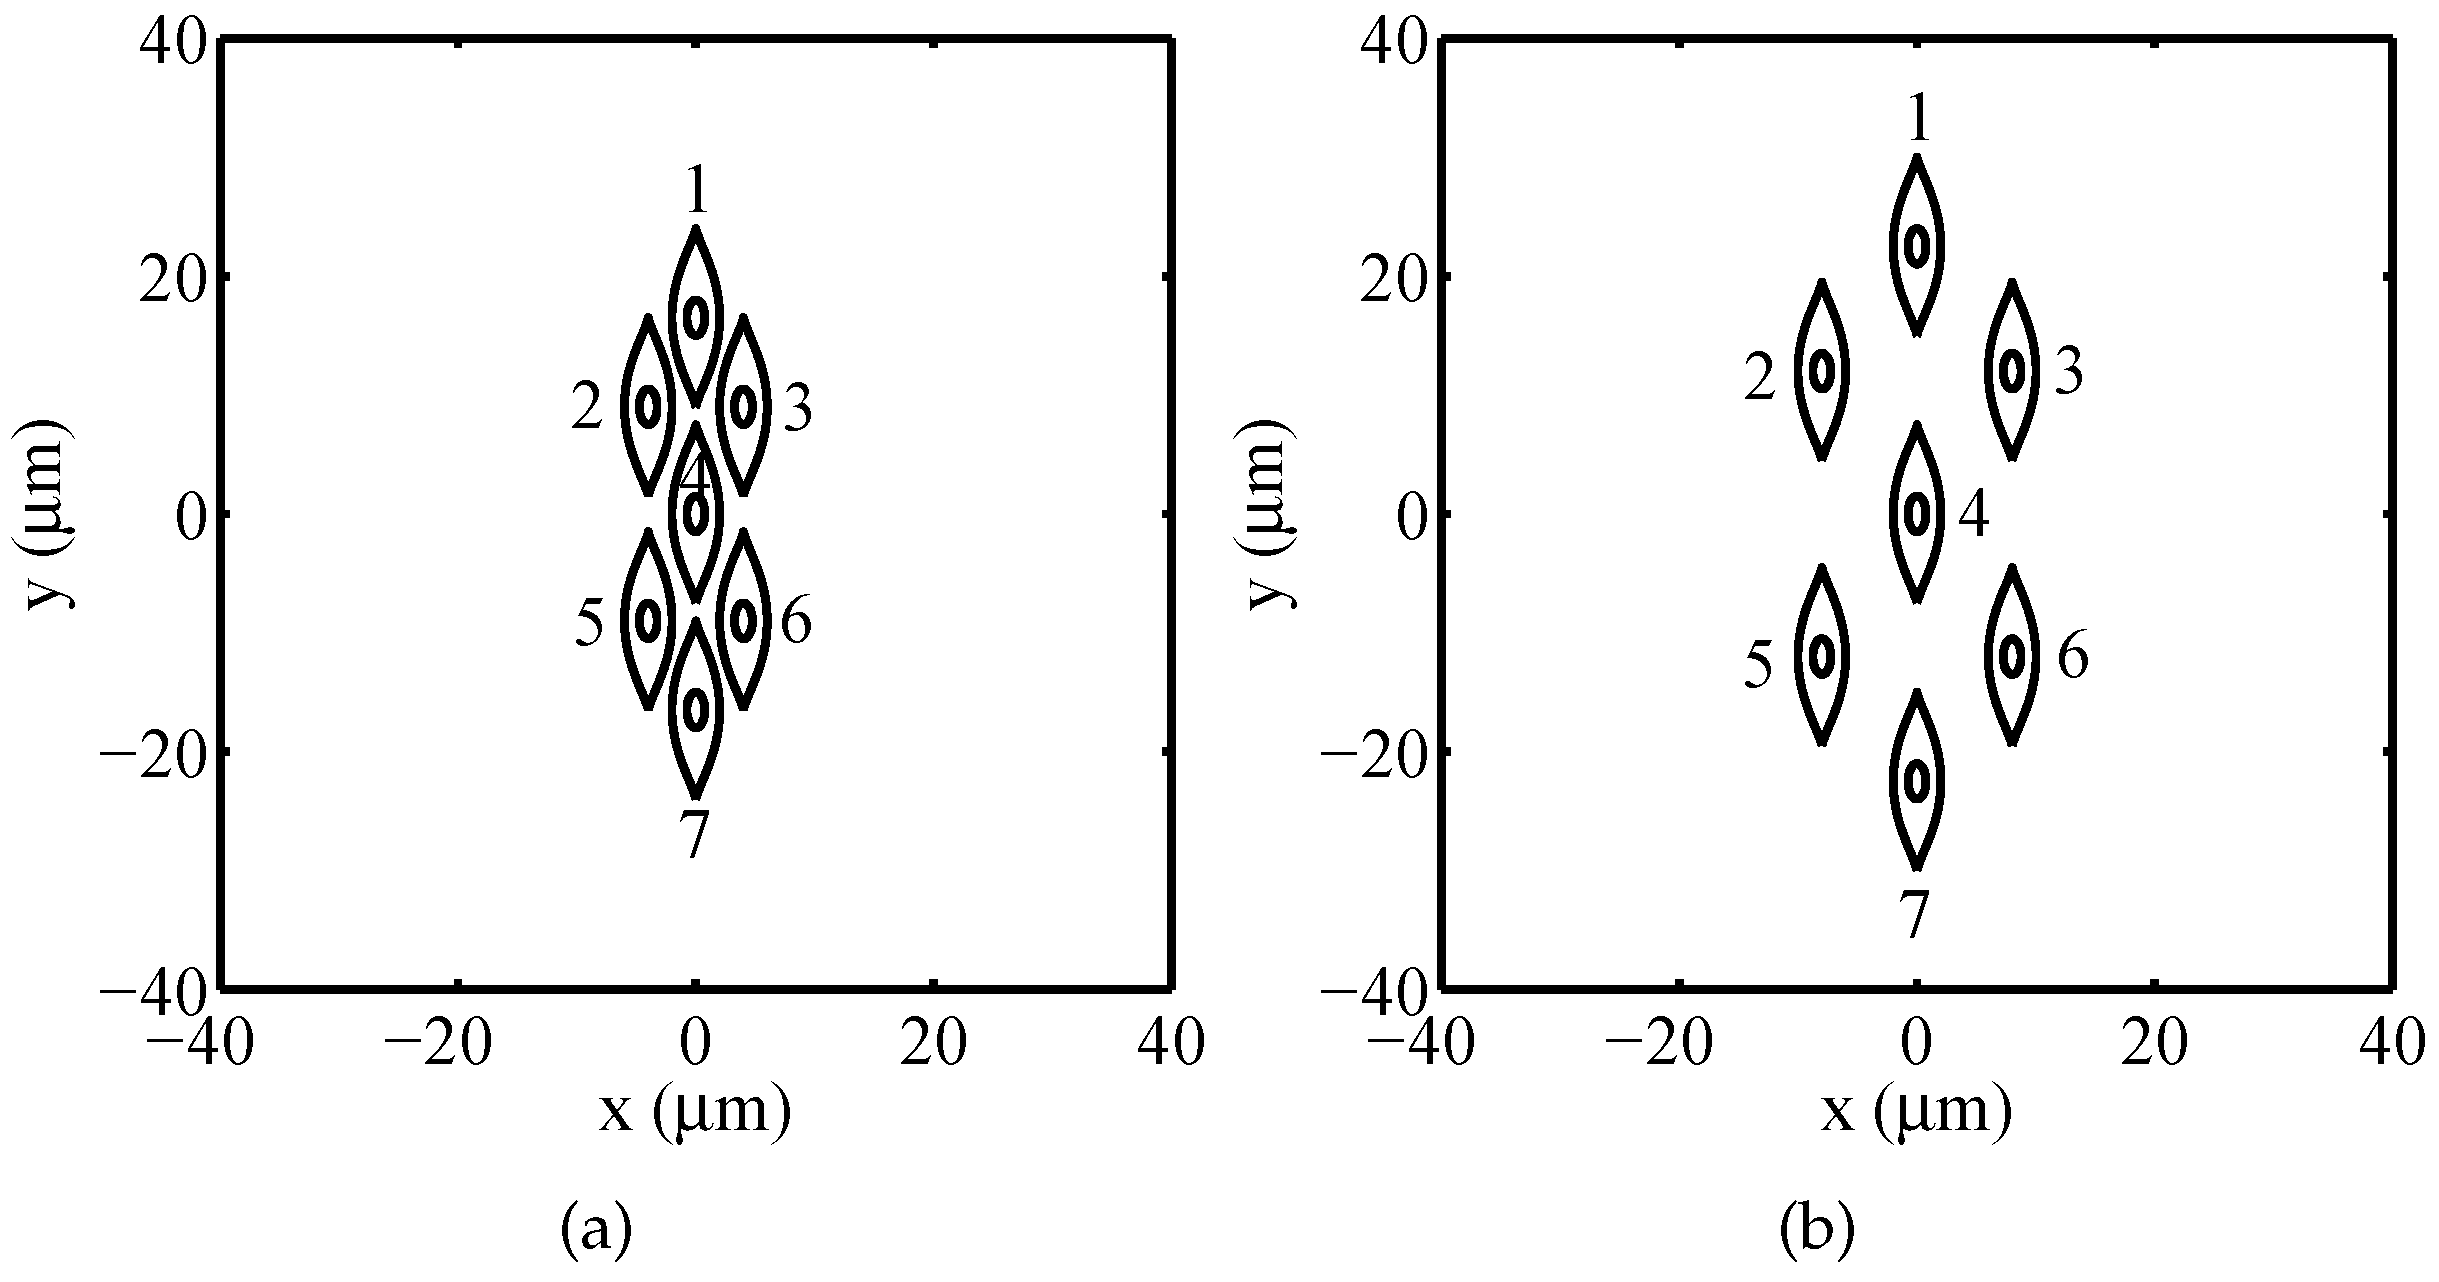
Figure 1. Schematic picture of the 2-D arbitrarily shaped cells exposed to uniform pulsed electric field. Cell geometry modeled using the Gielis’ superformula.
Electronics 08 00037 g001
Figure 2. Irregularly shaped multicellular arrangements: (a) packed system, (b) sparse system.
Electronics 08 00037 g002
Figure 3. Isolated nucleated muscular cell—(a) Temporal evolution of pore density for plasma and nuclear membranes at the angular placement θ = 75 evaluated using the dispersive and nondispersive model. (b) Angular placement θ = 75 on the cell.
Electronics 08 00037 g003
Figure 4. Packed System—Temporal evolution of (a) TMV and (b) pore density for plasma membranes at the angular placement θ = 75 . Temporal evolution of (c) TMV and (d) pore density for nuclear membranes at the angular placement θ = 75 . Pulse amplitude and duration equal to 100 k V / c m and 10 ns , respectively.
Electronics 08 00037 g004
Figure 5. Packed System—(a) TMV and (b) pore density distribution on cell membranes at time instant t = 20 n s . Pulse amplitude and duration equal to 100 k V / c m and 10 n s , respectively.
Electronics 08 00037 g005
Figure 6. Packed System—Plasma membranes pore density versus the polar angle at time instant t = 20 n s for (a) cell 1, (b) cell 2, (c) cell 3, (d) cell 4, (e) cell 5, (f) cell 6, (g) cell 7. Pulse amplitude and duration equal to 100 k V / c m and 10 n s , respectively.
Electronics 08 00037 g006
Figure 7. Packed System—Nuclear membranes pore density versus the polar angle at time instant t = 20 n s for (a) cell 1, (b) cell 2, (c) cell 3, (d) cell 4, (e) cell 5, (f) cell 6, (g) cell 7. Pulse amplitude and duration equal to 100 k V / c m and 10 n s , respectively.
Electronics 08 00037 g007
Figure 8. Sparse System—Temporal evolution of (a) TMV and (b) pore density for plasma membranes at the angular placement θ = 75 . Temporal evolution of (c) TMV and (d) pore density for nuclear membranes at the angular placement θ = 75 . Pulse amplitude and duration equal to 100 k V / c m and 10 n s , respectively.
Electronics 08 00037 g008
Figure 9. Sparse System—(a) TMV and (b) pore density distribution on cell membranes at time instant t = 20 n s . Pulse amplitude and duration equal to 100 k V / c m and 10 n s , respectively.
Electronics 08 00037 g009
Figure 10. Sparse System—Plasma membranes pore density versus the polar angle at time instant t = 20 n s for (a) cell 1, (b) cell 2, (c) cell 3, (d) cell 4, (e) cell 5, (f) cell 6, (g) cell 7.
Electronics 08 00037 g010
Figure 11. Sparse System—Nuclear membranes (Nm) pore density versus the polar angle at time instant t = 20 ns for cell 1 (a), cell 2 (b), cell 3 (c), cell 4 (d), cell 5 (e), cell 6 (f), cell 7 (g).
Electronics 08 00037 g011
Figure 12. Electric field distribution (log scale) for (a) packed system and (b) sparse system at the time instant t = 10 n s .
Electronics 08 00037 g012
Figure 13. Current density distribution (log scale) for (a) packed system and (b) sparse system at the time instant 10 n s .
Electronics 08 00037 g013
Figure 14. Irregularly shaped multicellular arrangement having more complex physiological conditions.
Electronics 08 00037 g014
Table 1. Cells Cartesian coordinates.
Packed SystemSparse System
Cell x s (μm) y s (μm) x s (μm) y s (μm)
1016.5022.5
2−49−812
349812
40000
5−4−9−8−12
64−98−12
70−16.50−22.5
Table 2. Polarization, electric, geometrical and EP parameters.
SymbolValueDescription
τ 1 , Mn 3 n s First relaxation time of plasma and nuclear membrane [22]
τ 2 , Mn 0.46 n s Second relaxation time of plasma and nuclear membrane [22]
τ Ex 6.2 p s Relaxation time of extracellular medium [31]
τ Pc i , j 6.2 p s Relaxation time of cytoplasm and nucleoplasm [31]
Δ ϵ 1 , Mn 23 p F / m First relaxation amplitude of plasma and nuclear membrane [22]
Δ ϵ 2 , Mn 7.4 p F / m Second relaxation amplitude of plasma and nuclear membrane [22]
Δ ϵ Ex 0.59 n F / m Relaxation amplitude of extracellular medium [31]
Δ ϵ Pc i , j 0.59 n F / m Relaxation amplitude of cytoplasm and nucleoplasm [31]
ϵ 13.9 p F / m High frequency permittivity [22]
ϵ 0 8.85 p F / m Dielectric permittivity of vacuum
σ Ex 1.2 S / m Conductivity of the extracellular medium [22]
σ 0 , m 9.5 n S / m Passive Conductivity of the plasma membrane [22]
σ Cp 0.3 S / m Conductivity of cytoplasm [22]
σ 0 , Nm 0.1 m S / m Passive Conductivity of the nuclear membrane [36]
σ Np 0.6 S / m Conductivity of nucleoplasm [36]
σ p , Pm 0.65 S / m Conductivity of solution inside the pore for plasma membrane [36]
σ p , Nm 0.43 S / m Conductivity of solution inside the pore for nuclear membrane [36]
r p 0.8 n m Pore radius [22]
α 10 9 m 2 s 1 Pore creation rate density [22]
β 1Electroporation constant [22]
V e p 224 m V Characteristic voltage of electroporation [22]
N e q 3.3 × 10 6 m 2 Equilibrium pore density [22]
w 0 3.2Energy barrier inside the pore [22]
η 0.15Relative length of pore entrance area [22]
q e 1.65 × 10 19 C Electron electric charge
k 1.38 × 10 23 J / K Boltzmann constant
T 295 K Temperature
h Pm 5 n m Plasma membrane thickness [36]
h Nm 10 n m Nuclear membrane thickness [36]
Table 3. Electroporation Relative Length of the Packed System.
CellPlasma EPRL %Nuclear EPRL %
137.4256.50
237.4658.24
337.3458.25
424.2253.56
537.5158.24
637.4658.24
737.6156.55
Table 4. Electroporation Relative Length of the Sparse System.
CellPlasma EPRL %Nuclear EPRL %
147.2258.14
248.7258.82
348.6758.81
447.7857.57
548.7358.82
648.7258.82
747.4058.14

