Article

Multiple Wavelength Optical Coherence Tomography Assessments for Enhanced Ex Vivo Intra-Cochlear Microstructural Visualization

1
School of Electronics Engineering, College of IT Engineering, Kyungpook National University, 80, Daehak-ro, Buk-gu, Daegu 41566, Korea
2
Department of Biomedical Engineering, College of Engineering, Kyungil University, 50, Gamasil-gil, Hayang-eup, Gyeongsan-si, Gyeongsangbuk-do 38428, Korea
3
Center for Medical Physics and Biomedical Engineering, Medical University of Vienna, Waehringer Guertel 18–20, A-1090 Vienna, Austria
4
Institute of Biomedical Engineering, School of Medicine, Kyungpook National University, 680, Gukchaebosang-ro, Jung-gu, Daegu 41944, Korea
5
Department of Otorhinolaryngology-Head and Neck Surgery, School of Medicine, Ajou University, 164 World cup-ro, Yeongtong-gu, Suwon, Gyeonggi-do 41944, Korea
*
Author to whom correspondence should be addressed.
These authors contributed equally to this work.
Electronics 2018, 7(8), 133; https://doi.org/10.3390/electronics7080133
Submission received: 30 June 2018 / Revised: 23 July 2018 / Accepted: 28 July 2018 / Published: 31 July 2018

Abstract

:
The precise identification of intra-cochlear microstructures is an essential otorhinolaryngological requirement to diagnose the progression of cochlea related diseases. Thus, we demonstrated an experimental procedure to investigate the most optimal wavelength range, which can enhance the visualization of ex vivo intra-cochlear microstructures using multiple wavelengths (i.e., 860 nm, 1060 nm, and 1300 nm) based optical coherence tomography (OCT) systems. The high-resolution tomograms, volumetric, and quantitative evaluations obtained from Basilar membrane, organ of Corti, and scala vestibule regions revealed complementary comparisons between the aforementioned three distinct wavelengths based OCT systems. Compared to 860 nm and 1300 nm wavelengths, 1060 nm wavelength OCT was discovered to be an appropriate wavelength range verifying the simultaneously obtainable high-resolution and reasonable depth range visualization of intra-cochlear microstructures. Therefore, the implementation of 1060 nm OCT can minimize the necessity of two distinct OCT systems. Moreover, the results suggest that the performed qualitative and quantitative analysis procedure can be used as a powerful tool to explore further anatomical structures of the cochlea for future studies in otorhinolaryngology.

1. Introduction

Ear-related medical problems, such as tinnitus [1], Meniere’s disease [2], and hearing loss [3] are global health problems. In particular, hearing loss, which was considered an elderly disease a few decades ago [4], has become a common disease among both adults and children in recent times [5,6]. Exposure to loud noise, ototoxic drugs, and aging are the main causes of hearing loss [7]. The cochlea plays a significant role in ear diseases. In particular, inner structure of the cochlea duct is a coiled tube filled with endolymph fluid [8] and is of spiral shape, and therefore the measurement of endolymphatic hydrops [9] and the analysis of the inner structure of the cochlea has become a major concern. Small animal cochlea specimens have been frequently studied instead of human cochlea specimens due to structural similarity [10]. However, due to the small magnitude of the cochlea of a guinea pig, the delineation of the inner microstructures, such as the Reissner’s membrane (RM), Basilar membrane (BM), and organ of Corti (OC), requires a higher resolution [11].
Numerous studies have been performed to observe the inner microstructures of cochlea using histological analysis [12], which has major limitations, such as time consumption, structural destructiveness, and the requirement of exceptional skills for precise dissection. Therefore, non-contact optical-technique-based medical imaging tools have gained an enormous attention recently. Extensively used current expensive medical imaging tools, such as X-ray, computed tomography, and magnetic resonance imaging, provide a low spatial resolution range (in the range of 0.5–1 mm) [13,14,15], which is not sufficient to observe micrometer range structural information of cochlea specimens.
OCT is an emerging, biomedical imaging technology that uses low-coherence interferometry to produce two-dimensional and three-dimensional images of internal tissue microstructures in real-time [16]. OCT systems have become widely established for medical [17,18], agricultural [19,20], and industrial applications [21,22]. Over time, OCT technology has been extensively applied in medical fields, such as ophthalmology [23,24,25], optical biopsy [26,27], dermatology [28,29], dentistry [30,31,32], and otorhinolaryngology [33,34,35,36]. The clinical use of OCT systems has been extended in the field of otolaryngology to visualize morphological structures of cochlea specimen [37]. 840 nm~860 nm (for ophthalmology and cardiology) and 1250 nm~1310 nm (for dentistry, dermatology, and otorhinolaryngology) are the most frequently utilized wavelengths for medical OCT systems [38,39]. 1060 nm wavelength OCT has been frequently applied for ophthalmological applications [40,41]. Consequently, most cochlea-related studies have been distinctly demonstrated using the wavelength range of 860 nm to achieve a higher resolution and 1300 nm for a higher depth penetration. And further studies were performed for the non-invasive visualization of mouse cochlea to measure sound-induced vibrations of the in vivo sensory and report membrane vibration within the unopened cochlea [42,43,44,45]. Nevertheless, the inspection trials to examine the enhanced morphological visualization of intra-cochlear microstructures (in resolution and depth) using 1060 nm OCT have been scarce. Hence, it is essential to discover the applicability of an alternative OCT wavelength capable of achieving sufficient depth penetration and resolution (lateral and axial) concurrently that simplifies the necessity of multiple OCT wavelengths.
The purpose of this demonstration was to investigate the most optimal OCT wavelength that can be employed to enhance the visualization of the inner morphological structures of guinea pig cochlea with simultaneously obtainable sufficient resolution and reasonable depth visualization. To accomplish this issue, OCT systems with multiple wavelengths, such as 860 nm, 1060 nm, and 1300 nm were used to examine ex vivo cochlea specimens to analyze the differences between inner morphology, enface visualizations, and overall OCT intensity fluctuations. All the experimental cochlea specimens were extracted from guinea pigs, which were later decalcified using ethylenediaminetetraacetic acid (EDTA) for a complete decalcification. Conventionally utilized 860 nm and 1300 nm OCT systems were engaged here as control states to gain a better understanding regarding previous reports and to convince the comparativeness. The objective of 1060 nm OCT system demonstration was to discover the maximum extent of characterizing inner morphological and enface cochlea structures with an enhanced visualization over control states (860 nm and 1300 nm), which has not been reported in otorhinolaryngological and cochlea-related literature to date. Consequently, quantitative evaluations were obtained using intensity fluctuations in the depth direction to confirm the potential applicability of the experimental protocol.

2. Materials and Methods

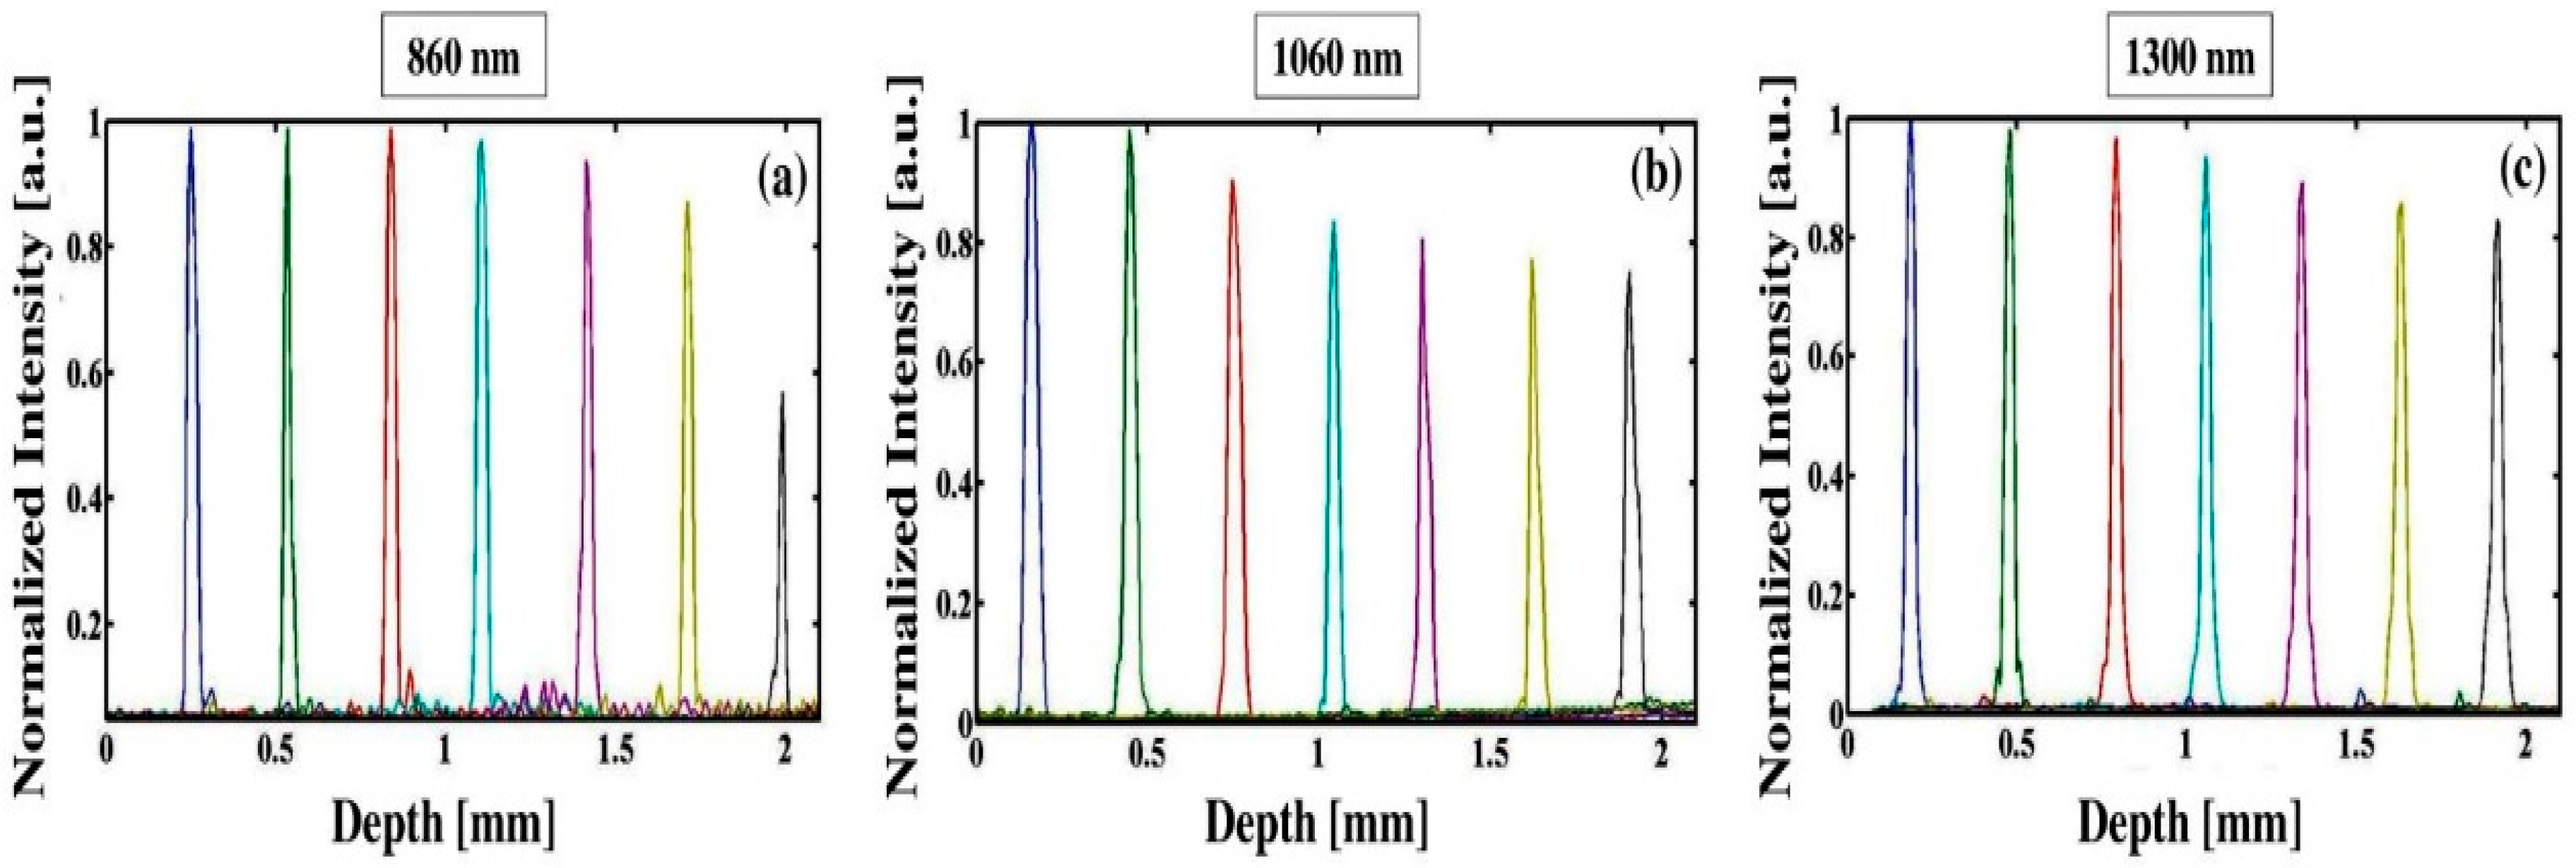
2.1. Multiple Wavelength OCT Technical Configurations

Widely applied three types of OCT wavelengths were involved in this experiment. The systems can be categorized as, i.e., a laboratory-customized system for 860 nm wavelength spectral domain OCT (SD-OCT), commercial (IVS-1000-VCSEL-1.06 μm, Santec, Komaki, Japan) for 1060 nm wavelength swept-source OCT (SS-OCT), and commercial OCS1310V1 (Thorlabs, Newton, NJ, USA) for 1300 nm wavelength swept-source OCT (SS-OCT), respectively. The developed SD-OCT system is operated with a broadband light source (BroadLighters T-850-HP, Superlum, Co., Cork, Ireland) with a center wavelength of 860 nm, a full width at half maximum of 135 nm. The incident optical power towards the sample was 12.2 mW. The detector part of the interferometer is a laboratory customized optical spectrometer designed with collimator (LB20R, Silicon Lightwave Technology, Lake Forest, CA, USA), a transmission type diffraction grating (HD1800 L/mm, Wasatch Photonics), and lens of 100-mm focal length (AC508-100-B, Thorlabs), which is used for focusing the diffracted rays on a 4096-pixels line scan camera (spl4096-140 km, Basler, Ahrensburg, Germany). The specimens were scanned using scan lenses (LSM02-BB, 10X, 0.11 NA, 810 nm~1100 nm) in both 860 nm and 1060 nm systems, and (LSM02, 10X 0.11 NA, 1250 nm~1380 nm) in 1300 nm system, respectively. The numerical aperture of the lenses was maintained as 0.11, where the depth of focus can be varied according to the wavelengths. Gabor-based fusion technique is one of the methods performed to obtain a high lateral resolution image throughout the depth of imaging with a high data acquisition speed [46]. Axial resolutions of the systems were measured by imaging the reflectivity profile of mirror reflection, which can also be referred as the axial point spread function (PSF). Further detailed optical specifications are listed in Table 1. The measured optical power values of the imaging systems were 12.2 mW (860 nm system), 12 mW (1060 nm system), and 10 mW (1300 nm system), respectively. The optical power values were adjusted within a range of 10 mW~13 mW to provide a fair comparison between three OCT systems. Due to the continuous variations of laser source power, the total output optical power values of all the three lasers were monitored prior to the experiment. The monitored values were measured, summed up, and averaged to compensate for the normalization of the entire intensity of the OCT images. According to the fundamental specifications, the customized 860 nm OCT system has a better transverse resolution compared to the 1060 nm and 1300 nm OCT systems, which delineates more distinguishable intra-cochlear microstructures. (The corresponding intra-cochlear microstructures are described in-detail in Section 3.1 with the external appearance along with the cross-sectional representation of the experimented guinea pig cochlea model shown in Figure 1). The 1300 nm OCT system was implemented to observe depth resolved images, and the 1060 nm OCT system was employed to investigate the wavelength feasibility for cochlea specimens and to clarify the main trade-offs between 860 nm and 1300 nm. Moreover, each system has a better transverse resolution than 25 μm with approximately similar signal-to-noise ratio (SNR) and sensitivity values. The SNR and sensitivity values of corresponding the multiple wavelengths based OCT systems varied between 95 dB~105 dB, and the sensitivity fall-off exhibited much less decay (maximum as 10 dB) in each system over the whole imaging depth with increasing optical path difference, which does not hamper the depth dependent visibility. The theoretical transverse resolution values of the Table 1 were calculated according to the numerical aperture of the scan lenses, and the experimentally measured transverse resolution values of the systems were evaluated using a resolution target (1951 USAF Resolution Target, Edmund Optics, Barrington, NJ, USA). The effective refractive index of the guinea pig cochlea tissue was 1.35 [47]. During the scanning procedure of cochlea specimens, the OCT scanning head was directly placed in a parallel manner facing the top surface of the cochlea specimen, and the focusing point was matched on the depth range of modiolus. To obtain multiple consecutive 2D-scans and 3D-scans within the region of interest, the specimen was placed on a two-directional movement translation stage with micrometer step movement. The field-of-view (FOV) of the two-dimensional images was 6 mm × 2 mm and the FOV of the 3D images was 6 mm × 5 mm × 2 mm in the x, y, and z directions, respectively. 3D reconstruction image was reconstructed using 3D software program reported in [48]. The quantitative measurements were evaluated using a customized program coded in MATLAB (Mathworks, Natick, MA, USA). In order to detect the transverse direction intensity profiles of cross-sectional images and enface representations, initially the images were loaded and intensity peak search algorithm was applied. According to the algorithm, peaks with maximum intensity of each individual transverse direction line (signal) were detected sequentially. Subsequently, multiple transverse directions signals were rearranged by matching the peak intensity index to obtain peak information corresponding to the transverse direction microstructural information. Since the physical structure of the cochlea specimen is curved, the obtained peak intensity arrays were summed up and averaged to obtain a single averaged intensity profile to overcome the aforementioned drawbacks of the physical nature of the specimen.
Additionally, the depth related sensitivity measurements were compared between three wavelengths based OCT systems to measure the sensitivity fall-off without an influence of the confocal gate as shown in Figure 1. It is worthy to note that the fall-off curve of 1060 nm and 1300 nm OCT systems exhibit much less decay compared to 860 nm OCT system over the imaging depth of 2 mm. Due to continuous power fluctuations of optical lasers, we performed multiple 3-dB PSF trials and then normalized the evaluations. The detected fall-off from 1300 nm OCT (Figure 1c) is 0.16 a.u., 1060 nm OCT (Figure 1b) is 0.22 a.u., and 860 nm OCT (Figure 1a) is 0.41 a.u., at 1.8 mm depth range respectively. Hence, the illustrated large fall-off decay of 860 nm confirms the less intensity and visibility of deep structures, and similarly, less fall-off decay of 1060 nm and 1300 nm reveal the high intensity and visibility of deep cochlear structures.

2.2. Specimens Preparation

The animal experiments were performed according to the guidelines of the Institutional Animal Care and Use Committee of Kyungpook National University. Cochlear extraction was performed using ten guinea pigs (8-week-old Hartley albino male guinea pigs with a weight range of 310–340 g) in this experiment to obtain ten cochlea specimens to observe the inner microstructures. All the extracted ex vivo cochlea specimens were inspected using three multiple wavelength OCT systems. The animals were anesthetized using an anesthetic cage combined with an isoflurane machine, and 1% of isoflurane was mixed with oxygen for the anesthetization. Guinea pigs were perfused with 30 mL of 1X phosphate buffer saline (PBS) of pH 7.4, followed by 30 mL of 4% paraformaldehyde in PBS of pH 7.4. The guinea pig cochlea samples were separated from the cranium and stored in cryotubes with 1.8 mL of 4% paraformaldehyde in PBS of pH 7.4 at room temperature (23 °C) (control stage) to prevent an external chemical reaction. EDTA was used as the optical clearing agent to decalcify the cochlea structures. Since we demonstrate a comparison between three major OCT wavelengths with depth and resolution trade-offs, all the experimented cochlea specimens were soaked in a solution with 1.8 mL EDTA 10% of pH 7.4 and 90% water and decalcified for 30 days to avoid the conflict of depth although 14 days are sufficient. Also, to avoid over dehydration, specimens were kept back in solution after concluding the experiment. Finally, according to the physiological condition of the animal, euthanasia was performed.

3. Results and Discussion

3.1. Morphological Representation of Intra-Cochlear Microstructures Ex Vivo

Figure 2a illustrates the photograph of a guinea pig cochlea specimen, which was entirely decalcified using EDTA. Figure 2b shows the corresponding cross-sectional image of the cochlea specimen that was acquired using the 1060 nm OCT system. The FOV of the cross-sectional image was 6 mm × 2 mm. The considerable depth penetration and sufficient resolution of 1060 nm OCT system facilitate the identification capability of intra-cochlear microstructures in the red-dashed square region, such as Reissner’s membrane (RM), Basilar membrane (BM), organ of Corti (OC), otic capsule (O), modiolus (M), scala media (SM), and scala vestibuli (SV) with an enhanced visualization.

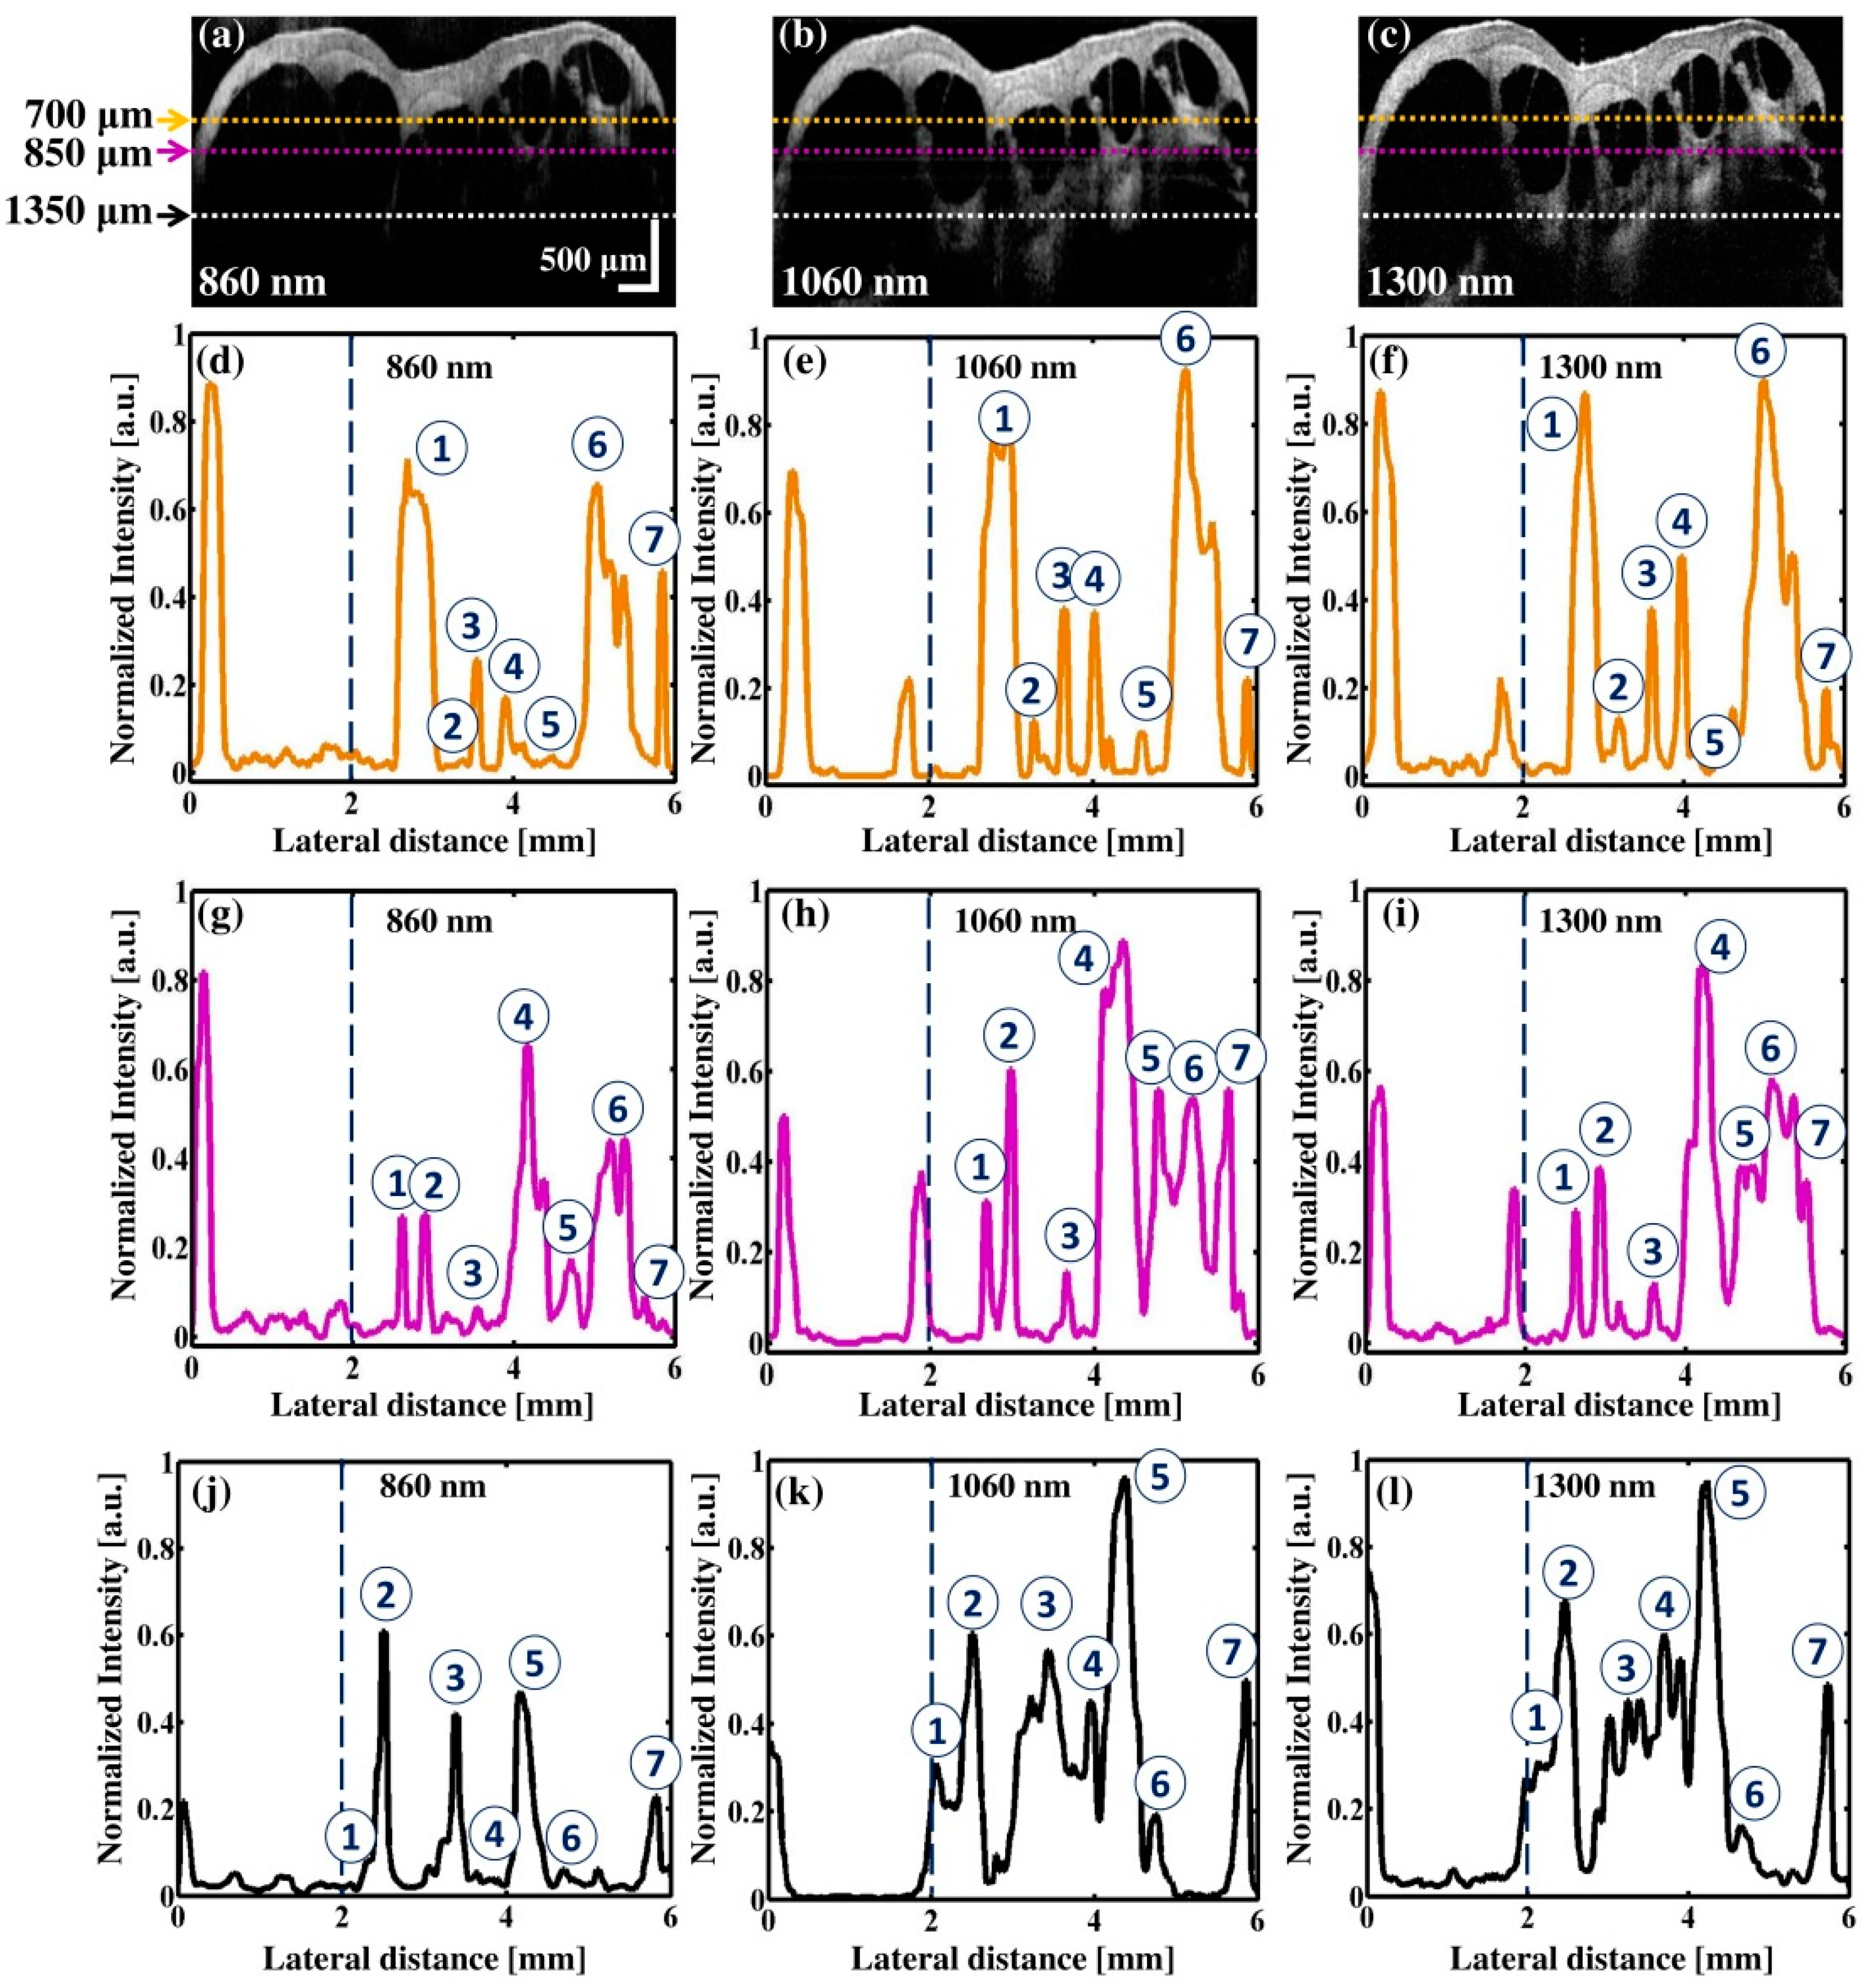
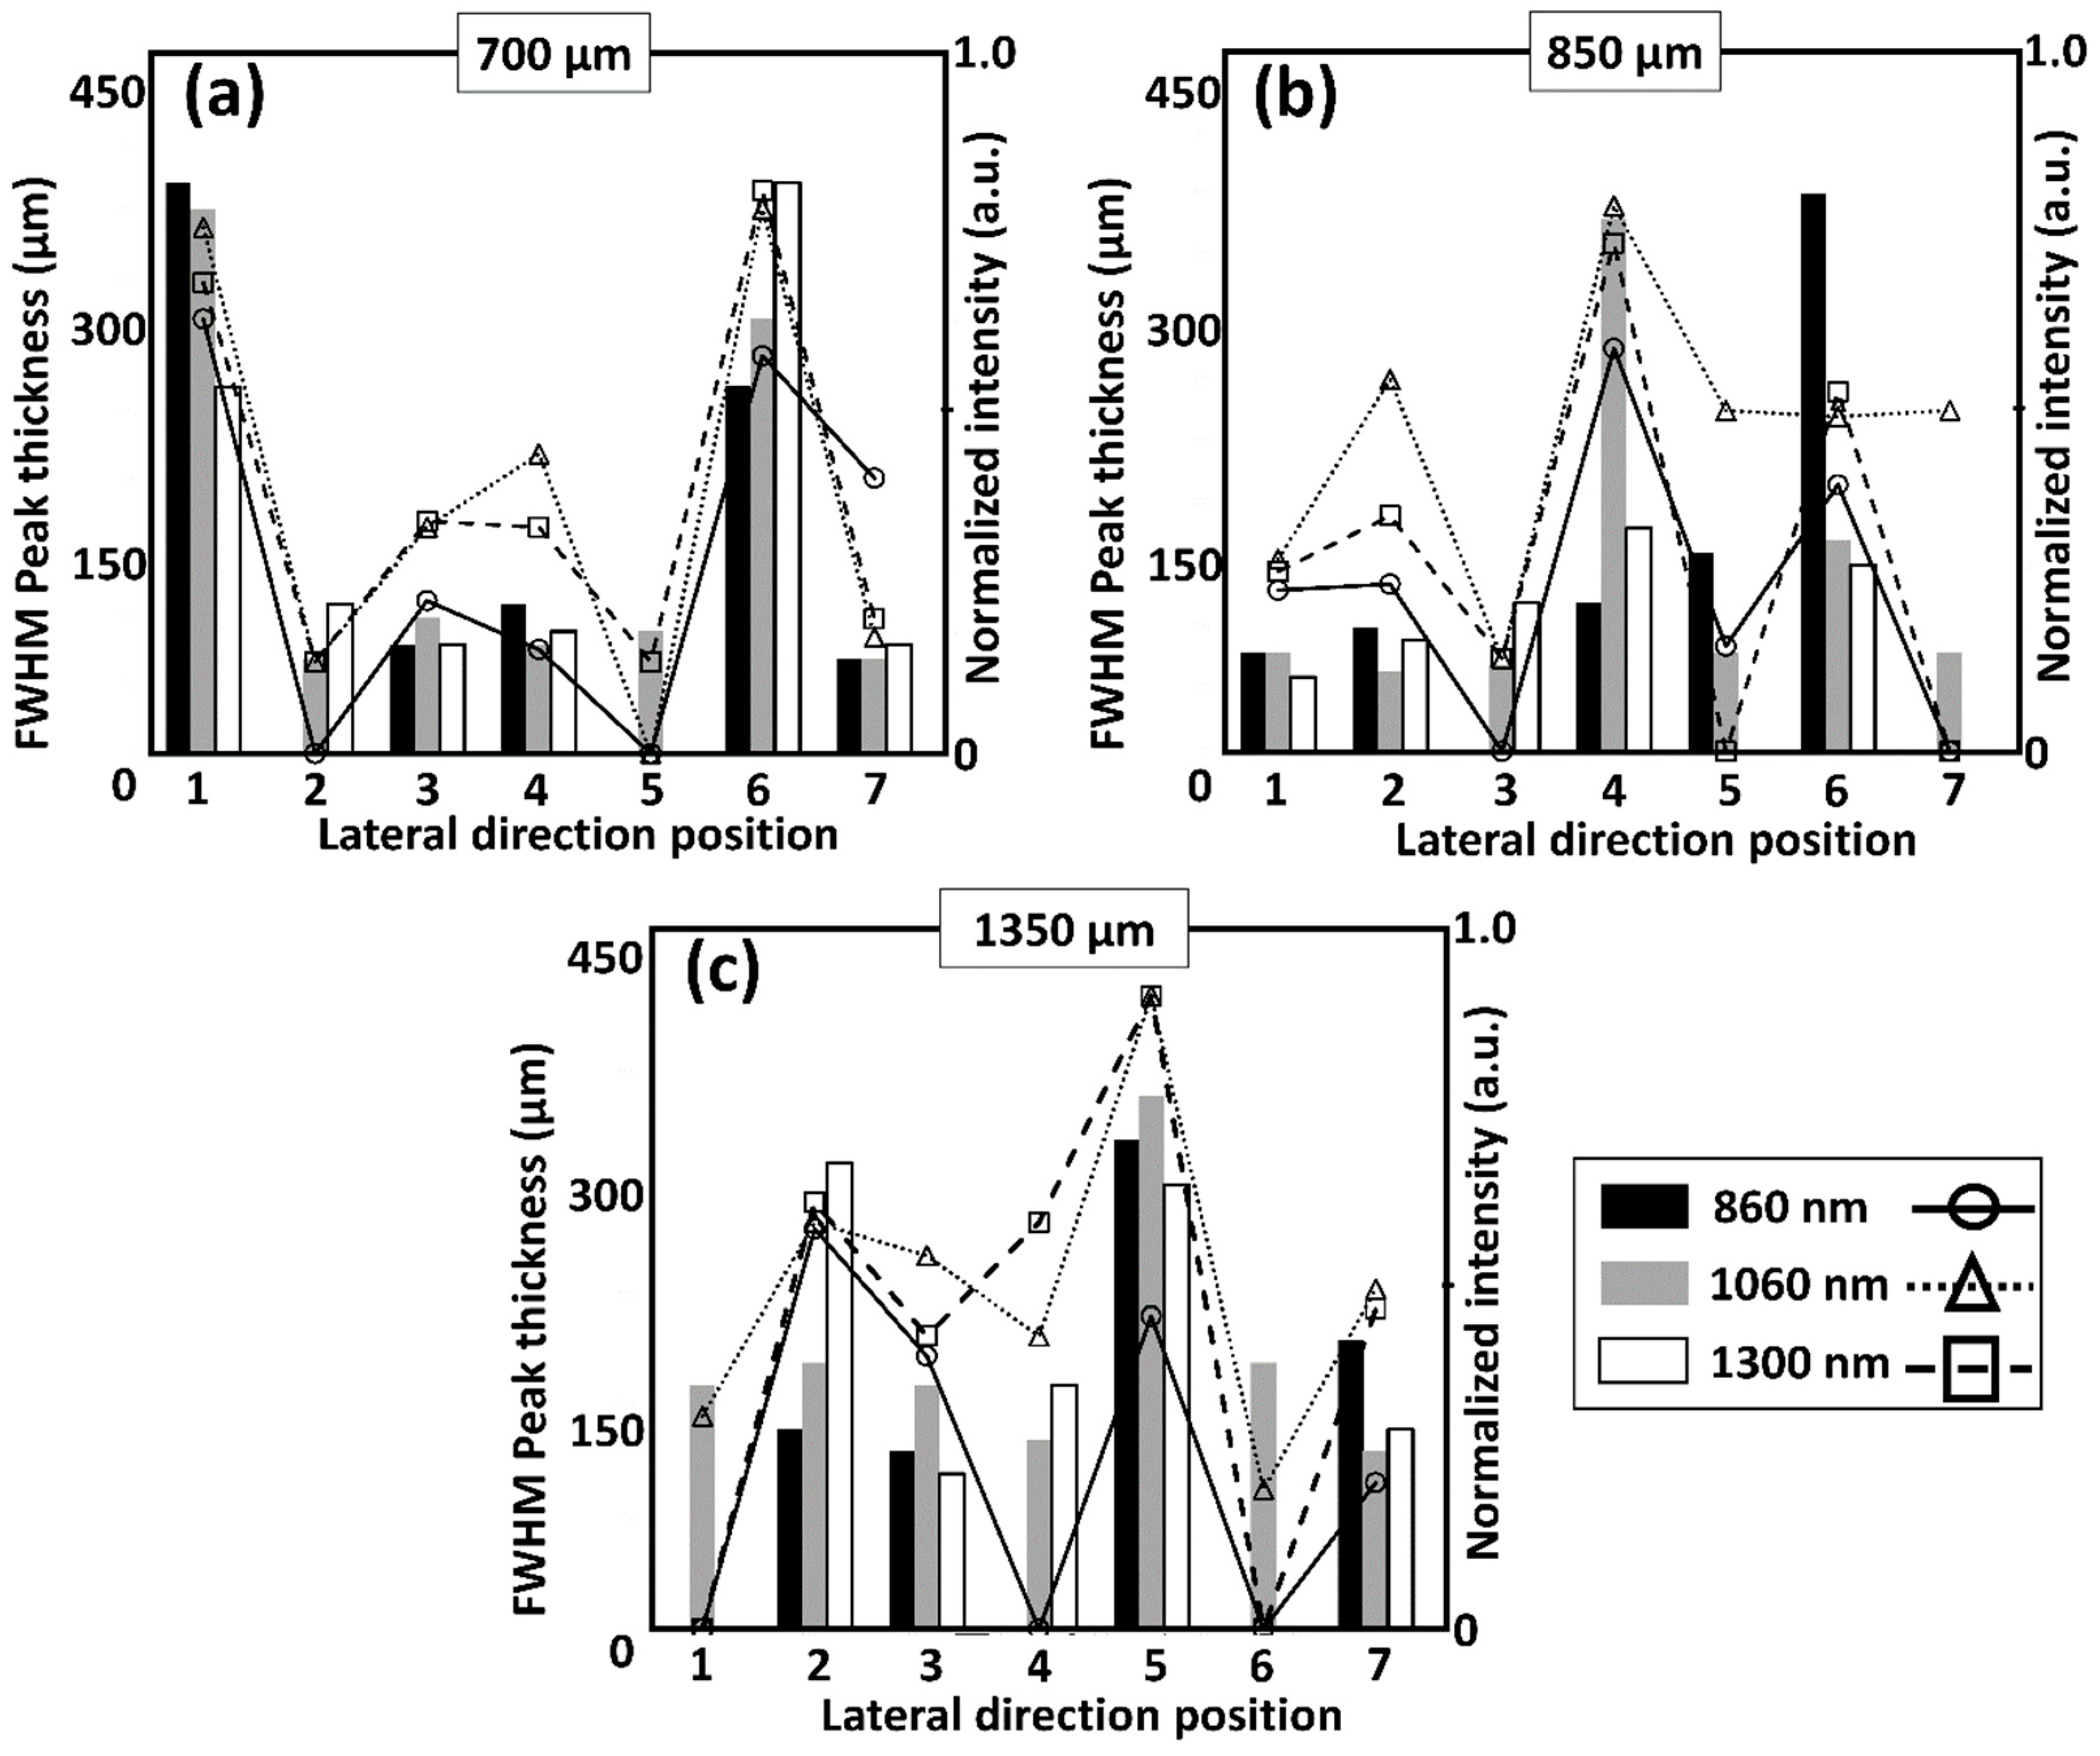
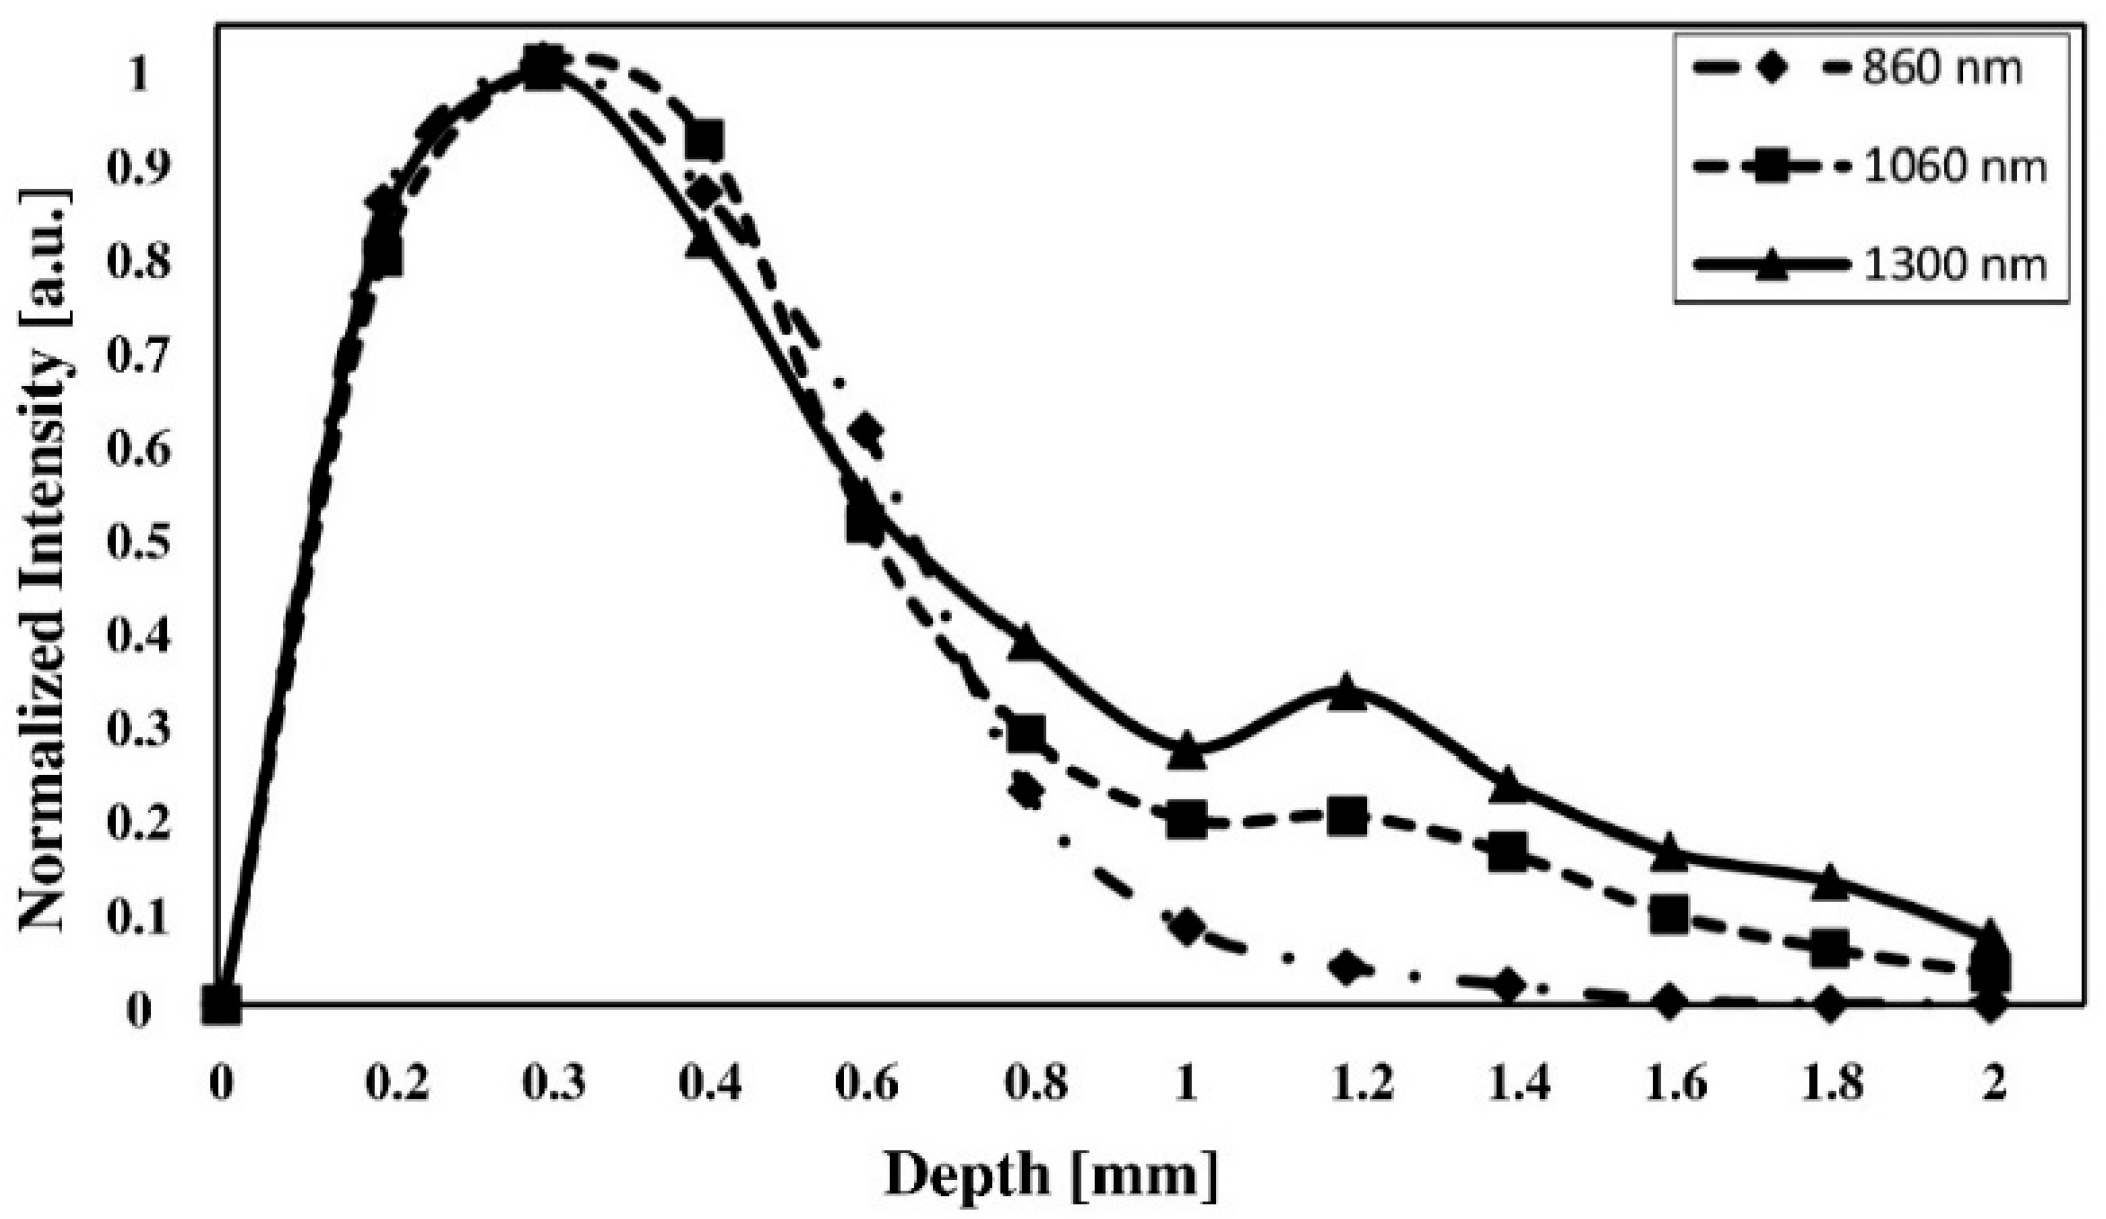
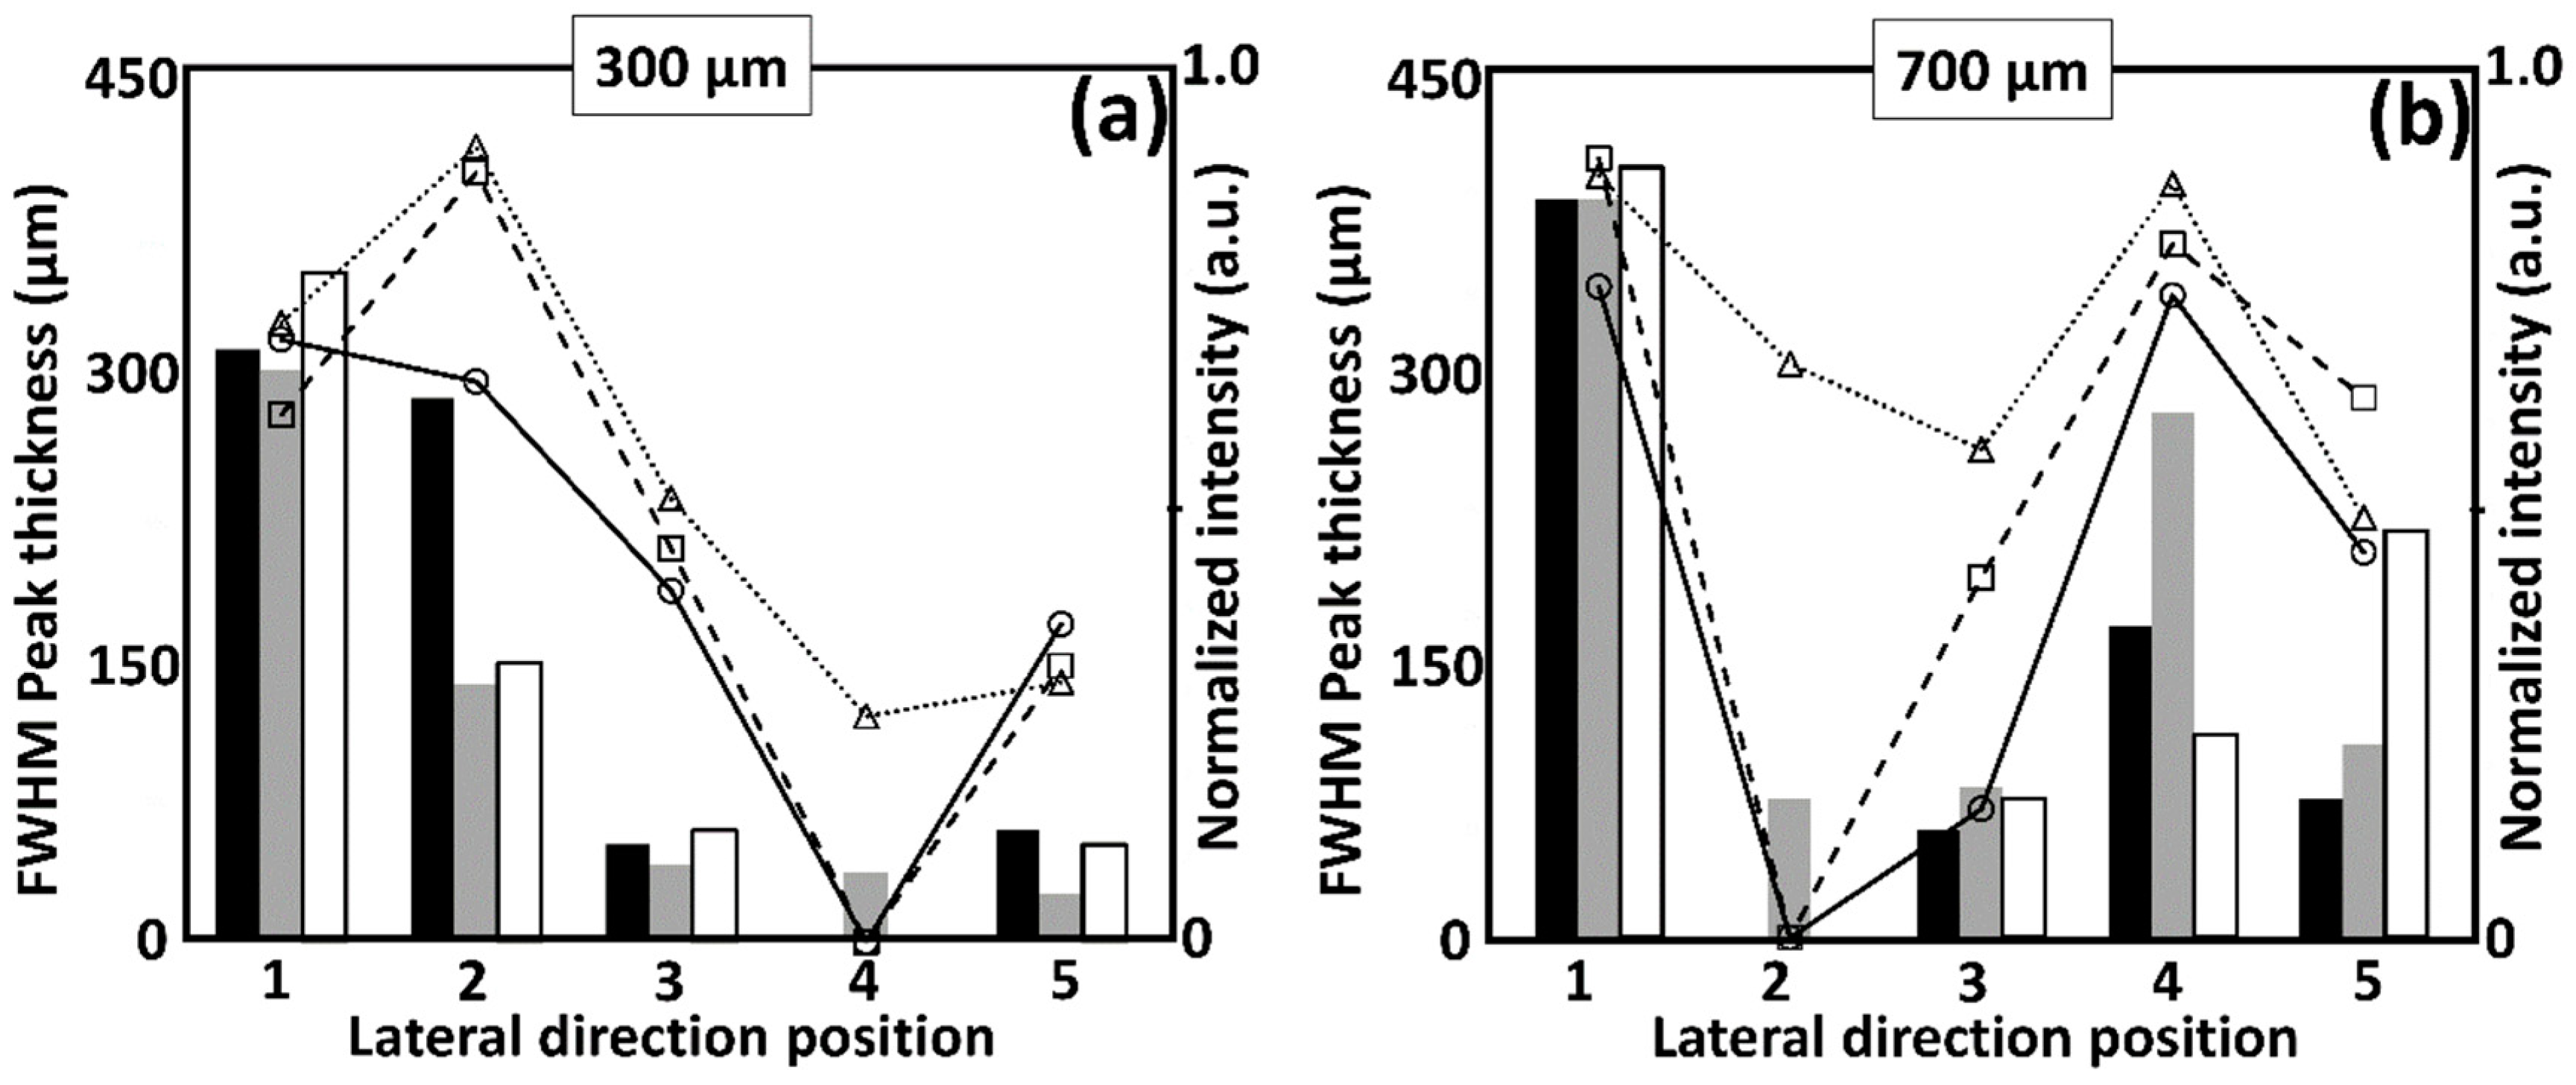
3.2. Comparison of Multiple Wavelength OCT Cross-Sectional Images and the Corresponding Normalized Intensity Fluctuations

In order to confirm the wavelength appropriateness and enhancement of depth visibility, cochlea specimens were examined using the control wavelengths (860 nm and 1300 nm) and 1060 nm based OCT systems. Although ten ex vivo cochlea specimens were examined using the multiple wavelength OCT systems, Figure 3a–c illustrates the representative images acquired from 860 nm, 1060 nm, and 1300 nm OCT systems. The region of interest (R.O.I) was determined by using previously published article [44] as a base reference for identifying the important intra-cochlear microstructures. An external mark was placed on the R.O.I of the cochlea specimen to indicate the position of OCT scanning. Then, multiple 2D-OCT and 3D-OCT scans were acquired approximately close to the aforementioned marked position, which enabled to match the cross-sectional images of each wavelength at a similar imaging position. In order to distinguish the inner microstructures in the transverse direction, the intensity fluctuations in transverse direction were analyzed by considering three different depth levels, which were normalized, averaged, and graphically illustrated in Figure 3d–f, Figure 3g–i, and Figure 3j–l respectively.
The depth levels of 700 μm, 850 μm, and 1350 μm from the top region of the guinea pig cochlea specimen were particularly selected to compare the enhanced depth visualization of intra-cochlear microstructures, such as Reissner’s membrane, modiolus, and scala vestibuli. The results revealed that the inner microstructures of the guinea pig cochlea specimen are faintly visible as shown under the middle magenta dotted lines and lower white dotted lines in Figure 3a whereas they are well delineated in Figure 3b,c. The normalized intensity evaluation of Figure 3a–c was implemented using the aforementioned customized MATLAB program code and the transverse direction intensity fluctuations were plotted in Figure 3d–l. Due to the fluctuations of laser optical power, all the three lasers were monitored and the monitored values were measured, summed up, and averaged to compensate for the normalization of the entire intensity of the OCT images. To obtain a stable transverse direction intensity profile, the intensities were normalized by dividing them into the maximum averaged value of each laser power. Additionally, we implemented a median filter in the software program to compensate for the speckle noise to obtain a clear intensity plot without any noise destruction. The sharp peaks with a high intensity shown in the intensity plots correspond to the intra-cochlear microstructures detected in transverse direction. In the initial 700 μm depth range, the large peaks were identified with a thickness between 0~2 mm (in transverse direction) in Figure 3d–f representing the soft bony structures. However, a large intensity reduction can be identified in 850 μm and 1350 μm depth levels of 860 nm wavelength OCT images due to the degraded intensity (as shown in g and j images) compared to remaining wavelengths. The detected peak information of Figure 3e,h,k clearly reveals accurately distinguishable intensity peaks correspond to the microstructures with a thickness between 0~1 mm (in transverse direction) compared to 860 nm and 1300 nm wavelengths. Although peaks with similar intensity level can be identified in both 1060 nm and 1300 nm, peaks shown in (Figure 3e,h,k) provide more distinguishable transverse direction microstructural information compared to 1300 nm, which confirms precise identification of the soft bony structures. Since 860 nm OCT system has a better transverse resolution, peaks with more sharpness can be identified compared to other wavelengths between 2 mm to 4 mm transverse direction in all three depth levels (Figure 3d,g,j). Thus, the simultaneous acquisition of high transverse resolution microstructural information (similar to 860 nm system) and the long depth penetration (similar to 1300 nm system) using 1060 nm OCT system confirm that the 1060 nm wavelength range can be regarded as a trade-off between increased lateral/axial resolution and increased penetration depth.
The aforementioned intensity fluctuations were further numerically quantified by considering intensity peak information between 2 mm~6 mm transverse distance. The intensity profiles of Figure 3 were involved for the analysis. The inset numbers (①~⑦) of the intensity profiles illustrate seven uniform points of interest, which were equivalently considered between 2 mm~6 mm distance in each 700 μm, 850 μm, and 1350 μm depth levels. The vertical dotted line of each plot indicates the initiating point (2 mm). The thickness and intensity quantifications of the 7 points selected at each depth from each wavelength are shown in Figure 4. Similar peak detection algorithm was used and the peaks, which are less than 0.15 a.u. were discarded to filter the exact clear peaks correspond to intra-cochlear microstructures. The missing bars and ‘0’ positions of graphs indicate the non-detectable or discarded thickness and intensity information. Among all three depth levels of each wavelength, 1060 nm exhibits no missing bars or ‘0’ intensities, which confirms the detection capability of intra-cochlear microstructures more precisely compared to 860 nm and 1300 nm wavelengths. Even though the roll-off affects deep imaging, the complex interplay of axial/transverse resolution, focus position of three wavelengths, and the potential merits of 1060 nm wavelength can be sufficiently convinced through the quantifications.
Moreover, to analyze the total intensity fluctuation of the cross-sectional images, depth direction intensity profiles were analyzed for each image. The depth profiles were taken from the entire cross-section. An intensity peak search software algorithm based cropped window was utilized to grab all the intensity signals of each 2D-OCT image, where later rearranged, flattened, summed up and averaged to obtain a single depth profile. The depth profile shown in Figure 5 illustrates theoretically proven representative total intensity fluctuation of each wavelength range, i.e., the aforementioned wavelengths of 860 nm, 1060 nm, and 1300 nm. Similar fluctuations were observed from 0~0.7 mm in all the three graphs. However, a relatively sudden increase was observed for the wavelength of 1300 nm owing to the presence of deep morphological structures in 1300 nm cross-sectional images. At further depth in the range of 0.7 mm to 1.4 mm, the least intensity was observed for 860 nm and the intensity for 1060 nm fluctuated between those of the wavelengths of 860 nm and 1300 nm. The lateral direction intensity fluctuation above the depth of 1.4 mm in the wavelength region of 860 nm slowly disappeared.

3.3. The Comparison between Enface Representations of Multiple Wavelength OCT Systems

Three-dimensionally rendered images of all the specimens were utilized to obtain the depth direction enface images. The reconstructed volumetric images are shown in the first row of Figure 6. The rendered volumetric images consist of 500 cross-sectional OCT images (B-scan images) with a FOV of 6 mm × 5 mm × 2 mm in the x, y, and z directions, respectively. The three enface images were acquired at depths of 300 μm, 700 μm, and 850 μm from the top of the volumetric image of the cochlea.
The enface images as well as additionally provided contrast images further exploit the enhanced visualization of micro-structures. Since, the extracted anatomical structures, which are located on the gray scale raw enface images do not provide a distinguishable visualization, intensity level based color grading was applied to the raw enface images to identify the anatomical borders more precisely compared to raw enface images using a color grading framework reported in [49,50]. As a result, the color grading implemented enface images presented in Figure 6J–R demonstrate the potential capability of 1060 nm wavelength OCT system through the distinguishable identification capability of anatomical borders. Moreover, in 1060 nm wavelength band qualitative representation, the red color arrows indicated on the enface images illustrate precisely observable micro-structures, which are partially visible in other two types of wavelengths. Therefore, within the reflective image representation, intra-cochlear microstructures, such as Reissner’s membrane, Basilar membrane, scala media, and scala vestibule can be well-distinguished compared to 860 nm and 1300 nm wavelengths. These results emphasize clearly identifiable tissue boundaries with an enhanced contrast owing to the high backscattered intensity level. The representative color scale bar indicates the variation of intensity range. To gain a better confirmation regarding the aforementioned micro-structural differences, lateral intensity quantification was performed for all the enface images of all three wavelengths. The normalized intensity plots are depicted in Figure 7. The lateral direction intensity fluctuations at the depths of 300 μm, 700 μm, and 850 μm were normalized, averaged, and graphically illustrated to distinguish the microstructures in the transverse direction. The red, green, and blue intensity profiles shown in Figure 7 correlate to the lateral intensity profiles of 300 μm, 700 μm, and 850 μm depth levels of each wavelength. Similar results as those of the prior analysis were obtained, since an enhanced visualization of inner morphological structures of cochlea specimens was well-distinguished using the 1060 nm wavelength-based OCT system. Especially, the intensity profiles obtained at depth levels of 300 μm and 700 μm indicate that the 1060 nm wavelength-based OCT system is capable of detecting more intra-cochlear microstructural information with a higher intensity at each depth range as shown in Figure 7B,E,H. And most importantly, the intensity evaluations of 1060 nm clearly visualizes the peak information correlates to organ of Corti, Reissner’s membrane, scala media, and scala vestibule, which highlights detection capability of soft bony structures compared to other wavelengths. Although the visible depth range (Figure 7C,F,I) of 1300 nm is greater than that for 1060 nm, the intensity plots of the 1060 nm OCT system provide more distinguishable sharp peak information with a relatively reasonable depth. Moreover, the normalized intensity level of 1060 nm is greater than 1300 nm in the depth range of 850 μm (as shown in Figure 6H,I images), since the concentrated intensity signal of the 1060 nm enface representation (Blue color dotted line of Figure 6H) reveals the existence of precisely identifiable soft bony structures, which are unable to be visualized in 1300 nm enface representation (Blue color dotted line of Figure 6I). Thus, the obtained enface and quantitative results demonstrate the applicability of the 1060 nm wavelength-range-based OCT system for the analysis of cochlea specimens.
Analogous quantification to Figure 4 was repeated here by considering intensity peak information between 2 mm~6 mm transverse distance range for all intensity profiles in Figure 7. The inset numbers (①~⑤) of the intensity profiles illustrate five uniform points of interest, which were equivalently considered between 2 mm~6 mm distance in each 300 μm, 700 μm, and 850 μm depth levels. The quantifications shown in Figure 8 explain regarding the detection capability of thickness and intensity of peaks correspond to intra-cochlear microstructures in each wavelength range. Similarly, the missing bars and ‘0’ positions of graphs indicate non-detectable or discarded thickness and intensity information. It is worthy to note that the similar behavior to Figure 4 can be identified where 1060 nm exhibits no missing information confirming the detection capability of internal microstructures with a higher precision compared to 860 nm and 1300 nm wavelengths. Subsequently, much appreciable differences were not found in Figure 3, since the images were evaluated in axial direction. However, 1060 nm enface representations shown in Figure 6 reveal specific structural differences over other wavelengths as a result of transverse resolution quite similar to 860 nm and depth penetration similar to 1300 nm wavelength. Although significant differences and image contrast were not identified, pixel intensity based quantitative assessments emphasized particular merits of 1060 nm compared to other dual wavelengths, which eventually provided a convincing platform to the applicability of 1060 nm. Moreover, the utilized OCT-pixel intensity based quantitative assessments were involved to enhance the precision of the protocol. Even though full width half maximum (FWHM) peaks intensities and thickness values are subjective to the position of specimen placed for the incident light, the selected transverse direction y-axis pixel array of the region of interest was approximately similar in all three systems to enhance the precision of the assessment.

4. Conclusions

Multiple wavelengths (860 nm, 1060 nm, and 1300 nm) based OCT systems were implemented to investigate the most optimal wavelength range for determining the enhanced intra-cochlear microstructural visualization of guinea pig cochlea ex vivo. The 860 nm and 1300 nm OCT systems were employed as control systems, which perceptibly provide high-resolution and high depth penetration. Additional spectral shaping techniques, which eliminate negative effects of sidelobes and fix the bandwidth for a particular range with a Gaussian-shape spectrum were not included in the study. The primary focus of this study was to investigate the most optimal spectral band capable of examining ex vivo intra-cochlear microstructures with a higher transverse resolution along with a sufficient depth range. The aforementioned feasibility was evaluated with the fundamental conditions of the OCT systems and by maintaining quite similar conditions of NA, depth of focus, and optical power values. Hence, the implementation of 1060 nm wavelength OCT was the main objective of this study to explore how exactly 1060 nm wavelength is capable of minimizing the need of two different OCT systems. The obtained cross-sections, enface, and quantitative evaluations of the study confirmed the usefulness of longer wavelengths (1060 nm and 1300 nm) to visualize cochlea specimens compared to 860 nm wavelength range. Although the high depth penetration of 1300 nm wavelength in hard materials was proven theoretically, the depth penetration revealed similarities at 1300 nm and 1060 nm wavelengths due to the influence of water absorption by the cochlear specimen. The description of water absorption effect related depth penetration and attenuation coefficient are beyond the scope and well-described in [51,52]. Even though the 860 nm OCT system provided better transverse resolution comparatively, the 1060 nm OCT system was capable of distinguishing essential intra-cochlear microstructures, such as RM, BM, OC, O, and etc., with a favorable resolution quite similar to 860 nm OCT system. Consequently, the illustrated intensity fluctuations and quantitative evaluations of 1060 nm OCT system successfully confirmed the detection capability of intensity and thickness values correspond to inner soft bony structures, which were not detected at 860 nm and 1300 nm wavelengths verifying the achievable resolution and depth penetration for cochlea inspections. Accordingly from these results, it can be considered that there is a trade-off between imaging contrast and penetration depth, which requires a higher contrast at a greatest possible penetration depth in cochlear measurements. Here the 1060 nm OCT system compromises between the other wavelengths in terms of penetration depth and image contrast. Hence, 1060 nm wavelength band OCT system provides more precise inner anatomical structures (in enface plane) of the guinea pig cochlea specimens compared to the other OCT systems. Therefore owing to the enhanced microstructural visualization, 1060 nm wavelength OCT can be a promising solution to determine intra-cochlear microstructures, and the experimental procedure described here can be applicable for various cochlea-related applications in otorhinolaryngology.

Author Contributions

Conceptualization, J.K.; Data curation, S.K. and R.E.W.; Formal analysis, S.K.; Investigation, J.H.J., M.J. and J.K.; Methodology, J.L. and M.F.S.; Software, M.F.S.; Supervision, P.K. and M.J.; Validation, J.H.J. and M.J.; Visualization, P.K.; Writing–original draft, S.K. and R.E.W.; Writing–review & editing, R.E.W.

Funding

This research was supported by the National Research Foundation of Korea (NRF) grant funded by the Korea government, MSIT (No. 2018R1A5A1025137), Basic Science Research Program through the National Research Foundation of Korea (NRF) funded by the Ministry of Education (No. 2018R1D1A1B07043340). In part this research was also supported by the Bio & Medical Technology Development Program of the NRF funded by the Korean government (MSIP) (2017M3A9E2065282).

Conflicts of Interest

The authors declare no conflict of interest.

References

  1. Eggermont, J.J.; Roberts, L.E. The neuroscience of tinnitus. Trends Neurosci. 2004, 27, 676–682. [Google Scholar] [CrossRef] [PubMed]
  2. Sajjadi, H.; Paparella, M.M. Meniere’s disease. Lancet 2008, 372, 406–414. [Google Scholar] [CrossRef]
  3. Lin, F.R.; Yaffe, K.; Xia, J.; Xue, Q.-L.; Harris, T.B.; Purchase-Helzner, E.; Satterfield, S.; Ayonayon, H.N.; Ferrucci, L.; Simonsick, E.M. Hearing loss and cognitive decline in older adults. JAMA Intern. Med. 2013, 173, 293–299. [Google Scholar] [CrossRef] [PubMed]
  4. Cruickshanks, K.J.; Wiley, T.L.; Tweed, T.S.; Klein, B.E.; Klein, R.; Mares-Perlman, J.A.; Nondahl, D.M. Prevalence of hearing loss in older adults in beaver dam, wisconsin the epidemiology of hearing loss study. Am. J. Epidemiol. 1998, 148, 879–886. [Google Scholar] [CrossRef] [PubMed]
  5. Kesser, B.W.; Kenna, M.A. The child with hearing loss. Otolaryngol. Clin. N. Am. 2015, 48, xv–xvi. [Google Scholar] [CrossRef] [PubMed]
  6. Stevens, G.; Flaxman, S.; Brunskill, E.; Mascarenhas, M.; Mathers, C.D.; Finucane, M. Global and regional hearing impairment prevalence: An analysis of 42 studies in 29 countries. Eur. J. Public Health 2011, 23, 146–152. [Google Scholar] [CrossRef] [PubMed]
  7. Liberman, M.C.; Kujawa, S.G. Cochlear synaptopathy in acquired sensorineural hearing loss: Manifestations and mechanisms. Hear. Res. 2017, 349, 138–147. [Google Scholar] [CrossRef] [PubMed]
  8. Raphael, Y.; Altschuler, R.A. Structure and innervation of the cochlea. Brain Res. Bull. 2003, 60, 397–422. [Google Scholar] [CrossRef]
  9. Karvonen, T.; Uranishi, Y.; Sakamoto, T.; Tona, Y.; Okamoto, K.; Tamura, H.; Kuroda, T. Estimation of the degree of endolymphatic hydrops using optical coherence tomography. Adv. Biomed. Eng. 2016, 5, 19–25. [Google Scholar] [CrossRef]
  10. Zhang, K.; Zhang, Y.; Li, J.; Wang, Q. A contrastive analysis of laser heating between the human and guinea pig cochlea by numerical simulations. Biomed. Eng. Online 2016, 15, 59. [Google Scholar] [CrossRef] [PubMed]
  11. Kakigi, A.; Takubo, Y.; Egami, N.; Kashio, A.; Ushio, M.; Sakamoto, T.; Yamashita, S.; Yamasoba, T. Evaluation of the internal structure of normal and pathological guinea pig cochleae using optical coherence tomography. Audiol. Neurotol. 2013, 18, 335–343. [Google Scholar] [CrossRef] [PubMed]
  12. De Seta, D.; Torres, R.; Russo, F.Y.; Ferrary, E.; Kazmitcheff, G.; Heymann, D.; Amiaud, J.; Sterkers, O.; Bernardeschi, D.; Nguyen, Y. Damage to inner ear structure during cochlear implantation: Correlation between insertion force and radio-histological findings in temporal bone specimens. Hear. Res. 2017, 344, 90–97. [Google Scholar] [CrossRef] [PubMed] [Green Version]
  13. Counter, S.A.; Damberg, P.; Aski, S.N.; Nagy, K.; Berglin, C.E.; Laurell, G. Experimental fusion of contrast enhanced high-field magnetic resonance imaging and high-resolution micro-computed tomography in imaging the mouse inner ear. Open Neuroimaging J. 2015, 9, 7. [Google Scholar] [CrossRef]
  14. Brenner, D.J.; Hall, E.J. Computed tomography—An increasing source of radiation exposure. N. Engl. J. Med. 2007, 357, 2277–2284. [Google Scholar] [CrossRef] [PubMed]
  15. Price, D.L.; De Wilde, J.P.; Papadaki, A.M.; Curran, J.S.; Kitney, R.I. Investigation of acoustic noise on 15 mri scanners from 0.2 t to 3 t. J. Magn. Reson. Imaging 2001, 13, 288–293. [Google Scholar] [CrossRef]
  16. Huang, D.; Swanson, E.A.; Lin, C.P.; Schuman, J.S.; Stinson, W.G.; Chang, W.; Hee, M.R.; Flotte, T.; Gregory, K.; Puliafito, C.A. Optical coherence tomography. Science 1991, 254, 1178. [Google Scholar] [CrossRef] [PubMed]
  17. Lee, E.C.; de Boer, J.F.; Mujat, M.; Lim, H.; Yun, S.H. In vivo optical frequency domain imaging of human retina and choroid. Opt. Express 2006, 14, 4403–4411. [Google Scholar] [CrossRef] [PubMed] [Green Version]
  18. Vakoc, B.J.; Lanning, R.M.; Tyrrell, J.A.; Padera, T.P.; Bartlett, L.A.; Stylianopoulos, T.; Munn, L.L.; Tearney, G.J.; Fukumura, D.; Jain, R.K. Three-dimensional microscopy of the tumor microenvironment in vivo using optical frequency domain imaging. Nat. Med. 2009, 15, 1219. [Google Scholar] [CrossRef] [PubMed]
  19. Wijesinghe, R.E.; Lee, S.-Y.; Kim, P.; Jung, H.-Y.; Jeon, M.; Kim, J. Optical sensing method to analyze germination rate of capsicum annum seeds treated with growth-promoting chemical compounds using optical coherence tomography. J. Biomed. Opt. 2017, 22, 091502. [Google Scholar] [CrossRef] [PubMed]
  20. Wijesinghe, R.E.; Lee, S.-Y.; Kim, P.; Jung, H.-Y.; Jeon, M.; Kim, J. Optical inspection and morphological analysis of diospyros kaki plant leaves for the detection of circular leaf spot disease. Sensors 2016, 16, 1282. [Google Scholar] [CrossRef] [PubMed]
  21. Shirazi, M.F.; Park, K.; Wijesinghe, R.E.; Jeong, H.; Han, S.; Kim, P.; Jeon, M.; Kim, J. Fast industrial inspection of optical thin film using optical coherence tomography. Sensors 2016, 16, 1598. [Google Scholar] [CrossRef] [PubMed]
  22. Wijesinghe, R.E.; Park, K.; Jung, Y.; Kim, P.; Jeon, M.; Kim, J. Industrial resin inspection for display production using automated fluid-inspection based on multimodal optical detection techniques. Opt. Lasers Eng. 2017, 96, 75–82. [Google Scholar] [CrossRef]
  23. Drexler, W.; Morgner, U.; Ghanta, R.K.; Kärtner, F.X.; Schuman, J.S.; Fujimoto, J.G. Ultrahigh-resolution ophthalmic optical coherence tomography. Nat. Med. 2001, 7, 502–507. [Google Scholar] [CrossRef] [PubMed]
  24. Wojtkowski, M.; Leitgeb, R.; Kowalczyk, A.; Bajraszewski, T.; Fercher, A.F. In vivo human retinal imaging by fourier domain optical coherence tomography. J. Biomed. Opt. 2002, 7, 457–463. [Google Scholar] [CrossRef] [PubMed]
  25. Shirazi, M.F.; Wijesinghe, R.E.; Ravichandran, N.K.; Kim, P.; Jeon, M.; Kim, J. Dual-path handheld system for cornea and retina imaging using optical coherence tomography. Opt. Rev. 2016, 2, 219–225. [Google Scholar] [CrossRef]
  26. Fujimoto, J.G.; Brezinski, M.E.; Tearney, G.J.; Boppart, S.A.; Bouma, B.; Hee, M.R.; Southern, J.F.; Swanson, E.A. Optical biopsy and imaging using optical coherence tomography. Nat. Med. 1995, 1, 970–972. [Google Scholar] [CrossRef] [PubMed]
  27. Tearney, G.J.; Brezinski, M.E.; Bouma, B.E.; Boppart, S.A.; Pitris, C.; Southern, J.F.; Fujimoto, J.G. In vivo endoscopic optical biopsy with optical coherence tomography. Science 1997, 276, 2037–2039. [Google Scholar] [CrossRef] [PubMed]
  28. Pierce, M.C.; Strasswimmer, J.; Park, B.H.; Cense, B.; de Boer, J.F. Advances in optical coherence tomography imaging for dermatology. J. Investig. Dermatol. 2004, 123, 458–463. [Google Scholar] [CrossRef] [PubMed]
  29. Alex, A.; Považay, B.; Hofer, B.; Popov, S.; Glittenberg, C.; Binder, S.; Drexler, W. Multispectral in vivo three-dimensional optical coherence tomography of human skin. J. Biomed. Opt. 2010, 15, 026025. [Google Scholar] [CrossRef] [PubMed]
  30. Hsieh, Y.-S.; Ho, Y.-C.; Lee, S.-Y.; Chuang, C.-C.; Tsai, J.-C.; Lin, K.-F.; Sun, C.-W. Dental optical coherence tomography. Sensors 2013, 13, 8928–8949. [Google Scholar] [CrossRef] [PubMed] [Green Version]
  31. Baumgartner, A.; Dichtl, S.; Hitzenberger, C.; Sattmann, H.; Robl, B.; Moritz, A.; Fercher, A.; Sperr, W. Polarization–sensitive optical coherence tomography of dental structures. Caries Res. 2000, 34, 59–69. [Google Scholar] [CrossRef] [PubMed]
  32. Wijesinghe, R.E.; Cho, N.H.; Park, K.; Jeon, M.; Kim, J. Bio-photonic detection and quantitative evaluation method for the progression of dental caries using optical frequency-domain imaging method. Sensors 2016, 16, 2076. [Google Scholar] [CrossRef] [PubMed]
  33. Cho, N.H.; Lee, S.H.; Jung, W.; Jang, J.H.; Kim, J. Optical coherence tomography for the diagnosis and evaluation of human otitis media. J. Korean Med. Sci. 2015, 30, 328–335. [Google Scholar] [CrossRef] [PubMed]
  34. Yamaguchi, M.K.; de Boer, J.F.; Park, B.H.; Nassif, N.; Zhao, Y.; Chen, Z.; Wong, B.J. Imaging the internal structure of the guinea pig cochlea using optical coherence tomography at 1310 nm. In BIOS 2001 The International Symposium on Biomedical Optics, San Jose, CA, USA; International Society for Optics and Photonics: San Jose, CA, USA, 2001; pp. 372–378. [Google Scholar]
  35. Cho, N.H.; Jang, J.H.; Jung, W.; Kim, J. In vivo imaging of middle-ear and inner-ear microstructures of a mouse guided by sd-oct combined with a surgical microscope. Opt. Express 2014, 22, 8985–8995. [Google Scholar] [CrossRef] [PubMed]
  36. Park, K.; Cho, N.H.; Jang, J.H.; Lee, S.H.; Kim, P.; Jeon, M.; Boppart, S.A.; Kim, J.; Jung, W. In vivo 3d imaging of the human tympanic membrane using a wide-field diagonal-scanning optical coherence tomography probe. Appl. Opt. 2017, 56, D115–D119. [Google Scholar] [CrossRef] [PubMed]
  37. Sepehr, A.; Djalilian, H.R.; Chang, J.E.; Chen, Z.; Wong, B.J. Optical coherence tomography of the cochlea in the porcine model. Laryngoscope 2008, 118, 1449–1451. [Google Scholar] [CrossRef] [PubMed]
  38. Li, Y.; Shekhar, R.; Huang, D. Segmentation of 830 nm and 1310 nm Lasik Corneal Optical Coherence Tomography Images; Proc. SPIE: San Jose, CA, USA, 2002; p. 168. [Google Scholar]
  39. Wong, B.J.; Zhao, Y.; Yamaguchi, M.; Nassif, N.; Chen, Z.; De Boer, J.F. Imaging the internal structure of the rat cochlea using optical coherence tomography at 0.827 μm and 1.3 μm. Otolaryngol.-Head Neck Surg. 2004, 130, 334–338. [Google Scholar] [CrossRef] [PubMed]
  40. Puvanathasan, P.; Forbes, P.; Ren, Z.; Malchow, D.; Boyd, S.; Bizheva, K. High-speed, high-resolution fourier-domain optical coherence tomography system for retinal imaging in the 1060 nm wavelength region. Opt. Lett. 2008, 33, 2479–2481. [Google Scholar] [CrossRef] [PubMed]
  41. Esmaeelpour, M.; Považay, B.; Hermann, B.; Hofer, B.; Kajic, V.; Hale, S.L.; North, R.V.; Drexler, W.; Sheen, N.J. Mapping choroidal and retinal thickness variation in type 2 diabetes using three-dimensional 1060-nm optical coherence tomography. Invest. Ophthalmol. Vis. Sci. 2011, 52, 5311–5316. [Google Scholar] [CrossRef] [PubMed]
  42. Iyer, J.S.; Batts, S.A.; Chu, K.K.; Sahin, M.I.; Leung, H.M.; Tearney, G.J.; Stankovic, K.M. Micro-optical coherence tomography of the mammalian cochlea. Sci. Rep. 2016, 6, 33288. [Google Scholar] [CrossRef] [PubMed] [Green Version]
  43. Lee, H.Y.; Raphael, P.D.; Park, J.; Ellerbee, A.K.; Applegate, B.E.; Oghalai, J.S. Noninvasive in vivo imaging reveals differences between tectorial membrane and basilar membrane traveling waves in the mouse cochlea. Proc. Natl. Acad. Sci. USA 2015, 112, 3128–3133. [Google Scholar] [CrossRef] [PubMed] [Green Version]
  44. Lee, J.; Kim, K.; Wijesinghe, R.E.; Jeon, D.; Lee, S.H.; Jeon, M.; Jang, J.H. Decalcification using ethylenediaminetetraacetic acid for clear microstructure imaging of cochlea through optical coherence tomography. J. Biomed. Opt. 2016, 21, 081204. [Google Scholar] [CrossRef] [PubMed]
  45. Lee, H.Y.; Raphael, P.D.; Ellerbee, A.K.; Applegate, B.E.; Oghalai, J.S. Swept source optical coherence tomography for in vivo imaging and vibrometry in the apex of the mouse cochlea. In AIP Conference Proceedings; AIP Publishing: College Park, MD, USA, 2015; p. 040010. [Google Scholar]
  46. Rolland, J.P.; Meemon, P.; Murali, S.; Thompson, K.P.; Lee, K.-S. Gabor-based fusion technique for optical coherence microscopy. Opt Express 2010, 18, 3632–3642. [Google Scholar] [CrossRef] [PubMed]
  47. Wang, R.K.; Tuchin, V.V. Advanced Biophotonics: Tissue optical Sectioning; CRC Press: Boca Raton, FL, USA, 2016. [Google Scholar]
  48. Verboven, P.; Nemeth, A.; Abera, M.K.; Bongaers, E.; Daelemans, D.; Estrade, P.; Herremans, E.; Hertog, M.; Saeys, W.; Vanstreels, E. Optical coherence tomography visualizes microstructure of apple peel. Postharvest Biol. Technol. 2013, 78, 123–132. [Google Scholar] [CrossRef]
  49. Paragios, N.; Chen, Y.; Faugeras, O.D. Handbook of Mathematical Models in Computer Vision; Springer Science & Business Media: Berlin/Heidelberg, Germany, 2006. [Google Scholar]
  50. Zahnd, G.; Karanasos, A.; van Soest, G.; Regar, E.; Niessen, W.; Gijsen, F.; van Walsum, T. Quantification of fibrous cap thickness in intracoronary optical coherence tomography with a contour segmentation method based on dynamic programming. Int. J. Comput. Assist. Radiol. Surg. 2015, 10, 1383–1394. [Google Scholar] [CrossRef] [PubMed] [Green Version]
  51. Faber, D.J.; Van Der Meer, F.J.; Aalders, M.C.; van Leeuwen, T.G. Quantitative measurement of attenuation coefficients of weakly scattering media using optical coherence tomography. Opt. Express 2004, 12, 4353–4365. [Google Scholar] [CrossRef] [PubMed]
  52. Ishida, S.; Nishizawa, N. Quantitative comparison of contrast and imaging depth of ultrahigh-resolution optical coherence tomography images in 800–1700 nm wavelength region. Biomed. Opt. Express 2012, 3, 282–294. [Google Scholar] [CrossRef] [PubMed]
Figure 1. The depth dependent sensitivity fall-off comparison of the three OCT systems. (ac) The sensitivity fall-off representations of 860 nm, 1060 nm, 1300 nm OCT systems, respectively.
Electronics 07 00133 g001
Figure 2. External appearance of a guinea pig cochlea and cross-sectional representation. (a) The photograph of a guinea pig cochlea sample; (b) Cross-sectional image acquired using the 1060 nm OCT system. BM: Basilar membrane, M: modiolus, OC: organ of Corti, O: otic capsule, RM: Reissner’s membrane, SM: scala media, SV: scala vestibuli.
Electronics 07 00133 g002
Figure 3. Cross-sectional images and the corresponding normalized transverse direction intensity profiles for each (700 μm, 850 μm, and 1350 μm) depth range. (ac) were acquired using 860 nm, 1060 nm, and 1300 nm OCT systems, respectively. The upper dotted line (in orange), middle dotted line (in magenta), and lower dotted line (in white) refer to depth levels of 700 μm, 850 μm, and 1350 μm from the top range of the guinea pig cochlea specimen, respectively. Graphs (df) indicate transverse intensity fluctuation corresponds to the upper depth range (penetration depth at 700 μm). Graphs (gi) indicate transverse intensity fluctuation corresponds to the middle depth range (penetration depth at 850 μm). Graphs (jl) indicate transverse intensity fluctuation corresponds to the lower depth range (penetration depth at 1350 μm). The inset numbers (①~⑦) illustrate the seven uniform points of interest considered for the quantitative analysis of each depth range.
Electronics 07 00133 g003
Figure 4. The numerical quantifications for thickness and normalized intensity correspond to intra-cochlear microstructural positions (indicated by 7 uniform points) in each wavelength range of Figure 3. (a) FWHM thickness and the normalized intensity values correspond to seven lateral direction positions of all three OCT systems selected from 700 μm depth range; (b) FWHM thickness and the normalized intensity values correspond to seven lateral direction positions of all three OCT systems selected from 850 μm depth range; (c) FWHM thickness and the normalized intensity values correspond to seven lateral direction positions of all three OCT systems selected from 1350 μm depth range.
Electronics 07 00133 g004
Figure 5. Depth profile comparison between multiple wavelength OCT systems in terms of normalized total intensity.
Electronics 07 00133 g005
Figure 6. The volumetric images of cochlea specimens acquired using 860, 1060, and 1300 nm multiple wavelength OCT systems along with the corresponding enface representations (AI) obtained at each corresponding depth level. Red, green, and blue arrows indicate the depth levels, such as 300 μm (AC), 700 μm (DF), and 850 μm (GI), respectively, inside the cochlea. (JR) images represent the backscattered intensity based color scaled enfaced images to demonstrate the contrast enhancement. The red, green, and blue color dotted lines indicated on enface images correspond to the transverse intensity evaluations shown in Figure 7.
Electronics 07 00133 g006
Figure 7. Transverse direction intensity profiles obtained from the enface images. Red plots correspond to the transverse direction intensity plot obtained from the depth range of 300 μm, green plots correspond to the transverse direction intensity plot obtained from the depth range of 700 μm, and blue plots correspond to the transverse direction intensity plot obtained from the depth range of 850 μm in all the ex vivo cochlea volumetric images. Graphs (AC) indicate transverse intensity fluctuation corresponds to the depth range of 300 μm, (DF) indicate transverse intensity fluctuation corresponds to the depth range of 700 μm, and (GI) indicate transverse intensity fluctuation corresponds to the lower depth range of 850 μm. The inset numbers (①~⑤) illustrate the five uniform points of interest considered for the quantitative analysis of each depth range. Due to the degraded intensity level of 1350 μm depth range (specifically in 860 nm), the enface representations were not considered for the transverse intensity detection.
Electronics 07 00133 g007
Figure 8. The numerical quantifications for thickness and normalized intensity correspond to intra-cochlear microstructural positions (indicated by 5 uniform points) in each wavelength range of Figure 7. (a) FWHM thickness and the normalized intensity values correspond to five lateral direction positions of all three OCT systems selected from 300 μm depth range; (b) FWHM thickness and the normalized intensity values correspond to five lateral direction positions of all three OCT systems selected from 700 μm depth range; (c) FWHM thickness and the normalized intensity values correspond to five lateral direction positions of all three OCT systems selected from 850 μm depth range.
Electronics 07 00133 g008aElectronics 07 00133 g008b
Table 1. Optical specifications of the three OCT systems.
ModelCustomizedIVS-1000OCS1310V1
ParametersSpecifications
Central wavelength860 nm1060 nm ± 30 nm1300 nm ± 15 nm
Spectral bandwidth135 nm≥100 nm>97 nm (−10 dB cut off point)
Transverse resolution (Theoretical/Experimentally measured)9.7 μm/11.4 μm11.8 μm/14.7 μm14.4 μm/25 μm
Axial resolution air/tissue (with refractive index of 1.35) (Experimentally measured)10 μm/7.4 μm13.3 μm/9.8 μm16 μm/11.8 μm
Image acquisition speed140,000 line/s100,000 line/s100,000 line/s
Scan lens focal length18 mm18 mm18 mm
Scan lens variety wavelength rangeLSM02-BB 810~1100 nmLSM02-BB 810~1100 nmLSM02 1250~1380 nm
Numerical aperture of scan lens0.110.110.11
Optical power12.2 mW12 mW10 mW
Sensitivity97 dB101 dB105 dB

