Article

Towards a Fast and Accurate EIT Inverse Problem Solver: A Machine Learning Approach

by
Xosé Fernández-Fuentes
1,*,
David Mera
1,
Andrés Gómez
2 and
Ignacio Vidal-Franco
2
1
Centro Singular de Investigación en Tecnoloxías da Información (CITIUS), Universidade de Santiago de Compostela, Rúa de Jenaro de la Fuente Domínguez, 15782 Santiago de Compostela, Spain
2
Galicia Supercomputing Center (CESGA),Avda. de Vigo, 15705 Santiago de Compostela, Spain
*
Author to whom correspondence should be addressed.
Electronics 2018, 7(12), 422; https://doi.org/10.3390/electronics7120422
Submission received: 12 November 2018 / Revised: 8 December 2018 / Accepted: 9 December 2018 / Published: 11 December 2018
(This article belongs to the Section Bioelectronics)

Abstract

:
Different industrial and medical situations require the non-invasive extraction of information from the inside of bodies. This is usually done through tomographic methods that generate images based on internal body properties. However, the image reconstruction involves a mathematical inverse problem, for which accurate resolution demands large computation time and capacity. In this paper we explore the use of Machine Learning to develop an accurate solver for reconstructing Electrical Impedance Tomography images in real-time. We compare the results with the Iterative Gauss-Newton and the Primal Dual Interior Point Method, which are both largely used and well-validated solvers. The approaches were compared from the qualitative as well as the quantitative viewpoints. The former was focused on correctly detecting the internal body features. The latter was based on accurately predicting internal property distributions. Experiments revealed that our approach achieved better accuracy and Cohen’s kappa coefficient (97.57% and 94.60% respectively) from the qualitative viewpoint. Moreover, it also obtained better quantitative metrics with a Mean Absolute Percentage Error of 18.28%. Experiments confirmed that Neural Networks algorithms can reconstruct internal body properties with high accuracy, so they would be able to replace more complex and slower alternatives.

1. Introduction

Different industrial and medical problems require obtaining information from the inside of bodies through non-invasive methods. Typically, these problems can be solved using methods that qualitatively analyze some physical internal property and generate a representative image linked to the feature distribution. The analysis of the resulting image by an expert in the field is usually enough to get a diagnosis for dealing with many of these types of problems. However, a portion of them need a deeper analysis. They require a detailed knowledge about the studied internal property from a quantitative point of view. In other words, it is necessary to know the specific distribution value in every internal point of the examined body.
There are different non-invasive techniques that are able to record data in two or three dimensions from the inside of a body. Typically, they are named tomographies and they are used in a broad range of fields such as medicine, monitoring of industrial processes, and diagnosis of internal structures (e.g., the detection of cracks in highly loaded constructions [1]). The most well-known tomography technique is probably the Computed Tomography (CT) scan, which is produced passing X-rays through a body and recording them on the other side of the target, getting information about the density of electrons in any internal volume. There are other useful techniques that are less known such as Electrical Impedance Tomography (EIT) [2], which is typically used in biomedical imaging [3] to obtain information about the electrical conductivity of a body. The EIT process uses a set of external electrodes (in contact or not with the target) that are iteratively fed with currents according to some stimulation pattern. The resulting electrical effects are measured in the idle electrodes through some measurement model. After that, the electrical conductivity in any point of the internal volume can be calculated from the recorded measurements. We named the process of obtaining the voltage measurements forward problem, and refer to the method of estimating the internal electrical conductivity of the body through the recorded voltages as inverse problem. The latter is a highly non-linear and ill-posed problem with non-trivial solution [4]. There are different approaches to deal with it. On the first hand, some algorithms, such as the back-projection [3] and the one-step Gauss-Newton [3], assume some linearity in the response of the body to solve the problem faster at the expense of a worse accuracy. On the other hand, other algorithms such as the Primal Dual Interior Point Method (PDIPM) [5] and the Iterative Gauss-Newton (IGN) [6], use an iterative process which, starting from an initial hypothesis about the properties to calculate, solves iteratively the physical differential equations changing the values of the simulation until a convergence between the results and the real measurements is achieved. The latter techniques obtain more accurate results. However, they demand large computation time and capacity. Other promising algorithms based on Machine Learning (ML) have been lately developed. They require a complex training phase but they can deliver faster outputs once they are tuned. Typically, these algorithms are used to obtain qualitative images of the internal body properties. However, we hypothesize that they can go further and that it is also possible to obtain accurate quantitative results in order to replace more complex algorithms (e.g., iterative algorithms).
This paper describes a methodology to develop a ML model based on Artificial Neural Networks (ANNs) to solve the EIT inverse problem. Specifically, our main goal is to obtain accurate distributions of the electrical conductivity values inside bodies. Thus, the resulting conductivity distributions will be compared with the original values. The specific conductivity distributions can be used later to determine other usual information in industrial processes such as the material distribution [7] and the moisture content [8].
The paper is structured as follows: Section 2 shows the mathematical basis behind EIT; Section 3 describes previous works related to the use of ML for dealing with the inverse problem in EIT; the research methodology is detailed in Section 4; and the results as well as the conclusions are shown in Section 5 and Section 6, respectively.

2. Electrical Impedance Tomography

The solution of the forward and inverse problem in EIT allows us to obtain the inner conductivity ( σ ) distribution of a body. The mathematical model behind the forward model is explained with the generalized Laplace equation (Equation (1)) and the boundary conditions (Equations (2) and (3)) [9]:
( σ ( x , y ) Φ ) = 0 , ( x , y ) Ω
Φ = Ψ , ( x , y ) Ω
σ Φ n = J n , ( x , y ) Ω
where Φ is the electrical potential inside the Ω , σ ( x , y ) is the conductivity distribution, n represents the outer unit normal vector to Ω , J n is the electrical current density on the boundary, and Ψ is the boundary potential.
In this work, we are trying to solve the inverse problem. Thus, we want to obtain the inner distribution of the conductivity from the voltage measurements in the electrodes. This is known as the Calderón’s problem [10], which is an ill-posed problem.

3. Related Work

Promising approaches based on ML algorithms for reconstructing EIT images have been lately developed and described in Literature. However, most of them are still exploratory. A common characteristic of these approaches is that they are focused on qualitative results, so they try to correctly detect artifacts and distributions inside bodies. Nevertheless, their performance is not evaluated from a quantitative point of view due to the fact that they do not compare their results with the original conductivity distribution numerical values.
Typically, they are composed of 4 main phases: (1) The development of a dataset formed by meshes that symbolize virtual bodies; (2) the positioning of artifacts inside the meshes representing a specific body property; (3) the simulation of the tomography forward problem; and (4) the development and test of a ML model.
A simplified approach to the problem is offered by [11]. In that work, the authors developed an input dataset composed of 200 body meshes. Half of them were used for training the algorithms and the remaining for testing them. The simulation of the measured voltages (forward problem) was done via the EIDORS software [12]. A Radial Basis Function (RBF) ANN was used to reconstruct the tomographies (inverse problem). However, results were not compared with the original inputs but with the reconstructed images obtained via the EIDORS inverse problem algorithms. Models based on RBF ANNs were also used in [13,14] to recreate EIT images. They compared their results with a back-projection method and obtained much higher metrics in terms of quality and precision. However, the back-projection is a linear method with poor accuracy. Furthermore, they focused their efforts on correctly placing the artifacts inside the body and they did not explore any approach to obtain the electrical conductivity distribution.
Sébastien Martin and Charles T. M. Choi [15] developed an EIT reconstruction algorithm robust to the noise. Concretely, they trained an ANN model adding noise to the voltage measurements as well as body shape deformations to get a more stable method. In the recent past, they improved their algorithm with a preprocessed step based on a linear solver that applied before the ANN reduced the noise effect simplifying the training phase [16]. Nevertheless, results were only evaluated from the qualitative perspective.
A combination of ANNs and EIT was applied to detect a touch pressure over a sensitive skin [17]. Again, the research was only focused on qualitative metrics since no methods to accurately detect the specific amount of pressure were evaluated.
Another practical application is described in [18], where a system based on an EIT imaging method is used to control the process of fluid crystallization. Concretely, a set of ANNs allows the reconstruction of tomographic images inside reactors filled with liquid, which may undergo crystallization due to changing physico-chemical conditions. Changes in the conductivity distributions linked to the obtained images can be used to identify formed crystals.
Recently, S. J. Hamilton and A. Hauptmann [19] used a D-bar method combined with a Convolutional Neural Network (CNN) to reconstruct EIT images. D-bar methods produce robust reconstructions but with a blurred effect. However, the combination with a CNN allows to obtain much clearer images.
A novel approach to analyze the moisture of buildings was lately published [20]. The research compares the performance of three ML algorithms: Least Angle Regression (LARS), ElasticNet, and ANNs. In particular, this study is focused on the estimation of the internal humidity distribution from a qualitative point of view, where a representation based on a color scale is used to visually identify the moisture areas.

4. Methodology

The methodology followed in this paper, which is schematically described in Figure 1, is aligned with the main steps followed by similar approaches in Literature. A detailed explanation about them is shown below:

4.1. Body simulations

A collection of 10,220 artificial bodies was created in order to develop the ANN-based EIT inverse problem solver. A circular mesh with one meter radius was used to represent each body. Moreover, each mesh was composed of 844 triangular elements, which were set up with an electrical conductivity value of 1 S/m. Thus, the interior of each body had the same electrical conductivity by default. We developed an algorithm to insert a random number of artifacts (from 1 to 3) with electrical conductivity values that could range from 100 S/m to 40 S/m. Specifically, the core of each artifact was automatically fixed to 100 S/m and the remaining artifact positions were set up according to a conductivity gradient from the maximum value to the minimum one (40 S/m) placed on the artifact edges. Figure 2 shows the conductivity gradient used, which is explained with the linked color legend.
Artifacts were placed in arbitrary positions inside bodies and their radius were randomly selected. Thus, several artifacts could be joined together if the position and radius allowed it. Figure 2 shows an example of a mesh with three artifacts where two of them were built into a bigger one.

4.2. Forward Problem Simulation

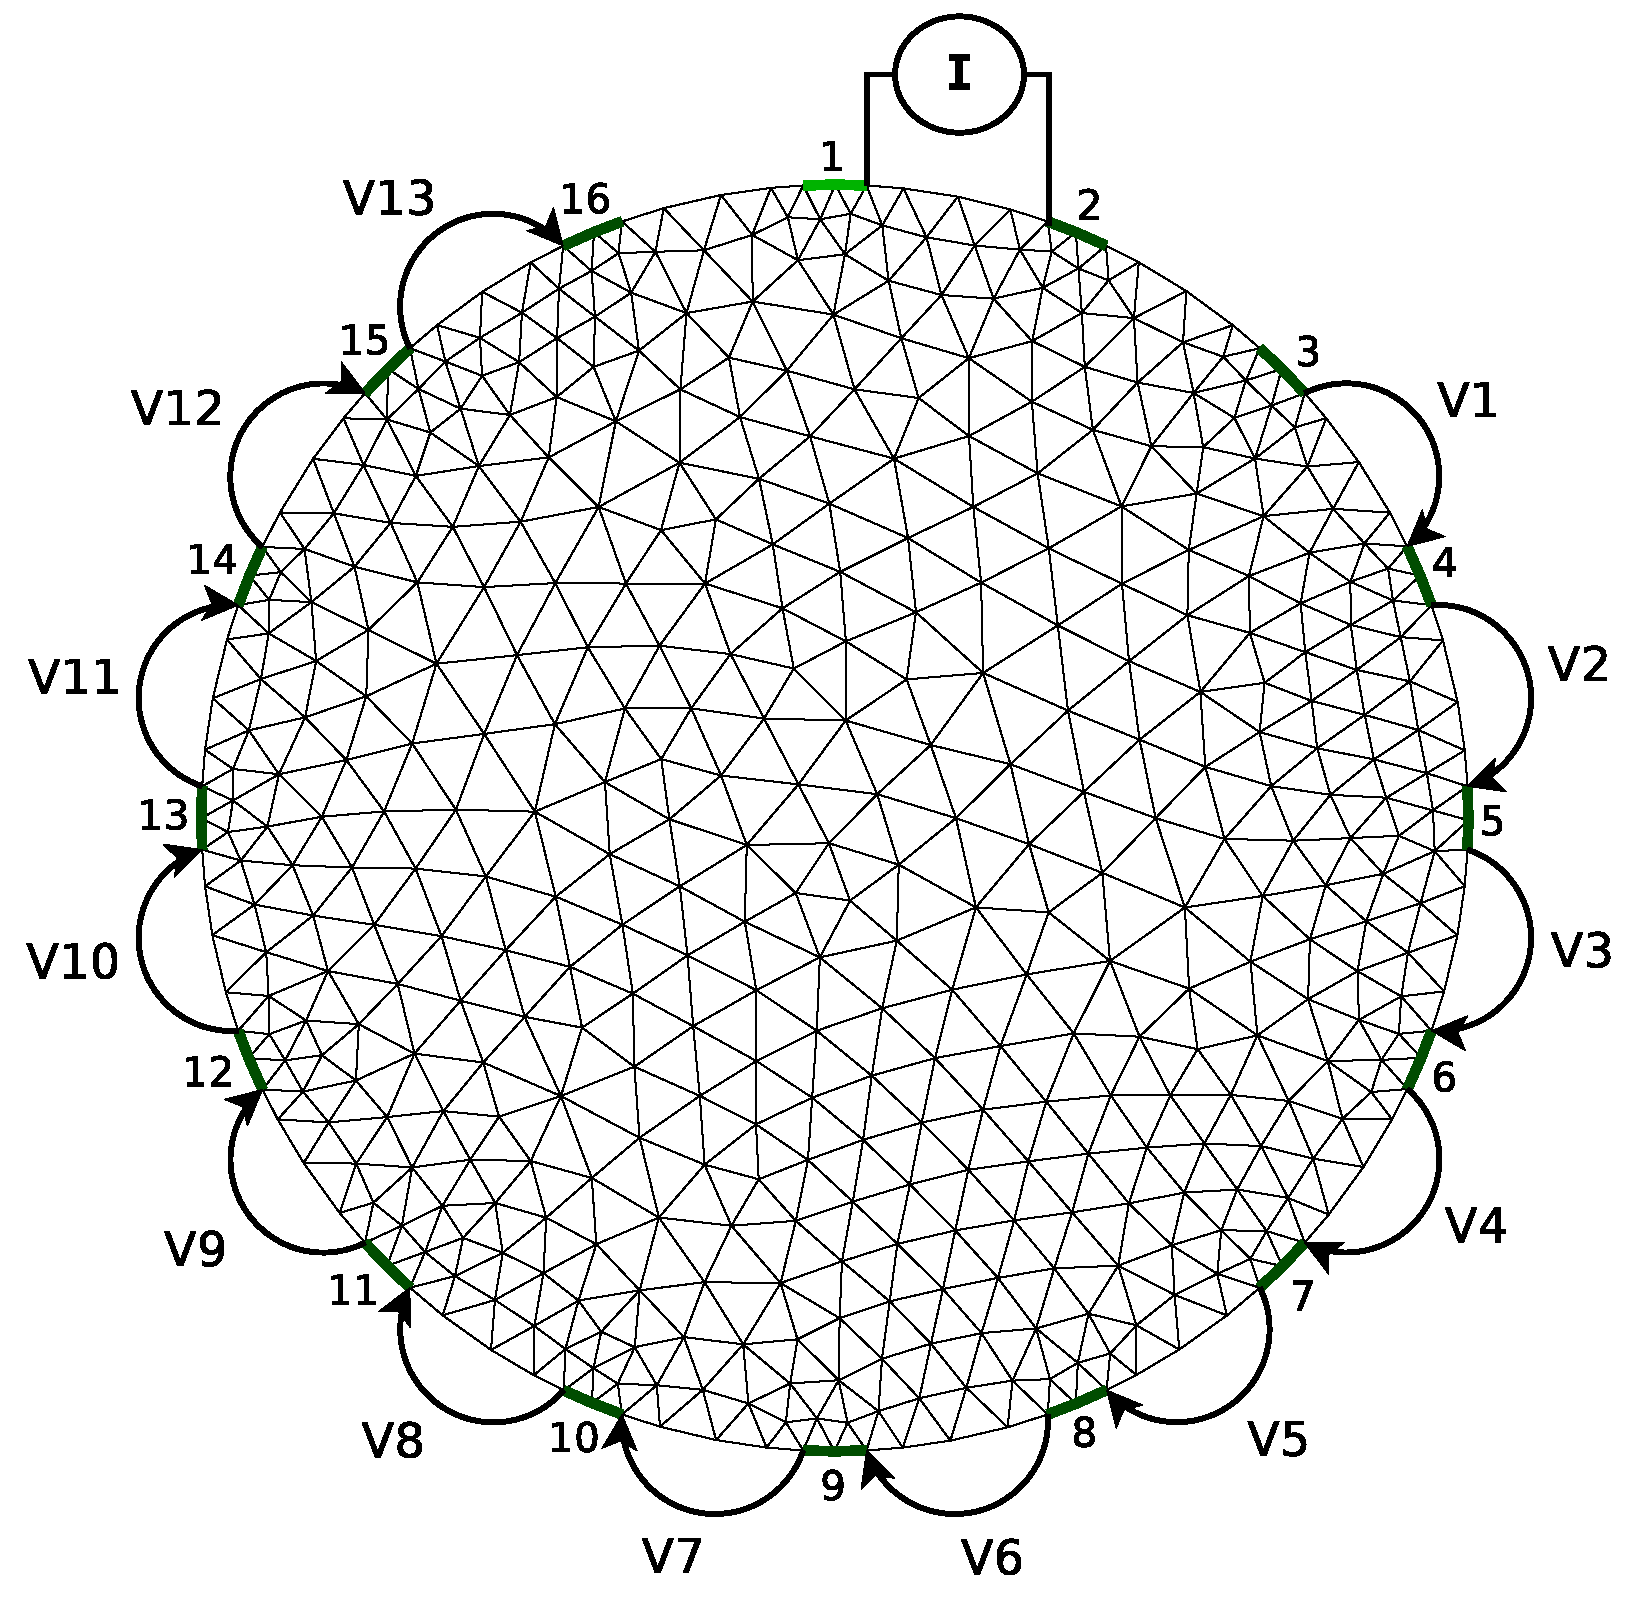
The EIDORS software was used to simulate the EIT forward problem on each virtual body instance. Basically, this software replicates the voltage measurements linked to a set of surface electrodes placed on a body boundary. In particular, our simulations were done taking into account 16 electrodes equidistantly placed around bodies as is shown in Figure 3. EIDORS uses a finite element method to solve the forward problem. However, there are different data collection strategies for extracting the array of voltage measurements. Concretely, we used the adjacent approach [3]. In this strategy, a fixed current of 0.010 A is iteratively applied on every contiguous pair of electrodes. At each iteration, a linked voltage, which is related to the electrical conductivity distribution of the artifacts placed on the mesh, is measured in the remaining electrodes. Finally, a set of 208 voltage measurements was obtained for each forward problem simulation. A detailed description of this process is explained in Figure 3. The collection of forward model outputs obtained from the virtual bodies was used to develop the ANN solver. This dataset is available on-line, so the experiments can be repeated if necessary (https://gitlab.citius.usc.es/cograde/dataset-eit).

4.3. Inverse Problem Solver

The main goal of an EIT inverse problem solver is to obtain the internal body electrical conductivity distribution analyzing a series of recorded voltage measurements. We selected a dense ANN to develop the solver due to the fact that the inverse problem is highly non-linear and the ANNs are able to model extremely non-linear relationships. In the experimental work, we employed 70% of the forward model outputs to train the ML algorithm, 15% to optimize the hyperparameter model configuration, and the remaining to obtain the test metrics. It is important to highlight that each subset was unique, i.e, there were no duplicates across the sets. Furthermore, the forward model outputs were distributed across the different datasets in a uniform way based on the size and the number of artifacts placed on the original meshes.
Several network architectures with different learning rates and number of hidden neurons were evaluated via an intensive Grid search [21]. We adopted this search method due to the fact that the number of hyperparameters to fix was low and because we could use a distributed computing environment to speed up the process. On the one hand, the range of the evaluated hidden layer neurons was established via the ‘ad hoc’ rule that this number should not be higher than the double of input neurons [22]. On the other hand, the checked learning rate values were defined through the following sequence: ( 10 k ) k = 3 1 . The units linked to the input and output neurons were fixed according to the number of voltage measurements (i.e., 208) and the total of mesh triangular components (i.e., 844) respectively. All the evaluated ANN models run 1000 epochs with a batch size (number of samples per gradient update) of 128 patterns. A summary of the used ANN parameters is shown in Table 1.
The model configuration with the best Mean Squared Error (MSE) obtained in the validation phase was selected to be the solver. In particular, our chosen ANN model was set up with 369 neurons in the hidden layer and a learning rate of 1.0.
To develop the model, we used the Keras library (v.2.0.5) with Python 2.7. Specifically, the Keras backend was Tensorflow 1.2.1 compiled with the GNU Compiler Collection (GCC) version 4.9.1 running on top of a Red Hat Enterprise Linux Server release 6.7.

4.4. Post-Processing Algorithm

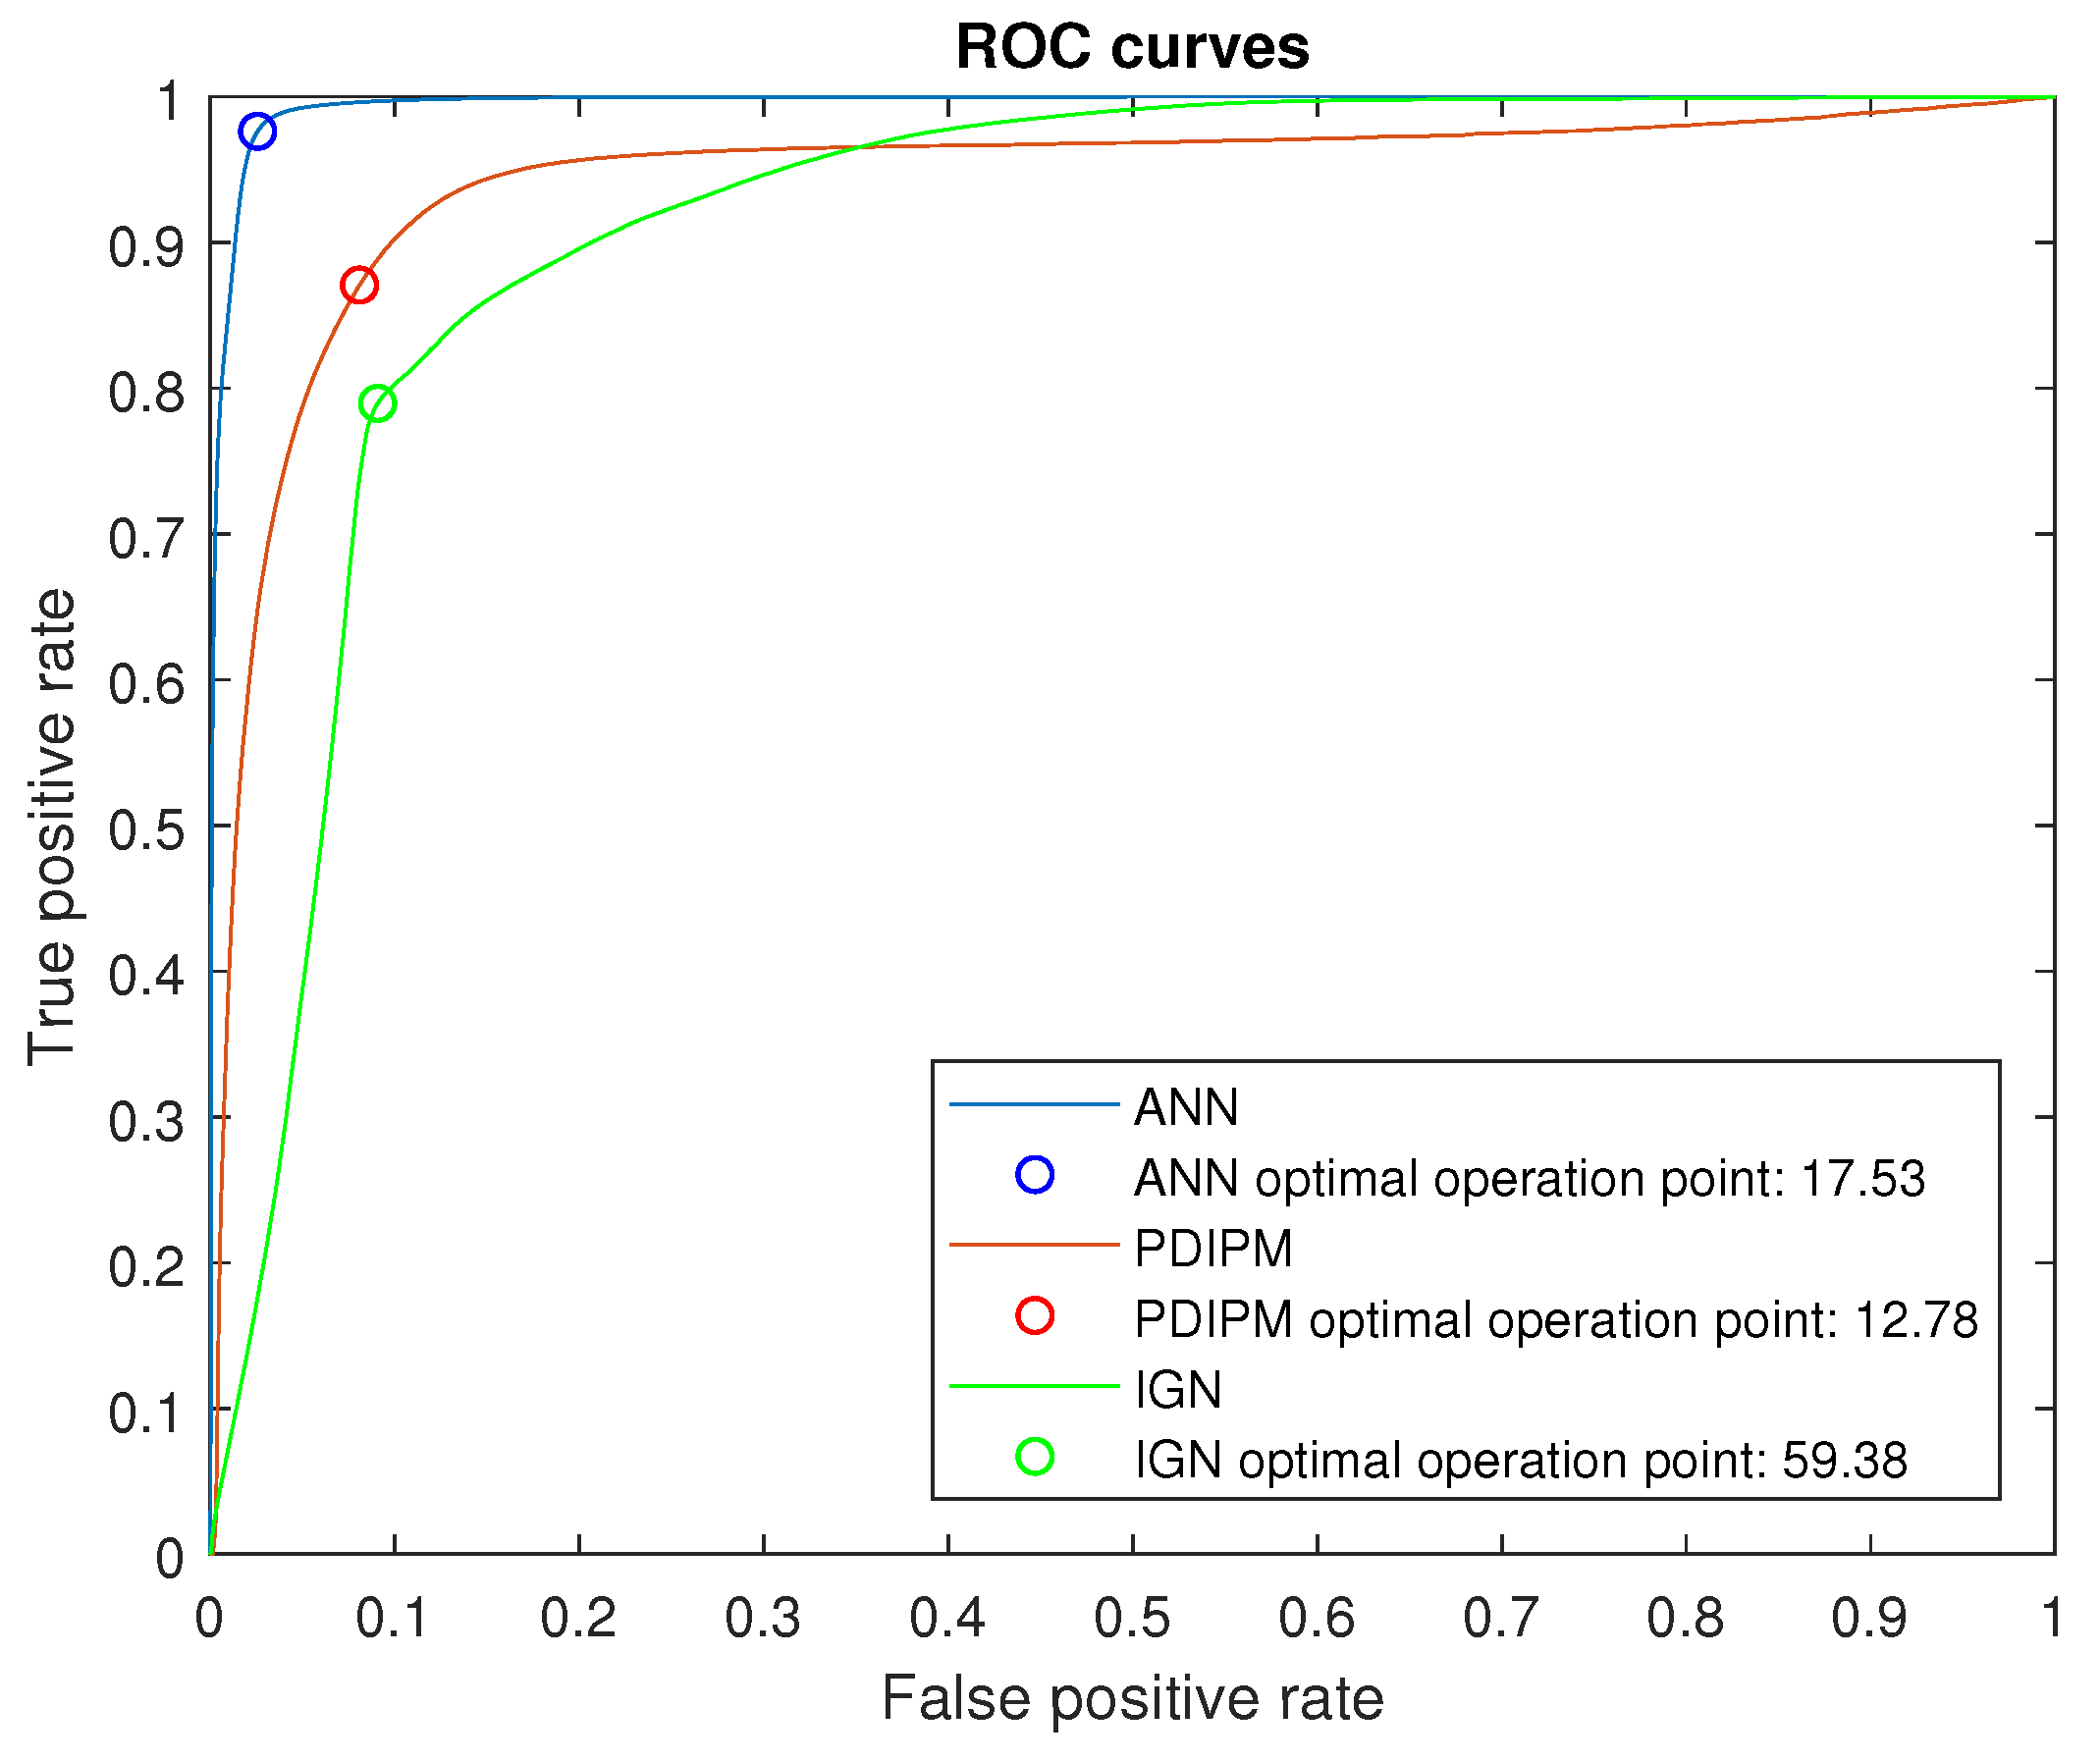
It must be noted that the ANN was developed as a regressor (network outputs take continuous values) in order to get a generic approach able to deal with different conductivity values and gradients. By its own very nature, the model outputs have a kind of noise, so we added a post-processing step to clean the reconstructed image. Basically, this process transforms the model outputs with values lower than a certain threshold into background. To select this optimal threshold we applied a Receiver Operating Characteristic (ROC) curve as shown in Figure 4 (blue line). Fundamentally, this method obtains an optimal operation point where the sensitivity (true-positive rate) is maximized and the probability of a false alarm is minimized. Experiments with the validation dataset fixed the optimal operation point in 17.53.

5. Results and Discussion

We evaluated our approach from both a qualitative and a quantitative point of view. After that, we compared the results with two very well-known methods for reconstructing tomographies: The PDIPM [5] and the IGN [6]. All the metrics presented in this section were obtained testing the approaches with the set of data saved for testing purposes. It must be noted that we set up some parameters of the PDIPM and IGN methods to take advantage of our dataset, which has images with an electrical conductivity range between 1 S/m and 100 S/m. It is important to highlight that these parameters should be fixed again in case of the range of electrical conductivity is modified.
In the case of the PDIPM, we selected the Laplace method [23] to calculate the image priors. Furthermore, we specified the conductivity background value to calculate the Jacobian matrix. Typically, this parameter is fixed with a value close to the real conductivity distribution. In particular, we evaluated all the possibilities in a sequence from 1 to 100 and we obtained the best results setting it up in 50. Finally, we fixed the regularization hyperparameter in two steps: Firstly, we tested all the values obtained in the sequence ( 10 i ) i = 6 1 , getting the best results with i = 5 . Secondly, we evaluated in more detail the range selected in the previous step. Thus, we tried all the values from the following sequence: ( j × 10 5 ) j = 1 9 . The best results were achieved with 4 × 10 5 .
The IGN parameters were selected in a similar way than the PDIPM ones. We selected the Newton’s One Step Error Reconstructor (NOSER) algorithm [24] to calculate the image priors. Moreover, we used 60 as the conductivity background value to calculate the Jacobian matrix. Finally, we tested all the values in the sequence ( 10 k ) k = 4 1 to establish the regularization hyperparameter. The best results were obtained with 0.01.
It must be noted that the PDIPM as well as the IGN are iterative algorithms, so we fixed 50 as the number of iterations for each one.
The quality of our procedure was estimated taking into account the accuracy to correctly classify the mesh cells into background and artifact. The test set was composed of 1533 meshes, where 66.04% of the total number of cells corresponded to background and 33.96% to artifacts (thus, a classifier which always predicts the majority class, background, would achieve 66.04% of accuracy). In order to calculate this metric with the evaluated approaches, we transformed the conductivity outputs in labels (background and artifact) using the following methods:
  • ANN + post-processing step: We assigned the background label to all the elements with 1 S/m of conductivity and the artifact label to the remaining ones.
  • IGN: The artifact label was linked to the outputs with conductivity values equal or higher than the minimum artifact conductivity (40 S/m). Lower values were assigned as background.
  • PDIPM: We attached the artifact label to all the outputs with equal or higher conductivity value than the optimal operation point obtained through the ROC curve (see red line in Figure 4). In any other case, the outputs were labeled as background.
We would like to highlight that we tried to use the same procedure to establish the optimum threshold with the three approaches. However, the ROC curve of the IGN method established the optimal operation point in 59.38 (see green line in Figure 4). Therefore, this threshold was discarded since it was higher that the minimum artifact conductivity value.
Table 2, Table 3 and Table 4 display the confusion matrix of each of the three approaches, where accuracy metrics can be evaluated. It indicates that only 2.2% of the elements were misclassified by the ANN approach. In the case of the PDIPM, the value rises to 9.5%, whereas the IGN solver obtained a percentage of incorrectly classified elements close to 21%. The accuracy can be also analyzed from the artifact and the background viewpoints as is shown in Table 5. The three approaches show a similar artifact accuracy. However, in the case of the background accuracy, the IGN is clearly worst due to the fact that it tends to classify elements as artifacts (false positives). The three approaches were also evaluated using the Cohen Kappa ( κ ) coefficient [25], which measures the agreement between the desired label and the label given by the model output excluding the probability of agreement by chance. This metric is commonly considered more robust than the accuracy and its value is usually lower. The ANN approach obtained a remarkable κ of 94.60%. The PDIPM solver got a κ of 78.89%. However, the IGN is severely penalized with a κ of 58.74% due to the high ratio of false positives.
From the quantitative point of view, we evaluated the precision for each inverse solver at predicting artifact conductivity distributions. Our approach obtained a normalized MSE of 0.077, the PDIPM solver got 0.459, and the Gauss Newton solver obtained 0.736. Taking only into account the area of artifacts and comparing the results with the original conductivity distributions, the ANN solver obtained a Mean Absolute Percentage Error (MAPE) of 18.28%. In the case of the PDIPM solver, it got 50.31%. Whereas the IGN method got 32.73%. Surprisingly, the PDIPM solver obtained worst MAPE than the IGN method despite it has better quality metrics. Experiments showed that PDIPM is able to detect with high accuracy the artifacts as well as the background. However, it cannot reproduce the conductivity gradients and assign appropriate conductivity values. Experiments also proved that once the ANN solver is trained, it has better accuracy to predict the conductivity than iterative and slower approaches. We show below some specific cases of our test set for comparative purpose.
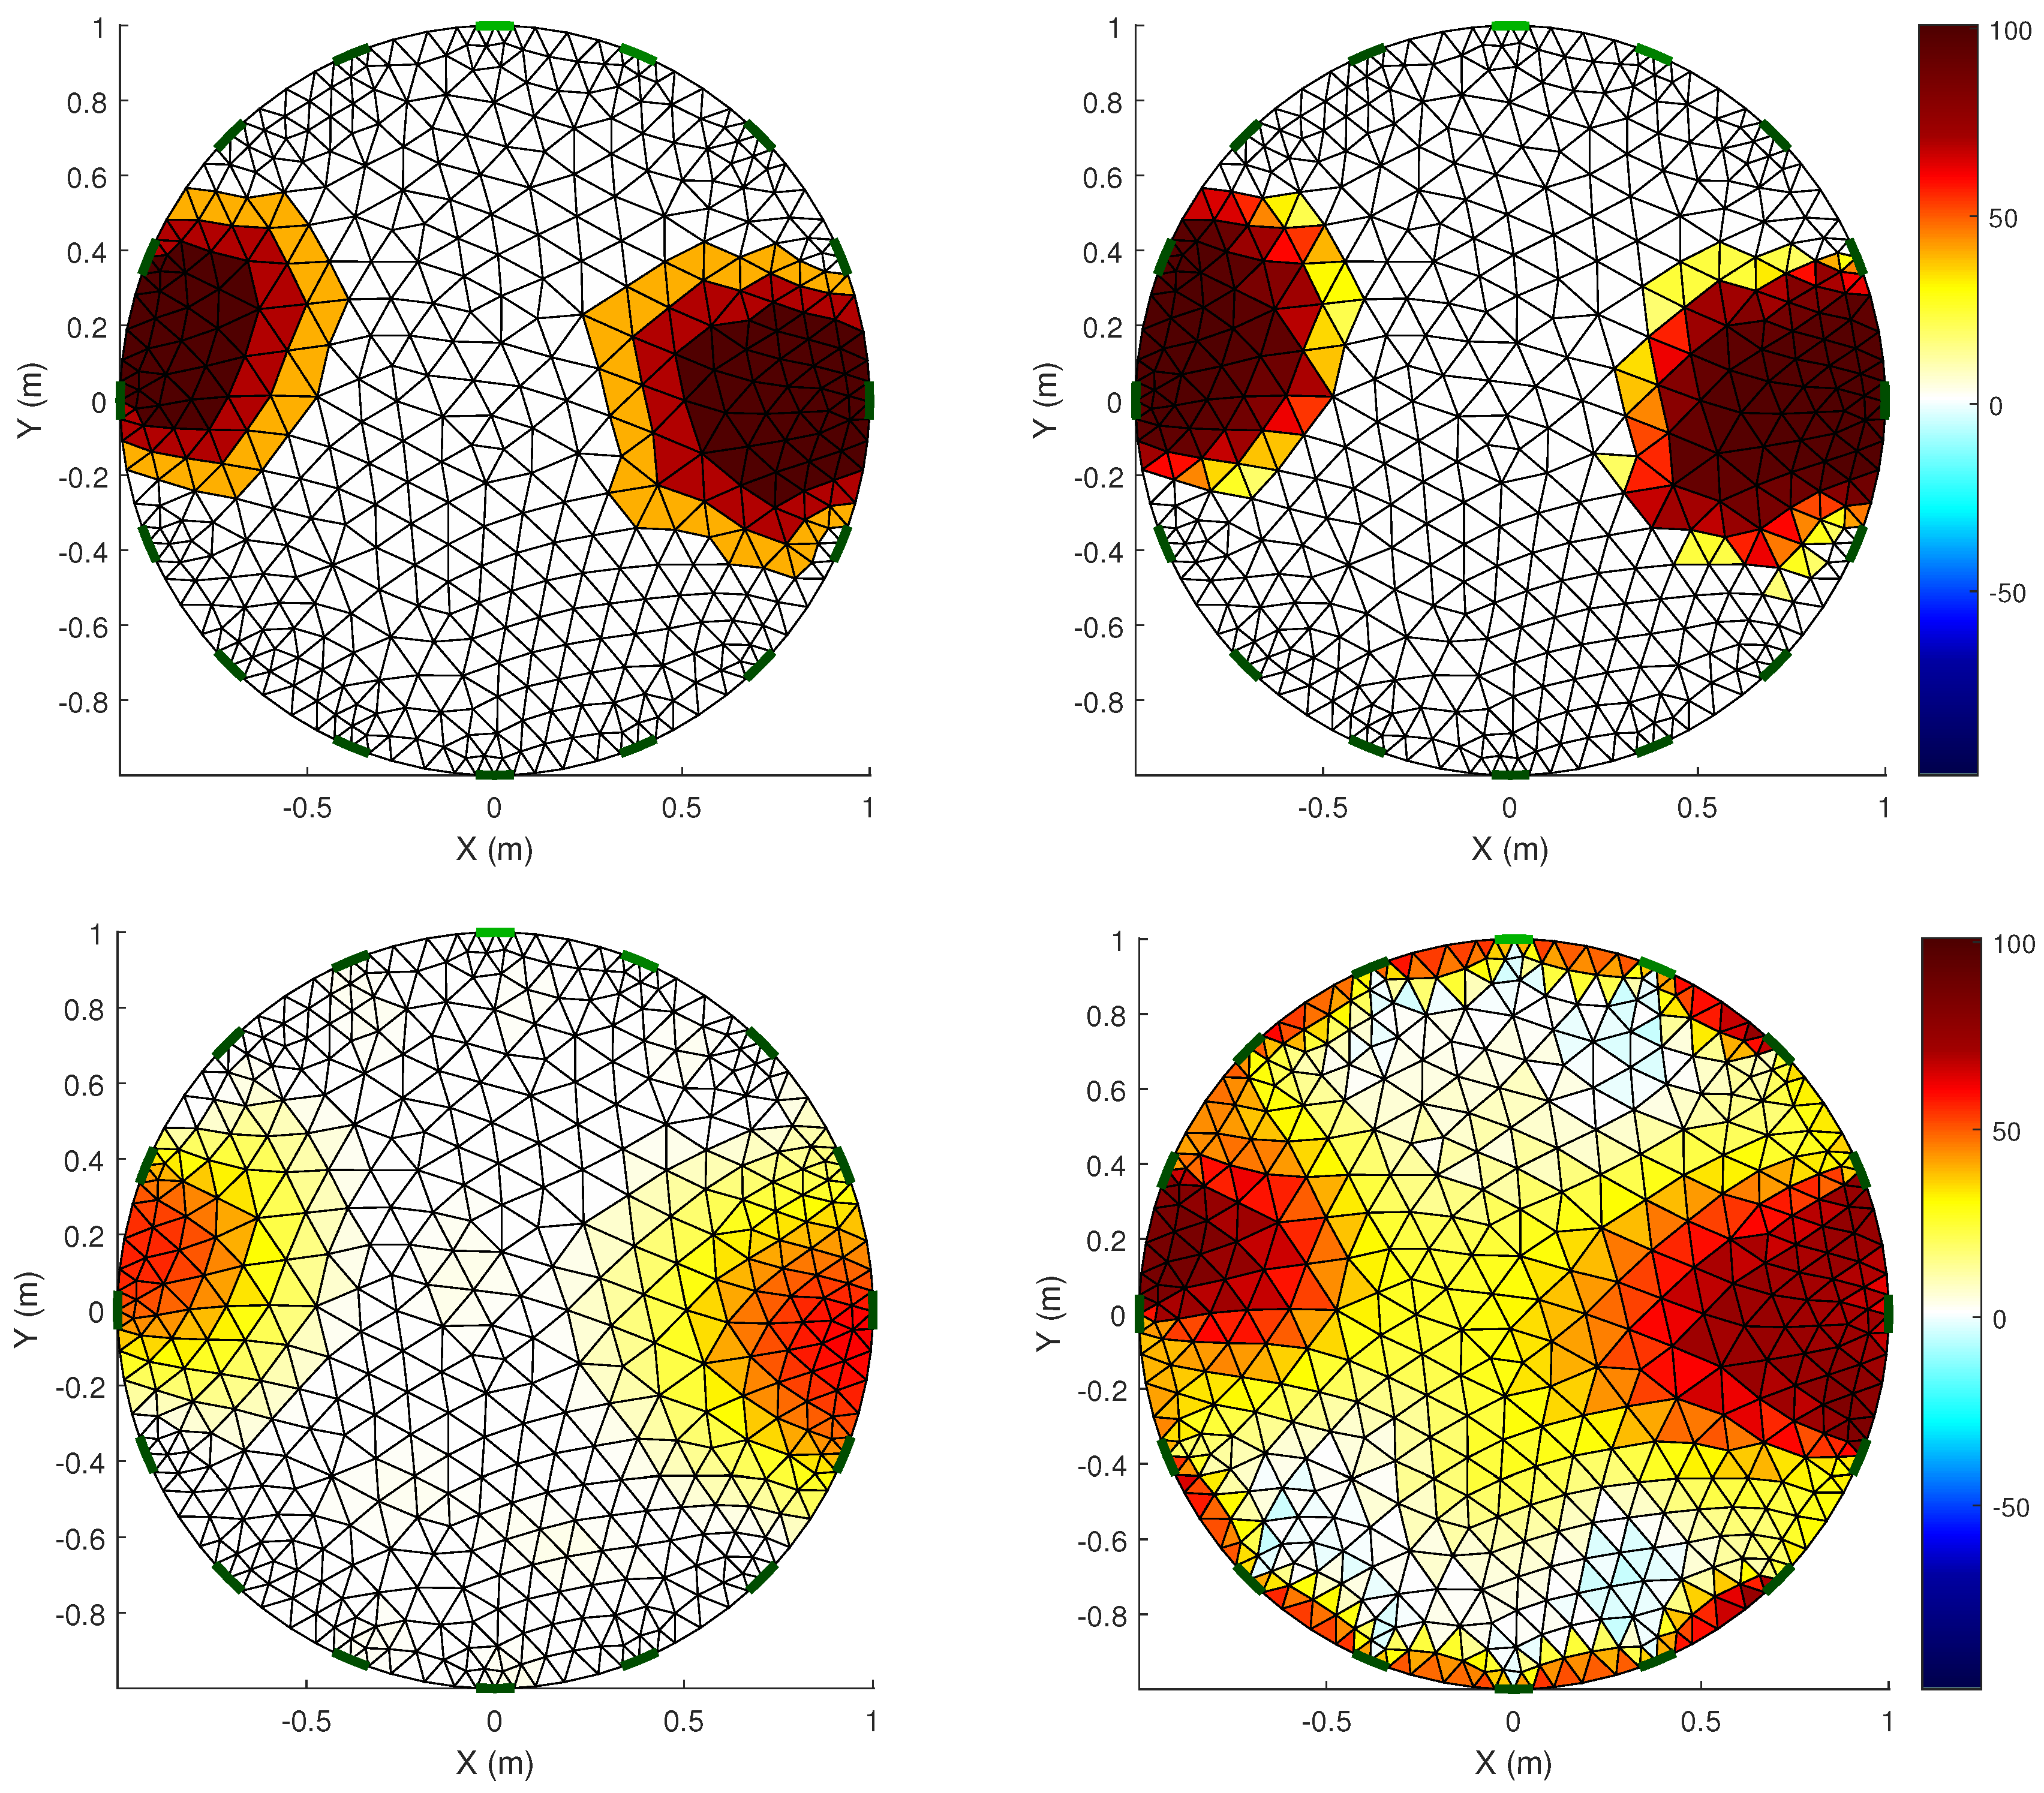
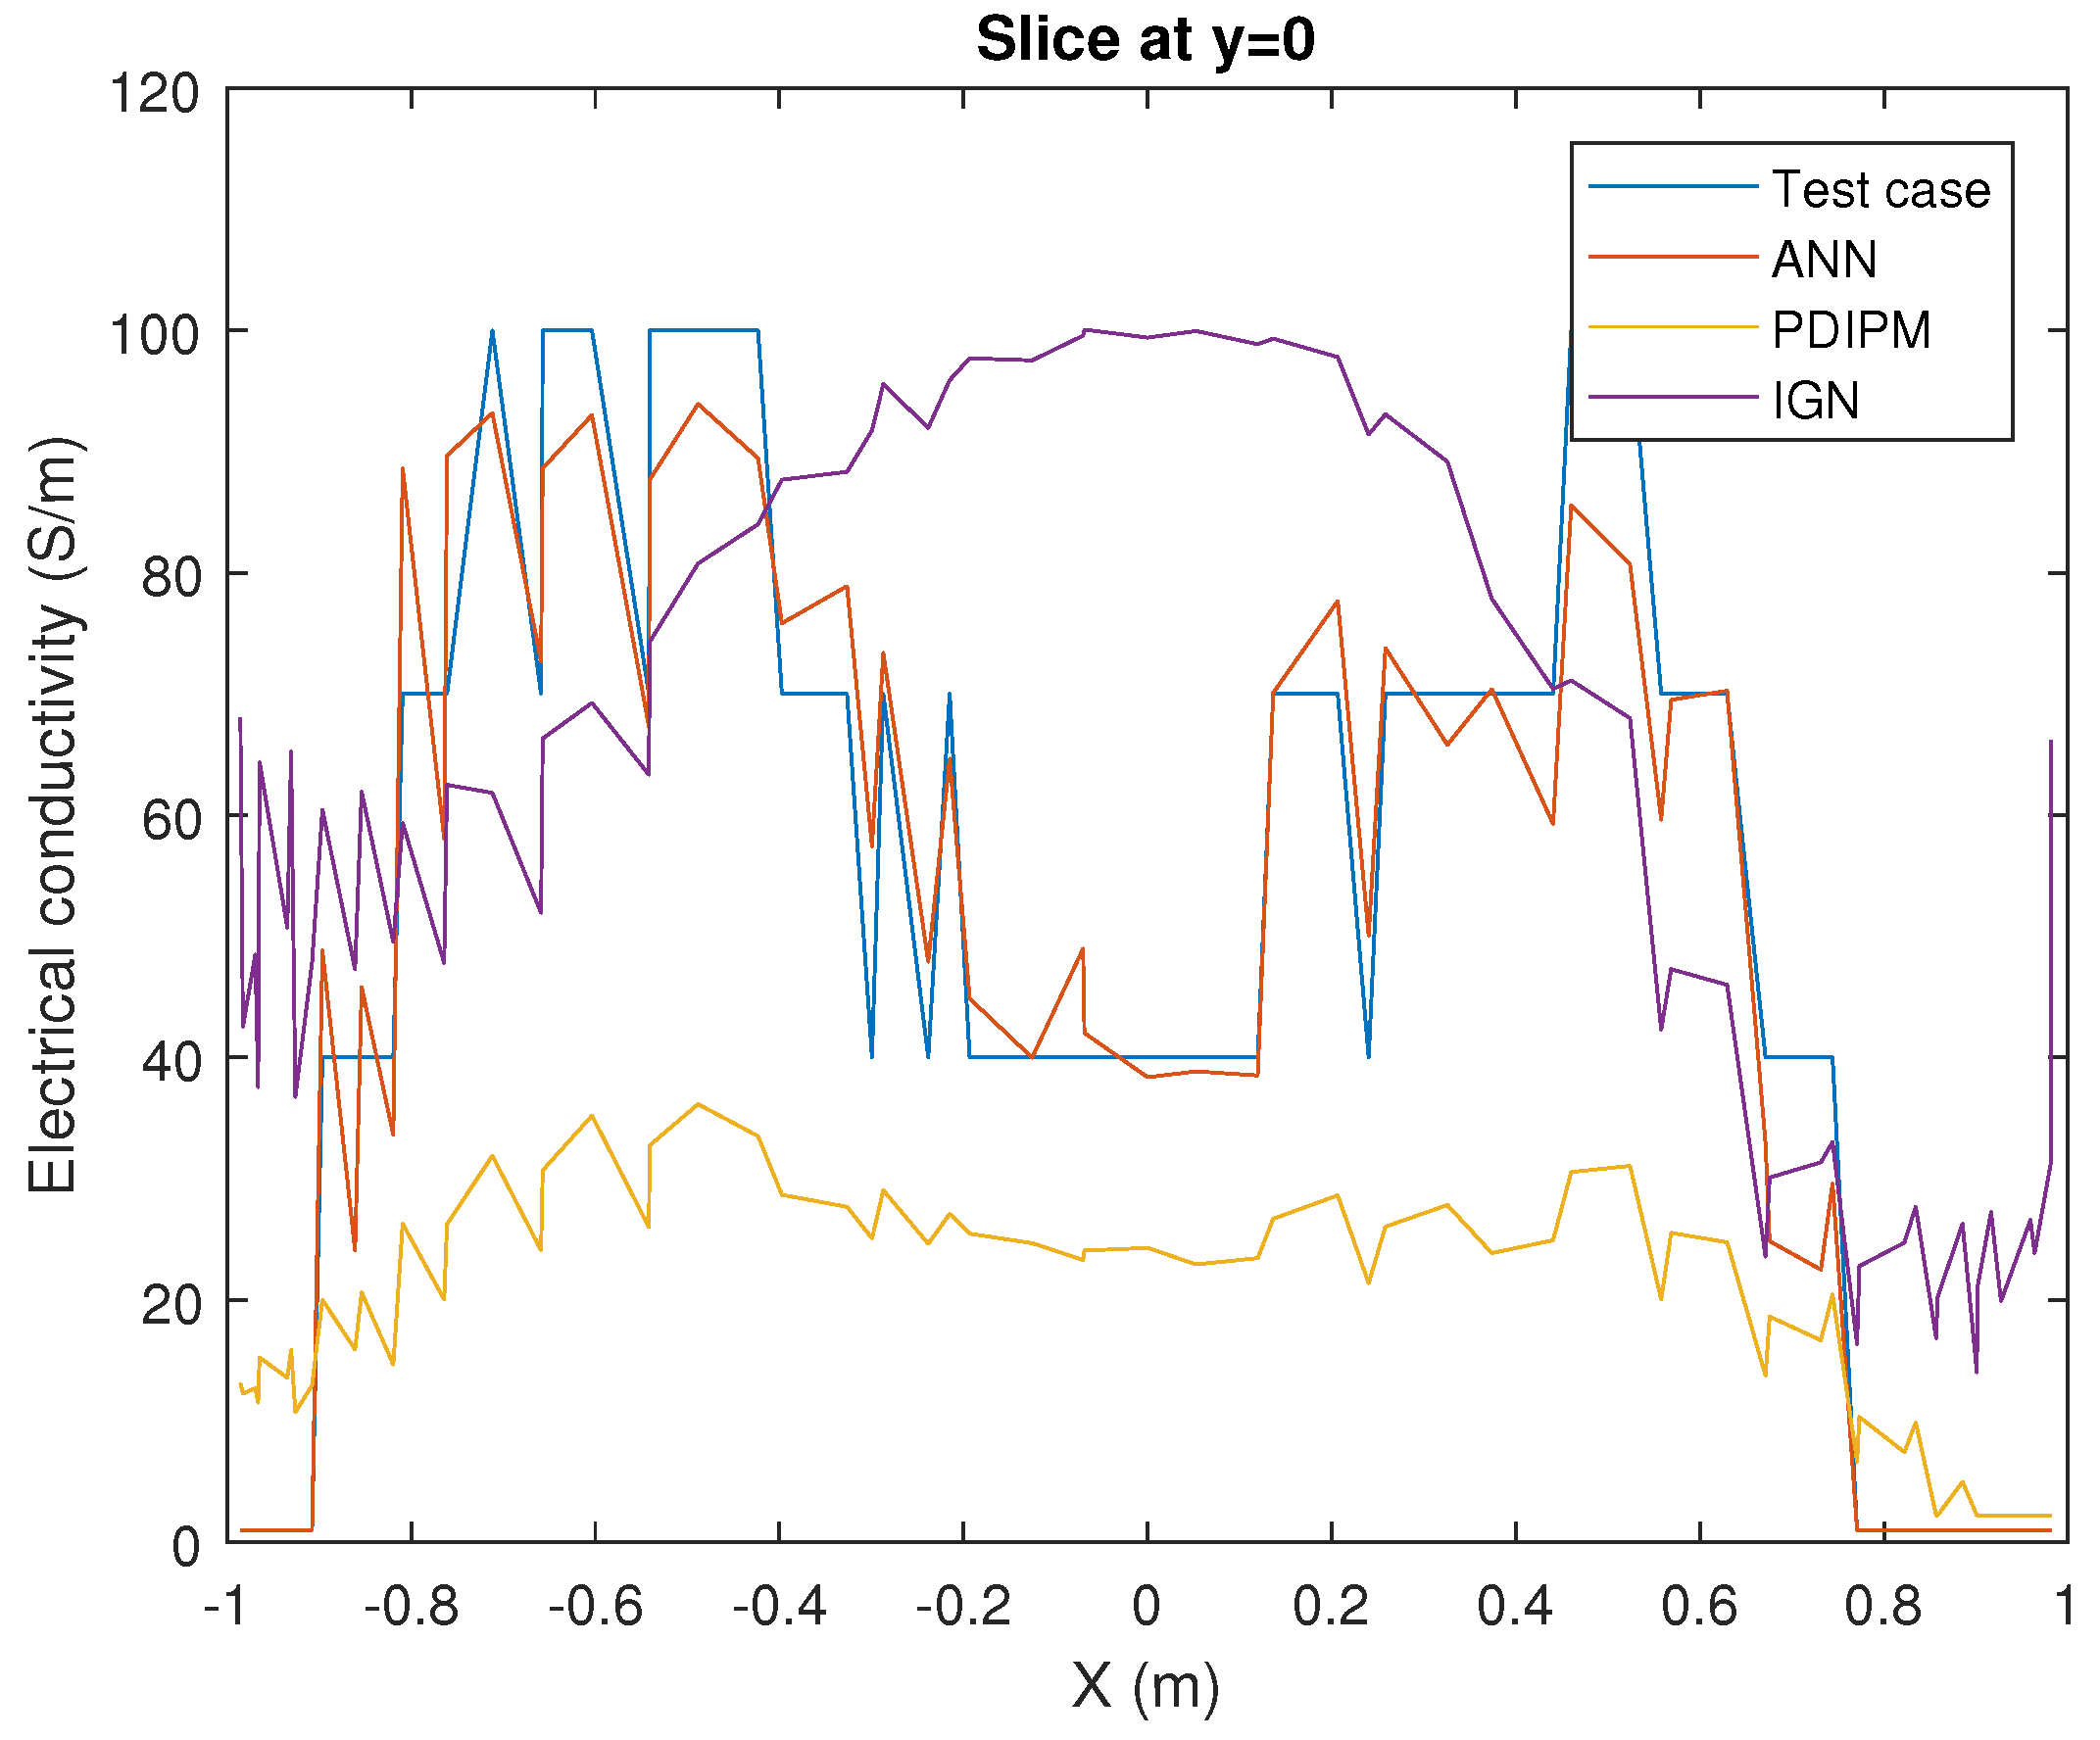
Figure 5 presents a test case with one artifact in the middle of the mesh. This can be considered a simple scenario where the three approaches are able to detect and to reconstruct the image. However, the reconstructed conductivity value of the PDIPM approach is quite below the expected value. In the case of the IGN, it can detect the core of the artifact correctly, but it presents multiple false positives around it, which is in line with metrics of Table 5. Figure 6 shows a slide at y = 0 , where the quantitative results can be easily and visually compared. The ANN solver presents slightly conductivity differences with the target. However, it reconstructs the conductivity gradient with better accuracy than the PDIPM or the IGN during all the slide.
Figure 7 and Figure 8 display two test scenarios where two artifacts were placed. In the first case, the three methods can detect the core of both artifacts. However, the IGN approach presents many false positives. Oppositely, the PDIPM method is able to accurately detect both artifacts and the background. Nevertheless, it always obtains conductivity values lower than the original ones (see Figure 9).
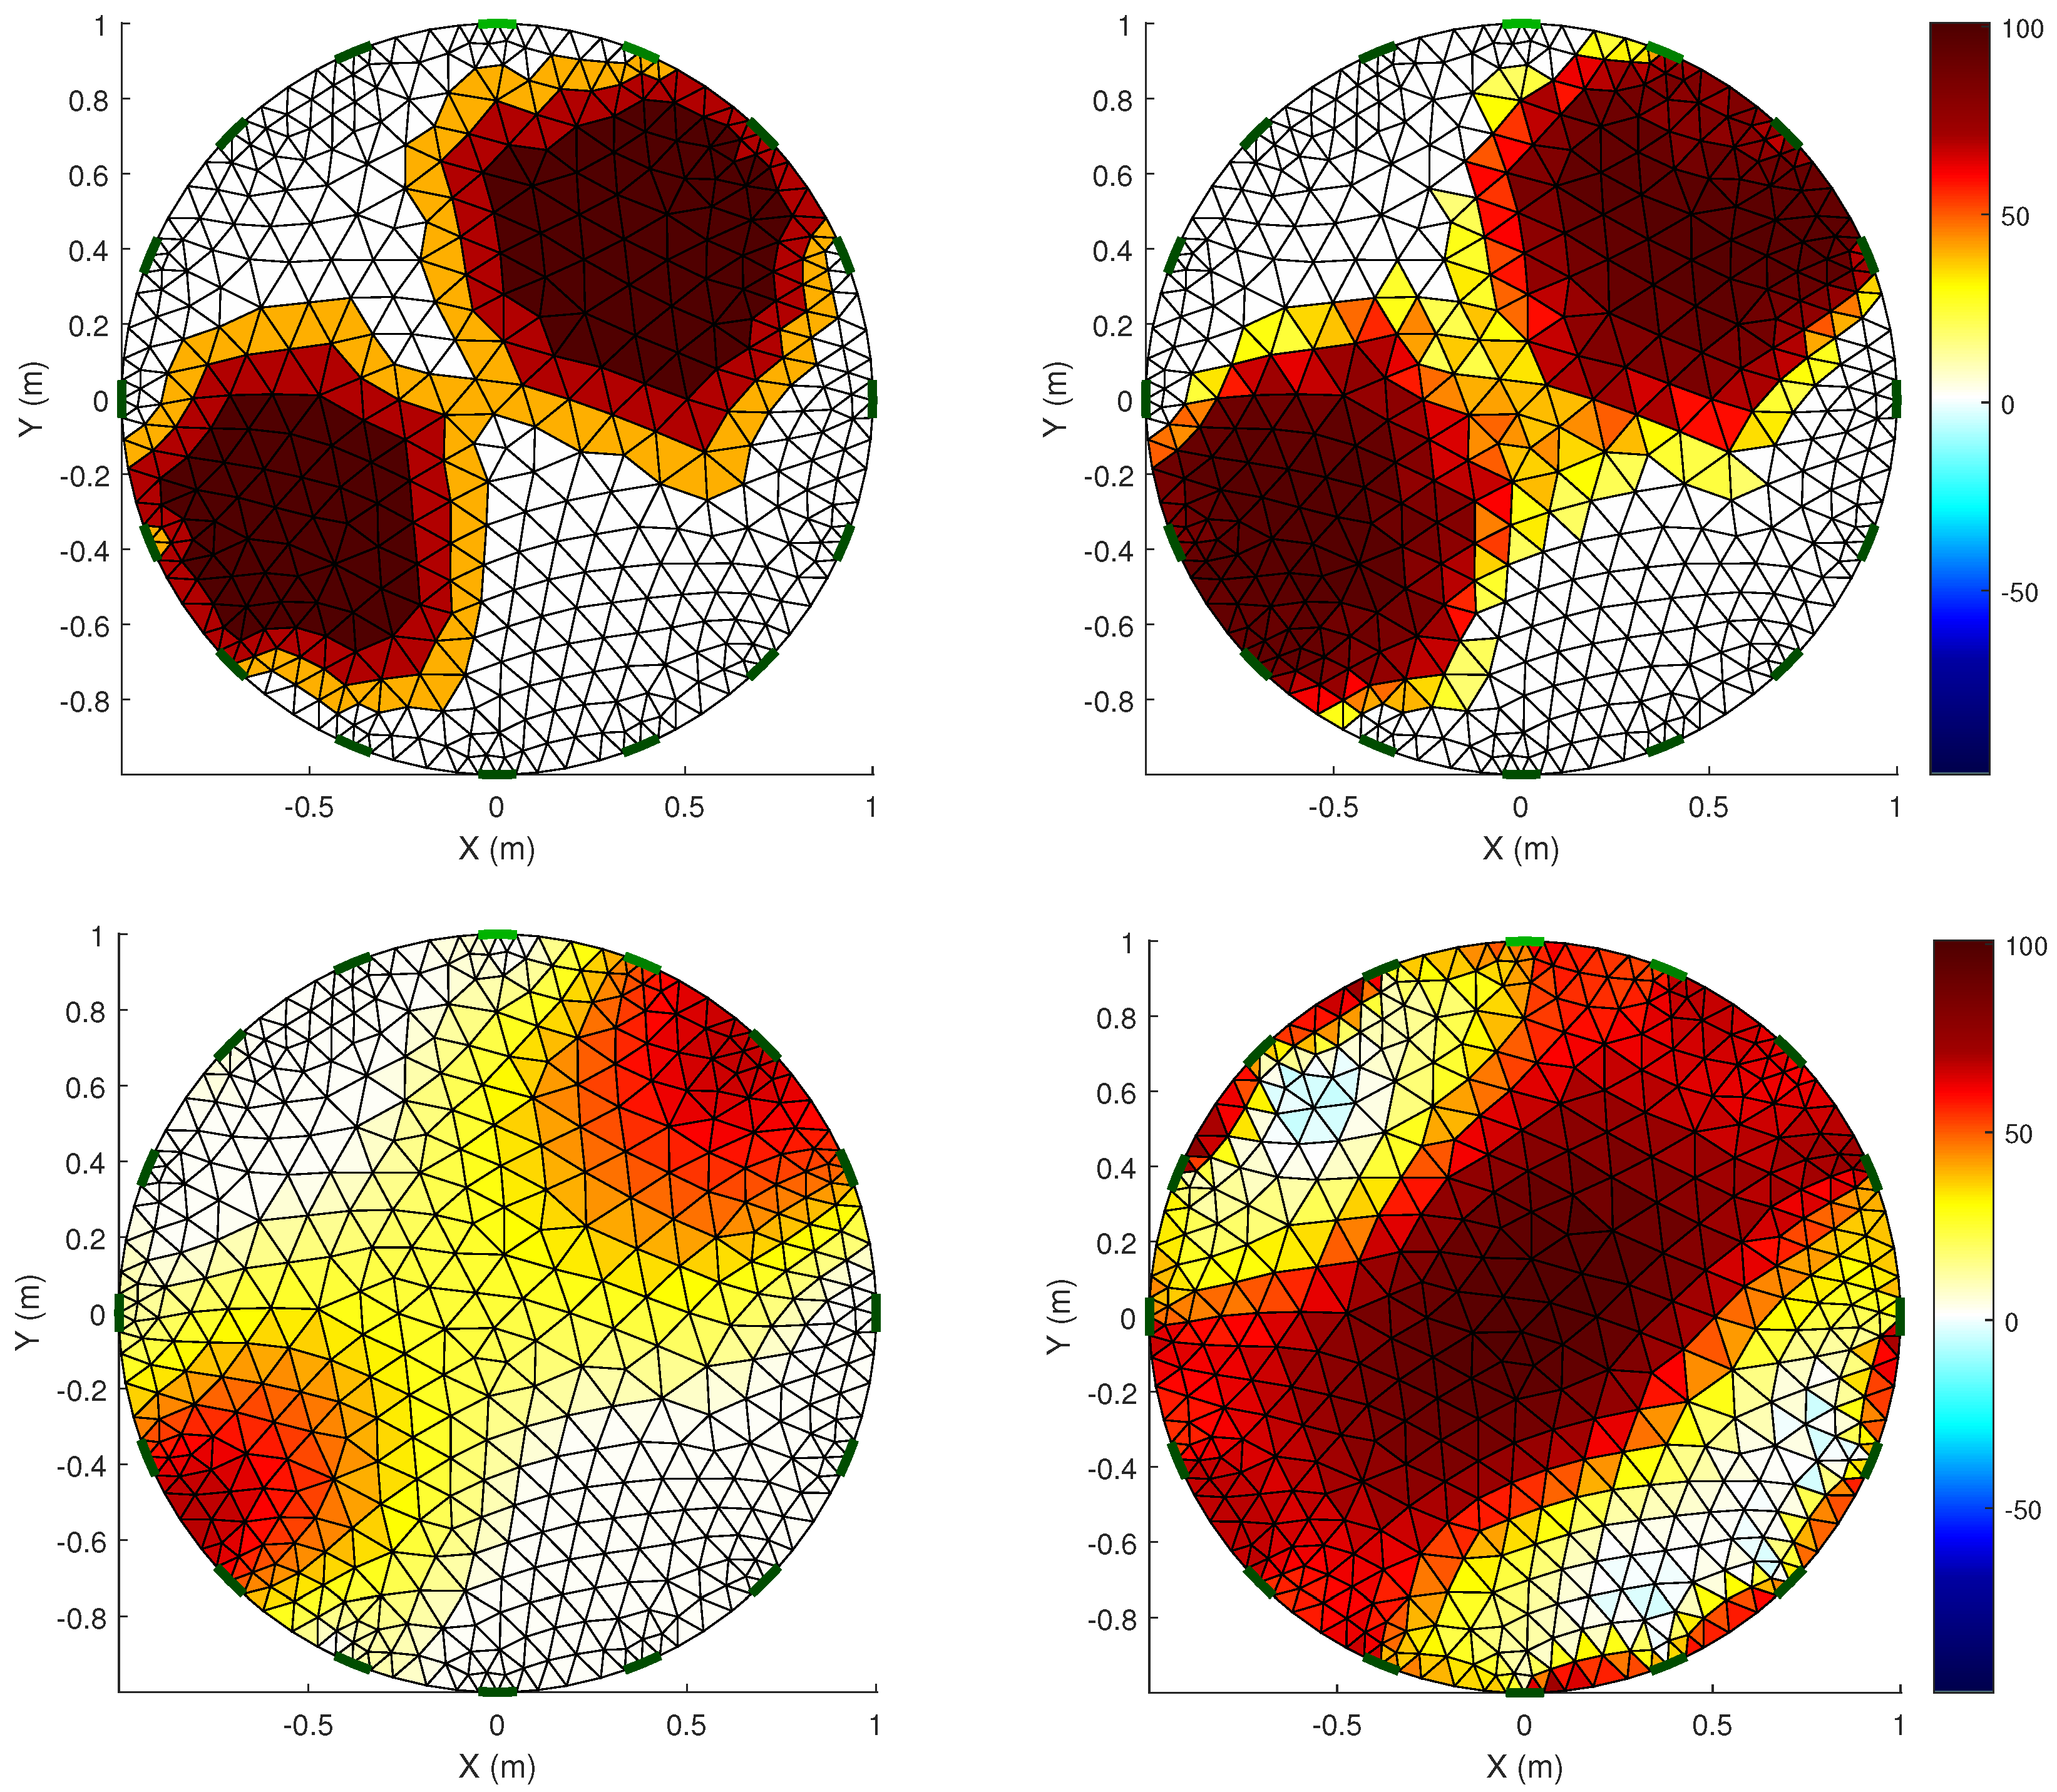
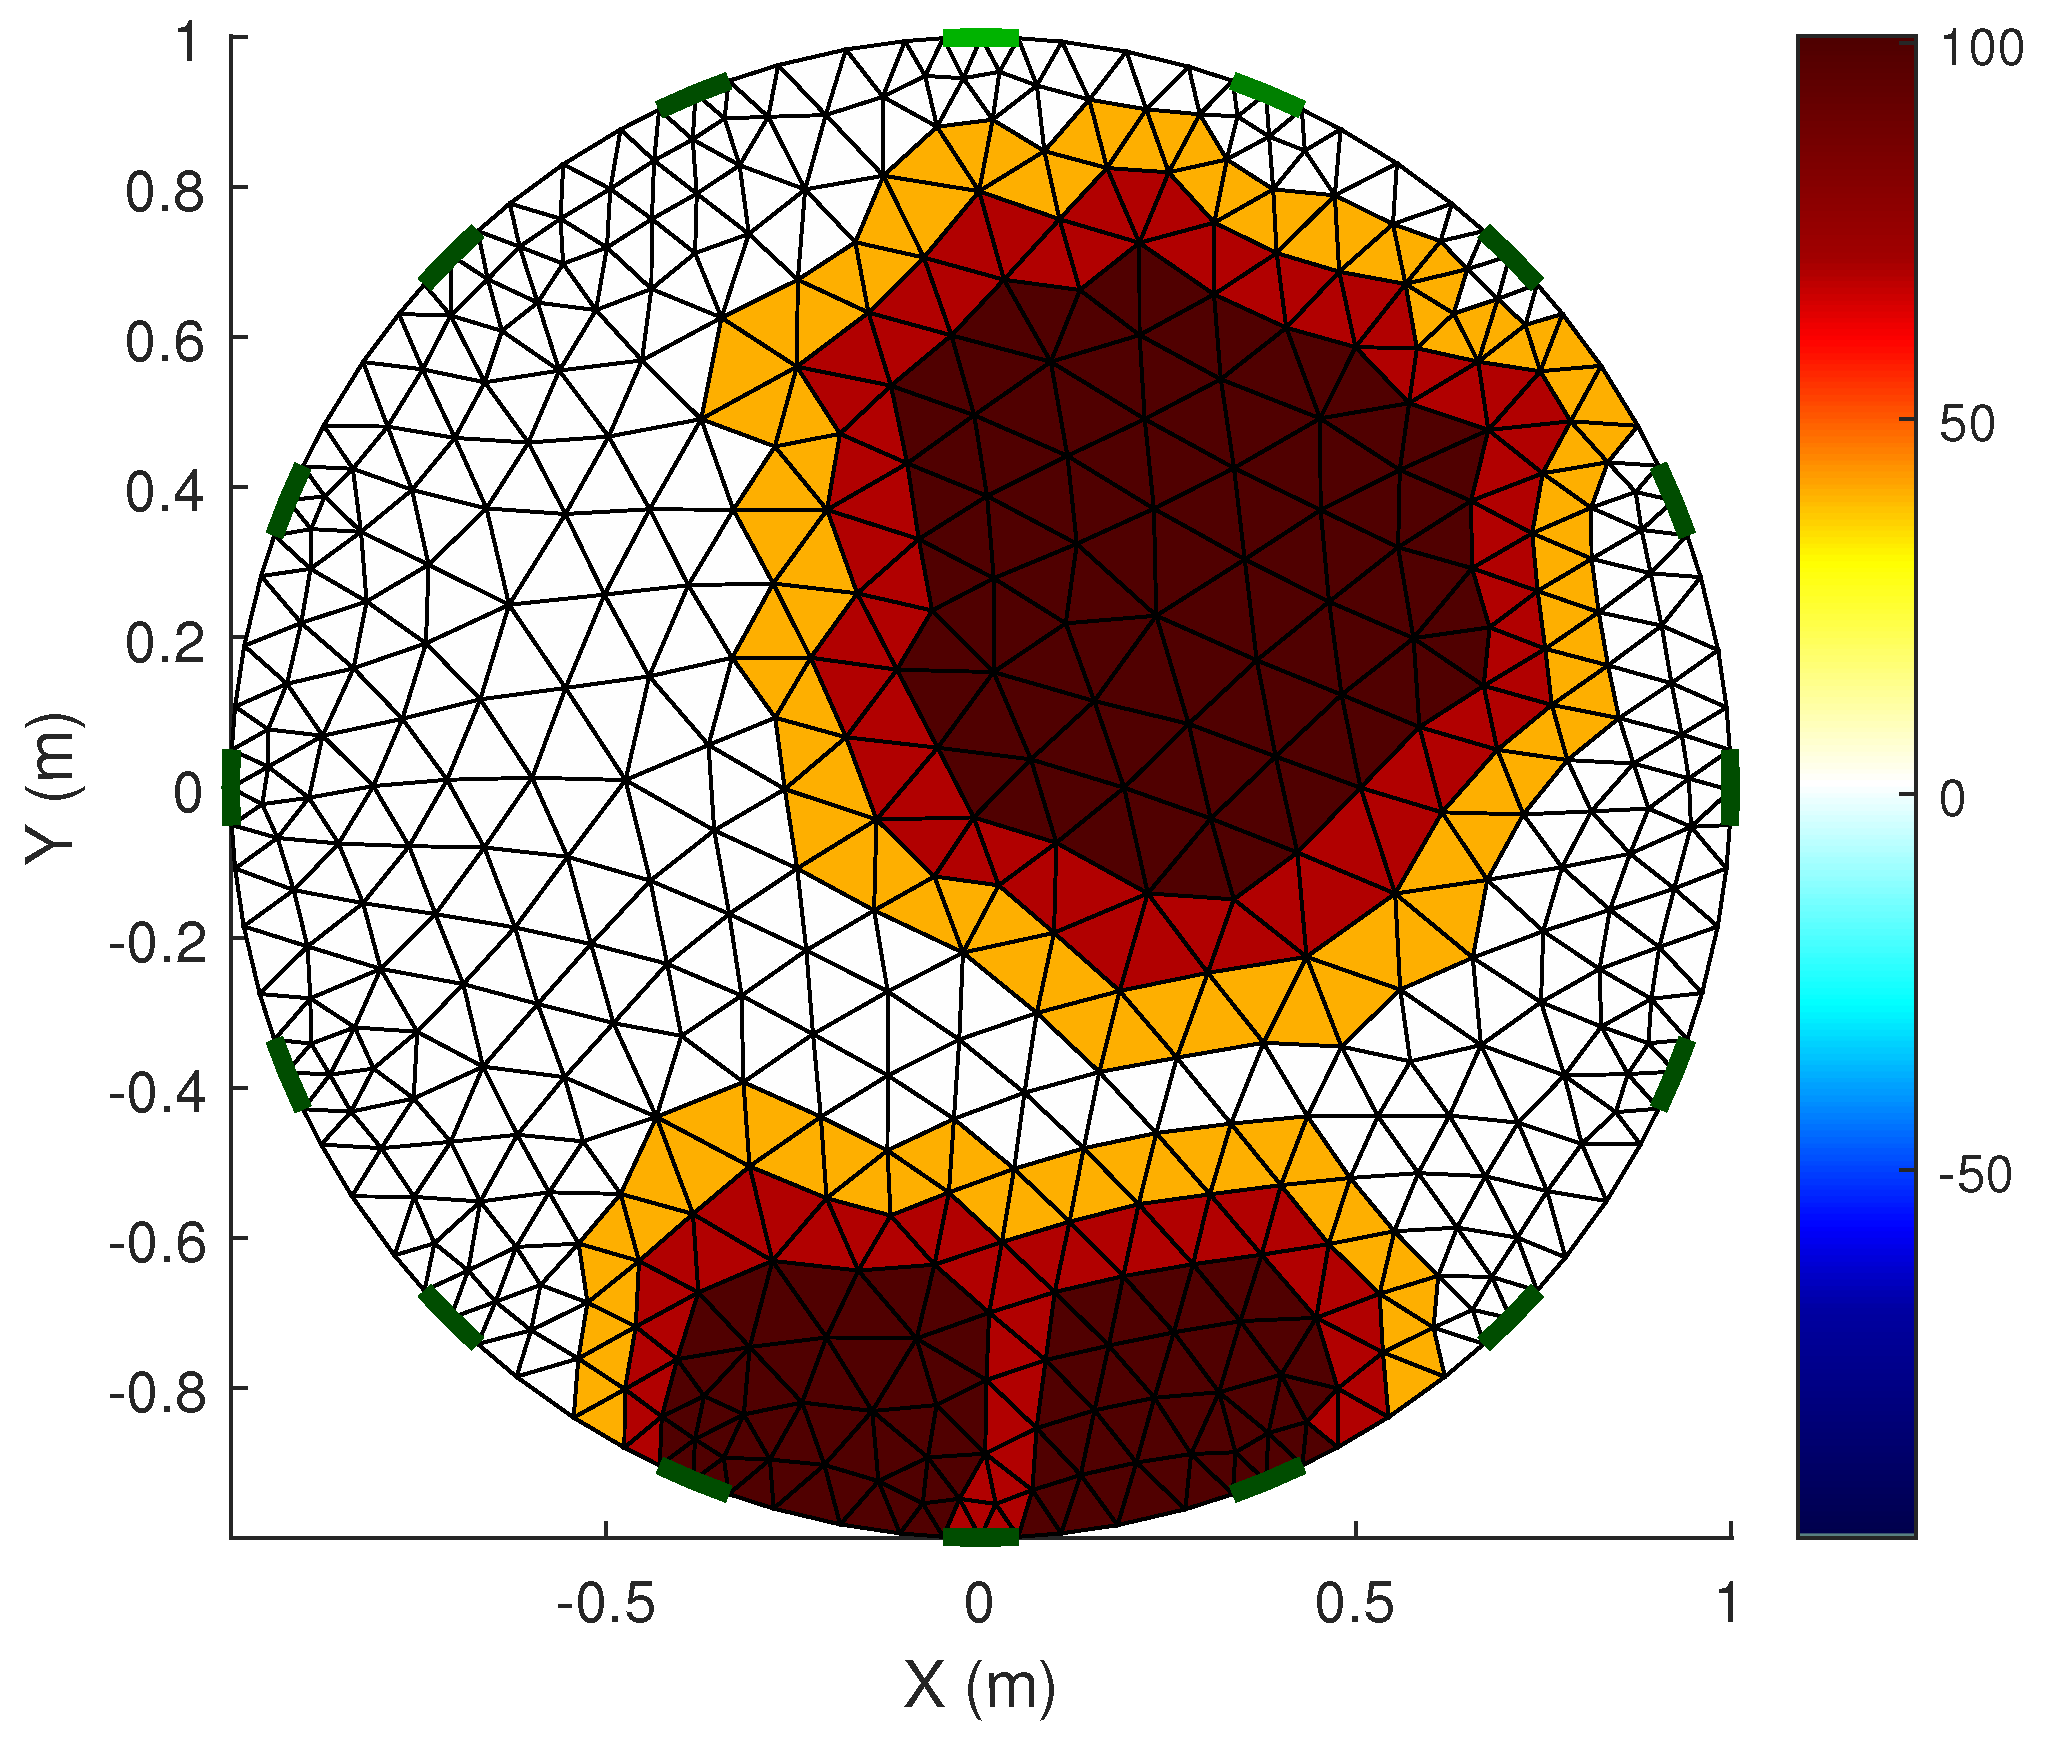
Figure 8 presents a more complicated case since both artifacts are closer and have common elements. The reconstruction of our approach also obtained false positives in the border section. However, the related slide (Figure 10) shows the artifacts as two different parts. In the case of the IGN, it cannot show the difference between the artifacts. The PDIPM presents a better performance that the the IGN algorithm. Nevertheless, it also has problems to detect the common borderline. Again, the PDIPM shows lower conductivity values, which is a handicap when MAPE is evaluated.
It is also important to highlight that our approach is able to work in real time. As a simple comparison, the approximate computation times to reconstruct Figure 7 are: <1 s for the ANN, ≈17 s for the PDIPM, and ≈6 s for the IGN.
Generally, the ANN approach obtained good results. However, we detected some complex situations where its performance should be improved. Figure 11 and Figure 12 display test cases where two artifacts with different sizes share multiple elements in a border. Our approach usually identifies correctly the mesh area covered by the artifacts. Nevertheless, it often reconstructs only one instance that includes both artifacts. We believe that the accuracy of the forward problem is not enough to detect small differences between borders, so the inverse problem solver cannot learn how to deal with this problem.
We have also identified another issue related to small artifacts located close to the mesh borders. Occasionally, the reconstructed image shows the artifact as well as a linked phantom in the middle of the mesh with a minor conductivity. We think that this type of problem is related to a numerical error generated during the forward problem resolution. An example of this issue can be seen in the Figure 13.

6. Conclusions and Ongoing Work

In this paper we propose a novel inverse solver approach based on ML techniques to reconstruct EIT images. In particular, we used an ANN model followed by a thresholding post-processing algorithm to accurately predict the internal conductivity distributions in a body. We compared our approach with the PDIPM and the IGN solvers, which are largely used and well-validated methods for solving inverse problems. Experiments showed that the ML-based approach is able to reconstruct EIT images with more accuracy from the quantitative as well as the quantitative points of view. Thus, this methodology would be able to replace more complex and slower iterative approaches. Moreover, once the ANN is trained, it is able to reconstruct EIT images in real-time. This would allow us to avoid poor accurate inverse solvers based on linear approaches that are usually used in real-time.
Experiments also showed some restrictions of our methodology. Thus, we plan to extend this research work in three main lines: (1) We will analyze different mesh resolutions to avoid the shared border issue explained in the previous section; (2) we want to increase the algorithm robustness, so we have in mind to add noise to the dataset. After that, we will train and include an autoencoder neural network just before the ANN solver to filter it; and (3) we project to improve the algorithm for dealing with heterogeneous meshes. Thus, we will study how to add mesh deformations to the dataset for training a new ML model.
Finally, we plan to apply this methodology in a real scenario. In particular, we want to focus our efforts in the moisture control of tree trunks and MDFs.

Author Contributions

Conceptualization, D.M. and A.G.; Methodology, X.F.-F., D.M., A.G. and I.V.-F; Software, X.F.-F.; Investigation, X.F.-F., D.M., A.G. and I.V.-F.; Data curation, X.F.-F.; Writing—original draft preparation, X.F.-F.; Writing—review and editing, D.M., A.G. and I.V.-F.; Supervision, D.M. and A.G.

Funding

This work has received financial support from the predoctoral scholarship program of the Xunta de Galicia (ED481A-2018/277), the Xunta de Galicia under Research Network R2016/045, the Consellería de Cultura, Educación e Ordenación Universitaria (accreditation 2016-2019, ED431G/08) and the European Regional Development Fund (ERDF).

Acknowledgments

Computational resources were provided by the Galicia Supercomputing Center (CESGA). We greatly appreciate the valuable comments from the reviewers that have helped us to improve our work.

Conflicts of Interest

The authors declare no conflict of interest.

References

  1. Ryndin, E.; Konoplev, B.; Kulikova, I. Distributed Sensory System of Surface Cracks Monitoring Based on Electrical Impedance Tomography. Electronics 2018, 7, 131. [Google Scholar] [CrossRef]
  2. Bayford, R.H. Bioimpedance tomography (electrical impedance tomography). Annu. Rev. Biomed. Eng. 2006, 8, 63–91. [Google Scholar] [CrossRef] [PubMed]
  3. Harikumar, R.; Prabu, R.; Raghavan, S. Electrical impedance tomography (EIT) and its medical applications: A review. Int. J. Soft Comput. Eng. 2013, 3, 193–198. [Google Scholar]
  4. Kabanikhin, S.I. Definitions and examples of inverse and ill-posed problems. J. Inverse Ill-Posed Probl. 2008, 16, 317–357. [Google Scholar] [CrossRef]
  5. Borsic, A.; Adler, A. A primal–dual interior-point framework for using the L1 or L2 norm on the data and regularization terms of inverse problems. Inverse Probl. 2012, 28, 095011. [Google Scholar] [CrossRef]
  6. Ortega, J.M.; Rheinboldt, W.C. Iterative Solution of Nonlinear Equations in Several Variables; Academic Press: New York, NY, USA, 1970; Volume 30. [Google Scholar]
  7. George, D.; Torczynski, J.; Shollenberger, K.; O’Hern, T.; Ceccio, S. Validation of electrical-impedance tomography for measurements of material distribution in two-phase flows. Int. J. Multiph. Flow 2000, 26, 549–581. [Google Scholar] [CrossRef] [Green Version]
  8. Humplík, P.; Čermák, P.; Žid, T. Electrical impedance tomography for decay diagnostics of Norway spruce (Picea abies): possibilities and opportunities. Silva Fennica 2016, 50, 1341. [Google Scholar] [CrossRef]
  9. Wu, K.; Yang, J.; Dong, X.; Fu, F.; Tao, F.; Liu, S. Comparative study of reconstruction algorithms for electrical impedance tomography. In Proceedings of the World Congress on Medical Physics and Biomedical Engineering, Beijing, China, 26–31 May 2012; Springer: Berlin/Heidelberg, Germany, 2013; pp. 2296–2299. [Google Scholar]
  10. Uhlmann, G. Electrical impedance tomography and Calderón’s problem. Inverse Probl. 2009, 25, 123011. [Google Scholar] [CrossRef]
  11. Michalikova, M.; Abed, R.; Prauzek, M.; Koziorek, J. Image reconstruction in electrical impedance tomography using neural network. In Proceedings of the 2014 Cairo International Biomedical Engineering Conference (CIBEC), Giza, Egypt, 11–13 December 2014; pp. 39–42. [Google Scholar]
  12. Adler, A.; Lionheart, W.R. Uses and abuses of EIDORS: An extensible software base for EIT. Physiol. Meas. 2006, 27, S25. [Google Scholar] [CrossRef] [PubMed]
  13. Wang, C.; Lang, J.; Wang, H.X. RBF neural network image reconstruction for electrical impedance tomography. In Proceedings of the 2004 International Conference on Machine Learning and Cybernetics, Shanghai, China, 26–29 August 2004; Volume 4, pp. 2549–2552. [Google Scholar]
  14. Wang, P.; Li, H.L.; Xie, L.L.; Sun, Y.C. The implementation of FEM and RBF neural network in EIT. In Proceedings of the Second International Conference on Intelligent Networks and Intelligent Systems (ICINIS’09), Tianjin, China, 1–3 November 2009; pp. 66–69. [Google Scholar]
  15. Martin, S.; Choi, C.T. Nonlinear electrical impedance tomography reconstruction using artificial neural networks and particle swarm optimization. IEEE Trans. Magn. 2016, 52, 1–4. [Google Scholar] [CrossRef]
  16. Martin, S.; Choi, C.T. A post-processing method for three-dimensional electrical impedance tomography. Sci. Rep. 2017, 7, 7212. [Google Scholar] [CrossRef] [PubMed]
  17. Russo, S.; Assaf, R.; Nefti-Meziani, S. Towards a practical implementation of EIT-based sensors using artificial neural networks. In Proceedings of the 2017 IEEE SENSORS, Glasgow, UK, 29 October–1 November 2017; pp. 1–3. [Google Scholar]
  18. Tomasz, R.; Grzegorz, K.; Tomasz, C.; Edward, K. Application of a neural EIT system to control the processes. In Proceedings of the 2018 Applications of Electromagnetics in Modern Techniques and Medicine (PTZE), Racławice, Poland, 9–12 September 2018; pp. 216–219. [Google Scholar]
  19. Hamilton, S.J.; Hauptmann, A. Deep D-bar: Real time Electrical Impedance Tomography Imaging with Deep Neural Networks. IEEE Trans. Med. Imaging 2018. [Google Scholar] [CrossRef] [PubMed]
  20. Rymarczyk, T.; Kłosowski, G.; Kozłowski, E. A Non-Destructive System Based on Electrical Tomography and Machine Learning to Analyze the Moisture of Buildings. Sensors 2018, 18, 2285. [Google Scholar] [CrossRef] [PubMed]
  21. Bergstra, J.; Bengio, Y. Random search for hyper-parameter optimization. J. Mach. Learn. Res. 2012, 13, 281–305. [Google Scholar]
  22. Swingler, K. Applying Neural Networks: A Practical Guide; Morgan Kaufmann: San Francisco, CA, USA, 1996; Chapter 3.2.3; pp. 53–56. [Google Scholar]
  23. Babacan, S.D.; Molina, R.; Katsaggelos, A.K. Bayesian compressive sensing using Laplace priors. IEEE Trans. Image Process. 2010, 19, 53–63. [Google Scholar] [CrossRef] [PubMed]
  24. Cheney, M.; Isaacson, D.; Newell, J.C.; Simske, S.; Goble, J. NOSER: An algorithm for solving the inverse conductivity problem. Int. J. Imaging Syst. Technol. 1990, 2, 66–75. [Google Scholar] [CrossRef]
  25. Carletta, J. Assessing agreement on classification tasks: the kappa statistic. Comput. Linguist. 1996, 22, 249–254. [Google Scholar]
Figure 1. Methodology process to develop an Artificial Neural Network (ANN) solver for reconstructing Electrical Impedance Tomography (EIT) images.
Electronics 07 00422 g001
Figure 2. A mesh with three artifacts where two of them have been joined together.
Electronics 07 00422 g002
Figure 3. Description of the adjacent approach used to calculate the voltage of the electrodes in an object surface. In the displayed example, 16 electrodes are placed around the mesh. A fixed current of 0.010 A is iteratively applied on each one of the 14 adjacent pair of electrodes. At each iteration, 13 voltage measures linked to the remaining electrodes are saved. Finally, a set of 208 voltage measurements is obtained.
Electronics 07 00422 g003
Figure 4. ROC curves highlighting the best thresholds.
Electronics 07 00422 g004
Figure 5. Image reconstruction comparative: Two artifacts. Top-left: Test case. Top-right: Reconstruction obtained with the ANN solver. Bottom-left: Reconstruction obtained with the Primal Dual Interior Point Method (PDIPM) solver. Bottom-right: Reconstruction obtained with the Iterative Gauss-Newton (IGN) solver. As a simple comparison, the approximate computation times for each case are: <1 s for the ANN, ≈17 s for the PDIPM and ≈6 s for the IGN.
Electronics 07 00422 g005
Figure 6. Slice at y = 0 linked to Figure 5. The evaluated approaches are compared with the test case to check the accuracy of the predicted conductivity distribution.
Electronics 07 00422 g006
Figure 7. Image reconstruction comparative: Two artifacts. Top-left: Test case. Top-right: Reconstruction obtained with the ANN solver. Bottom-left: Reconstruction obtained with the PDIPM solver. Bottom-right: Reconstruction obtained with the IGN solver.
Electronics 07 00422 g007
Figure 8. Image reconstruction comparative: Two artifacts. Top-left: Test case. Top-right: Reconstruction obtained with the ANN solver. Bottom-left: Reconstruction obtained with the PDIPM solver. Bottom-right: Reconstruction obtained with the IGN solver.
Electronics 07 00422 g008
Figure 9. Slice at y = 0 linked to Figure 7. The evaluated approaches are compared with the test case to check the accuracy of the predicted conductivity distribution.
Electronics 07 00422 g009
Figure 10. Slice at y = 0 linked to Figure 8. The evaluated approaches are compared with the test case to check the accuracy of the predicted conductivity distribution.
Electronics 07 00422 g010
Figure 11. Example of inaccurate reconstruction with two small artifacts that share a border. Left: Test case. Right: Reconstruction obtained with the ANN solver.
Electronics 07 00422 g011
Figure 12. Example of inaccurate reconstruction with two big artifacts that share a border. Left: test case. Right: reconstruction obtained with the ANN solver.
Electronics 07 00422 g012
Figure 13. Example of inaccurate reconstruction with a phantom artifact. Left: Test case. Right: Reconstruction obtained with the ANN solver.
Electronics 07 00422 g013
Table 1. Summary of the parameters used to develop the Artificial Neural Network (ANN) model.
NameValueNameValue
input neurons208output neurons844
hidden neurons [ 1 . . ( 2 i n p u t s ) ] epochs1000
batch size128learning rate ( 10 k ) k = 3 1
dataset10,220training set70%
validation set15%test set15%
optimizerStochastic gradient descent (SGD)activation functionrelu
output activation functiontanhcost functionMSE
data normalizationfeature scaling ([−1,1])
Table 2. Confusion matrix associated to the ANN.
Target Class
01
Output Class0833,87410,84098.7%
64.4%0.8%1.3%
120,640428,49895.4%
1.6%33.1%4.6%
97.6%97.5%97.6%
2.4%2.5%2.4%
Table 3. Confusion matrix associated to the Primal Dual Interior Point Method (PDIPM).
Target Class
01
Output Class0787,81256,48193.3%
60.9%4.4%6.7%
166,702382,85785.2%
5.2%29.6%14.8%
92.2%87.1%90.5%
7.8%12.9%9.5%
Table 4. Confusion matrix associated to the Iterative Gauss-Newton (IGN).
Target Class
01
Output Class0613,28326,60395.8%
47.4%2.1%4.2%
1241,231412,73563.1%
18.6%31.9%36.9%
71.8%93.9%79.3%
28.2%6.1%20.7%
Table 5. Comparative of the quality metrics of the ANN, the PDIPM, and the IGN solvers.
MetricsANNPDIPMIGN
Background Accuracy97.5892.1971.77
Artifact Accuracy97.5387.1493.94
Total Accuracy97.5790.4879.30
Cohen Kappa94.6078.8958.74