Article

Integrated Computer Vision and Type-2 Fuzzy CMAC Model for Classifying Pilling of Knitted Fabric

1
Department of International Business, National Taichung University of Science and Technology, Taichung 404, Taiwan
2
Department of Computer Science & Information Engineering, National Chin-Yi University of Technology, Taichung 411, Taiwan
*
Author to whom correspondence should be addressed.
Electronics 2018, 7(12), 367; https://doi.org/10.3390/electronics7120367
Submission received: 22 September 2018 / Revised: 8 November 2018 / Accepted: 22 November 2018 / Published: 1 December 2018
(This article belongs to the Section Computer Science & Engineering)

Abstract

:
Human visual inspection for classifying the pilling of knitted fabric not only consumes human resources but also causes occupational hazard because of long-term observation using human eyes. This reduces the efficiency of the entire operation. To overcome this, an integrated computer vision and type-2 fuzzy cerebellar model articulation controller (T2FCMAC) was devised for classifying the pilling of knitted fabric. First, the fast Fourier transform was used for image preprocessing to strengthen the characteristics of the pilling in the fabric image. The background and the pilling of knitted fabric were then segmented through binary and morphological operations. Characteristics of the pilling on the fabric were extracted by using image topography. A novel T2FCMAC based on the hybrid of group strategy and artificial bee colony (HGSABC) was proposed to evaluate the pilling grade of knitted fabric. The proposed T2FCMAC classifier embedded a type-2 fuzzy system within a traditional cerebellar model articulation controller (CMAC). The proposed HGSABC learning algorithm was used for adjusting the parameters of T2FCMAC classifiers and preventing the fall into a local optimum. A group search strategy was used to obtain balanced search capabilities and improve the performance of the artificial bee colony algorithm. The experimental results of the fixed and different illuminations indicated that the proposed method exhibited a superior average accuracy (97.3% and 94.6%, respectively) to other methods.

1. Introduction

The traditional methods for the pilling grade detection of knitted fabric are based on the number of wear-resistant elements and the determination of grades through eye estimation. This manual detection method may cause some errors in the identification of fabric grading because of several reasons, including fatigue or inexperience of the tester. Moreover, visual inspection of the fabric grade is considerably subjective and unreliable. Although experienced inspectors are less likely to cause errors in detection, gaining experience requires high training costs and excessive time.
Previously, the pilling grade of knitted fabric was assessed through manual observation. Manual observation causes numerous misjudgments and reduces efficiency. To overcome the aforementioned problems, several researchers [1,2,3,4,5,6,7] have used image processing methods to improve recognition rates and reduce the cost of employees. Deng et al. [1] used a multiscale two-dimensional dual-tree complex wavelet transform to extract the pilling information from knitted fabric. The Levenberg–Marquardt backpropagation learning rule was used as a classifier to detect the pilling grade of knitted fabric. Saharkhiz et al. [2] adopted a two-dimensional fast Fourier transform (FFT) to process the image and used a low-pass filter to distort the fabric surface texture. The three parameters of pilling, volume, and area, and the number of pills were then obtained from the fabric surface. These parameters are used for clustering algorithms which evaluate the pilling grade of knitted fabric. Eldessouki et al. [3] adopted binarization, cutting, quantification, and classification to objectively assess the pilling grade of knitted fabric and used an artificial neural network (ANN) as a classifier. Furferi et al. [4] used binarization and B-splines for image preprocessing. The entropy curve, total skewness and kurtosis, coefficient of variation, and brightness were used as fabric features. Moreover, the ANN was employed as a classifier to assess the pilling grade. Yun et al. [5] used five American Society for Testing and Materials standard fabrics for research. Moreover, FFT and fast wavelet filtering were used for image preprocessing. The number of pills, total pixel area, and total gray values of pilling images were considered. Finally, a gray-image rule base was generated using statistical methods. Techniková et al. [6,7] proposed a system for the objective evaluation of the pilling grade of unicolor fabrics and fabrics with complex patterns. Essentials of a pilling evaluation system include 3D fabric surface reconstruction from shading through a gradient field method using image analysis tools for objective pilling grade detection.
A suitable classifier is crucial for the pilling classification of knitted fabric. Several popular classifiers, such as neural networks [8,9], support vector machines (SVMs) [10], the Bayes classifier [11], and neural fuzzy networks [12] are used to solve classification problems. Recently, a cerebellar model articulation controller (CMAC) [13] has become a prevalent research topic. Because the CMAC exhibits a fast learning ability, satisfactory generalization capability, and an easy implementation, the CMAC has been successfully used in various applications, such as image processing [14] and smart systems [15]. However, the CMAC exhibits high dimensionality, which requires a large memory space and a relatively unsatisfactory ability of function approximation. Moreover, to improve the learning capability of the CMAC, several researchers have proposed methods, such as hierarchical fuzzy CMAC [16], fuzzy CMAC [17], recurrent CMAC [18], and type-2 fuzzy CMAC [19]. In several studies [15,16,17,18,19], a supervised learning technique, backpropagation (BP), was used for network training. However, the error curve may converge very slowly, or the solution may fall into a local minimum after being trained through BP.
A proposed method for pilling grade analysis was tested in this study. First, FFT was used for image preprocessing to strengthen knitted fabric images. The background and the pilling of the knitted fabric were then segmented through binary and morphological operations. The characteristics of the pilling of the knitted fabric were extracted using image topography. The type-2 fuzzy cerebellar model articulation controller (T2FCMAC) based on the hybrid of group strategy and artificial bee colony was devised as a classifier to evaluate the pilling grade of knitted fabric. The major contributions of this study are described as follows:
  • A novel T2FCMAC classifier is proposed. It embeds a type-2 fuzzy system within a traditional CMAC.
  • An efficient hybrid of group strategy and artificial bee colony (HGSABC) learning algorithm is also proposed. The proposed HGSABC was used for adjusting the parameters of T2FCMAC classifier and preventing the fall into a local optimum. A group search strategy was used to obtain balanced search capabilities and improve the performance of the artificial bee colony algorithm.
  • The fixed and different illumination experiments were implemented in this study. The experimental results indicate that the proposed method exhibited a superior average accuracy rate to other methods.

2. Image Preprocessing and Feature Extraction

To establish a pilling grade database of knitted fabric, preparation for this study involved the classification of fabric samples. In accordance to the Societe Generale de Surveillance (SGS) international standard test, the fabric was tested using the Martindale wear tester. The condition of the pilling surface was detected after continuously rolling the cloth in the tester. An eye test was then used to assess the pilling grade of the knitted fabric. In the SGS international standard test, the pilling grade of knitted fabric is divided into five grades. Grades 1, 2, 3, 4, and 5 represent very serious, serious, moderate, slight, and no pilling, respectively. Table 1 presents the five pilling grades of knitted fabric.
In this study, a computer vision method was devised to detect the pilling grade of the fabric. The method was divided into three primary steps. First, image preprocessing was performed for the input fabric to highlight the characteristics of the fabric pilling in the image. Second, topology was used to collect the characteristics of fabric pilling in images. Finally, the collected features were used as training data for the pilling grades of knitted fabric and applied to the proposed T2FCMAC for training. The trained T2FCMAC classifier was then used to classify the pilling grade of knitted fabric. Figure 1 displays the flowchart of the proposed pilling grade classification of knitted fabric.

2.1. Image Preprocessing

Image preprocessing is essential to reduce the complexity caused by the direct use of an original image for image processing. First, the original image was converted into a gray image; that is, three channels were converted into a single channel using the following formula.
f G r a y ( x , y ) = I R ( x , y ) · 0.299 + I G ( x , y ) · 0.587 + I B ( x , y ) · 0.114
where I R ( x , y ) , I G ( x , y ) , and I B ( x , y ) are the three-channel pixel values of each pixel of the original input image, and (x, y) represents the pixel coordinates of the two-dimensional image. FFT was used to enhance the fabric pilling characteristics in the image. Figure 2 exhibits the flowchart of the FFT. The image was transformed from the spatial domain to the frequency domain. After filter processing and inverse FFT, the image was retransformed from the frequency domain to the spatial domain. This method was used to strengthen the fabric pilling characteristics and balance image brightness.
An N-point one-dimensional Fourier transform generally requires n 2 multiplication and addition operators, whereas FFT only requires n log 2 n multiplication in the same operation. The use of FFT can reduce operation time. The conversion formula is as follows:
F ( u , v ) = 1 M N x = 0 M 1 y = 0 N 1 f G r a y ( x , y ) e j 2 π ( u x M + v y N )
where MN is the size of the 2D image, and (u, v) are the frequency domain coordinates with u = 1, 2, …, M − 1 and v = 1, 2, , N − 1.
To reduce the misjudgment caused by the background texture of the fabric and enhance the intensity of the image, a low-pass filter was used to retain the low-frequencies of the fabric pilling and attenuate the high-frequencies of the background texture. The filter formula is as follows:
g ( u , v ) = H ( u , v ) · F ( u , v ) , H ( u , v ) = e u 2 + v 2 2 σ 2
where F(u, v) and H(u, v) are the spectrum and filter, respectively. Gaussian filtering was used in this study.
Finally, the filtered spectrum was converted into the original image through an inverse Fourier transform (IFFT). The formula is as follows:
f ( x , y ) = u = 0 M 1 v = 0 N 1 g ( u , v ) e j 2 π ( u x M + v y N )
where (x, y) are the spatial domain coordinates. Figure 3 shows the image obtained through FFT.
Binary image processing was used in this study to effectively segment the fabric pilling and backgrounds in the images. The binarization formula is as follows:
f ( x , y ) = { 255 ,   i f   f ( x , y ) t 0 , i f   f ( x , y ) < t
where t is the threshold value to segment the pixel values of the fabric pilling and backgrounds. Figure 4 shows the binarized image.
After binarization through the aforementioned method, noise was observed; white pixels appeared in the image instead of the fabric pilling. Therefore, a morphological operation was used to eliminate the noise in the image and simultaneously preserve the fabric pilling area. There are four basic morphological operations: dilation, erosion, closing, and opening. Opening was used in this study. Erosion calculations were first performed for the image, and expansion calculations were subsequently performed to eliminate minor noise in the image. The operation formula for this method is as follows:
A B = ( A B )   B

2.2. Feature Extraction

Image preprocessing is primarily performed to strengthen the fabric pilling characteristics and reduce the interference when determining pilling. The features of fabric pilling were extracted from the preprocessed images. The feature extraction was divided into two steps: image topology to detect the fabric pilling areas and extraction of the characteristics of fabric pilling.
The common features used for detecting the pilling grade of the knitted fabric in the images were the number and size of the fabric pills. Image topology includes the inspection of these features [20] using connected component labeling [21] to mark the pilling area. Connected component labeling uses 4- or 8-connected preprocessed binary images, as shown in Figure 5a,b. First, if the pixel value of the self-pixel (X) is 1, then the self-pixel and the neighboring pixels are in the same block and are subsequently marked with the same label. Otherwise, they are marked with different labels. Finally, this well-labeled information the pilling grade of the knitted fabric is distinguished.
The same label represents the same object block. Figure 6 shows an 8-connected area labeling. Figure 6b shows that the 8-connected structures considered not only the four pixels on top, bottom, left, and right of its pixel (X) but also the four pixels on the top-left, top-right, bottom-left, and bottom-right of the self-pixel (X). In this study, the shape of the fabric pilling was assumed to be variable. To protect the images from noise, the 8-connected method was used to obtain the fabric pilling areas.
After the connected area labeling, the number of fabric pills in the image and the area size of each fabric pilling can be obtained. For example, the number of fabric pills is equal to the sum of all object areas marked by the connected area, as shown in Figure 6b; there were three fabric pills. The area of fabric pilling is equivalent to the sum of pixels valued 1 in the binarized image. Therefore, the total area of the fabric pilling in Figure 6b is 65 pixels.

3. T2FCMAC for Pilling Classification of Knitted Fabric

This section describes the use of the T2FCMAC as a classifier. In the T2FCMAC classifier, inputs and outputs are the fabric pilling characteristics and the fabric grade, respectively. The proposed hybrid of group strategy and artificial bee colony was used to adjust the T2FCMAC classifier parameters. The following two subsections detail the proposed classifier and learning algorithm.

3.1. T2FCMAC Classifier

The T2FCMAC classifier is introduced in this subsection. The proposed classifier embedded a type-2 fuzzy system within a traditional CMAC [12]. Moreover, a linear combination function of inputs was used as a consequent part of the IF–THEN rule.
Rule   j   : IF   X 1   is   A ˜ 1 j   and   X 2   is   A ˜ 2 j   and   X i   is   A ˜ i j   and   and   X n   is   A ˜ n j THEN   y =   a j 0 + i = 1 n a i j × X i
where X i   and y are the input and output variables, respectively.   A ˜ i j   is the linguistic variable of interval type-2 fuzzy set, n is the input dimension, and a 0 j + i = 1 n a i j X i represents the linear combination function of inputs in the consequent layer. The structure of the T2FCMAC classifier is shown in Figure 7.
Layer 1 (Input Layer): The input data are imported into the next layer from this layer, and this includes only the transmission of information without any computation.
I n p u t i ( 1 ) = X i ,   a n d   i = 1 , 2 , n
where n represents the input dimension.
Layer 2 (Fuzzification Layer): Fuzzification transforms the input variables into linguistic variables. Each interval type-2 fuzzy set   A ˜ i j   is defined and shown in Figure 8. The interval type-2 fuzzy set comprises two uncertain means [ m 1 , m 2 ] and a fixed variance ( σ ). The Gaussian membership function of the interval type-2 fuzzy set   A ˜ i j is calculated as follows:
μ A ˜ i j ( 2 ) = e x p ( 1 2 [ I n p u t i ( 1 ) m i j ] 2 ( σ i j ) 2 ) ,   N ( m i j , σ i j ; I n p u t i ( 1 ) ) , m i j [ m i j 1 , m i j 2 ]
where m i j [ m i j 1 , m i j 2 ]   and σ i j represent the mean and variance of the ith input and jth Gaussian membership function, respectively. The membership degree of the Gaussian membership function generates a footprint of uncertainty through parallel movements. The upper ( μ ¯ A ˜ ) and lower ( μ ¯ A ˜ ) membership degrees are as follows:
μ ¯ A ˜ i j ( 2 ) = { N ( m i j 1 , σ i j ; I n p u t i ( 1 ) ) , 1 ,   N ( m i j 2 , σ i j ; I n p u t i ( 1 ) ) , I n p u t i ( 1 ) < m i j 1 m i j 1 I n p u t i ( 1 ) m i j 2 I n p u t i ( 1 ) > m i j 2
And
μ ¯ A ˜ i j ( 2 ) = { N ( m i j 2 ,   σ i j ;   I n p u t i ( 1 ) ) , |   I n p u t i ( 1 ) m i j 1 + m i j 2 2 N ( m i j 1 ,   σ i j ;   I n p u t i ( 1 ) ) , |   I n p u t i ( 1 ) > m i j 1 + m i j 2 2
Thus, the output of layer 2 is an interval valued [ μ ¯ A ˜ i j ( 2 ) , μ ¯ A ˜ i j ( 2 ) ].
Layer 3 (Spatial Firing Layer): Each node represents the membership value set of the output of layer 2 as a fuzzy hypercube. An algebraic product operation in each node produces the firing strength F j ( 3 ) in space, which is illustrated as follows:
F j ( 3 ) = [ f ¯ j ( 3 ) , f _ j ( 3 ) ] ,   j = 1 , 2 , , M
where
  f ¯ j ( 3 ) = i = 1 n μ ¯ A ˜ i j ( 2 ) ,   f _ j ( 3 ) = i = 1 n μ ¯ A ˜ i j ( 2 )
Layer 4 (Recurrent Layer): The output of a recurrent node is the temporal firing strength that depends on the current spatial and previous temporal firing strengths, i.e., each node refers to the relevant information between itself and the other nodes. The temporal firing strength is a linear combination function expressed as follows:
O j ( 4 ) = [ o ¯ j ( 4 ) , o _ j ( 4 ) ]
where
o ¯ j ( 4 ) = [ k = 1 ( λ k j q × o ¯ k ( 4 ) ( t 1 ) ) ] + ( 1 r j q ) × f ¯ j ( 3 )   and o _ j ( 4 ) = [ k = 1 ( λ k j q × o _ k ( 4 ) ( t 1 ) ) ] + ( 1 r j q ) × f _ j ( 3 ) .
Here, r j q = k = 1 M λ k j q and λ k j q = R k j q M ( 0 R k j q 1 ) represent the recurrent weights of the previous state and current firing strength, respectively; M and     o _ k ( 4 ) ( t 1 )   are the number of hypercube cells and the output of the previous state [ o ¯ j ( 4 ) ,   o _ j ( 4 ) ] , respectively. Initially, R k j q   is randomly generated between 0 and 1.
Layer 5 (Consequent Layer): Each node is a linear combination function of input variables in this layer. The equation is expressed as follows:
A j ( 5 ) = [ A ¯ j ( 5 ) , A _ j ( 5 ) ]
where A ¯ j ( 5 ) = a j 0 + i = 1 n a i j × I n p u t i ( 1 ) ,   A _ j ( 5 ) = a j 0 + i = 1 n a i j × I n p u t i ( 1 ) , and a j 0   and   a i j represent constant values.
Layer 6 (Defuzzification Layer): Interval type-2 fuzzy sets were reduced to interval type-1 fuzzy sets through a type-reduction operation. A crisp output value [ y r ( 6 ) , y l ( 6 ) ] was obtained through center-of-gravity defuzzification. To reduce the computational complexity of order reduction, centers of sets were employed to implement the reduction process. The method is described as follows:
y r ( 6 ) = j = 1 M o ¯ j ( 4 ) × A ¯ j ( 5 ) j = 1 M o ¯ j ( 4 )   and   y l ( 6 ) = j = 1 M o _ j ( 4 ) × A _ j ( 5 ) j = 1 M o _ j ( 4 ) .
Layer 7 (Output Layer): This layer provides the average output of layer 6. The actual output y is derived as follows:
y ( 7 ) = y r ( 6 ) + y l ( 6 ) 2

3.2. Proposed Hybrid of Group Strategy and Artificial Bee Colony

In this subsection, the proposed hybrid of group strategy and artificial bee colony for adjusting the T2FCMAC classifier parameters is introduced. The Artificial Bee Colony (ABC) algorithm [22] imitates the survival behavior of bees. The algorithm comprises three types of bees: employed, onlooker, and scout. These bees work together to determine the optimal food source.
Figure 9 shows the flowchart of the traditional ABC algorithm. First, positions of SN food sources were randomly initialized; this was equivalent to generating SN feasible solution vectors; D represents the dimension of each solution vector. After the food source location was generated, the fitness of each food source was calculated and evaluated. The food source formula is as follows:
X i , j = X min , j + r a n d [ 0 , 1 ] × ( X max , j X min , j )
where   X max , j and X min , j , which are equivalent to the range of food sources, are the upper and lower borders of the solution space, respectively.
In the traditional ABC algorithm, the number of bee colonies is generally equal to the half of that of the employed and onlooker bees. When the employed bees move to a new food source, the fitness value of their food source is calculated. The new food source is used if its fitness value is superior to the original one; otherwise, the original food source location is retained. The new food source formula is as follows:
V i j = X i j + i j ( X i j X k j )
where i ( 1 , 2 , , ( S N 2 ) ) , j = ( 1 , 2 , , D ) , and V i j give the new food source location, i j is a random value between [ 1 ,   1 ] , and X k j is the food source location after randomly selecting one of the employed bees.
An onlooker bee determines the food source location through the roulette method. Equation (20) provides the formula for an onlooker bee searching for new food. However, k in X k j represents the employed bees selected through the roulette method. The roulette method calculates the fitness formula for each food source as follows:
P i = f i t i j = 1 S N f i t j
where P i and f i t i   are the probability that the ith food source is selected and the fitness value of the ith food source, respectively.
Finally, a threshold value was set to prevent the algorithm from falling into a local optimum. According to Equation (20), the new food source is selected when its location is superior to the original; otherwise, the original food source location is retained and recorded. If the number of recordings reaches a set threshold value, which indicates that the extraction of the food source is not improved, the employed bees are converted to scout bees, and a new food source is produced.
In the ABC algorithm, employed bees are used in a global search, whereas onlooker bees are used to search for a superior food source to that found by the employed bees. The scout bees use mutation operations to escape the local solution. In this algorithm, the number of employed bees and onlooker bees is half of the configuration. For different optimization problems, the ratio of two types of bees is not easily adjustable. The improper configuration of the number of the employed and onlooker bees causes global and local search capabilities of the algorithm to be inhomogeneous. Moreover, it reduces the effectiveness of the evolution.
To overcome the aforementioned problems, the concept of group strategy was introduced. A group search mode was used to obtain balanced search capabilities and improve the performance of the ABC algorithm. The proposed hybrid of group strategy and artificial bee colony (HGSABC) is explained as follows.
Step 1:
Initialize
Parameters of the T2FCMAC classifier were optimized using the HGSABC learning algorithm and were coded as shown in Figure 10. Each bee represents a set of T2FCMAC parameters. Parameters included the mean value ( m i j ) and deviation ( σ i j ) of a Gaussian membership function in the fuzzification layer; Rkj is the weighting value of an interactive feedback mechanism in the temporal layer, and a 0 j   and a i j   are constants of a linear combination function in the consequent layer.
Step 2:
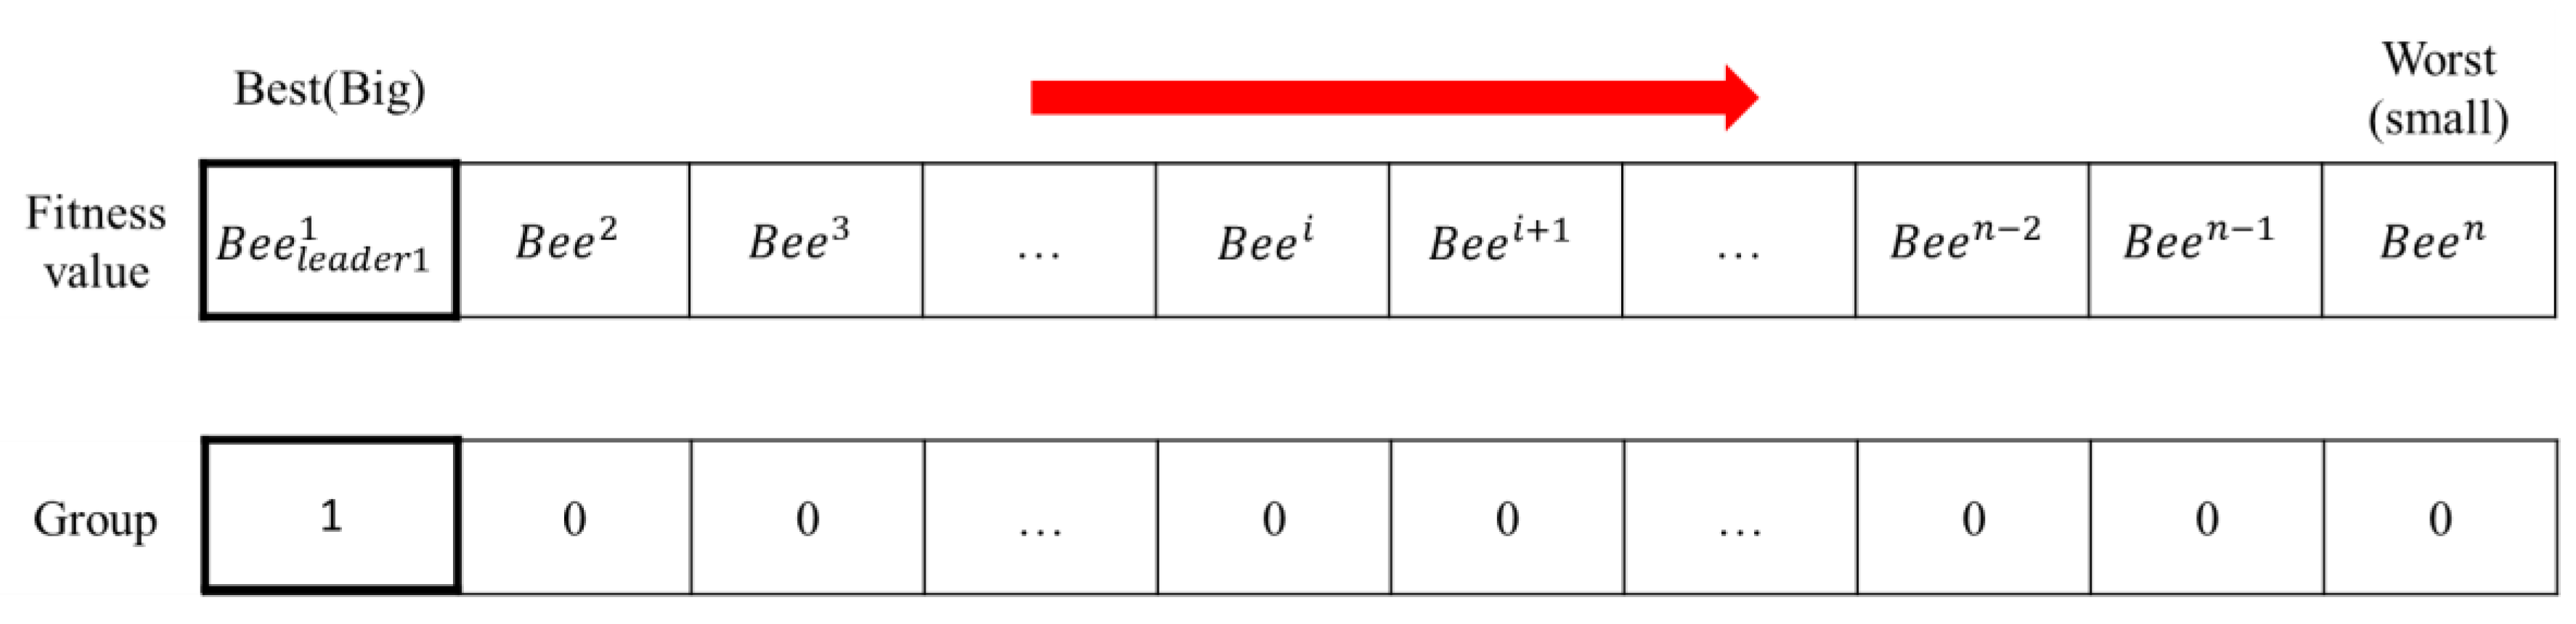
Calculating and ranking fitness values
To calculate the fitness value f of each bee i (Bi),
f (   B i ) = 1 1 + RMSE
where RMSE represents the root mean square error. Fitness values were sorted from large to small, and the group number of bees was initialized at 0, as shown in Figure 11.
Step 3:
Group strategy
After the fitness values were sorted, the bee with the maximum current fitness value was considered to be the leader of the new group, and the group number was updated. According to the average of the distance difference and the average of the fitness difference between these ungrouped particles and the group leader of group 0, the threshold value of similarity included the threshold values of fitness and distance. The threshold value for distance is calculated as follows:
D p o s g = i = 1 S N j = 1 D ( B j g B j i ) 2 ,   i f   B i   i s   u n g r o u p e d T p o s g = D p o s g N C
where   j g and N C represent the jth dimension of the gth group leader and the total number of ungrouped particles, respectively; and D , S N , and T p o s g represent the encoded dimension, the total number of particles, and the distance threshold value of the gth group, respectively.
The threshold value of fitness is calculated as follows:
F f i t g = i = 1 S N | f ( B g ) f (   B i ) | ,   i f   B i   i s   u n g r o u p e d T f i t g = F f i t g N C
where   f (   B g )   and T f i t g represent the fitness value of the gth group leader and the fitness threshold value of the gth group, respectively.
The group number of all particles was initially set to 0. The bee with the highest fitness value of the particles was set as the new group leader, and the group number was updated to g, where the initial group number was 1, as shown in Figure 12.
The bees remaining unassigned were recalculated using the aforementioned thresholds, ( D p o s i ) and ( F f i t i ), and assigned to a group. The distance difference and fitness difference formulae are described as follows:
D p o s i = j = 1 D ( B j g B j i ) 2 ,   i f   B i   i s   u n g r o u p e d
F f i t i = | f ( B g ) f (   B i ) | ,   i f   B i   i s   u n g r o u p e d
where T p o s g > D p o s i and T f i t g > F f i t i indicate that the bee is very similar to the current leader. This bee was then assigned to be the current leader group, and its group number was updated. However, if the aforementioned condition was not satisfied, the bees were not assigned to the current group, as shown in Figure 13. Figure 14 illustrates that step 3 was continued until all bees have been grouped.
Step 4:
Update bee position
When all the bees are grouped, a bee searches for the optimal food source. In the traditional algorithm, the bees search for food sources based on a randomly generated direction. To improve the convergence speed and effectiveness of the algorithm, information regarding the global optimal solution was added and used in the search direction. Furthermore, the employed bees moved in the correct direction. The mechanism of random search could be preserved without enabling the algorithm to rapidly converge and easily fall into a local solution. The improved search formula of the employed bee is as follows:
V i j = X i j + 1 i j ( X b j X i j ) + 2 i j ( X i j X k j )
where 1 i j and 2 i j represent the weights of the position of a bee toward the swarm position and are assigned random numbers within [−1, 1]; and X b j   and X k j are the current best solution in the bee swarm and a randomly selected employed bee position for all bee colonies, respectively.
During the search process of onlooker bees, the group leader (employed bee) must lead the group members (onlooker bees) in group exploration. Therefore, the original exploration method of the onlooker bee was improved because of the direction of leadership. The improved search formula for onlooker bees is shown as follows:
V i j = X i j + i j ( X i j X L j )
where i j and X L j are a random number between [−1, 1] and the leader position in the group, respectively. Figure 15 shows the flowchart of the proposed HGSABC algorithm.

4. Experimental Results

In this study, FFT was used for the preprocessing of images to intensify the characteristics of fabric pilling and balance image brightness. Moreover, an 8-connected structure was used to extract the fabric pilling area. The T2FCMAC classifier was used for pilling grade detection of the knitted fabric. In this experiment, six fuzzy hypercubes, five inputs (i.e., five features of fabric pilling), and one output (fabric pilling grade) were used in the T2FCMAC classifier architecture. In the proposed HGSABC, 30 bees were used to adjust the T2FCMAC classifier parameters. In this study, the five characteristics of fabric pilling were the number of pills, area, average area, area ratio, and density of fabric pilling. The average area of fabric pilling (   A a v e r a g e ) is defined as follows:
  A a v e r a g e = A f p N f p
where A f p and N f p   represent the area of pilling and the number of fabric pills, respectively. The area ratio of fabric pilling ( A r a t i o ) is defined as follows:
A r a t i o = A f p A t o t a l
where A t o t a l represents the size of the entire image. The pilling density ( D p ) is defined as follows:
  D p = N f p A t o t a l
To verify the performance of this classifier, 80 records were obtained for each grade of fabric pilling in the database for a total of 320 fabric images (the manufacturer only provided data of fabric images from grade 2 to grade 5). In this experiment, 80% of the images of each grade of pilling in the database were used as training samples, whereas the remaining 20% were used as testing samples.
Figure 16b shows that the original image (Figure 16a) was used directly to distinguish the pilling from the background; that is, image preprocessing was not performed. In Figure 16b, the selected pilling is incomplete. In the database generation process, a considerable amount of pilling feature information is lost. Moreover, Figure 16c displays the pilling after image preprocessing. Furthermore, the shape of the selected pilling is reasonably complete. In Figure 16b,c, the pilling distribution on the fabric obtained through image preprocessing is superior to that obtained without preprocessing. Experimental results in Figure 16c show that most of the pills in the original image were eliminated, which indicated that the image preprocessing could effectively determine the pilling area.
The T2FCMAC classifier was then used to identify the pilling grade, and 10 verifications were performed in this study. Moreover, 80% of the data of each grade were randomly selected as training samples, whereas 20% were selected as testing samples. In this study, 10 different training and testing datasets were established. The detection results of the proposed T2FCMAC classifier are shown in Table 2, where the total accuracy rate is the average of accuracy rate of 10 testing datasets. The overall accuracy rate was 97.3%. The results satisfy the industry requirements.
Recently, Huang and Fu [23] reported textile grading of fleece based on pilling assessment performed using image processing and machine learning methods. Two image processing methods were used. The first method involved using the discrete Fourier transform combined with Gaussian filtering, and the second method involved using the Daubechies wavelet. Machine learning methods, namely the artificial neural network (ANN) and the support vector machine (SVM), were used to objectively solve the textile grading problem.
Furthermore, the proposed method was compared with other methods [2,3,4,23,24,25]. The experiments were also performed 10 times. 10 training and testing sample sets are the same as Table 2. The second row of Table 3 illustrates a comparison of results of various methods. In the study by Huang and Fu [23], when the Fourier-Gaussian method was used, the classification accuracies of the ANN and SVM were 96.6% and 95.3%, and the overall accuracies of the Daubechies wavelet were 96.3% and 90.9%, respectively. The results indicate that the proposed method exhibits superior average accuracy in fabric pilling grade detection to other methods.
In addition, different illumination experiments were also performed. To verify the performance of the proposed classifier, 160 records were obtained for each grade of fabric pilling in the database for a total of 640 fabric images. In this experiment, we also adopted 80% of the images of each grade of pilling in the database as training samples and the remaining 20% as testing samples. The third row of Table 3 illustrates a comparison of results of various methods. In Table 3, the experiment results show that the recognition rate obtained under different illumination sources is significantly lower than the recognition rate under fixed illumination source.

5. Conclusions

In this study, an integrated computer vision and T2FCMAC was proposed for classifying the pilling of knitted fabric. Image preprocessing was used to enhance the pilling area of fabrics to reduce background texture interference. The characteristics of pilling were then selected through topology. Finally, a novel T2FCMAC based on the hybrid of group strategy and artificial bee colony (HGSABC) was proposed to evaluate the pilling grade of knitted fabric. The proposed T2FCMAC classifier embedded a type-2 fuzzy system within a traditional CMAC. The proposed HGSABC learning algorithm is used for adjusting the parameters of the T2FCMAC classifier and preventing the fall into a local optimum. A group search strategy was used to obtain balanced search capabilities and improve the performance of the artificial bee colony algorithm. The experimental results of the fixed and different illuminations indicate that the proposed method exhibited a superior average accuracy (97.3% and 94.6%, respectively) to other methods in fabric pilling grade detection. Although the obtained results satisfy the industry requirements, in order to improve accuracy rate, multiple T2FCMAC classifiers fusion using fuzzy integral will be adopted in the future work.

Author Contributions

Revised manuscript, C.-L.L. and C.-J.L.; Conceptualization and Methodology, C.-L.L. and C.-J.L.; Software, C.-J.L.; Writing—Original Draft Preparation, C.-L.L.

Funding

This research was funded by Ministry of Science and Technology of the Republic of China, Taiwan grant number MOST 107-2221-E-167-023.

Acknowledgments

The authors would like to thank the Ministry of Science and Technology of the Republic of China, Taiwan, for financially supporting this research under Contract No. MOST 107-2221-E-167-023.

Conflicts of Interest

The authors declared no potential conflicts of interest with respect to the research, authorship, and/or publication of this article.

References

  1. Deng, Z.; Wang, L.; Wang, X. An integrated method of feature extraction and objective evaluation of fabric pilling. J. Text. Inst. 2010, 102, 1–13. [Google Scholar] [CrossRef]
  2. Saharkhiz, S.; Abdorazaghi, M. The performance of different clustering methods in the objective assessment of fabric pilling. J. Eng. Fibers Fabr. 2012, 7, 35–41. [Google Scholar] [CrossRef]
  3. Eldessouki, M.; Hassan, M.; Bukhari, H.A.; Qashqari, K. Integrated computer vision and soft computing system for classifying the pilling resistance of knitted fabrics. Fibres Text. East. Eur. 2014, 22, 106–112. [Google Scholar]
  4. Furferi, R.; Carfagni, M.; Governi, L.; Volpe, Y.; Bogani, P. Towards automated and objective assessment of fabric pilling. Int. J. Adv. Robot. Syst. 2014, 11. [Google Scholar] [CrossRef]
  5. Yun, S.Y.; Kim, S.; Park, C.K. Development of an objective fabric pilling evaluation method. I. Characterization of pilling using image analysis. Fibers Polym. 2013, 14, 832–837. [Google Scholar] [CrossRef]
  6. Techniková, L.; Tunák, M.; Janáček, J. Pilling evaluation of patterned fabrics based on a gradient field method. Indian J. Fibre Text. Res. 2016, 41, 97–101. [Google Scholar]
  7. Techniková, L.; Tunák, M.; Janáček, J. New objective system of pilling evaluation for various types of fabrics. J. Text. Inst. 2017, 108, 123–131. [Google Scholar] [CrossRef]
  8. Lin, H.Y.; Lin, C.J. Using a hybrid of fuzzy theory and neural network filter for single image dehazing. Appl. Intell. 2017, 47, 1099–1114. [Google Scholar] [CrossRef]
  9. Lee, C.L.; Lin, C.J.; Lin, H.Y. Smart robot wall-following control using a sonar behavior-based fuzzy controller in unknown environments. Smart Sci. 2017, 5, 160–166. [Google Scholar] [CrossRef]
  10. Pal, M.; Foody, G.M. Feature selection for classification of hyperspectral data by SVM. IEEE Trans. Geosci. Remote Sens. 2010, 48, 2297–2307. [Google Scholar] [CrossRef]
  11. Bruzzone, L. An approach to feature selection and classification of remote sensing images based on the Bayes rule for minimum cost. IEEE Trans. Geosci. Remote Sens. 2000, 38, 429–438. [Google Scholar] [CrossRef]
  12. Eldessouki, M. Evaluation of Fabric Pilling as an End-use Quality and a Performance Measure for the Fabrics. In Chapter 7 of Applications of Computer Vision in Fashion and Textiles; Wong, W.J., Ed.; Woodhead Publishing-Elsevier: London, UK, 2018; ISBN 978-0-08-101218-5. [Google Scholar]
  13. Albus, J.S. A new approach to manipulator control: The cerebellar model articulation controller (CMAC). J. Dyn. Syst. Meas. Control 1975, 97, 220–227. [Google Scholar] [CrossRef]
  14. Iiguni, Y. Hierarchical image coding via cerebellar model arithmetic computers. IEEE Trans. Image Process. 1996, 5, 1393–1401. [Google Scholar] [CrossRef] [PubMed]
  15. Juang, J.G.; Lee, C.L. Applications of cerebellar model articulation controllers to intelligent landing system. J. Univ. Comp. Sci. 2009, 15, 2586–2607. [Google Scholar]
  16. Yu, W.; Rodriguez, F.O.; Moreno-Armendariz, M.A. Hierarchical fuzzy CMAC for nonlinear systems modeling. IEEE Trans. Fuzzy Syst. 2008, 16, 1302–1314. [Google Scholar]
  17. Chen, J.Y.; Tsai, P.S.; Wong, C.C. Adaptive design of a fuzzy cerebellar model arithmetic controller neural network. IEE Proc. Control Theory Appl. 2005, 152, 133–137. [Google Scholar] [CrossRef]
  18. Lin, C.M.; Chen, L.Y.; Yeung, D.S. Adaptive filter design using recurrent cerebellar model articulation controller. IEEE Trans. Neural Netw. 2010, 21, 1149–1157. [Google Scholar] [CrossRef] [PubMed]
  19. Lin, C.M.; Yang, M.S.; Chao, F.; Hu, X.M.; Zhang, J. Adaptive filter design using type-2 fuzzy cerebellar model articulation controller. IEEE Trans. Neural Netw. Learn. Syst. 2016, 27, 2084–2094. [Google Scholar] [CrossRef] [PubMed]
  20. Kong, T.Y.; Rosenfeld, A. Digital topology: Introduction and survey. Comput. Vis. Graph. Image Process. 1989, 48, 357–393. [Google Scholar] [CrossRef]
  21. Samet, H.; Tamminen, M. Efficient component labeling of images of arbitrary dimension represented by linear bintrees. IEEE Trans. Pattern Anal. Mach. Intell. 1988, 10, 579–586. [Google Scholar] [CrossRef]
  22. Karaboga, D. An Idea Based on Honeybee Swarm for Numerical Optimization; Technical Report-TR06; Engineering Faculty, Computer Engineering Department, Erciyes University: Kayseri, Turkey, 2005. [Google Scholar]
  23. Huang, M.L.; Fu, C.C. Applying Image Processing to the Textile Grading of Fleece Based on Pilling Assessment. Fibers 2018, 6, 73. [Google Scholar] [CrossRef]
  24. Jing, J.; Zhang, Z.; Kang, X.; Jia, J. Objective evaluation of fabric pilling based on wavelet transform and the local binary pattern. Text. Res. J. 2012, 82, 1880–1887. [Google Scholar] [CrossRef]
  25. Eldessouki, M.; Hassan, M. Adaptive neuro-fuzzy system for quantitative evaluation of woven fabrics’ pilling resistance. Expert Syst. Appl. 2015, 42, 2098–2113. [Google Scholar] [CrossRef]
Figure 1. Flowchart of pilling grade classification of knitted fabric.
Electronics 07 00367 g001
Figure 2. Flowchart of fast Fourier transform (FFT).
Electronics 07 00367 g002
Figure 3. (a) Original image, (b) spectrum obtained through FFT using a Gaussian filter, and (c) inverse Fourier transform IFFT image.
Electronics 07 00367 g003
Figure 4. (a) IFFT image and (b) binarized image.
Electronics 07 00367 g004
Figure 5. (a) 4-Connected and (b) 8-connected area labeling.
Electronics 07 00367 g005
Figure 6. (a) Binarized image and (b) fabric pilling areas obtained through the 8-connected method.
Electronics 07 00367 g006
Figure 7. Structure of T2FCMAC classifier.
Electronics 07 00367 g007
Figure 8. Interval type-2 fuzzy set.
Electronics 07 00367 g008
Figure 9. Flowchart of traditional Artificial Bee Colony (ABC) algorithm.
Electronics 07 00367 g009
Figure 10. Schematic of individual bees.
Electronics 07 00367 g010
Figure 11. Schematic of ranked fitness values.
Electronics 07 00367 g011
Figure 12. Highest fitness value of particles is set as new group leader.
Electronics 07 00367 g012
Figure 13. Similar bees assigned to same group.
Electronics 07 00367 g013
Figure 14. Second grouping of bees.
Electronics 07 00367 g014
Figure 15. Flowchart of proposed hybrid of group strategy and artificial bee colony (HGSABC) algorithm.
Electronics 07 00367 g015
Figure 16. (a) Original image, (b) red region representing pilling (without image preprocessing), and (c) red region representing pilling (with image preprocessing).
Electronics 07 00367 g016
Table 1. Five pilling grades of knitted fabric.
Samples Electronics 07 00367 i001 Electronics 07 00367 i002 Electronics 07 00367 i003 Electronics 07 00367 i004 Electronics 07 00367 i005
The pilling of knitted fabricvery seriousseriousmoderateslightno
Grade12345
Table 2. Results of fabric pilling grade obtained using proposed T2FCMAC classifier.
Data SetsAccuracy Rate
Data set 196.88%
Data set 298.44%
Data set 395.31%
Data set 493.75%
Data set 592.19%
Data set 6100%
Data set 7100%
Data set 8100%
Data set 998.44%
Data set 1098.44%
Average accuracy rate: 97.3%
Table 3. Comparison of results using various methods.
MethodsProposed MethodSaharkhiz and Abdorazaghi [2]Eldessouki et al. [3]Furferi et al. [4]Huang and Fu [23]Jing et al. [24]Eldessouki and Hassan [25]
Average accuracy rateFixed illumination97.3%94.8%87.5%94.3%96.6%95%85.8%
Different illumination94.6%90.2%81.3%88.4%92.4%91.3%80.6%

