Article

Illumination-Insensitive Skin Depth Estimation from a Light-Field Camera Based on CGANs toward Haptic Palpation

1
Haptic Engineering Research Laboratory, Incheon National University, Incheon 22012, Korea
2
3D Information Processing Laboratory, Korea University, Seoul 02841, Korea
*
Authors to whom correspondence should be addressed.
Electronics 2018, 7(11), 336; https://doi.org/10.3390/electronics7110336
Submission received: 19 October 2018 / Revised: 12 November 2018 / Accepted: 16 November 2018 / Published: 20 November 2018
(This article belongs to the Section Computer Science & Engineering)

Abstract

:
A depth estimation has been widely studied with the emergence of a Lytro camera. However, skin depth estimation using a Lytro camera is too sensitive to the influence of illumination due to its low image quality, and thus, when three-dimensional reconstruction is attempted, there are limitations in that either the skin texture information is not properly expressed or considerable numbers of errors occur in the reconstructed shape. To address these issues, we propose a method that enhances the texture information and generates robust images unsusceptible to illumination using a deep learning method, conditional generative adversarial networks (CGANs), in order to estimate the depth of the skin surface more accurately. Because it is difficult to estimate the depth of wrinkles with very few characteristics, we have built two cost volumes using the difference of the pixel intensity and gradient, in two ways. Furthermore, we demonstrated that our method could generate a skin depth map more precisely by preserving the skin texture effectively, as well as by reducing the noise of the final depth map through the final depth-refinement step (CGAN guidance image filtering) to converge into a haptic interface that is sensitive to the small surface noise.

1. Introduction

Because the monitoring of skin surface information, such as color, shape, texture, roughness, and temperature, can be utilized importantly for medical diagnoses of skin lesions and tumors [1,2], skin aging [3,4,5], and the development of cosmetics [6,7,8], its methods have been studied constantly in the field of biomedical research [9]. Although methods to acquire various information of a skin surface using cameras have been highlighted as a way to prevent the secondary infection of lesions, reliance on only visual information based on acquired images is limited in the provision of sufficient information to dermatologists and cosmetic professionals. Therefore, studies to take advantage of the combination of visual information from images and tactile information from a haptic interface have continued [9,10,11,12,13,14,15]. For palpation based on haptic devices, precise three-dimensional (3D) surface reconstruction is required through images acquired from cameras. However, although many studies have been conducted on acquiring 3D information of the skin surface, as in the stereo system [14,16] and multiple-view system [17], limitations have continued to exist in terms of cost and computational complexity in the 3D reconstruction of the skin surface composed of complex and delicate wrinkles. Overcoming such limitations may be possible through the use of a single image sensor or the development of a highly efficient and accurate 3D reconstruction algorithm.
Recently, with the emergence of technology (the Lytro or plenoptic camera) to reconstruct images with different foci after simultaneous recording of light in various directions using micro-lens arrays with a single image sensor, studies on depth estimation or 3D reconstruction using this technology have received attention. Most previous studies were aimed at depth estimation of synthetic data or large and rigid objects or scenes, and subsequently proposed a matching-based method by modifying stereo-image-based depth-computation methods to match micro-lens array images [18,19,20,21,22,23]. Other methods using focus and defocus cues obtained from the light-field camera in conjunction with the matching cost [24,25], and using epipolar plane images (EPIs) [26,27,28,29,30], have also been continuously proposed. Recently, learning-based methods have been proposed [31,32]. However, those studies have focused on objects where the surface textures were not important; therefore, the methods proposed therein were not suitable to extract depth information of delicate wrinkles on the skin surface. Furthermore, the susceptibility to the influence of illumination is a more important point of emphasis in the diagnosis of the skin surface, rather than the occlusion problem that has been intensively studied thus far. Such illumination may cause the disappearance or distortion of texture information due to high sensitivity. Because the light-sensitive low-quality skin image (Figure 1a) generated by the Lytro camera is the greatest obstacle to the reconstruction of the accurate medical 3D surface texture information, one might think that there should have been a significant number of studies on this topic. However, surprisingly, not a single study related to this topic could be found.
In this study, a new algorithm to reconstruct the sophisticated 3D wrinkle information of the skin surface is proposed using light-field skin images acquired from a single Lytro camera (1st generation). The proposed algorithm primarily consists of two steps. In the first step, a deep learning method, generative adversarial networks (GANs) [33], is used to transform a light-sensitive low-resolution Lytro camera image into a robust image insensitive to light changes. At this step, the skin image, acquired in various lighting conditions, is learned by the supervised deep learning network. Images without directional lighting and skin images altered by directional lighting are used as skin image sets for network learning, which generates robust skin images insensitive to changes in illumination. This process creates skin images that can overcome the limitation of the Lytro camera (light-sensitive low-quality images). In the second step, the precise skin depth is estimated using the robust skin images generated in the first step. To do this, sub-aperture images are generated by the weighted sum of the images from a GAN model and reflectance images from intrinsic decomposition [34]. In addition, for the optimization to find the optimal disparity values, two cost volumes were designed with the weighted sum of the sum of the absolute difference (SAD) and the sum of the squared difference (SSD) of pixel intensity and gradient cues in two ways, which yielded improved results over existing methods. In the final disparity-hole-filling step, the outcome that preserved the robust and detailed texture unsusceptible to illumination was presented by utilizing the center image with enhanced skin surface textures, free from the influence of lighting as a guidance image. The experimental results show that our method was effective for skin images captured by a Lytro camera. For light-field images that were taken under diverse illumination conditions, our method outperformed state-of-the-art methods in terms of depth estimation and showed the skin texture more clearly.
This article is composed as follows. Section 2 introduces previous studies on illumination normalization and depth estimation related to this study, and Section 3 describes the illumination-insensitive disparity computation from light-field skin images, as proposed in this study. Section 4 shows the experimental results that verified our proposed method in comparison with the best methods previously published, and Section 5 presents the discussion and conclusion of this study.

2. Related Work

This study can be divided into, illumination normalization based on the deep learning method, and depth estimation using micro-lens skin images acquired through the Lytro camera. This section intensively focuses on the related works for each of these topics.

2.1. Illumination Normalization

It is absolutely necessary for the reduction of information distortion to correct the effects of illumination in using camera-based skin images. Therefore, there have been many studies on illumination in the past. In the logarithmic discrete cosine transform (LDCT) [35], low-frequency DCT coefficients were removed in the logarithmic domain to reduce the illumination variation; however, this could not solve the problems of shadowing and secularity completely. Study [36] proposed a robust and simple pre-processing method insensitive to variation in lighting conditions (TT), which preserved details and was computationally efficient in using gamma correction, difference-of-Gaussian (DoG) filtering, masking, and contrast equalization. The corrected intensity distributions using regularized energy minimization present a calibration program that does not need a reference image when non-uniform illumination occurs in an image taken by a microscope (CIDRE) [37]. The new program is a retrospective method, which controls the intensity distributions using the regularized energy function. In [38], illumination transfer was used instead of albedo estimation to normalize illumination, which reduced the element-wise illumination difference through the relighting algorithm. The analytical skin-reflectance model (ASRM) of the hybrid bidirectional reflectance distribution function (BRDF) was used. In [39], a facial image was divided into large-scale and small-scale through logarithmic total variation (LTV), and illumination was normalized through correction on large-scale components (CLC) in the large-scale spectrum where the illumination field was present. In addition, recently, studies combining deep learning and illumination have been published. For example, the study in [40] generated global illumination using Conditional Generative Adversarial Networks (CGAN). However, it is considerably different from our study that requires illumination normalization or illumination correction. Another example is illumination correction using deep learning to solve the problems of difficult stereo reconstruction, image segmentation and visual instrument tracking caused by specular highlights during endoscopic surgery [41]. More recently, deep cell segmentation that was robust, even in uneven lighting, has been proposed in order to solve the problem of difficult segmentation of cells on electron microscopy images due to illumination [42]. However, both studies have limitations of inapplicability to medical skin images because they were not intended for general images and also the equipment was not obtained from cameras. This study proposes a method to reconstruct accurately the 3D skin surface details by recovering skin surface details weakened by illumination through a deep learning technique, CGAN, in order to improve the quality of light sensitive skin images of the low-resolution light field, which has never been studied before.

2.2. Depth Estimation from Light-Field Images

The four-dimensional light-field representation allows the use of the multiple views of sub-aperture images, and existing depth estimation algorithms are mainly divided into matching-based methods and epipolar plane image (EPI)-based methods. In matching-based methods, the authors of [18] proposed a method to apply the phase shift theorem to address an issue of the narrow baseline, and built the cost volume through the sum of absolute difference and the sum of absolute gradient difference. While this method has shown good depth estimation performance, it showed a substantial loss of skin texture due to over-smoothing (Figure 1c). As an expansion of this, a method to construct four different cost volumes via a learning method was also proposed [19]. A method utilizing the commonly used zero-mean normalized cross correlation and census transform, in addition to the sum of absolute differences and the sum of gradient differences used in [18], was proposed. However, in the skin image, the two remaining data costs did not show improvement over the existing method. More recently, a method to show better performance for the occlusion problem has been proposed by introducing novel data costs such as constrained angular entropy and constrained adaptive defocus cost [20]. However, this also either showed large errors in the texture, such as wrinkles in skin images, or lost texture information (Figure 1d). In addition to the matching-based method, there have been studies using defocus or refocus, features of the light-field camera. Representative studies used the correspondence cue and defocus cue as data costs to estimate depth [21], and in [22], it was extended to a method to utilize shading constraints as a regularization term, showing an accurate depth estimation. However, although the additional use of the shading term showed good results in refining the 3D shape, its performance was poor for real images, such as the skin image. Moreover, a very long computation time was required. The study in [23] proposed a method to find the minimum cost by dividing the angular patch into occluded and non-occluded regions on the basis of the edge orientation information obtained through edge detection, and subsequently by applying the defocus cue, correspondence, and refocus cue to each region. However, this method focused on single occlusion and varied greatly in performance depending on how accurately the angular patch was divided (Figure 1b). In addition, there has been a study to improve light-field triangulation and stereo matching by applying the constrained Delaunay triangulation (CDT) and line-assisted graph cut (LAGC) based on the geometry of 3D lines [24]. However, it did not present good results due to the small disparity range. To address this issue, the authors of [25] proposed a multi-view stereo model based on the robust principal component analysis matching term and low rank minimization, and presented the results of applying it to light-field data, from which multi-view data could be easily obtained. Furthermore, studies on depth estimation using EPI-based methods have also been performed continuously. A recent representative method using EPI, introduced in [26], presented a way to estimate the depth by estimating the orientation of the EPI lines. It defined the two regions on the left and right of the EPI line, and subsequently estimated the depth through a spinning parallelogram operator that measured the weighted histogram distances. However, this also did not perform well on the skin image (Figure 1e). There has been a study in which the direction of the local line was obtained using a structure tensor in the EPI domain and depth estimation was performed through global optimization [27]. However, because the structure tensor depends on the high angular resolution, the study had limitations unless the super resolution was not used in the light-field technology, where a trade-off between angular resolution and spatial resolution existed [28]. Thus, there has been a study that introduced a method that created high-spatio-angular-resolution images at multiple viewpoints generated from a DSLR camera with movement and subsequently estimated the depth images from them [29]. Reference [30] proposed a method that introduced a scale-depth space and then found local extrema in such a space to display depth information. As described, methods using EPI are too sensitive to occlusion and noise to apply to the real light-field data, and [26] introduced a method to address this issue. Recently, there have been studies to estimate the depth map using deep learning methods, such as convolutional neural networks (CNNs). A method proposed by [31] uses CNNs for light-field images to estimate depth information. The proposed method learns an end-to-end mapping between the 4D light field and the corresponding depth field in its 2D hyperplane orientation. The estimated depth field is then refined through a higher-order regularization method as the post processing step. As the extended study of [31], the study [32] proposed a method effectively reducing the computation time. In this study, we will compare the results from our method with those from the state-of-the-art methods (EPI-based method [26], matching-based methods [18,20,23]).

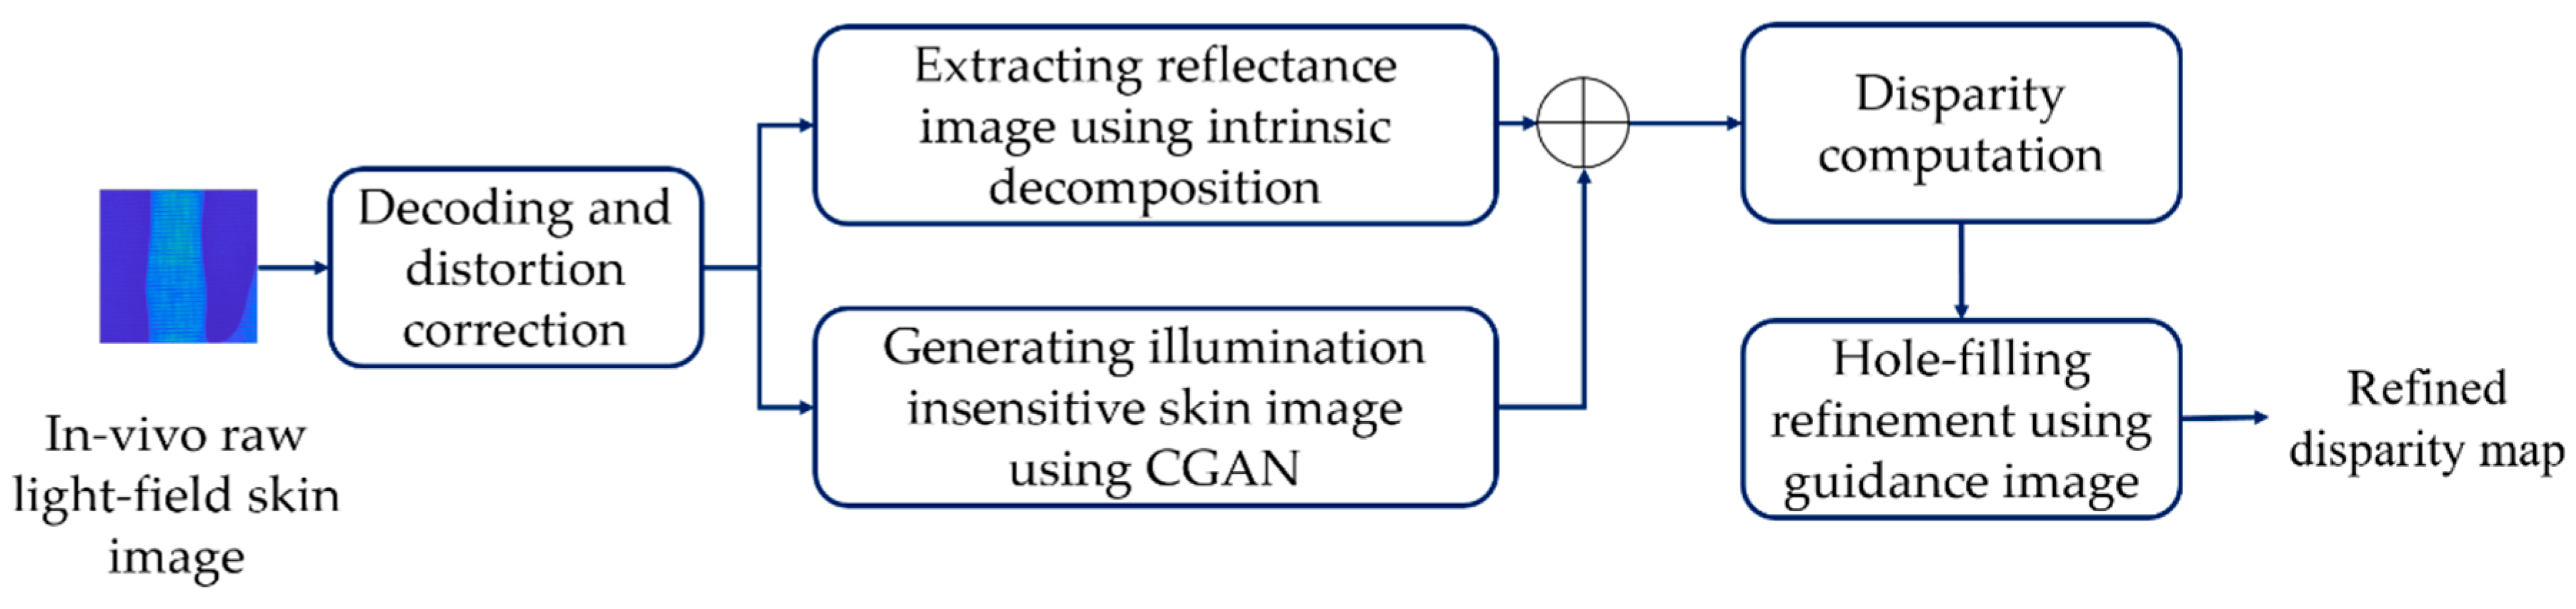
3. Materials and Methods

Figure 2 shows the overall flowchart of the proposed method in this study. By decoding the in-vivo raw light-field lenslet image acquired from the Lytro camera, an array of sub-aperture image sets can be obtained. We apply intrinsic decomposition to an image, which is generated by correcting the lens distortion, to obtain the reflectance image. At the same time, based on a trained CGAN model, we generate an illumination-insensitive and texture-enhanced image. The two images are then combined to create a set of refined sub-aperture images and disparity computation is performed. Then, we build a final cost volume which consist of a weighted sum of two cost volumes. One cost volume is composed of the weighted sum of the sum of absolute difference of intensity differences and the sum of squared difference of gradient differences. The other data cost volume includes the weighted sum of the sum of squared difference of intensity differences and the sum of squared difference of gradient differences. This leads to derive the improved results of describing skin texture and shape on a 3D scale. In addition, the refined image is used as a guided image for refinement, which is used for a haptic palpation interface with a haptic device.

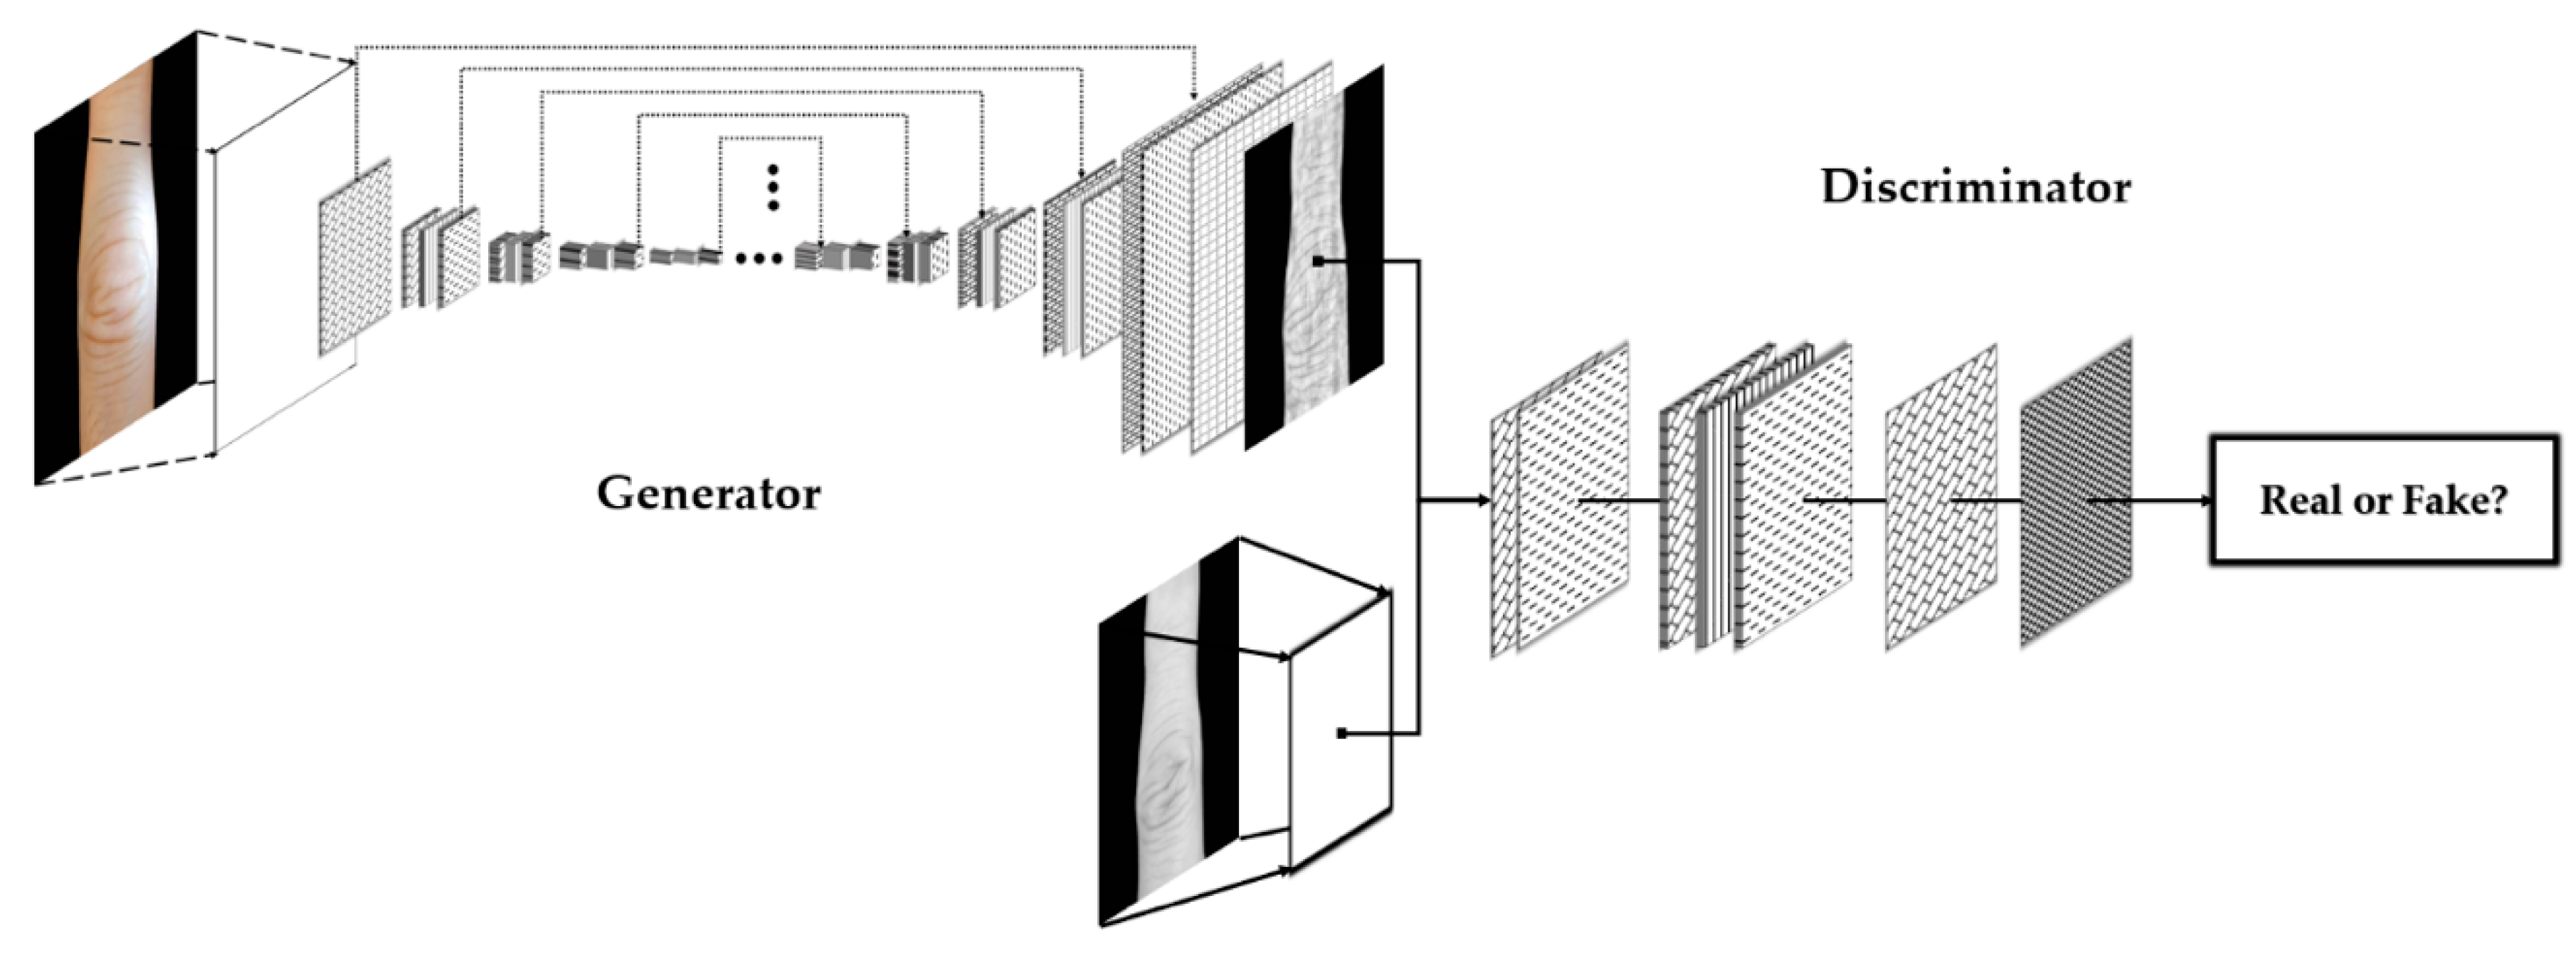
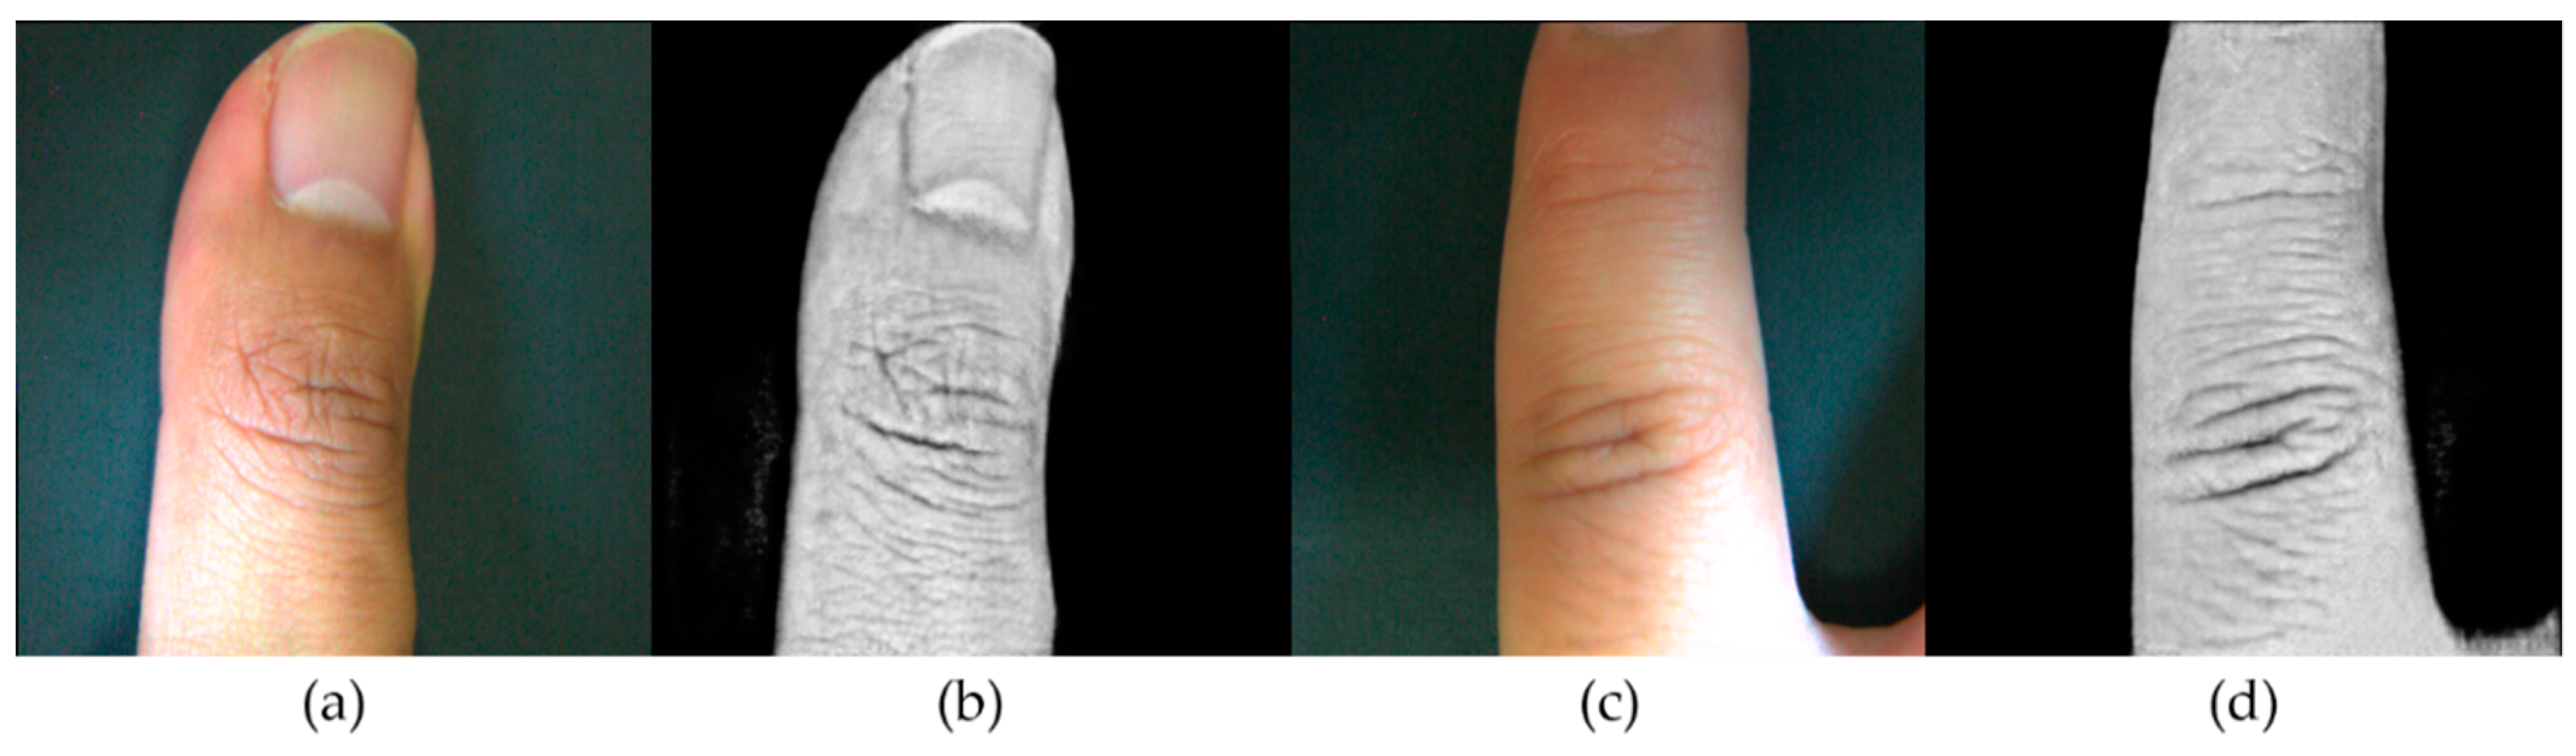
3.1. Conditional Generative Adversarial Network (CGAN)-Based Illumination Insensitive and Texture Enhancemed Image Generation

3.1.1. Generative Adversarial Networks (GANs)

The GANs are composed of two models, a generative model G and a discriminative model D , aiming to gradually improve performance through the mutual adversarial networks. The generative model G tries to imitate data distribution ( P d a t a ) as much as possible, thereby trying to generate an image that cannot be distinguished from the image obtained from the training data. In contrast, the discriminator model D seeks to distinguish between the two. The discriminator model tries to reduce the probability of errors in the distinction between generated image and training data, and the generative model G tries to increase the probability that a discriminator model D makes a mistake. Therefore, this concept is similar to solving the minimax problem for the value function V ( D , G ) described in Equation (1) [33].
  m i n G m a x D V ( D , G ) =   Ε x ~ P d a t a ( x ) [ log D ( x ) ] +   Ε z ~ P z ( z ) [ log ( 1 D ( G ( z ) ) ) ]  
In the above equation, x ~ P d a t a ( x ) means the data sampled from the probability distribution of the real data, and z ~ P z ( z ) represents the data sampled from the Gaussian distribution of random noise. Here, z is also called a latent vector, which represents a vector in latent space that can explain the data well with reduced dimensions. D ( x ) indicates a discriminator and D ( x ) = 1 if the data comes from the real data distribution, and D ( x ) = 0 if data comes from the generator. The discriminator D ( G ( z ) ) in the second term has a value 1 if the data generated from G is judged to be genuine and 0 if it is judged to be false. From the viewpoint that the discriminator D maximizes the value function V ( D , G ) , the first term log D ( x ) and the second term log ( 1 D ( G ( z ) ) ) of the right side should be maximized in order to maximize the above equation. Thus, D ( x ) = 1 , which means learning D to classify the real data as real. Likewise, because ( 1 D ( G ( z ) ) ) = 1 , D ( G ( z ) ) must be 0. This means learning discriminator D to classify the fake data generated by generator G as fake. Next, from the viewpoint that the generator G minimizes the value function V ( D , G ) , log ( 1 D ( G ( z ) ) ) should be minimized because the first term of the right side does not include G , so it is omitted from the generator. Therefore, D ( G ( z ) ) should be 1 because log ( 1 D ( G ( z ) ) ) is minimized when ( 1 D ( G ( z ) ) ) = 0 . This means that generator G is trained enough to generate fake data that is truly complete enough to be classified as real. In this way, the discriminator D is taught to maximize the value function V ( D , G ) , and the generator is taught to minimize V ( D , G ) .

3.1.2. Conditional Generative Adversarial Networks (CGANs)

Figure 3 shows the overall architecture of CGANs used in this study. The difference between CGANs and the existing GANs is that the existing GANs have one input value for each of D and G , but in CGANs, two inputs in each of D and G are used to make the output image closer to our intent. For CGANs, generative model G learns to generate specific fake samples with specific conditions or characteristics, rather than generic fake samples of unknown noise distributions used in GANs. We would like to perform specific sampling after matching any condition together with noise. An example of a specific condition or characteristic can be a label or tag associated with an image. These specific conditions or characteristics y are included in the generative model G and discriminative model D of value function V ( D , G ) , respectively, which can be summarized as Equation (2) [44].
  m i n G m a x D V ( D , G ) =   Ε x ~ P d a t a ( x ) [ log D ( x | y ) ] +   Ε z ~ P z ( z ) [ log ( 1 D ( G ( z | y ) ) ) ]  
We utilize the conditional GAN model to generate an image with enhanced texture and insensitive to various illumination conditions. Therefore, a set of sub-aperture images acquired through deep learning is free from the influence of illumination and has enhanced texture information, which makes it suitable for estimating skin depth. Figure 4a,c shows the image with illumination, and Figure 4b,d shows the images obtained through our CGAN model.

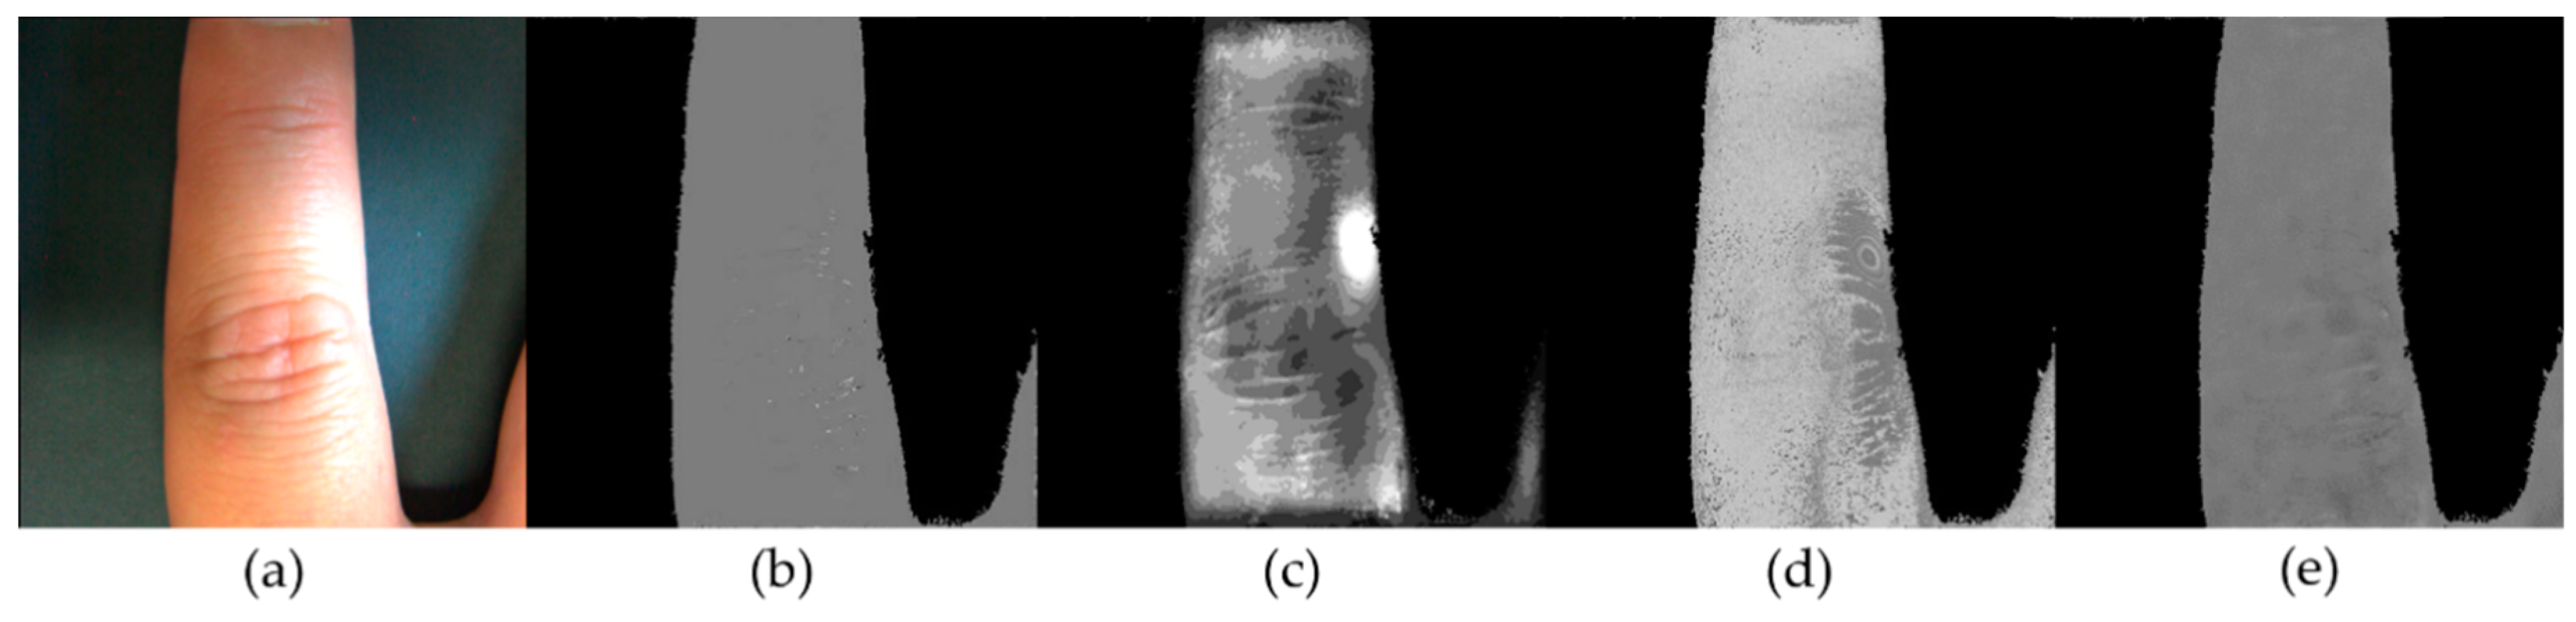
3.2. Intrinsic Image Decomposition

The observed images can be expressed by a multiplication of reflectance term ( R and illumination term ( L ) by a simplified physical model of light reflectance model [45]. Reflectance R has a value in ( 0 ,   1 ) (Figure 5c) and illumination L has a value in ( 0 , ) (Figure 5b). Therefore, if the image including illumination is S (Figure 5a), S = R × L , and all images satisfy S L , it is also possible to separate illumination term and reflectance term through an objective function. To this end, the directly estimated reflectance image is generally too smooth or loses a lot of edge and texture detail. Therefore, we separate illumination and reflectance through a logarithmic transformation R = exp ( log S log L ) , rather than directly estimating. The objective function for this separation is same as in Equation (3).
E ( r , l ) = l + r s 2 2 + λ 1 l 2 2 + λ 2 r 1 ,
where l =   log L ,   r = log R ,   s = log S ,   r 0 ,   and   S 1 . In this study, the Lytro camera skin image is divided into reflectance and illumination term using intrinsic image decomposition method based on the weighted variational model [34]. Among these, the reflectance image without the illumination effect is fused with the image generated by the CGAN model, which reduces the noise generated by the CGAN model and emphasizes the wrinkles of the skin surface more clearly (Figure 5d). Then, we calculate the disparity of the skin surface using the combined images.

3.3. Decoding and Distortion Correction of Lytro Images

A micro-lens array (MLA) is placed in front of the photo sensor in the Lytro camera, and then, the intensity information of the lights passing through the main lens of the camera among the lights coming from one point of the object in 3D space is separated by direction and collected (Figure 6b). We can obtain both the spatial resolution x , y and angular resolution u , v information of 4D light fields L ( u , v , x , y ) through the micro-lens characteristic of this light-field camera. The spatial resolution depends on the number of micro-lenses, and the angular resolution depends on the pixel number of each micro-lens in each photo sensor (Figure 6c). Therefore, the light-field camera captures the intensity of each direction of the ray when compared to traditional digital cameras that capture the integrated intensity of a pixel. Thus, pixels with a certain angle of incidence are stored in the same image, which becomes a single viewpoint (Figure 6d) [46]. Sub-aperture images of multiple viewpoints can be created by reordering the values at the same pixel position in each micro-lens image (i.e., lenslet image) (Figure 6e). This process is called a decoding process and is caused by the characteristics of a light-field camera. We apply the simple decoding algorithm presented in [47] to generate sub-aperture images, so we briefly explain the overall decoding process. The decoding process first restores the RGB values by demosaicing the raw Bayer-pattern image, and then corrects the vignetting effect, which indicates the degraded brightness near the edges of the images, through the white image selected according to focus and zoom. Although the lenslet array is located in front of the image sensor, it is not aligned well with the pixel of the image sensor because of the hexagonal lenslet grid resulting from the non-integer spacing, unknown translation, and rotational offsets of the lenslet. Thus, through the resampling process of rotating and scaling the lenslet images, the lenslet centers can be located in pixel centers (alignment process) and the hexagonally sampled data is transformed into an orthogonal grid through the interpolation method.
Optical distortion occurs due to the ray entering the main lens (thin lens model) and the micro-lenses (pinhole camera model). The rays of large angular differences from the optical axis have a distortion called astigmatism [48]. Rays that do not pass through the center of the main lens do not well fit to the pinhole camera model (field curvature [48]). Therefore, conventional distortion models based on the pinhole camera model have limitations in distortion correction. To solve this distortion problem, we apply simple minimization in [18] as described in Equation (4).
g ^ = argmin g p | Δ ( I ( p ) ) Δ o g ( p ) | ,
where Δ indicates the slope of EPI with distortion, Δ o indicates the slope of EPI without distortion, and g ( p ) indicates the amount of distortion at point p . We measure the EPI slopes of the sub-aperture images obtained from a captured planar checkerboard. The difference Δ ( I ( p ) ) Δ o ) is calculated by comparison with the EPI slope without distortion Δ o . The field curvature g ^ can be estimated by Equation (3). By rotating the EPI slope by g ^ , a distortion-corrected image can be obtained. Furthermore, to solve astigmatism, the field curvature is calculated twice in the horizontal and vertical directions.

3.4. Disparity Estimation and Refinement

Stereo matching has been a major research topic in the field of computer vision, and various methods have been proposed. Classically, stereo matching searches the feature matching between a rectified pair of images. This step is usually called matching cost computation, and disparity information of the two images can be obtained under an epipolar constraint. Typically, stereo algorithms consist of a matching cost computation step, cost-aggregation step, disparity-computation step, and disparity-refinement step. It is further divided into a local algorithm and a global algorithm that utilize a window-based matching-cost function. The local algorithms estimate the depth map through the matching cost based on the intensity difference in the local support window and include a smoothness constraint in the cost-aggregation step. Here we include the assumption that all pixels in the same window have similar disparities, which can be broken down by large discontinuities. On the other hand, the global algorithm finds the optimal disparity by optimizing the energy function consisting of the data cost term including the matching cost term and the smoothness term considering the discontinuity between neighboring pixels (see [49] for details).
However, unlike the general disparity estimation described above, the images of the multiple viewpoints obtained from a light-field camera have difficulty in disparity estimation due to the very narrow baseline. To overcome this narrow baseline, we used the phase shift method of Equation (5) proposed in [18]. The image shifted by Δ x in the spatial domain can be obtained by phase shifting each sub-aperture image in the frequency domain through the Fourier transform.
  F { I ( x + Δ x ) } = F { I ( x ) } e x p 2 π i Δ x   I ( x ) = I ( x + Δ x ) = F 1 { F { I ( x ) } e x p 2 π i Δ x  

3.4.1. Initial Depth Estimation

Unlike many of the disparity computation methods for object scenes that have been studied so far, in a skin scene for haptic palpation, texture information such as wrinkles should be well-preserved in a disparity map (In this paper, disparity map and depth map have same meaning and we use alternately) while reducing noise. To compute the matching cost, the intensity and gradient difference between the reference image and the target sub-aperture image are used, and the angular difference information is reflected in the sub-pixel shift term because it is not on the same baseline. In building each cost volume, we used two data costs (SAD, SSD) for the intensity and gradient cues. The first cost volume consists of the SAD for the intensity difference and the sum of the gradient squared difference (SGSD) for the gradient difference, as in Equation (6). Each is defined as Equations (7) and (8), respectively.
C μ 1 ( l , d ) = ( 1 α μ 1 ) × C S A D ( l , d ) + α μ 1 × C S G S D ( l , d ) ,
C S A D ( l , d ) = s S l W l m i n ( | I ( s c , l ) I ( s , l + Δ l ) | | , τ 1 ) ,
where α μ 1 [ 0 , 1 ] denotes the weight for adding each term and S denotes a set of sub-aperture images except for a sub-aperture image of center view (i.e., s c ). W l means the window whose center pixel location is l . The parameters τ 1 and τ 2 are truncation values for eliminating outliers. Also, Δ l is the term that make sub-pixel shifts according to the unit of the labels in pixels ( κ μ 1 ) and the degree of angular difference ( s c s ) and defined as Δ l = d × κ μ 1 × ( s c s ) , where d is the disparity label.
C S G S D ( l , d ) = s S l W l [ λ × m i n ( S D i f f x ( s c , s , l , d ) , τ 2 ) + ( 1 λ ) × m i n ( S D i f f y ( s c , s , l , d ) , τ 2 ) ] ,
where S D i f f x ( s c , s , l , d ) represents the squared difference of the gradient in the x direction between the reference image (i.e., center view sub-aperture image) and the target sub-aperture image and S D i f f y ( s c , s , , l , d ) represents the squared difference of the gradient in the y direction. This can be defined as S D i f f x ( s c , s , p , d ) , τ 2 ) = ( I x ( s c , p ) I x ( s , p + Δ l ) ) 2 . τ 2 plays the same role as in C S A D . λ represents the gradient difference according to the relative position of the target sub-aperture image and reference image, which is a necessary parameter because the target sub-aperture image has angular difference in both the x and y directions from the reference image ( α μ 1 = 0.5 ,   d = 25 ).
In the second cost volume computation, two preprocessing methods are added. First, we use the hue, saturation, and value (HSV) color space and bilateral filter to remove noise while preserving the shape. After the images are converted into the HSV color space, the V channel of image is extracted. Next, a bilateral filter is used to remove noise and preserve the shape information, and then the cost volume is built based on the processed image. We use the weighted sum of the SSD for the intensity difference and SGSD for the gradient difference, as shown in Equation (9). The SSD is described in Equation (10) and SGSD is equal to Equation (8).
C μ 2 ( l , d ) = ( 1 α μ 2 ) × C S S D ( l , d ) + α μ 2 × C S G S D ( l , d ) ,
C S S D ( l , d ) = s S l W l m i n ( ( I ( s c , l ) I ( s , l + Δ l ) ) 2 | , τ 1 ) ,
where α μ 2 [ 0 , 1 ] , a cost volume C μ 2 ( l , d ) is constructed by weighting each cost term ( α l o c = 0.8 ,   d = 25 ).
C μ ( l , d ) = ( 1 α μ ) × C μ 1 + α μ × C μ 2 ,
Both cost volumes have the advantage that C μ 1 represents local texture precisely such as wrinkle, and C μ 2 preserves the overall shape and produces noise-robust results. By combining two cost volumes as described in Equation (11) in building the final cost volume, more accurate disparity map can be estimated. Then, we utilize the reference image as a guided image to perform refinement process for each cost slice through filtering for edge-aware smoothing and detail enhancement [50]. Finally, we apply global optimization using graph cuts from [51] to estimate the initial depth map where the energy function in Equation (12) is minimized.
E ( d ) = l C ( l , d ( l ) ) + λ 1 l ζ d ( l ) d a ( l ) + λ 2 l N l d ( l ) d ( l ) ,
where ζ contains the inlier pixels determined by building the cost volume and filtering each cost slice. The first data term ( C ( l , d ( l ) ) represents the matching cost, the second data term ( d ( l ) d a ( l ) ) represents the data fidelity, and the third data term ( d ( l ) d ( l ) ) represents smoothness.

3.4.2. Disparity Refinement

Most of the methods up to now have performed a refinement process to remove noise by smoothing using filtering. For this purpose, large window size has been used and there was a serious drawback that detail texture disappears. This results in loss of texture information such as wrinkles in the skin image. In this study, we propose a hole-filling method that simultaneously preserves texture information and eliminates noise. The reference image is used as a guided image to reduce the noise of the calculated disparity map and preserve the texture information. At this time, in order to emphasize texture information, reference image is enhanced by using guided filter [52]. Next, we utilize the adaptive threshold for each local window in the reference image to create a binary image containing the texture information [53]. In the obtained binary image, the pixel indexes without texture information are stored, and the corresponding indexes are searched in the disparity map. A window around each index is generated, and the average value of the window is compared with the pixel value of the corresponding index. If the value is smaller, it is regarded as noise rather than texture. Here, we use a small window size (window size = 2) to reduce the effect of smoothing. The results are shown in the Figure 7b,d which are refined from Figure 7a,c, respectively.

4. Results

In order to verify the proposed method proposed, evaluation experiments were designed with three steps. First, we show that the CGAN model can accurately generate an illumination insensitive skin image without losing information contained in the original image through quantitative and qualitative comparison. Second, we show that our method can provide promising skin depth map under natural illumination compared to other state-of-the-art methods, and finally, we confirm through qualitative comparison that our method can estimate the depth map robustly even under the influence of illumination. Because the existing real or synthetic light-field datasets [54] are all based on objects or scenes, and because there is no dataset for the skin image, in this study, we generated the skin images captured from the Lytro camera (1st generation). We used the Intel i7 4.00 GHZ CPU, NVIDIA GeForce GTX 1060 3 GB, and 32 GB RAM. Figure 8a shows a digital microscope system for imaging the training set. Figure 8b shows the experimental environment in which a light-field image is taken for testing.

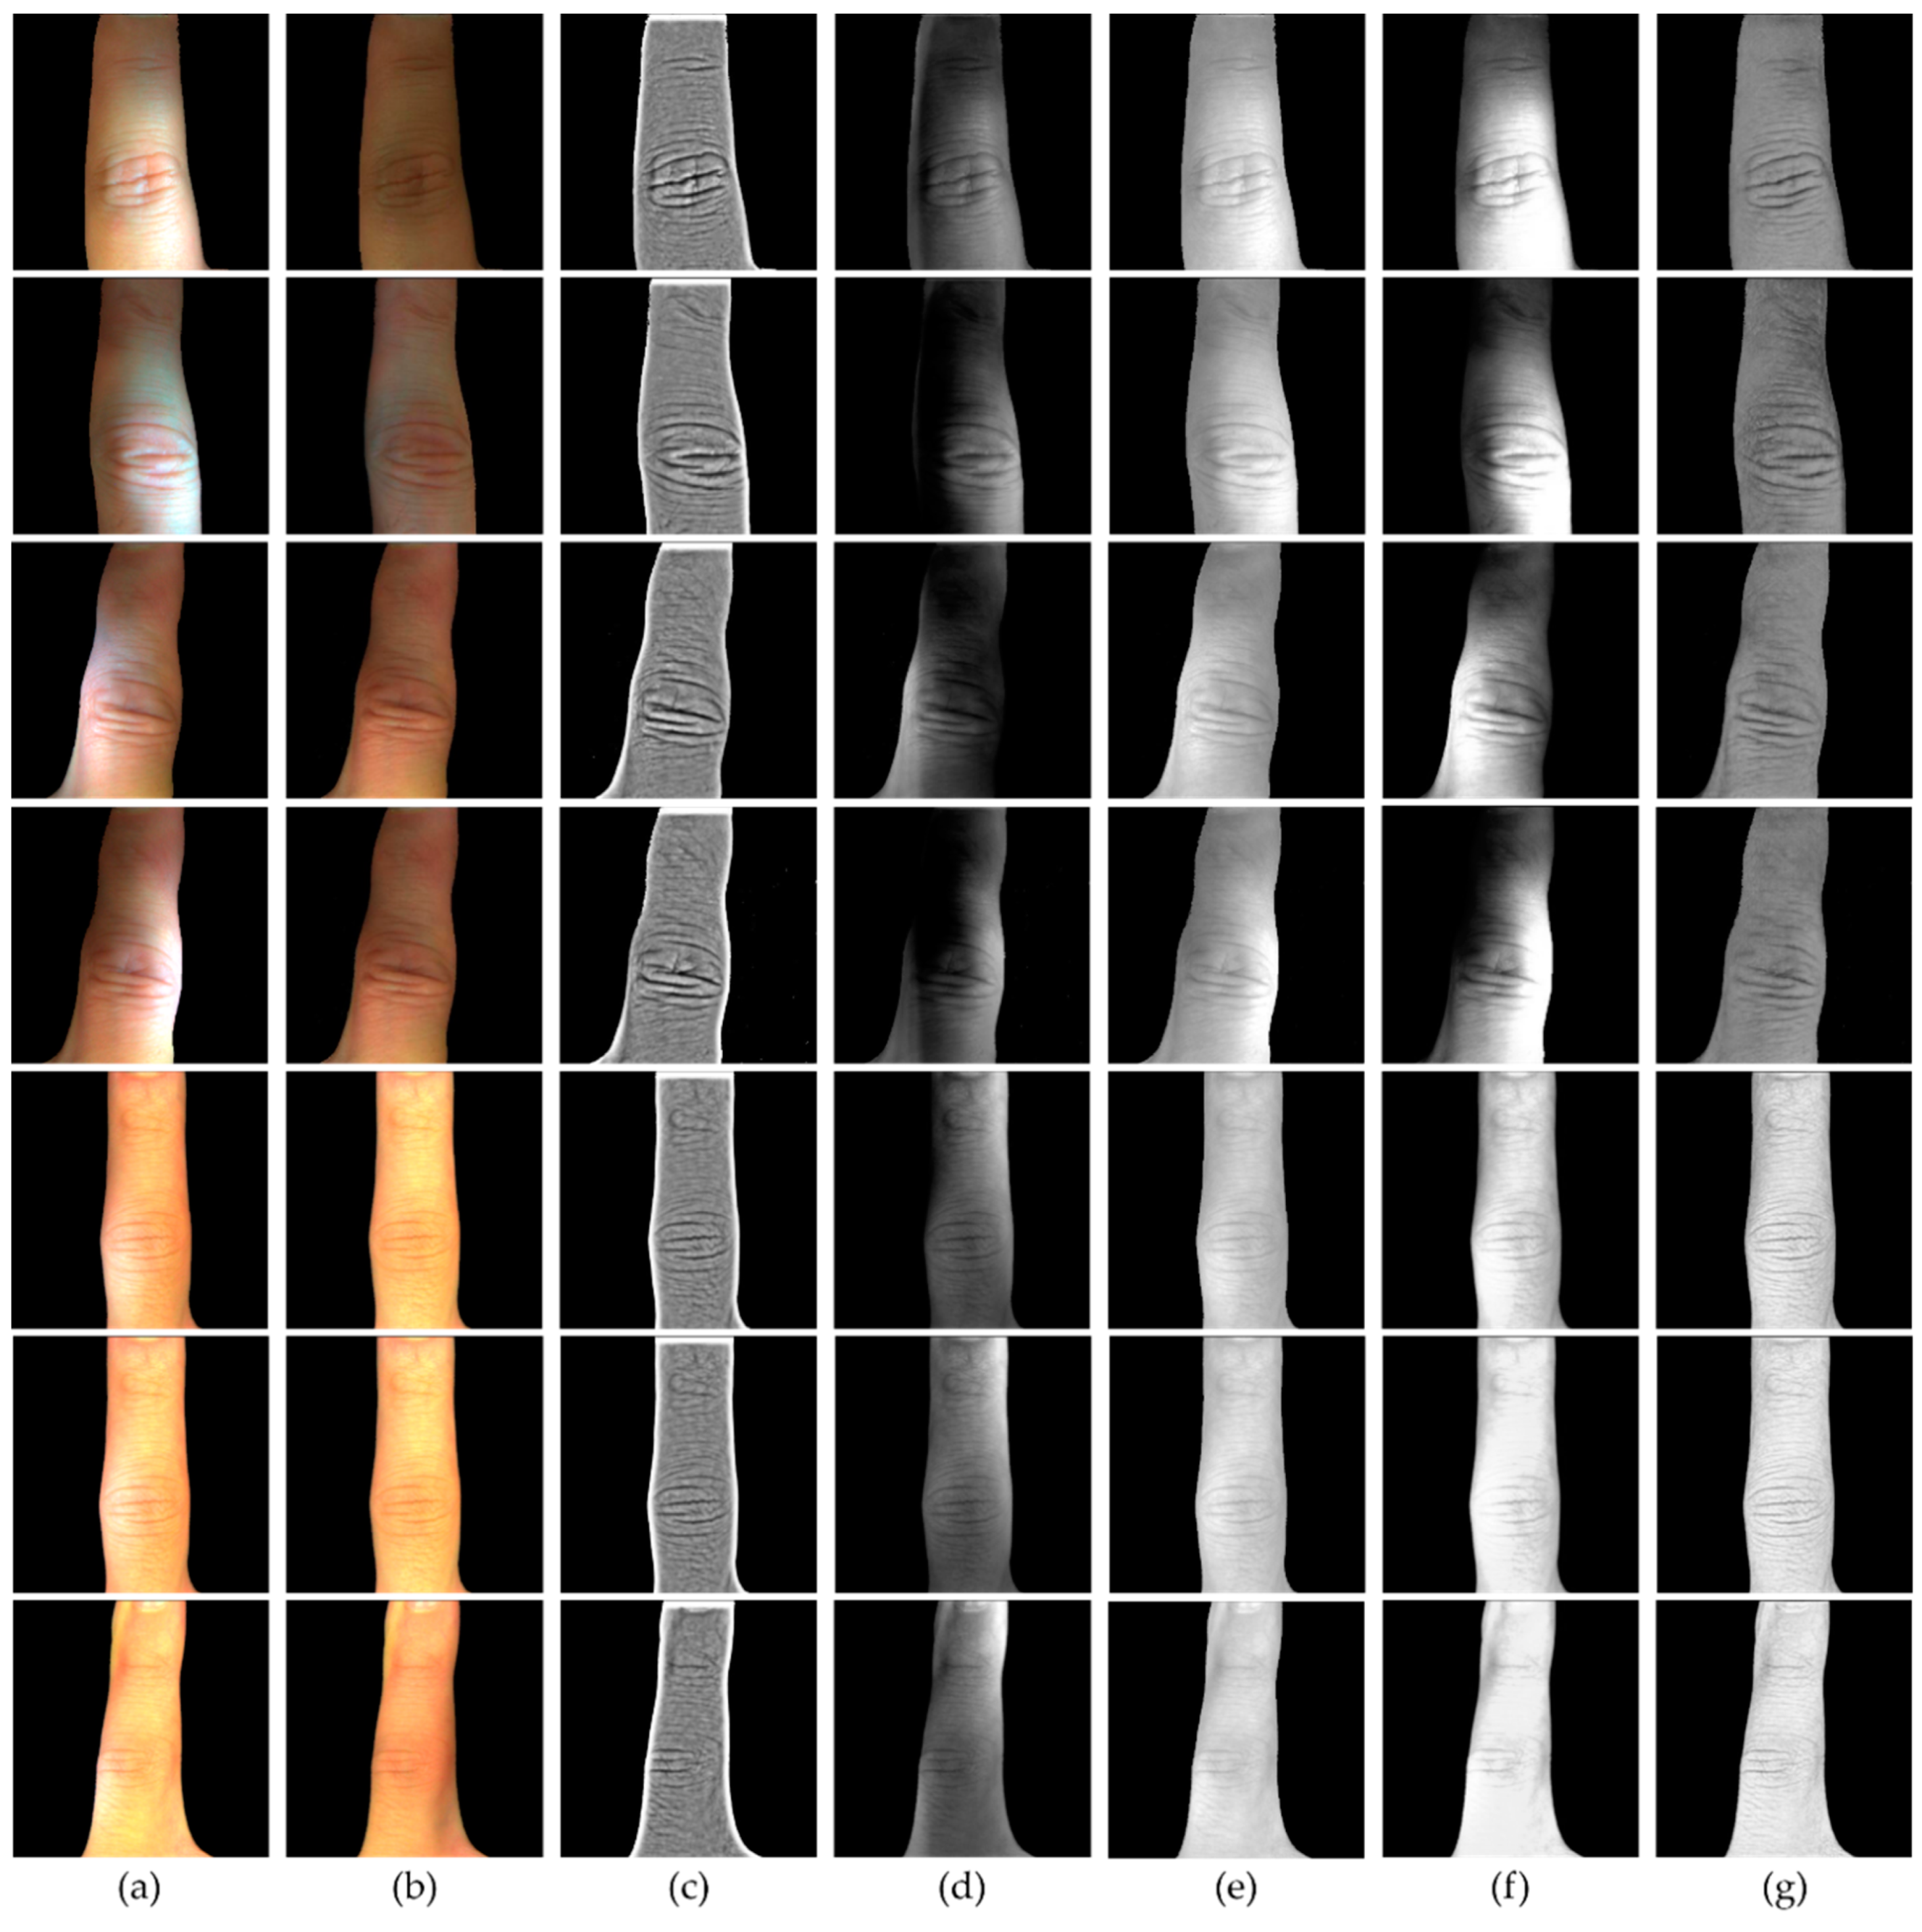
4.1. CGAN-Based Illumination Insensitive Image Generation

To evaluate our proposed method, skin images for training and testing were taken using a digital microscope system (KOB-240N(Toolis, Daegu, Korea), 5 mega pixels, 30 fps, zoom × 0~ × 30) and a digital light meter (TASI-8720(TASI, Suzhou, China), 1~200,000 lx) used for quantitatively measuring light intensity on the real skin. In the experiments, 320 real skin images were taken with the digital microscope system from five people and 250 images of them were used for training for CGAN, and the rest 70 images were tested for evaluation. It took a total of 16.7 h to training 250 skin images (1000 times in total). Because the CGAN is well fitted to generate images depend on the direction we want, we used a microscope image as a training set to make skin images insensitive to illumination and to enhance texture such as wrinkles. After testing with a test set consisting of a microscope image, light-field skin image sets were used as a test set. Because in real environment it is hard to obtain the ground truth, the reference image is taken in an environment where there is little influence of lighting. We compared the results of our method with the results of TT [36], CIDRE [37], Shen [55] and Zuiderveld [56] through the Peak signal-to-noise ratio (PSNR), mean squared error (MSE), and structure similarity index (SSIM) [57] to quantitatively assessed generated image quality. We also showed that our method can generate the illumination insensitive and texture enhanced image through the qualitative comparison with the images generated from other methods as depicted in Figure 9. The images from the first to fourth rows of Figure 9a were taken with directional illumination when the shooting environment was somewhat dark, and from the fifth row to seventh row of Figure 9a, the images were taken with directional illumination when the shooting condition was bright. The images of Figure 9a,b are the original input images and the reference (no illumination) images, and the rest images (Figure 9c–g) are resulting images obtained from [36,37,55,56], and our method, respectively. We experimented with various illumination conditions, and the results generated from our method are less sensitive to illumination and have enhanced texture information such as wrinkles. Table 1 shows the quantitative comparison result of our proposed method with other methods. It is indicated that acquired image is closer to a reference image when SSIM is closer to 1, PSNR is higher, and MSE, which is most important to compute accurate disparity maps (geometric surface information), is lower. Therefore, the result demonstrates that our method outperforms other methods in terms of geometrically restoring images degraded by directional lighting conditions.

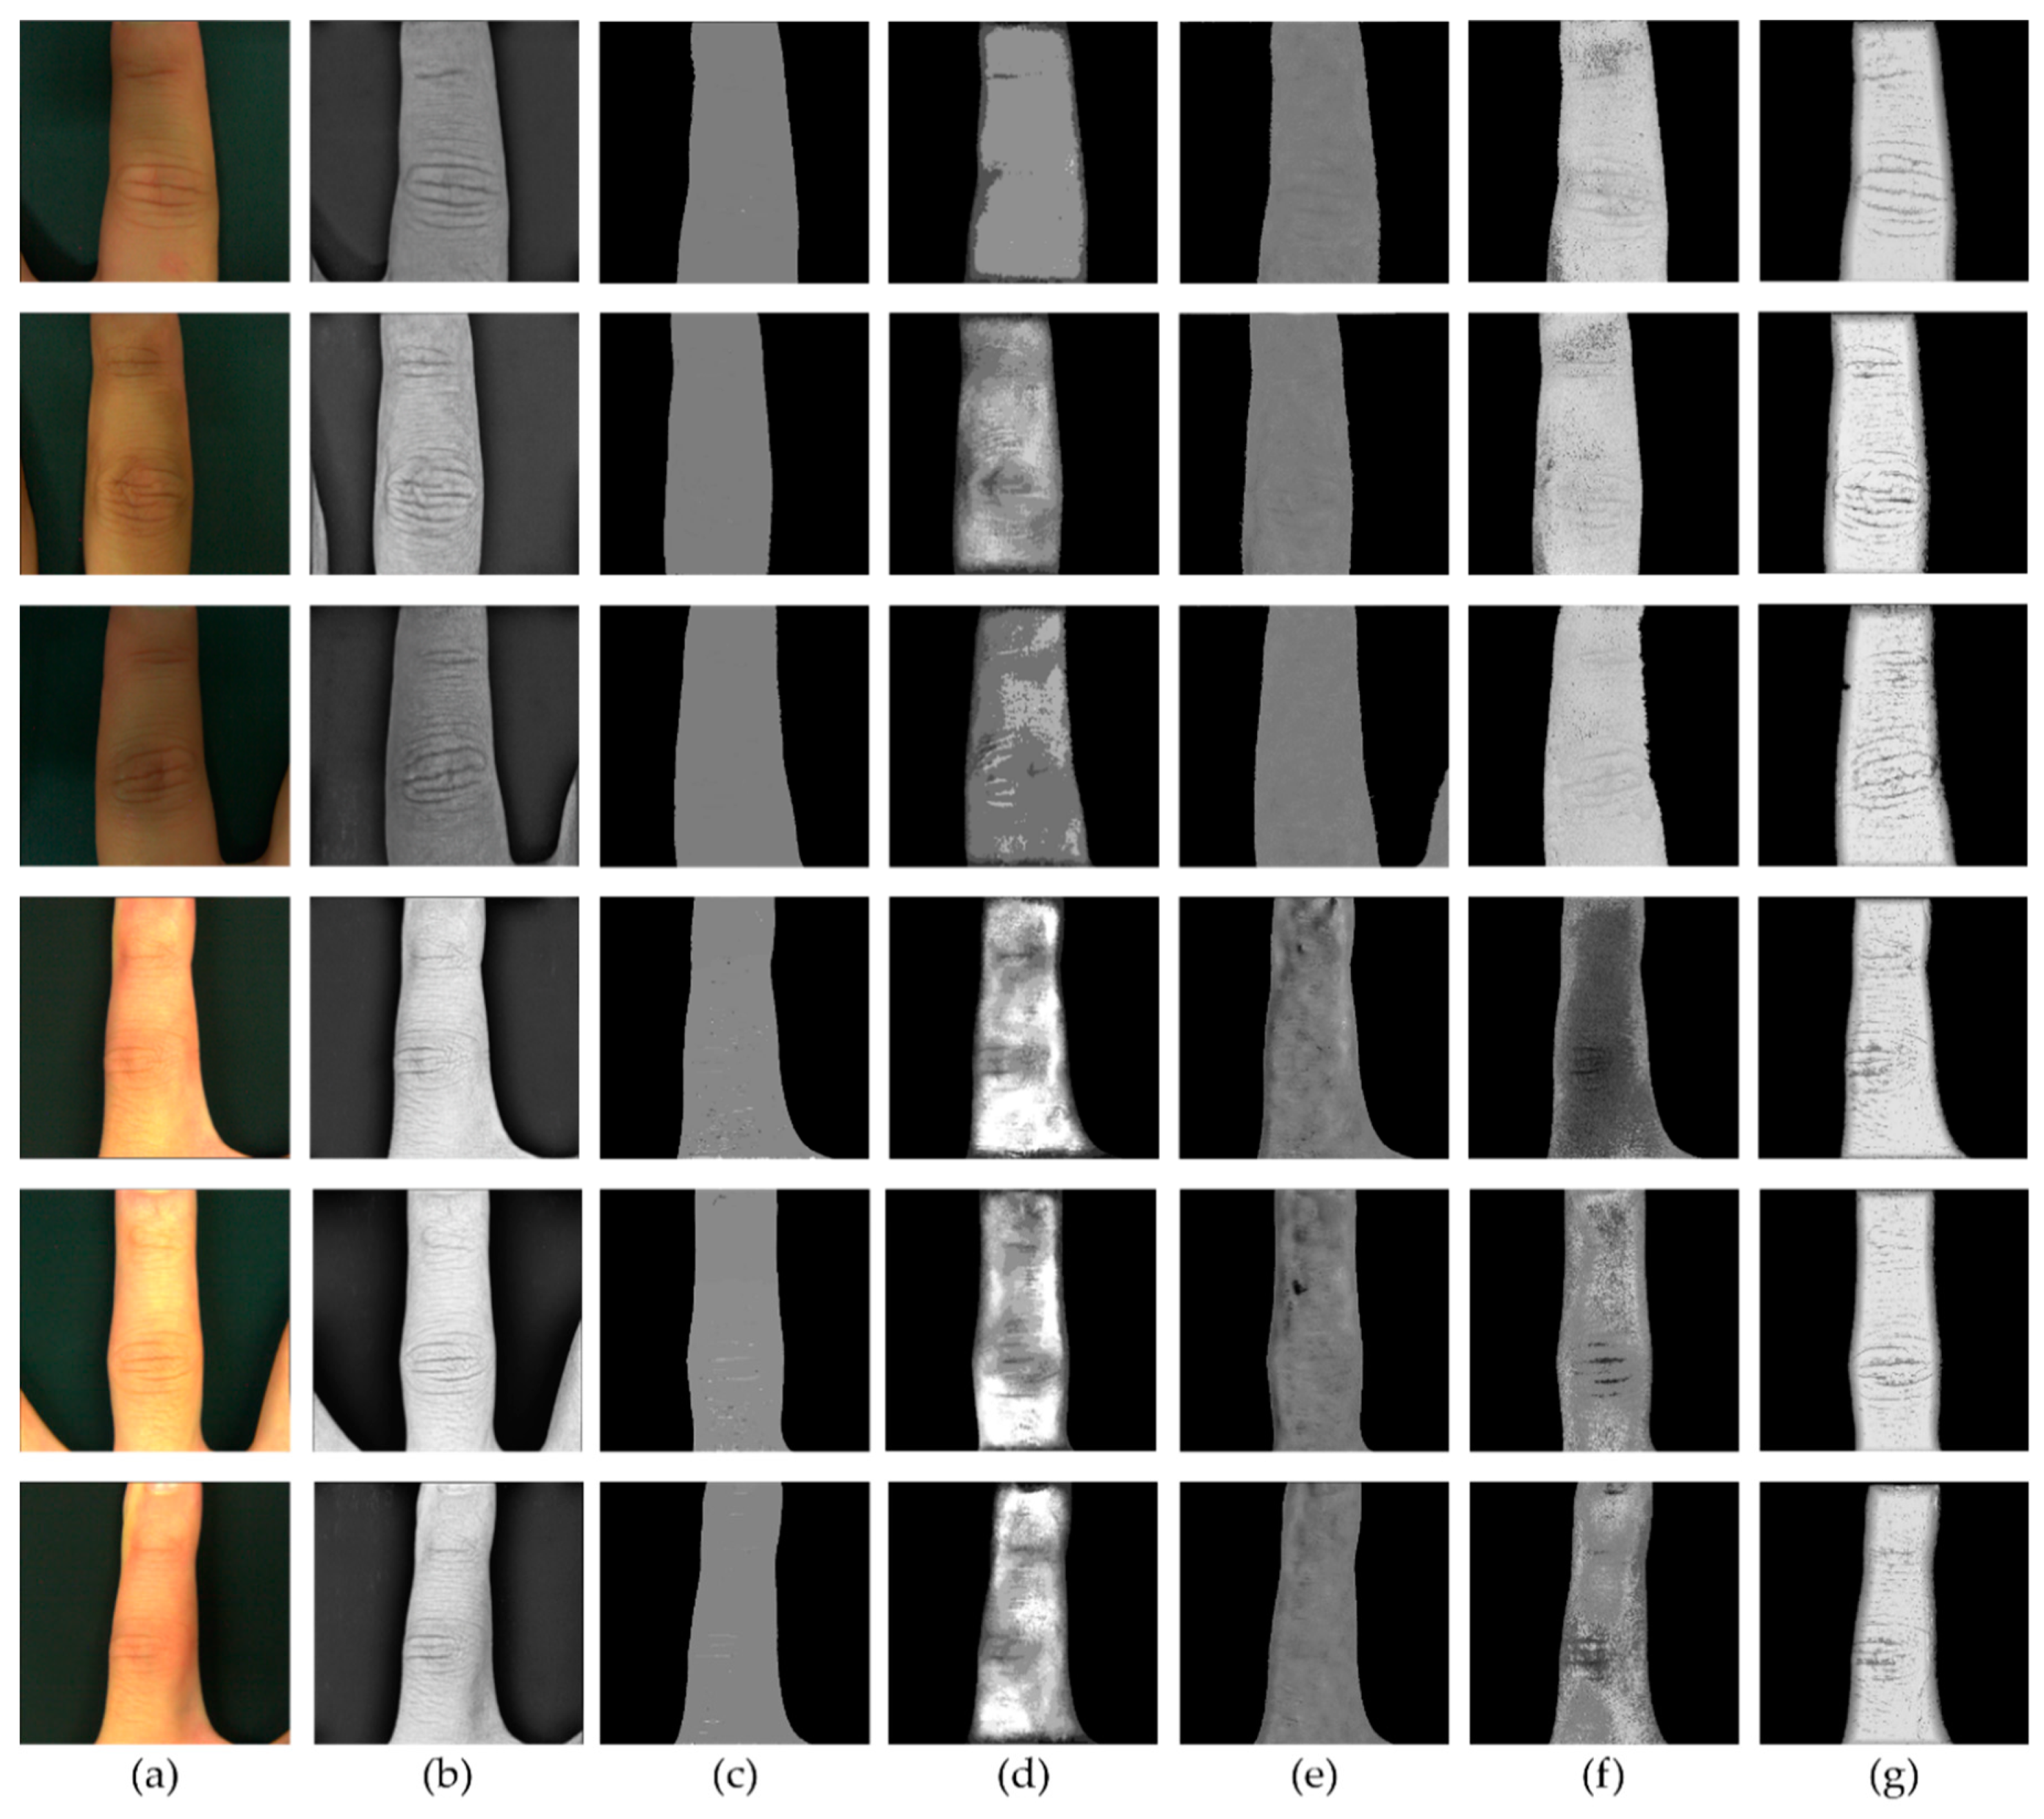
4.2. Disparity Map Estimation Using Light-Field Images under Natural Illumination

Section 4.1 shows that the proposed model can generate an insensitive image to various directional illumination. Section 4.2 shows the superiority of depth map estimated from the images generated from our CGAN model under natural illumination through comparing with other state-of-the-art matching-based methods [18,20,23] and EPI-based method [26] method. First, we confirm the role of the CGAN model by showing how the images obtained through the CGAN model affect the disparity estimation in the absence of the illumination condition. In Figure 10, we used the images captured under natural illumination (Figure 10a) and we compared the disparity map estimated from the images generated by our CGAN model (Figure 10b,g) with the state-of-the-art depth estimation algorithms. From the third column to sixth column show the depth maps estimated by the method [18,20,23,26], respectively and the last column shows the depth estimation results from our method. As can be seen from the depth estimation results derived from other methods, it is difficult to express the texture information of the skin image finely using the existing method, and there are many depth errors such that the parts which should be expressed at a high level were expressed low. Thus, even under conditions with natural illumination, other methods are shown to be vulnerable to depth estimation for the skin images. On the other hand, although the method proposed in this study contains some noise, it is superior to other methods in terms of preserving texture information finely and showing overall skin depth accurately.

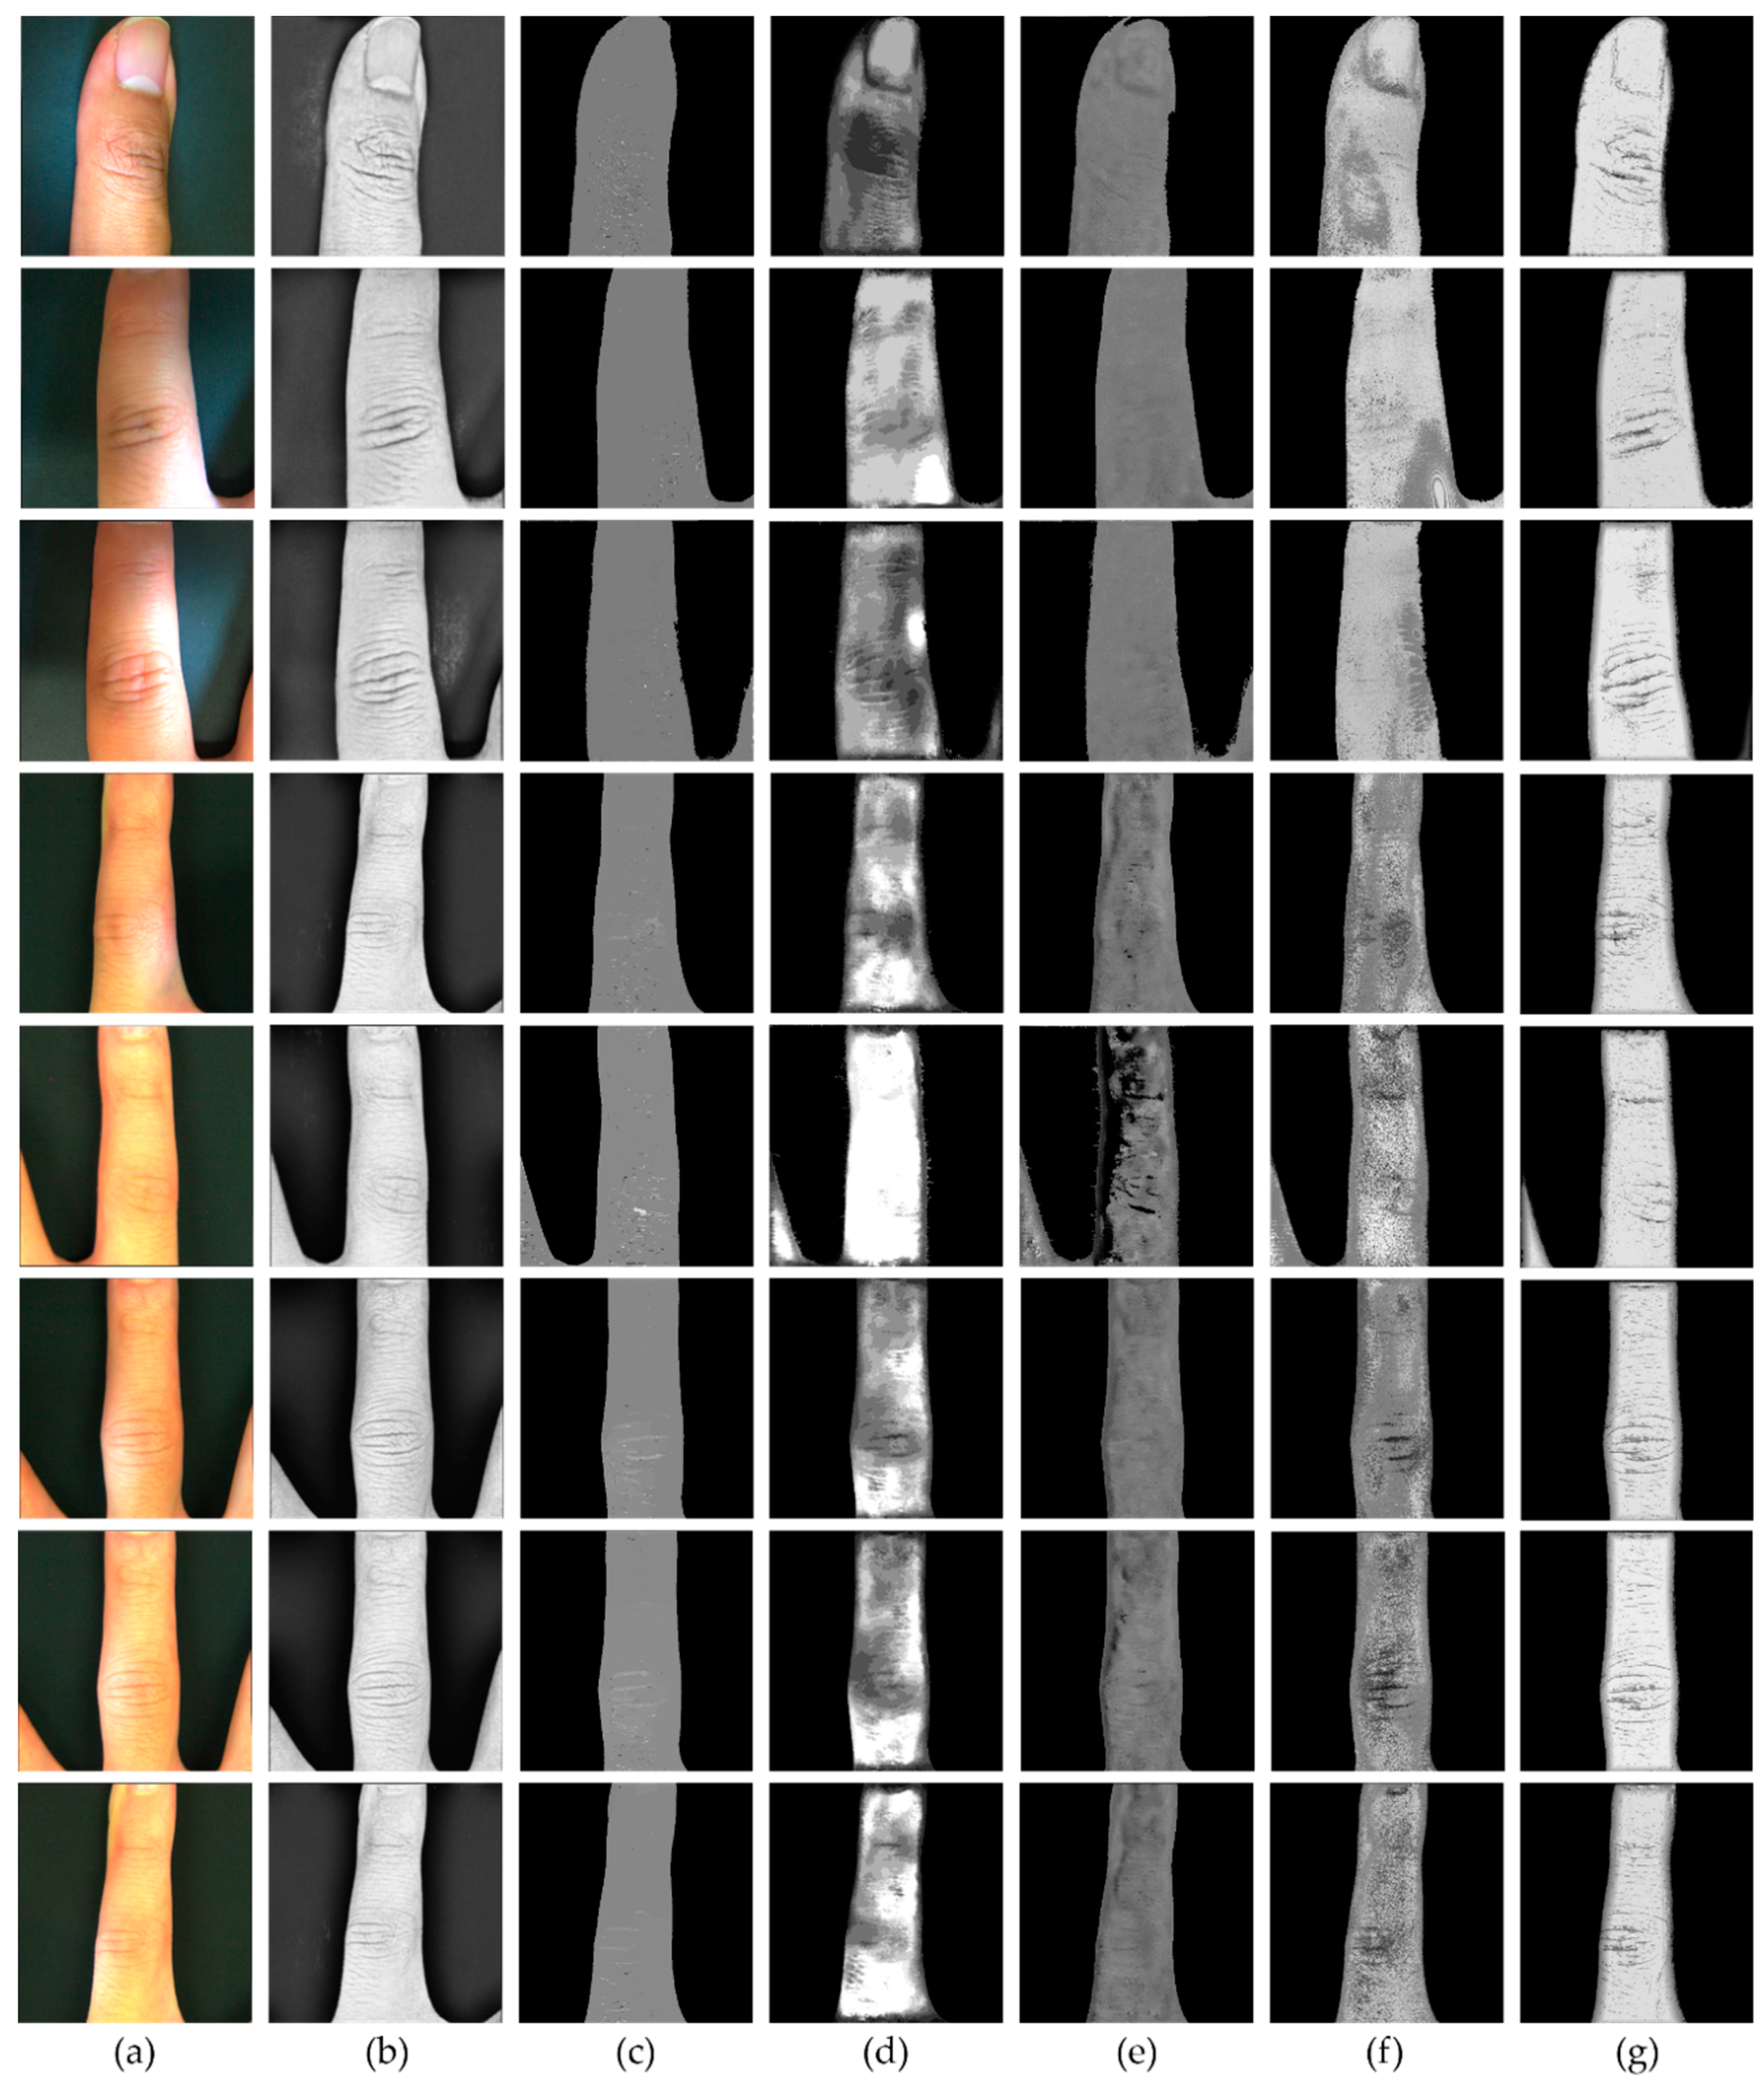
4.3. Disparity Map Estimation Using Light-Field Images under Controlled Illumination

Section 4.3 shows the effect of lighting conditions on depth estimation, and we will verify that the proposed method can estimate the depth map robustly even with such illumination. In Figure 11, the first column shows the skin images captured under various illumination conditions (Figure 11a), the second column represents the skin images generated from our deep learning model (Figure 11b). Here, we can see that the skin images obtained through the CGAN model are free from the influence of illumination, and the texture information in the skin images is enhanced. From the third column to the sixth column, the depth maps obtained from the state-of-the-art depth estimation methods, which are listed in the same order as in Figure 10, are shown and it can be clearly seen that the lighting has a negative influence on the depth estimation. In the results from the most recent algorithm proposed by [20], texture information is somewhat visible, but the part affected by lighting is distorted (Figure 11f). In addition, the results obtained from [18] show that lighting can have fatal effect on depth estimation, and the resulting depth information is not well represented (Figure 11d). Although blurred texture information remains in the results derived from the method based on EPI [26], there is a limitation in providing the overall depth information and it is not well expressed as seen in Figure 11e. In Figure 11c, the texture information is hardly visible and there seems to be a large limitation in providing 3D information. In contrast, the proposed method estimates the depth map with well-represented texture information against various illumination conditions (Figure 11g).

5. Discussion

Most of depth estimation algorithms proposed in the light-field to date have been focused on well-made synthetic data, or our everyday objects or real scenes. Subsequently, to be used for the medical purpose as a skin diagnostic tool, they had limitations that they could not express complex features such as skin texture well and might be affected easily by such a factor as illumination. To overcome such limitations, in this study, we suggested a method that was insensitive to illumination and at the same time, enhanced the texture based on a deep learning method, CGAN. This method led to a robust algorithm that reduced noise and preserved textures through the hole-filling method using enhanced guided image and the final cost volume. Thus, this study presented a new approach using a light-field camera, and subsequently intended to suggest a possibility of development in this direction as the first attempt.
In Table 1, it was quantitatively demonstrated that the proposed CGAN model did not damage the source image, which is shown by PSNR and SSIM, and at the same time, could generate images that were insensitive to illumination and reproduced skin textures faithfully as the source of 3D geometric surface, which is proven by MSE. Experiments conducted with images taken under various lighting conditions demonstrate that our proposed method shows improvements in PSNR by 31.71%, 29.59%, 46.87%, and, 45.85% (increase) and MSE by 69.61%, 62.19%, 68.13% and, 73.41% (decrease) over existing methods TT and CIDRE, Shen, and Zuiderveld respectively, and yielded highly stable and superior outcomes (SSIM avg. 0.83, std. dev. 0.03, PSNR avg. 22.29, std. dev. 1.39). As seen in Figure 9c, images obtained from TT are too dark and include errors (undesired white vertical lines) which results in inaccurate depth estimation. Images from CIDRE, Shen, and Zuiderveld show no improvement in removing or normalizing illumination, which causes in general severe geometric errors in disparity computation. This shows that learning via networks enables our method to improve the image quality of the skin texture highly adaptively to illumination compared to existing methods that do not involve. However, despite learning via networks, if illumination is too strong to identify wrinkles on the skin surface, original wrinkle structure cannot be reconstructed. Because this can be improved by learning of an algorithm that predicts disappearing wrinkles accurately based on residual skin wrinkles together on networks, it will be addressed in our ongoing further study.
In Figure 10, a qualitative comparison shows that our method can perform a better disparity estimation under natural illumination compared to state-of-the-art methods. It can be seen that the disparity map generated by our method in Figure 10g preserves the texture information well while the best map produced by existing methods in Figure 10f does not. Moreover, the fourth and sixth rows in Figure 10f show an error that the skin depth of the upper surface of a finger is expressed lower. An EPI-based depth estimation method also yields unsatisfactory outcomes as shown in Figure 10e. Figure 10d shows that [18] using a weighted median filter after disparity map estimation through global optimization cannot preserve skin textures well in the disparity maps. This shows that over smoothing has occurred in the process of the reduction of noise generated in computation of the depth map. This type of methods only relying on smoothing to reduce noise lead to errors in expression of the texture depth on the skin surface.
Figure 11 shows the results obtained from existing methods and our method under the conditions with illumination. Basically, illumination causes distortions in information that are applicable as various data costs such as pixels and gradients in the image. Therefore, as distorted information is reflected in computation of disparity using difference information between images, disparity map obtained from this is inaccurate, which may in turn cause problems when haptic palpation utilizing it is used for skin diagnosis. In Figure 11, the disparity map obtained from images (Figure 11a) under the influence of illumination shows a large distortion in Figure 11d,f. Representatively, the images in the first, second and third rows of Figure 11 show the influence of lighting visible in the low depth expression of the areas where the lighting is present in the results obtained in [18,20] (Figure 11d,f). These are typical problems observed in matching-based methods to estimate a sophisticated disparity map, and it can be seen that the influence is relatively small in EPI-based methods (Figure 11e). However, this latter method has a limitation in expressing the texture and shows very little overall depth information of the finger. In addition, it can be seen that in [20], which shows good outcomes for objects, abnormal results are observed in overall skin depth expression caused by disparity noise. Thus, it is essential to remove noise from the outcome of initial depth estimation and fill it with the correct depth information. Our method utilizes two cost volumes to reduce noise while preserving skin texture information accurately.
However, the problem of how precisely the skin depth can be expressed in the initial step is still very difficult to address, and the precise reconstruction of the depth without using simple smoothing in refinement step is another problem to be solved in the future. This study focused on how faithfully the skin texture information can be expressed in using a light-field camera for the medical purpose such as skin diagnosis, and how robustly a disparity map can be estimated for the lighting that can easily affect skin photography, and suggested a possibility of future development in a new direction.

Author Contributions

The first author Myeongseob Ko (M.K.) developed the depth estimation algorithms and lead the entire research and the second author (D.K.) implemented the method of illumination normalization based on CGAN for Lytro camera images. The corresponding authors (Mingi Kim (M.K.) and K.K.) guided the research direction and verified the research results. All authors made substantial contributions in the writing and revision of the paper.

Funding

This research was funded by Basic Science Research Program through the National Research Foundation of Korea (NRF) funded by the Ministry of Education (NRF-2018R1D1A1B07045125 and NRF-2018R1D1A1B07044863).

Conflicts of Interest

The authors declare no conflict of interest.

References

  1. Ring, J.; Eberlein-König, B.; Schäfer, T.; Huss-Marp, J.; Darsow, U.; Möhrenschlager, M.; Behrendt, H. Skin surface pH, stratum corneum hydration, trans-epidermal water loss and skin roughness related to atopic eczema and skin dryness in a population of primary school children: Clinical report. Acta Dermatol.-Venerol. 2000, 80, 188–191. [Google Scholar]
  2. Fadzil, M.A.; Prakasa, E.; Fitriyah, H.; Nugroho, H.; Affandi, A.M.; Hussein, S.H. Validation on 3D surface roughness algorithm for measuring roughness of psoriasis lesion. Biol. Biomed. Sci. 2010, 7, 205–2010. [Google Scholar]
  3. Lagarde, J.; Rouvrais, C.; Black, D. Topography and anisotropy of the skin surface with ageing. Skin Res. Technol. 2005, 11, 110–119. [Google Scholar] [CrossRef] [PubMed]
  4. Masaki, H. Role of antioxidants in the skin: Anti-aging effects. J. Dermatol. Sci. 2010, 58, 85–90. [Google Scholar] [CrossRef] [PubMed]
  5. Fujimura, T.; Haketa, K.; Hotta, M.; Kitahara, T. Global and systematic demonstration for the practical usage of a direct in vivo measurement system to evaluate wrinkles. Int. J. Cosmet. Sci. 2007, 29, 423–436. [Google Scholar] [CrossRef] [PubMed]
  6. Schrader, K.; Bielfeldt, S. Comparative studies of skin roughness measurements by image analysis and several in vivo skin testing methods. J. Soc. Cosmet. Chem. 1991, 42, 385–391. [Google Scholar]
  7. Levy, J.L.; Servant, J.J.; Jouve, E. Botulinum toxin A: A 9-month clinical and 3D in vivo profilometric crow’s feet wrinkle formation study. J. Cosmet. Laser Ther. 2004, 6, 16–20. [Google Scholar] [CrossRef] [PubMed]
  8. Kim, E.; Nam, G.W.; Kim, S.; Lee, H.; Moon, S.; Chang, I. Influence of polyol and oil concentration in cosmetic products on skin moisturization and skin surface roughness. Skin Res. Technol. 2007, 13, 417–424. [Google Scholar] [CrossRef] [PubMed]
  9. Kim, K. Roughness based perceptual analysis towards digital skin imaging system with haptic feedback. Skin Res. Technol. 2016, 22, 334–340. [Google Scholar] [CrossRef] [PubMed]
  10. Kim, K.; Lee, S. Perception-based 3D tactile rendering from a single image for human skin examinations by dynamic touch. Skin Res. Technol. 2015, 21, 164–174. [Google Scholar] [CrossRef] [PubMed]
  11. Lee, K.; Kim, M.; Lee, O.; Kim, K. Roughness preserving filter design to remove spatial noise from stereoscopic skin images for stable haptic rendering. Skin Res. Technol. 2017, 23, 407–415. [Google Scholar] [CrossRef] [PubMed]
  12. Kim, K. Image-based haptic roughness estimation and rendering for haptic palpation from in vivo skin image. Med. Biol. Eng. Comput. 2018, 56, 413–420. [Google Scholar] [CrossRef] [PubMed]
  13. Lee, K.; Kim, M.; Kim, K. 3D skin surface reconstruction from a single image by merging global curvature and local texture using the guided filtering for 3D haptic palpation. Skin Res. Technol. 2018, 24, 672–685. [Google Scholar] [CrossRef] [PubMed]
  14. Lee, O.; Lee, K.; Oh, C.; Kim, K.; Kim, M. Prototype tactile feedback system for examination by skin touch. Skin Res. Technol. 2014, 20, 307–314. [Google Scholar] [CrossRef] [PubMed]
  15. Kim, K. Haptic augmented skin surface generation toward telepalpation from a mobile skin image. Skin Res. Technol. 2018, 24, 203–212. [Google Scholar] [CrossRef] [PubMed]
  16. Lee, O.; Lee, G.; Oh, J.; Kim, M.; Oh, C. An optimized in vivo multiple-baseline stereo imaging system for skin wrinkles. Opt. Commun. 2010, 283, 4840–4845. [Google Scholar] [CrossRef]
  17. Tepole, A.B.; Gart, M.; Purnell, C.A.; Gosain, A.K.; Kuhl, E. Multi-view stereo analysis reveals anisotropy of prestrain, deformation, and growth in living skin. Biomech. Model. Mechanobiol. 2015, 14, 1007–1019. [Google Scholar] [CrossRef] [PubMed] [Green Version]
  18. Jeon, H.-G.; Park, J.; Choe, G.; Park, J.; Bok, Y.; Tai, Y.-W.; So Kweon, I. Accurate depth map estimation from a lenslet light field camera. In Proceedings of the IEEE Conference on Computer Vision and Pattern Recognition, Boston, MA, USA, 7–12 June 2015; pp. 1547–1555. [Google Scholar]
  19. Jeon, H.-G.; Park, J.; Choe, G.; Park, J.; Bok, Y.; Tai, Y.W.; Kweon, I.S. Depth from a Light Field Image with Learning-based Matching Costs. IEEE Trans. Pattern Anal. Mach. Intell. 2018. [Google Scholar] [CrossRef] [PubMed]
  20. Park, I.K.; Lee, K.M. Robust light field depth estimation using occlusion-noise aware data costs. IEEE Trans. Pattern Anal. Mach. Intell. 2018, 10, 2484–2497. [Google Scholar]
  21. Tao, M.W.; Hadap, S.; Malik, J.; Ramamoorthi, R. Depth from combining defocus and correspondence using light-field cameras. In Proceedings of the IEEE International Conference on Computer Vision, Sydney, Australia, 1–8 December 2013; pp. 673–680. [Google Scholar]
  22. Tao, M.W.; Srinivasan, P.P.; Hadap, S.; Rusinkiewicz, S.; Malik, J.; Ramamoorthi, R. Shape estimation from shading, defocus, and correspondence using light-field angular coherence. IEEE Trans. Pattern Anal. Mach. Intell. 2017, 39, 546–560. [Google Scholar] [CrossRef] [PubMed]
  23. Wang, T.-C.; Efros, A.A.; Ramamoorthi, R. Occlusion-aware depth estimation using light-field cameras. In Proceedings of the IEEE International Conference on Computer Vision, Santiago, Chile, 11–18 December 2015; pp. 3487–3495. [Google Scholar]
  24. Yu, Z.; Guo, X.; Lin, H.; Lumsdaine, A.; Yu, J. Line assisted light field triangulation and stereo matching. In Proceedings of the IEEE International Conference on Computer Vision, Sydney, Australia, 1–8 December 2013; pp. 2792–2799. [Google Scholar]
  25. Heber, S.; Pock, T. Shape from light field meets robust PCA. In Proceedings of the European Conference on Computer Vision, Zurich, Switzerland, 6–12 September 2014; pp. 751–767. [Google Scholar]
  26. Zhang, S.; Sheng, H.; Li, C.; Zhang, J.; Xiong, Z. Robust depth estimation for light field via spinning parallelogram operator. Comput. Vis. Image Underst. 2016, 145, 148–159. [Google Scholar] [CrossRef]
  27. Wanner, S.; Goldluecke, B. Globally consistent depth labeling of 4D light fields. In Proceedings of the 2012 IEEE Conference on Computer Vision and Pattern Recognition (CVPR), Providence, RI, USA, 16–21 June 2012; pp. 41–48. [Google Scholar]
  28. Wanner, S.; Straehle, C.; Goldluecke, B. Globally consistent multi-label assignment on the ray space of 4d light fields. In Proceedings of the IEEE Conference on Computer Vision and Pattern Recognition, Portland, OR, USA, 23–28 June 2013; pp. 1011–1018. [Google Scholar]
  29. Kim, C.; Zimmer, H.; Pritch, Y.; Sorkine-Hornung, A.; Gross, M.H. Scene reconstruction from high spatio-angular resolution light fields. ACM Trans. Graph. 2013, 32. [Google Scholar] [CrossRef]
  30. Tosic, I.; Berkner, K. Light field scale-depth space transform for dense depth estimation. In Proceedings of the IEEE Conference on Computer Vision and Pattern Recognition Workshops, Columbus, OH, USA, 23–28 June 2014; pp. 435–442. [Google Scholar]
  31. Heber, S.; Pock, T. Convolutional networks for shape from light field. In Proceedings of the IEEE Conference on Computer Vision and Pattern Recognition, Las Vegas, NV, USA, 26 June–1 July 2016; pp. 3746–3754. [Google Scholar]
  32. Heber, S.; Yu, W.; Pock, T. U-shaped Networks for Shape from Light Field. In Proceedings of the British Machine Vision Conference 2016, York, UK, 19–22 September 2016; p. 5. [Google Scholar]
  33. Goodfellow, I.; Pouget-Abadie, J.; Mirza, M.; Xu, B.; Warde-Farley, D.; Ozair, S.; Courville, A.; Bengio, Y. Generative adversarial nets. In Proceedings of the Advances in neural Information Processing Systems, Montreal, QC, Canada, 8–13 December 2014; pp. 2672–2680. [Google Scholar]
  34. Fu, X.; Zeng, D.; Huang, Y.; Zhang, X.-P.; Ding, X. A weighted variational model for simultaneous reflectance and illumination estimation. In Proceedings of the 2016 IEEE Conference on Computer Vision and Pattern Recognition, Las Vegas, NV, USA, 26 June–1 July 2016; pp. 2782–2790. [Google Scholar]
  35. Chen, W.; Er, M.J.; Wu, S. Illumination compensation and normalization for robust face recognition using discrete cosine transform in logarithm domain. IEEE Trans. Syst. Man Cybern. Part B 2006, 36, 458–466. [Google Scholar] [CrossRef]
  36. Tan, X.; Triggs, B. Enhanced local texture feature sets for face recognition under difficult lighting conditions. IEEE Trans. Image Process. 2010, 19, 1635–1650. [Google Scholar] [PubMed]
  37. Smith, K.; Li, Y.; Piccinini, F.; Csucs, G.; Balazs, C.; Bevilacqua, A.; Horvath, P. CIDRE: An illumination-correction method for optical microscopy. Nat. Methods 2015, 12, 404. [Google Scholar] [CrossRef] [PubMed] [Green Version]
  38. Kakadiaris, I.A.; Toderici, G.; Evangelopoulos, G.; Passalis, G.; Chu, D.; Zhao, X.; Shah, S.K.; Theoharis, T. 3D-2D face recognition with pose and illumination normalization. Comput. Vis. Image Underst. 2017, 154, 137–151. [Google Scholar] [CrossRef]
  39. Tu, X.; Gao, J.; Xie, M.; Qi, J.; Ma, Z. Illumination normalization based on correction of large-scale components for face recognition. Neurocomputing 2017, 266, 465–476. [Google Scholar] [CrossRef]
  40. Thomas, M.M.; Forbes, A.G. Deep Illumination: Approximating Dynamic Global Illumination with Generative Adversarial Network. arXiv, 2017; arXiv:1710.09834. [Google Scholar]
  41. Funke, I.; Bodenstedt, S.; Riediger, C.; Weitz, J.; Speidel, S. Generative adversarial networks for specular highlight removal in endoscopic images. In Proceedings of the Medical Imaging 2018: Image-Guided Procedures, Robotic Interventions, and Modeling, Houston, Texas, USA, 10–15 February 2018; p. 1057604. [Google Scholar]
  42. Memariani, A.; Kakadiaris, I.A. SoLiD: Segmentation of Clostridioides Difficile Cells in the Presence of Inhomogeneous Illumination Using a Deep Adversarial Network. In Proceedings of the 2018 International Workshop on Machine Learning in Medical Imaging, Granada, Spain, 16 September 2018; pp. 285–293. [Google Scholar]
  43. Isola, P.; Zhu, J.-Y.; Zhou, T.; Efros, A.A. Image-to-image translation with conditional adversarial networks. arXiv, 2017; arXiv:1611.07004. [Google Scholar]
  44. Mirza, M.; Osindero, S. Conditional generative adversarial nets. arXiv, 2014; arXiv:1411.1784. [Google Scholar]
  45. Land, E.H.; McCann, J.J. Lightness and retinex theory. Josa 1971, 61, 1–11. [Google Scholar] [CrossRef]
  46. Sabater, N.; Drazic, V.; Seifi, M.; Sandri, G.; Pérez, P. Light-Field Demultiplexing and Disparity Estimation. 2014. Available online: https://hal.archives-ouvertes.fr/hal-00925652 (accessed on 18 October 2018).
  47. Dansereau, D.G.; Pizarro, O.; Williams, S.B. Decoding, calibration and rectification for lenselet-based plenoptic cameras. In Proceedings of the IEEE Conference on Computer Vision and Pattern Recognition, Portland, OR, USA, 23–28 June 2013; pp. 1027–1034. [Google Scholar]
  48. Tang, H.; Kutulakos, K.N. What does an aberrated photo tell us about the lens and the scene? In Proceedings of the 2013 IEEE International Conference on Computational Photography (ICCP), Cambridge, MA, USA, 19–21 April 2013; pp. 1–10. [Google Scholar]
  49. Scharstein, D.; Szeliski, R. A taxonomy and evaluation of dense two-frame stereo correspondence algorithms. Int. J. Comput. Vis. 2002, 47, 7–42. [Google Scholar] [CrossRef]
  50. Rhemann, C.; Hosni, A.; Bleyer, M.; Rother, C.; Gelautz, M. Fast cost-volume filtering for visual correspondence and beyond. In Proceedings of the 2011 IEEE Conference on Computer Vision and Pattern Recognition (CVPR), Colorado Springs, CO, USA, 20–25 June 2011; pp. 3017–3024. [Google Scholar]
  51. Kolmogorov, V.; Zabih, R. Multi-camera scene reconstruction via graph cuts. In Proceedings of the 2002 European Conference on Computer Vision, Copenhagen, Denmark, 28–31 May 2002; pp. 82–96. [Google Scholar]
  52. He, K.; Sun, J.; Tang, X. Guided image filtering. In Proceedings of the 2010 European Conference on computer Vision, Crete, Greece, 5–11 September 2010; pp. 1–14. [Google Scholar]
  53. Bradley, D.; Roth, G. Adaptive thresholding using the integral image. J. Graph. Tools 2007, 12, 13–21. [Google Scholar] [CrossRef]
  54. Wanner, S.; Meister, S.; Goldluecke, B. Datasets and benchmarks for densely sampled 4d light fields. In Proceedings of the Vision, Modeling & Visualization, Lugano, Switzerland, 11 September–13 October 2013; pp. 225–226. [Google Scholar]
  55. Shen, C.-T.; Hwang, W.-L. Color image enhancement using retinex with robust envelope. In Proceedings of the 2009 16th IEEE International Conference on Image Processing (ICIP), Cairo, Egypt, 7–10 November 2009; pp. 3141–3144. [Google Scholar]
  56. Zuiderveld, K. Contrast limited adaptive histogram equalization. In Graphics Gems; Academic Press Professional, Inc.: San Diego, CA, USA, 1994; pp. 474–485. [Google Scholar]
  57. Wang, Z.; Bovik, A.C.; Sheikh, H.R.; Simoncelli, E.P. Image quality assessment: From error visibility to structural similarity. IEEE Trans. Image Process. 2004, 13, 600–612. [Google Scholar] [CrossRef] [PubMed]
Figure 1. Brief results of 3D skin surface reconstruction from the state-of-the-art depth estimation methods: (a) shows center view images taken with directional illumination; (b) represents the result from [23]; (c) presents the result from [18]; (d) shows the estimated depth image obtained from [20]; (e) is result from [26].
Electronics 07 00336 g001
Figure 2. Overall flowchart of our proposed method.
Electronics 07 00336 g002
Figure 3. The architecture of CGANs used for this study (see [43] for more details).
Electronics 07 00336 g003
Figure 4. The original images taken from a Lytro camera with directional illumination and corresponding output images obtained from CGAN model: (a,c) show the center images of Lytro camera images taken under directional illumination; (b,d) represent the output images obtained from our CGAN model.
Electronics 07 00336 g004
Figure 5. The decomposed images acquired by applying intrinsic decomposition method proposed by [35]: (a) shows original center images with directional illumination; (b,c) represent illumination image and reflectance image, respectively; (d) is the final refined results acquired by merging the output from CGAN model and the reflectance image.
Electronics 07 00336 g005
Figure 6. The overall process for obtaining multiple sub-aperture images from a Lytro camera: (a) is the original raw lenslet image; (b) shows micro-lens array structures; (c) simple process of recording light in each direction on an image sensor through micro-lens array; (d) represents pixel reordering process to generate a single view image from the image sensor; (e) is the obtained sub-aperture images.
Electronics 07 00336 g006
Figure 7. Results from the proposed hole-filling method: (a,c) show initial local disparity maps; (b,d) show refined local disparity maps obtained from hole-filling.
Electronics 07 00336 g007
Figure 8. Experimental setup: (a) setup of training image acquisition; (b) setup for capturing test images from a Lytro camera with various illumination conditions.
Electronics 07 00336 g008
Figure 9. The qualitative comparison results with existing methods: (a) original images captured from a Lytro camera under various illumination conditions; (b) reference images; (c) TT [36]; (d) CIDRE [37]; (e) Shen [55]; (f) Zuiderveld [56]; (g) proposed method.
Electronics 07 00336 g009
Figure 10. The qualitative comparison results with state-of-the-art depth estimation methods: (a) center view images taken under natural illumination; (b) the illumination-insensitive and texture-enhanced images obtained from proposed method; (c,d) shows estimated disparity maps from (c) Wang [23]; (d) Jeon [18]; (e) Zhang [26]; (f) Williem [20]; (g) our method.
Electronics 07 00336 g010
Figure 11. The qualitative comparison results with state-of-the-art depth estimation methods: (a) center view images taken with directional illumination; (b) the illumination-insensitive and texture-enhanced images obtained from proposed method; (c,d) shows estimated disparity maps from (c) Wang [23]; (d) Jeon [18]; (e) Zhang [26]; (f) Williem [20]; (g) our method.
Electronics 07 00336 g011
Table 1. Quantitative comparison results.
MetricsTT [36]CIDRE [37]Shen [55]Zuiderveld [56]Our method
SSIMPSNRMSESSIMPSNRMSESSIMPSNRMSESSIMPSNRMSESSIMPSNRMSE
10.7417.391184.70.8320.63562.50.8211.105052.10.8411.424690.10.8521.03512.4
20.7617.921049.50.7719.21780.50.8513.103183.60.8513.952616.50.8224.34239.2
30.7317.681108.80.7618.71875.70.8515.062030.00.8416.081605.10.8423.05321.8
40.7517.691106.40.7818.79859.90.8814.922095.70.8515.042035.20.8623.91265.1
50.7315.241943.90.7513.662800.80.8417.431173.80.8217.541146.70.7720.77544.3
60.7415.521824.80.7914.712198.00.8619.21779.50.8618.41937.90.8122.14397.4
70.7917.211237.20.8516.561435.30.9219.79682.80.9117.131259.10.8720.78543.2

