1. Introduction
Social robotics’ growing importance requires high performance perception functionalities, namely in scenarios where human–robot interaction (HRI) is relevant. For instance, having robots behaving according to (socially) correct proxemics requires them to perceive positioning information of the surroundings, i.e., detecting people and objects in their close proximity, but where the accuracy can be relaxed to some extent (see, for instance, [
1] for a definition of the relevant areas in proxemics).
Concepts such as “proximity” and “positioning” are thus highly relevant for HRI. Moreover, for the interaction between humans and robots to be effective, often only a reasonable accuracy is required in the definition of these concepts. No precise positioning is necessary for a robot to know how to behave in a social context, e.g., if multiple people are being detected in the close proximity of the robot, in general, it will not be necessary to know the exact position of each of those persons. Instead, a coarse positioning suffices to know that a group of people are there and the robot can decide according to the social norms enforced at the environment, approaching the group or using an avoidance strategy in which the group is seen as a single obstacle. Accurate positioning estimation of each of the persons in the group may not be an issue (the important thing is that the robot should know how to behave, which, in a sense, implies that it should be aware of its own perception and motion capabilities). However, if a robot is to greet a person that it recognizes, its movements must be adjusted in order to approach the person from a socially correct direction, e.g., from the front, using the quadrant that is most free, and carefully managing the velocity of approach.
Therefore, in an HRI context, the relevance of skills can be ordered as (1) detecting and (2) positioning. The problem addressed in the paper can thus be stated as estimating the position of a RFID tag, carried by a person, relative to the reader located onboard a robot, within an accuracy interesting for HRI purposes, that is, such that proxemics concepts can be used to control the behavior of the robot. Moreover, the use of RFID tags for HRI purposes has the advantage of (i) being a cheap technology, namely, if passive tags are used; (ii) if necessary, preserve the anonymity of the users, e.g., of people wearing a tag, that is, the information being detected is simply that of the tag and may not convey any true information about the physical person carrying the tag.
This paper discusses a novel RFID based localization strategy in a mobile robotics context, where people carry RFID passive tags and a robot carries a reader an an associated processing onboard. The goal is to have the system running in an hospital environment where people (staff and inpatients) may wear RFID tags. The RFID reader position inside the robot is constrained to the available volumetry. The experiments, however, show that this does not limit the approach. In what concerns the environment, no modifications are allowed whatsoever, meaning that the services must continue to operate normally. The system must be capable of providing information that can be fused with other systems, such as that from a network of cameras, and, still, in the case that this is not possible (e.g., due to sync problems and/or occlusions), it must provide useful information for HRI purposes.
Section 2 reviews the issue of localization using RFID technology and presents some comments on the use of the different techniques is social robotics settings.
Section 3 presents a model for the RFID reader used in the experiments and the algorithm used to estimate the location of people carrying a (passive) tag relative to the robot with the reader onboard.
Section 4 discusses the use of RFID based people detection in a hospital environment and the results on coarse angular localization relative to an autonomous robot wandering around in a hospital ward. Final remarks are presented in
Section 5.
2. RFID Related Work and Social Robotics Constraints
Often, the use of networked systems allow multiple sensors to be distributed throughout the environment, each extracting the adequate perception features, e.g., cameras for people detecting and tracking. State-of-the-art tracking systems such as the Vicon (Vicon Motion Systems Ltd., Oxford, UK) are accurate and fast enough to track multiple targets at 400 Hz. This, however, requires a carefully controlled environment and often social environments cannot comply with such constraints, i.e., having numerous cameras may be considered too invasive and may require extensive adaptations ( In addition, public environments such as hospitals are often subject to strict legal privacy regulations, which create difficulties in the use of vision sensing).
Low-cost vision tracking systems use low cost cameras and standard network infrastructures. State-of-the-art tracking algorithms for such systems have dynamics too slow to be compatible with natural human–robot interaction and hence tend to work best as a complement to other systems.
There is an extensive work on RFID based localization systems, including active, semi-active, and passive tags and using single and multiple readers. Reviews of key techniques are presented in [
2,
3,
4,
5,
6]. Most of the techniques reviewed include using RSSI (Radio Signal Strength Indicator) information, simplified RF propagation models, trilateration techniques, regular reference tag grids, time-of-flight and phase difference techniques, Bayesian inference, machine learning, and k-nearest neighbors techniques. In fact, RSSI is relatively simple to transform into a distance using a RF transmission model (e.g., the Friis equation) and hence RSSI and trilateration techniques have strong relations (see, for example [
7]). RSSI has been used in low density tag distribution scenarios to yield localization errors around 1 m, [
2]. Trilateration techniques using passive tags, multiple antennas, and readcounting (the tag detections) are reported in [
5] as being capable of an accuracy in the order of 0.24 m. K-nearest neighbors are used in [
4] and [
8] to compare tracking tags with a regular grid of reference tags to obtain a mean positioning errors of 0.41 m and 0.04 m, respectively.
Tag grids vary between 5 cm and 5 m and the velocities used in examples with mobile robots, around 0.3 m/s, are seldom compatible to those of a social robot (see the informative table in [
6]). The accuracies reported vary between 0.026 m and 1.5 m.
RFID detection can be used solo or as a complementary system to other localization techniques. Tag detection to resynchronize Inertial Measurement Units (IMU) based information is used in [
9]—The fusion of RFID active tag RSSI with data from an InfraRed based localization system is used in [
10] as a strategy to handle environment uncertainties. The active tags are placed in known positions in the environment, as a regular grid (1 m side), transmitting RSSI data every 10 s. Accuracy is reported to be 1.5m. Fingerprinting, i.e., recognition of tag detection patterns, has been reported to yield errors in the order of tens of centimeters for a tag density of 3.8 tag/m
, [
11].
One or more moving readers can then be easily detected if the positions of the passive tags are known a priori. Arrays of readers can be used to provide information on the direction of the tag [
12]. Using the phase difference technique between two readers, Ref. [
13] report a millimeter accuracy in ideal conditions. Multiple readers and RSSI with varying the power level of the reader(s) and knowing the sensitivity of specific tags to such variations are used [
14]. An accuracy of 0.15 m is reported, with a time delay of a few seconds.
Localization often assumes that the tag detection areas are of circular shape (see, for instance, [
15,
16]) and tags are distributed according to regular patterns (see [
17]). Simulation results are claimed to yield a localization error as low as 3 cm for a mobile robot moving up to 2 m/s and a high enough tag density.
If the tags are active, then by placing the tags in a carefully selected distribution, accounting for RF interferences, it is possible to use the RSS indicator generated by each tag to select the most probable regions [
12].
Scanning delays and the tag density are often referred to as the most important factors generating errors [
17]. By carefully controlling the reading strategy, the effect of the scanning delay can be minimized. Multipath propagation and interference have also been referred to as key factors for inducing disturbances [
2].
In non-lab social robotics settings, the use of multiple readers tends to be avoided as (i) it often requires significant adaptations in the premises; and/or (ii) constrains the outer shape of the robots, which is highly relevant for social acceptance. Furthermore, high tag densities may require unacceptable changes in the premises and hence grid techniques are often not practical in non-lab environments. Moreover, some of the delays reported are also incompatible with social robotics applications. Active tags tend to be bulky and hence difficult to use in social robotics applications, namely in scenarios with children.
Despite the variety in environments and algorithms considered, the disparity in the positioning errors reported reflects the difficulties in using RFID for localization.
In what concerns the RFID technology, the HRI requirements in the social robotics application in this paper can be summarized as recognition that a person carrying a tag, moving at medium/low speeds (roughly, well below 1.5 m/s, the normal walking speed of an adult), without being concerned with the pose of the tag (which often will be attached to clothes), is in the neighborhood of the reader.
3. The RFID Equipment and Reader Model
The RFID reader used in this work is a commercial Synco (Syncotek, Shenzhen Synco Technology 116 Co., Ltd., Shenzhen, China), model SR-RU-1861S, operating in the UHF MHz band. The antenna is described by the manufacturer as having an effective range of about 3 m, using a 8 dBi antenna (manufacturer’s data). This means that, ideally, a tag placed anywhere inside the hemisphere of radius 3 m, covered by the antenna, would be detected with probability 1. The reader uses a serial RS232 connection to a laptop running software implementing the reading strategy and a simple Application Interface (API) implemented in Python. The whole software is wrapped as an ROS (Robot Operating System) node so that it can be accessed by anyone registered with the ROS master. The reader only supplies the identification of the tags detected. No RSSI is available.
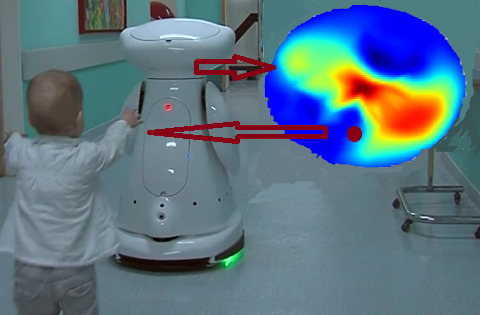
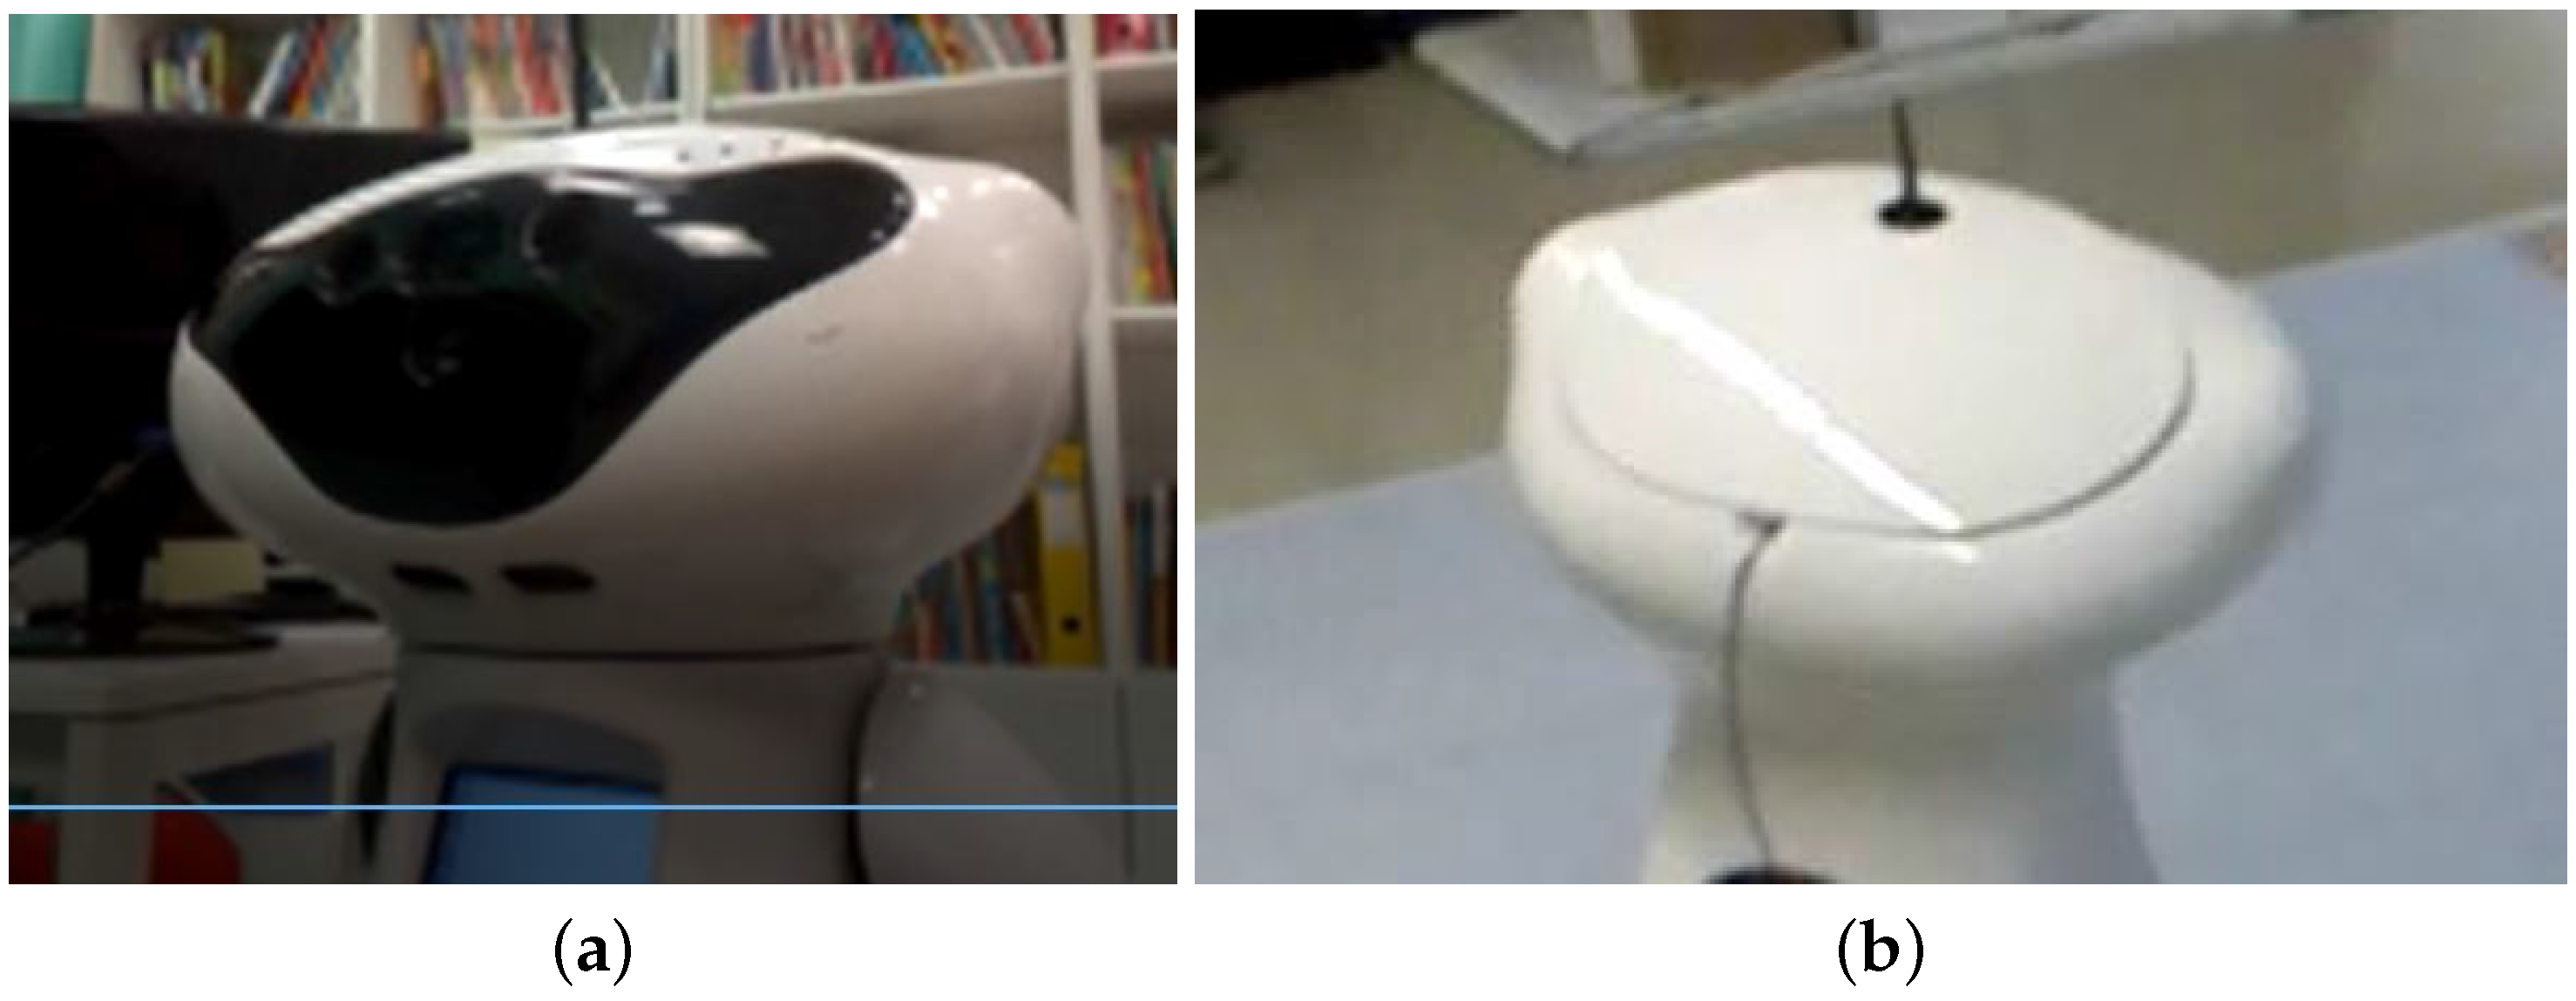
The reader is installed onboard a MOnarCH robot inside the head (see
Figure 1). Due to space constraints inside the head, the antenna is slightly tilted around the lateral axis of the robot.
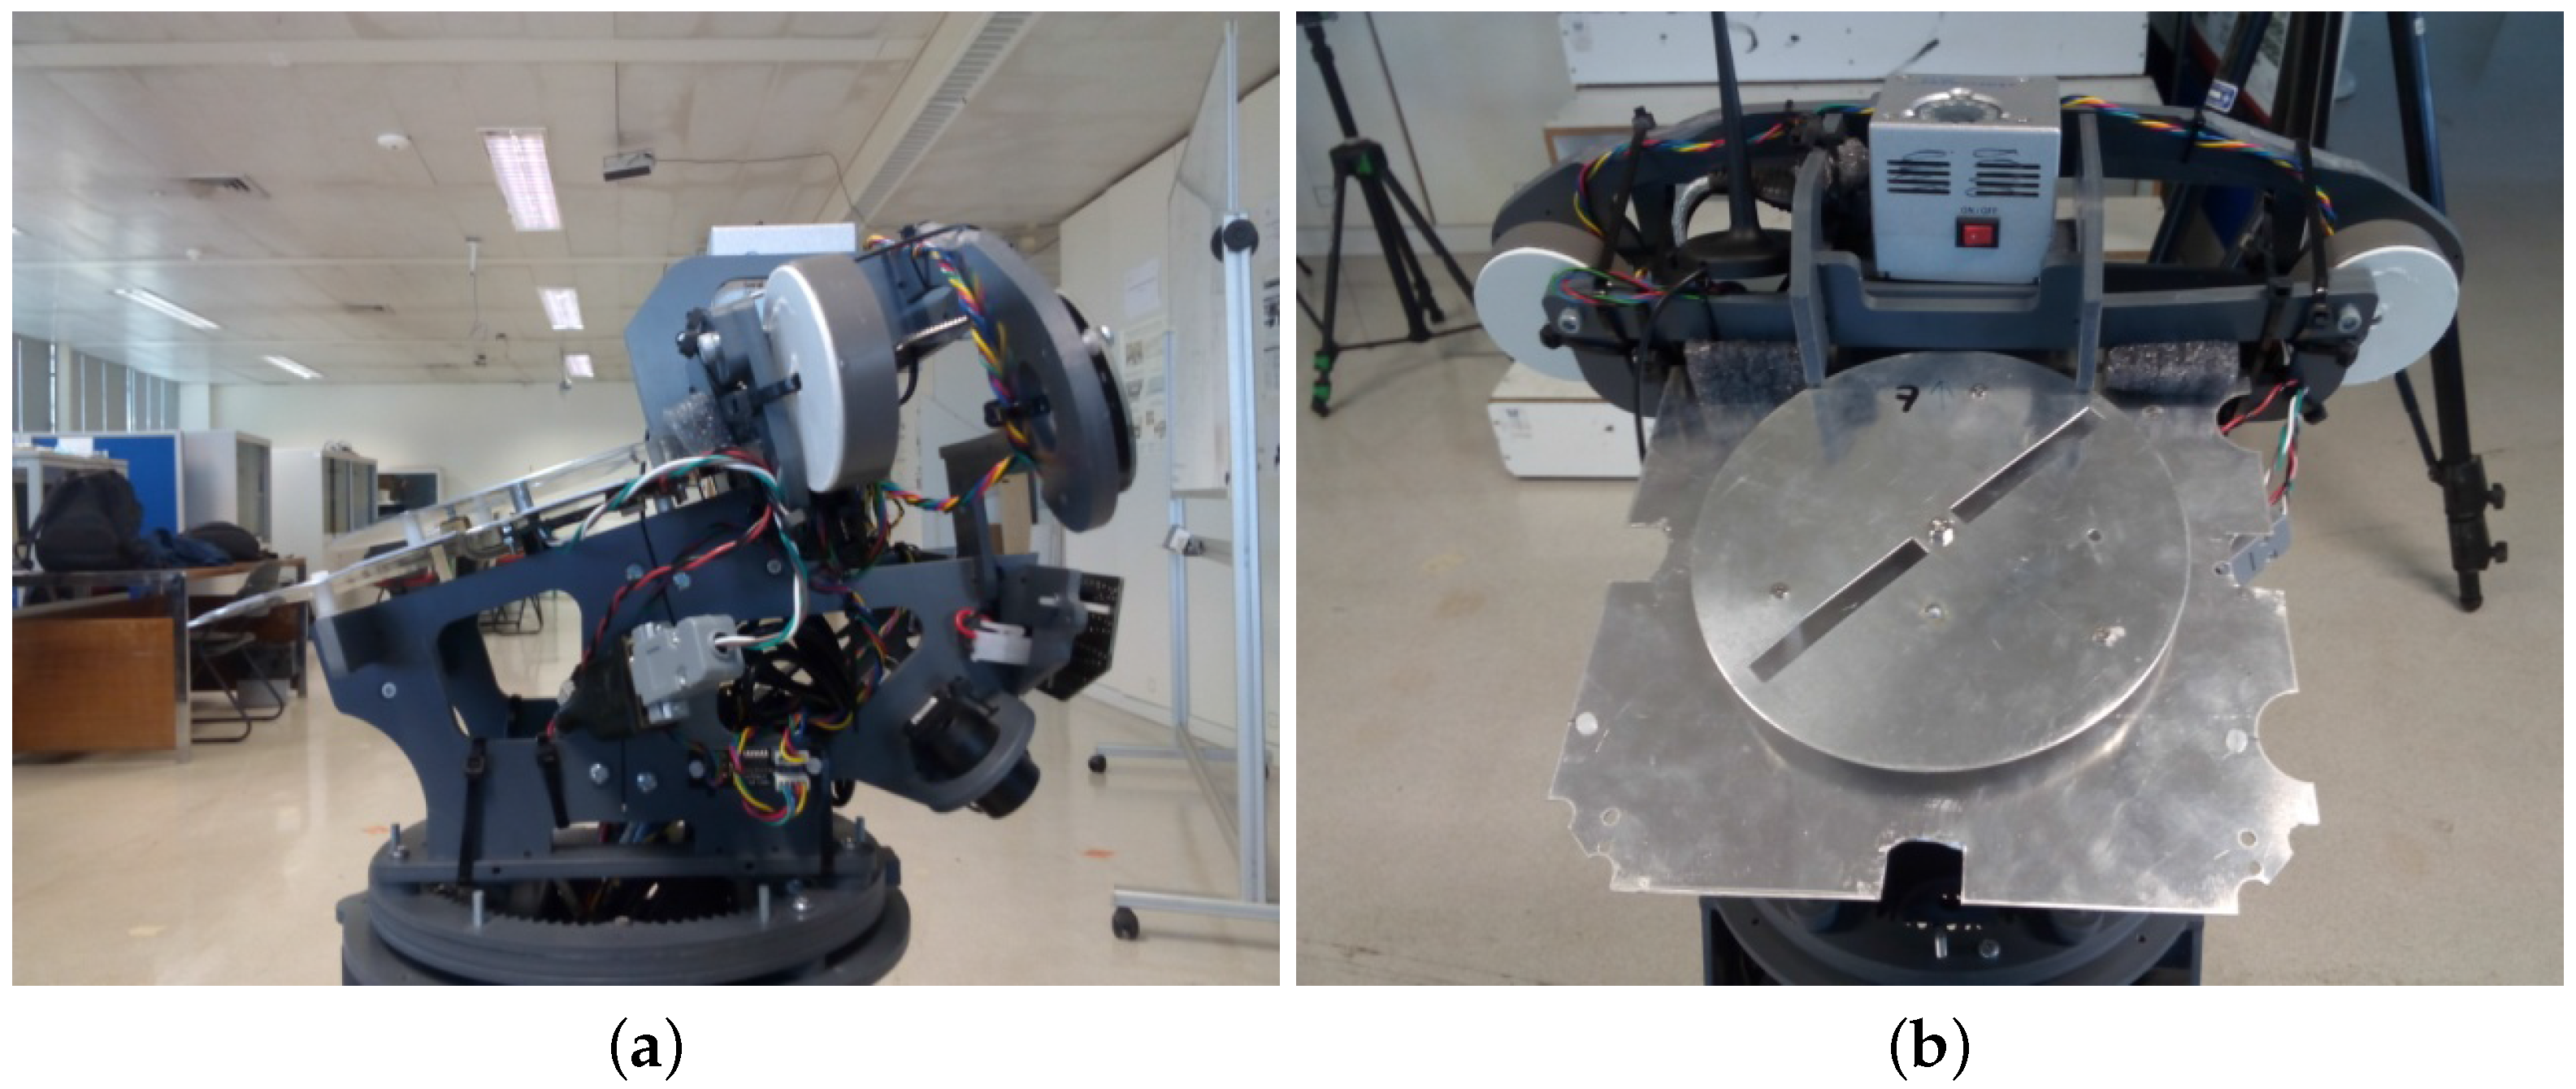
Figure 2 shows two views of the head with the RFID reader hidden in the interior.
The robot frame is built in plastic with a few metallic connections. The outer shell is made of fiber glass, around 5 mm thick, and does not embed any metallic elements.
Simple experiments readily show that, often in indoors environments, the propagation conditions are such that the half-sphere detection volume can change widely. This can happen for a variety of reasons, namely multipath, absorption, reflection, and diffraction (see [
3]), and often cannot be controlled, that is, the environment can not be modified to minimize such disturbances. For example, for the SYNCO reader in this work, empirical observations have shown that, in a typical indoor lab corridor, the detection volume can enclose the full corridor section and be about 6–8 m long. In a sense, given a generic environment, it is very difficult to predict the shape of the detection volume. Often, the spherical (or half-spherical) volume assumption will not be realistic.
Additional testing also determined that a tag can be in a close neighborhood of the reader without being detected, and this happens especially if there is no relative motion between the tag and the reader. In addition, if their relative velocity is too high, detection is likely not to happen.
The aforementioned (uncontrolled) factors suggest that the reader can be modeled using a probabilistic-like technique by which to each point in a neighborhood of the reader is assigned a probability of a tag being detected in case it is located at that point. This probability is estimated simply as the percentage of true positive detections. Clearly, this estimate will depend heavily on the environment conditions.
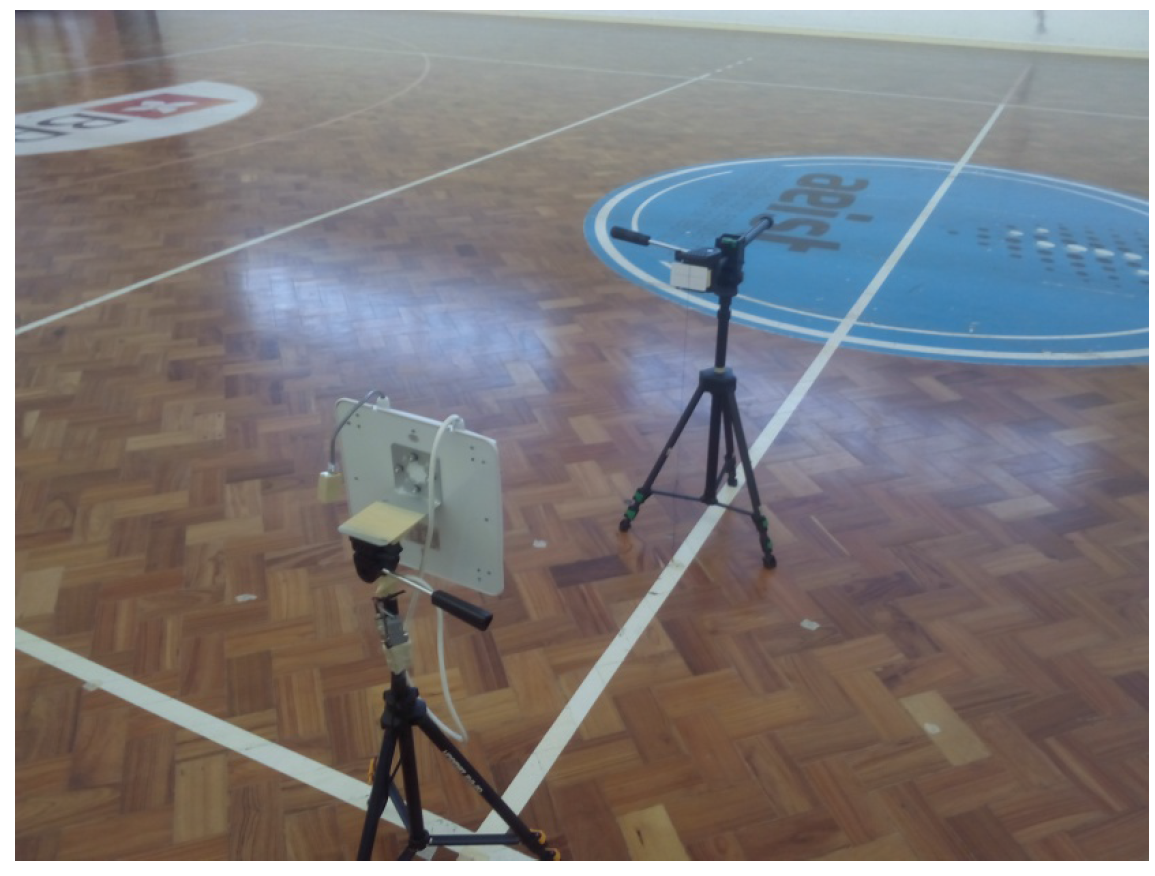
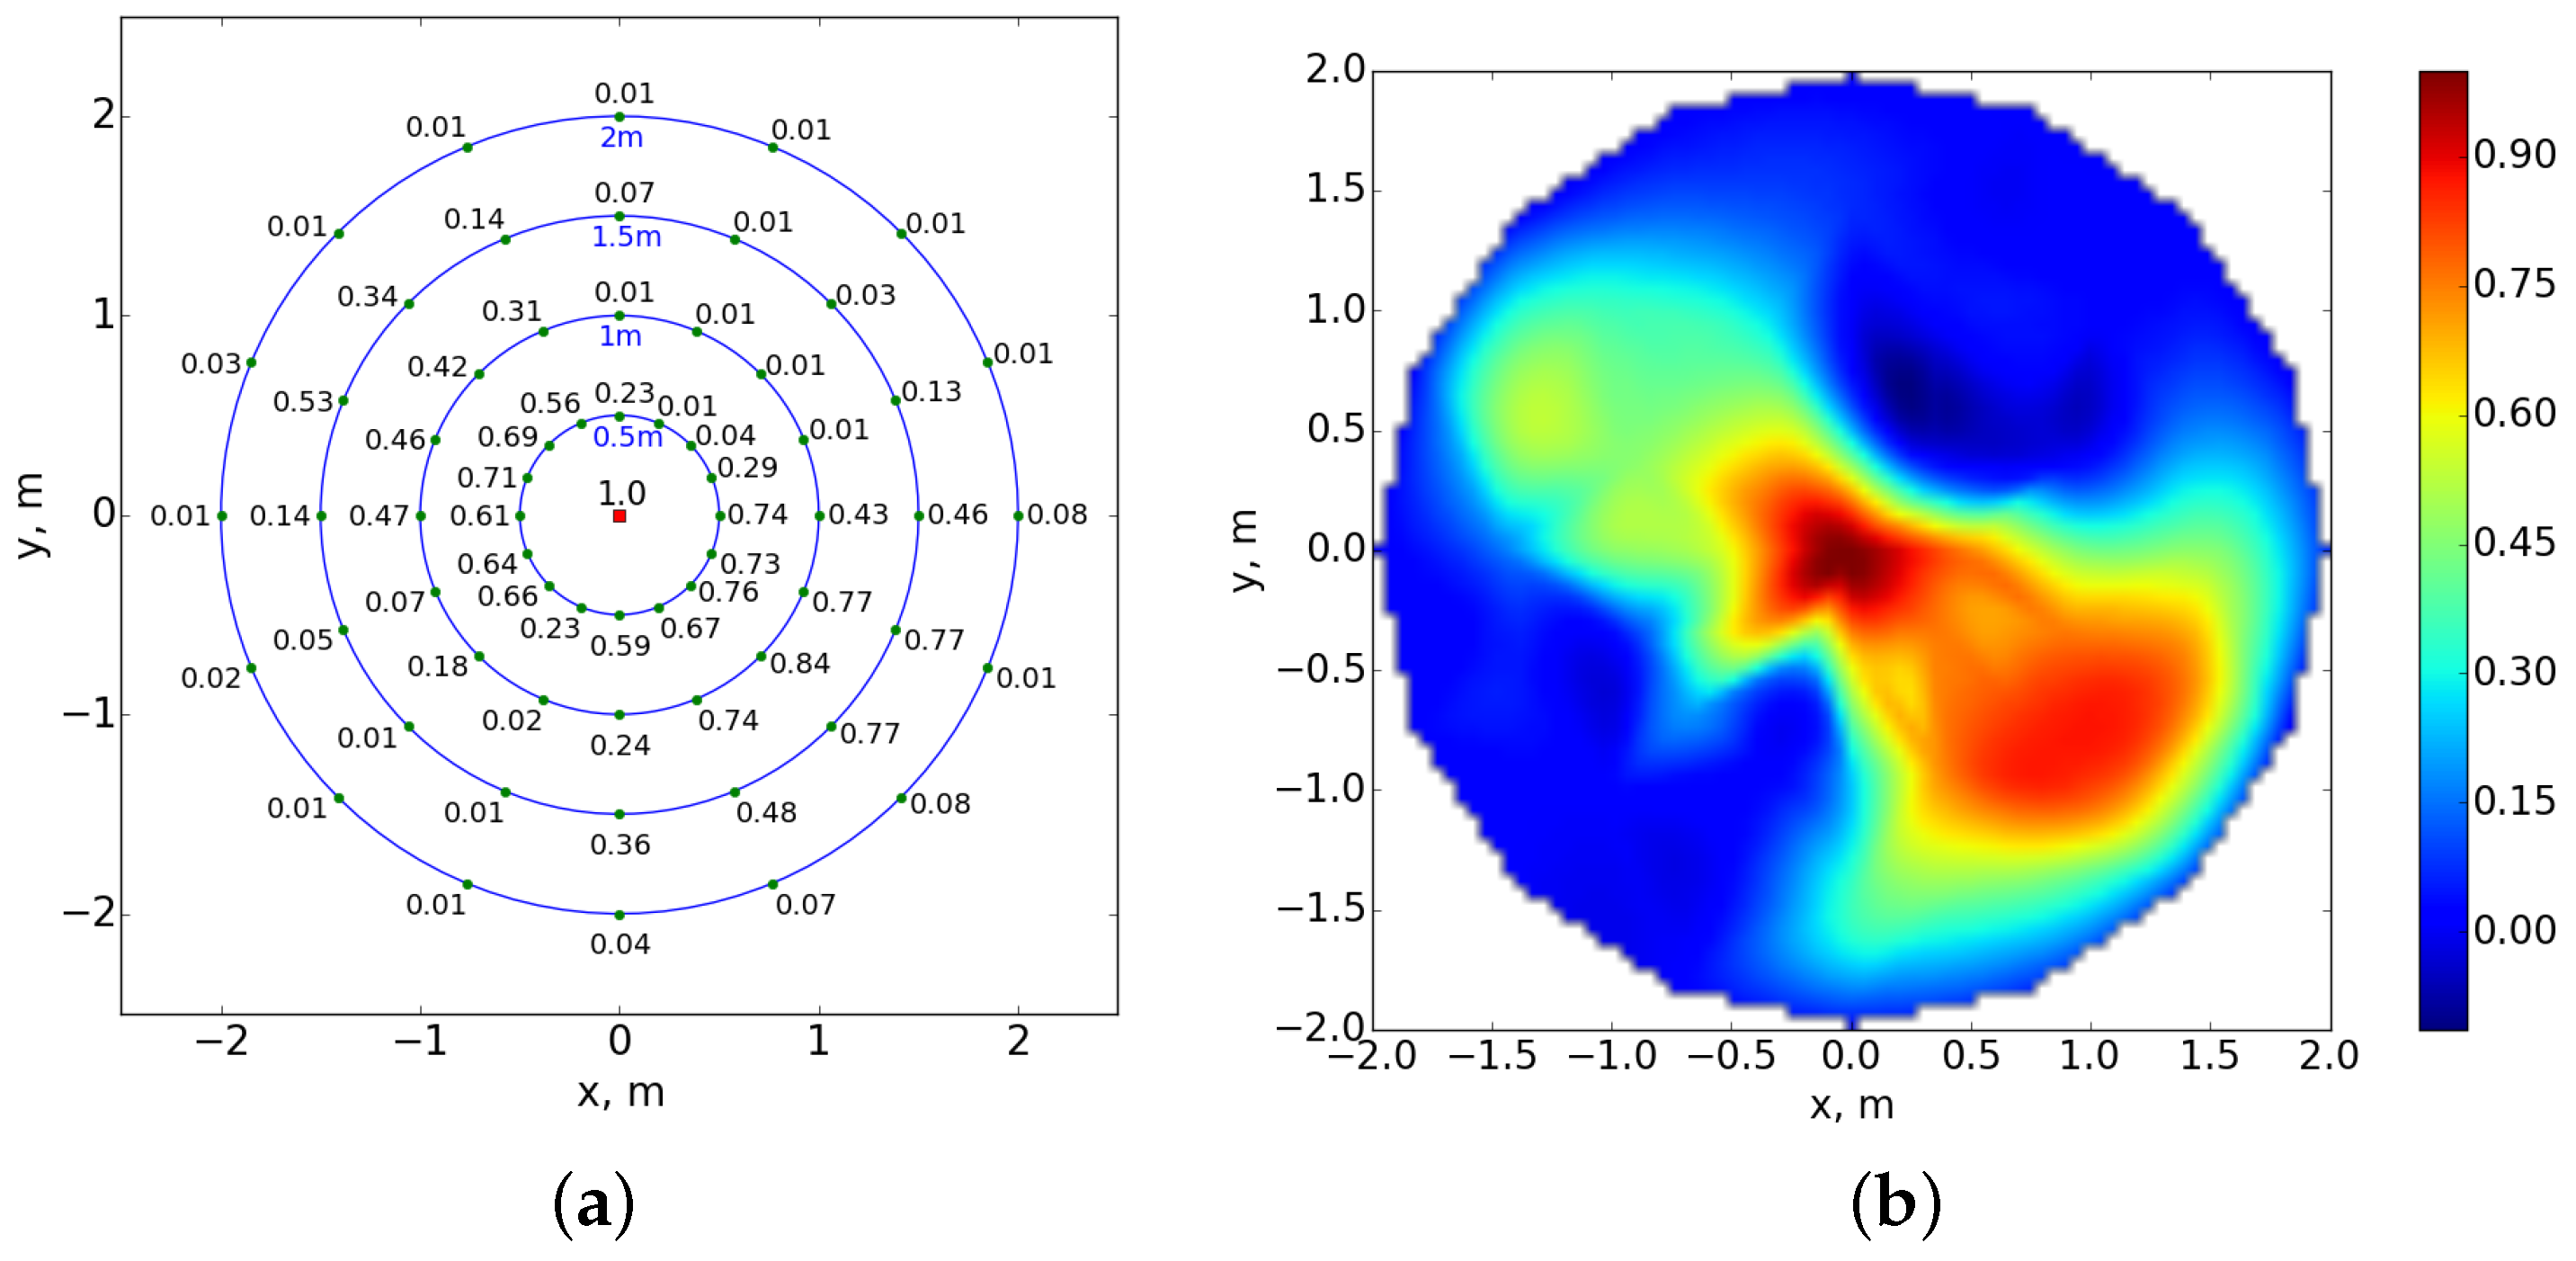
The model of the reader was obtained in an open indoors environment (see
Figure 3) with a large hemispherical free volume centered at the antenna.
Figure 4 shows the model of the reader obtained in this environment. The reader and tag can be seen, duly aligned (the setting is vaguely similar to that used by [
5], though there the tags were randomly disposed in the environment). This setup corresponds to removing all the potential sources of electronic interference onboard the robot from the neighborhood of the reader.
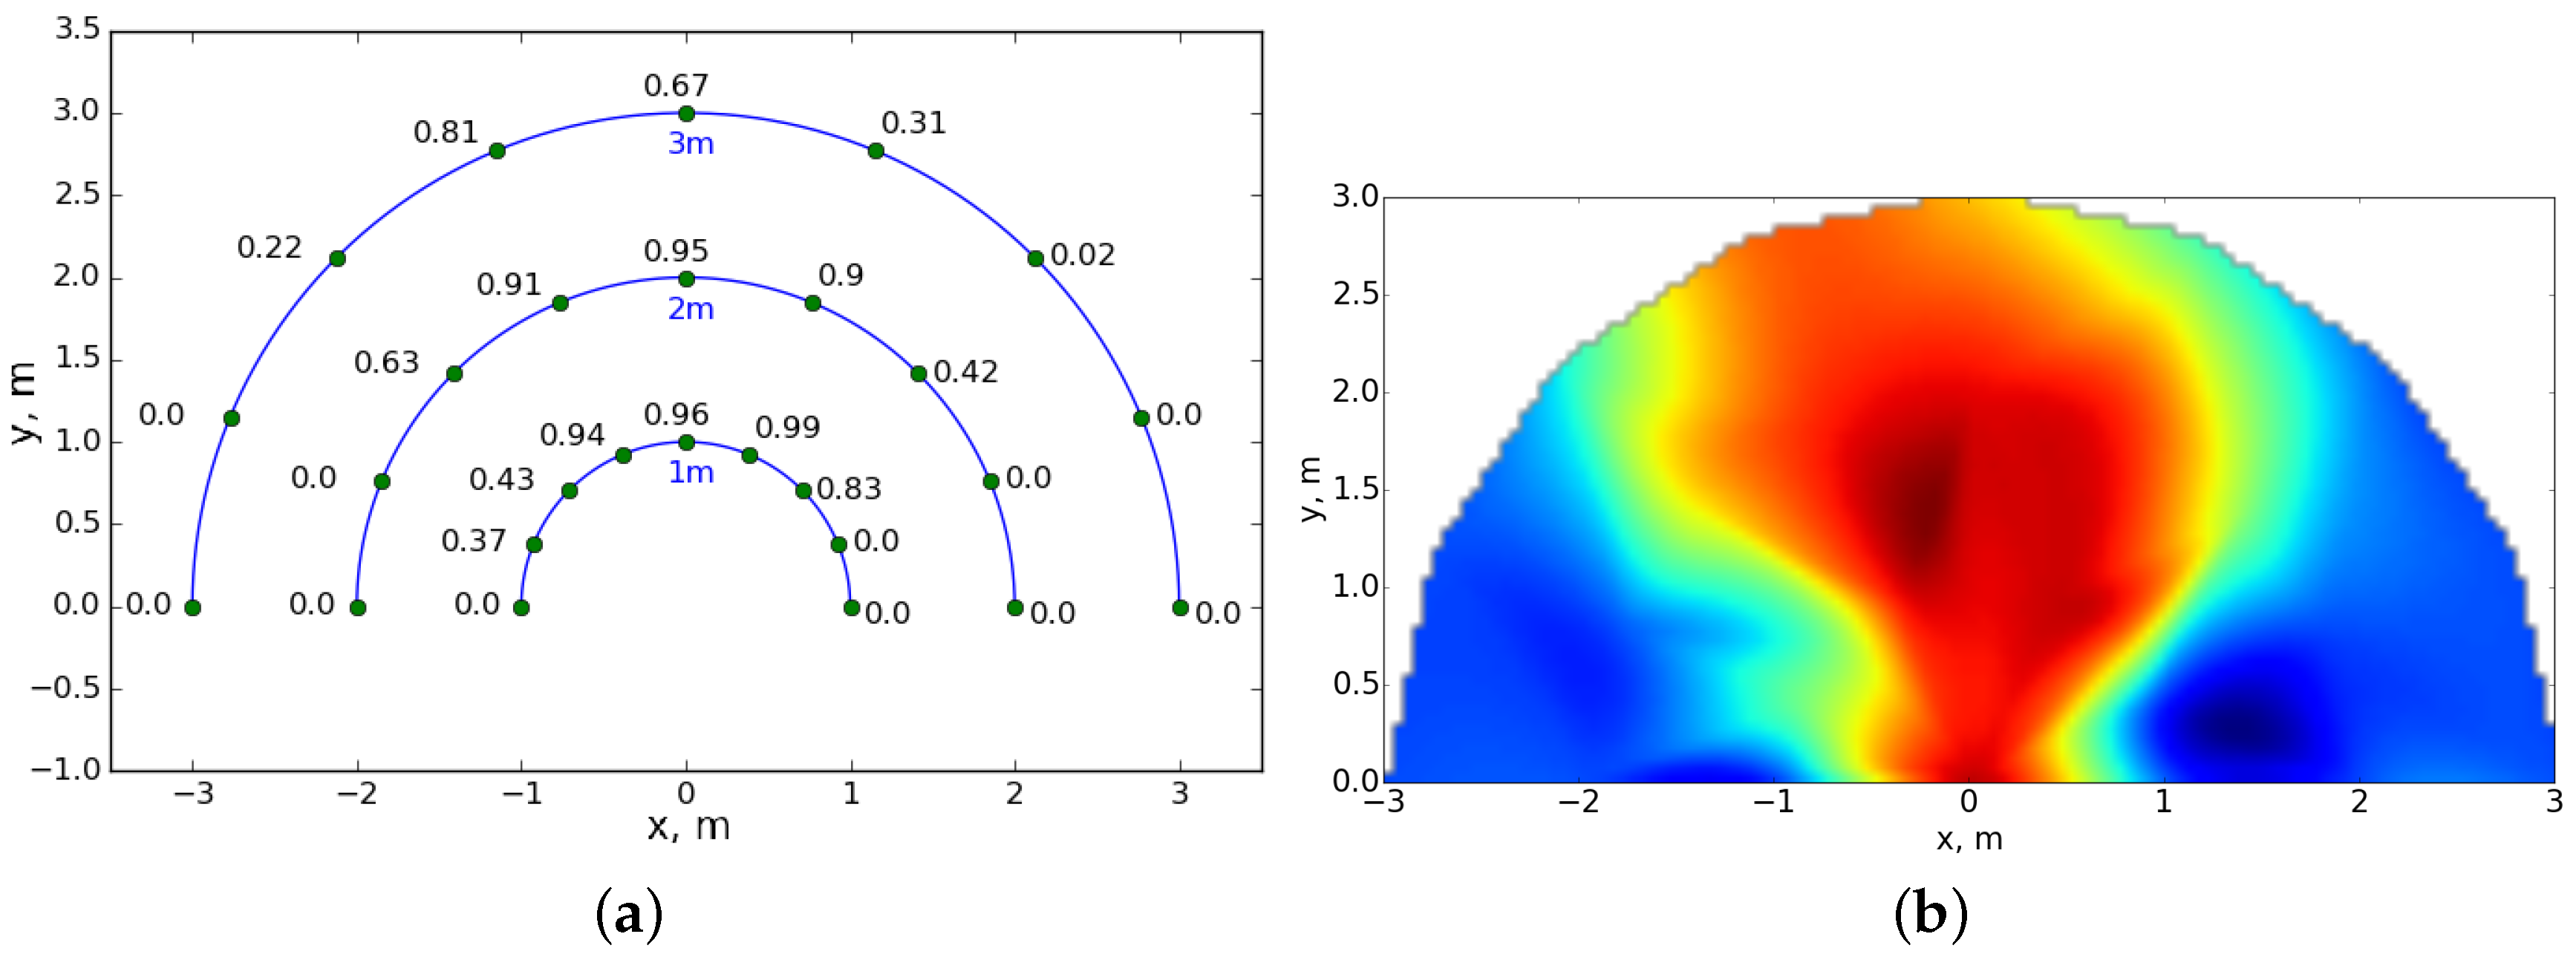
A detection model is constructed by sampling an estimate for the probability of detection at a set of points and interpolating a probability surface from that data.
The measurements were obtained along three circumferences of radius 1, 2, and 3 m, with nine measurements each at regular angular intervals. Furthermore, all measurements were obtained with the reader at the same height, similar to the reader onboard the robot.
The interpolated surface from the measurements is shown in
Figure 4b. The probabilities were estimated from
measurements (a value comparable to other experiments in the literature, e.g., [
5]). The surface is a 2D surface obtained from the raw readings through cubic interpolation (Python function scipy.interpolate.griddata was used to compute the cubic surface).
The surface shows a central lobe, slightly deviated to the left, corresponding to the high detection probabilities. Negative y corresponds to the back of the reader, and, hence, it is clear that the detection volume is larger than the hemisphere in the manufacturer’s data. The tilting of the reader can also have some influence in the detection surface, as there is a correlation between the back of the reader and the region of highest probability detection. This anisotropic detection pattern is thus the key feature of the reader that supports this work.
An algorithm to estimate the position of a tag relative to the reader can be outlined as follows.
Given a set of tag detections, obtained with the relative position between reader and tag not changing significantly, an estimate for the detection probability can be computed.
Compute the solution
of an equation of the form
where
is the interpolated surface and
is the estimated probability value (see Algorithm 1 ahead).
In general, will be a set (a level set of the surface) formed by the union of multiple disjoint sets.
Use a likelihood metric to select the best, in some sense, point among those in the set above (see Algorithm 2 ahead).
The rationale behind this strategy is that each point of the antenna pattern can be identified to a detection probability. By sampling, through readcounting detections, a set of points around the antenna, a collection of probabilities is obtained and a surface can be interpolated from them.
The inverse problem, i.e., obtaining the position of the points around the antenna that correspond to a given probability corresponds to the tag localization problem.
| Algorithm 1 Tag detection probability estimation. |
Require: ,
;
if tag detected then
for to do
re-read the tag;
if is detected then
;
end if
wait for s;
end for
publish
return probability updated
else
return probability not updated
end if |
This method may have some similarities with the trilateration methods in [
5], namely in that readcounting and surface interpolation are used in both. However, in this work, only one reader is used.
| Algorithm 2 Tag position estimation. |
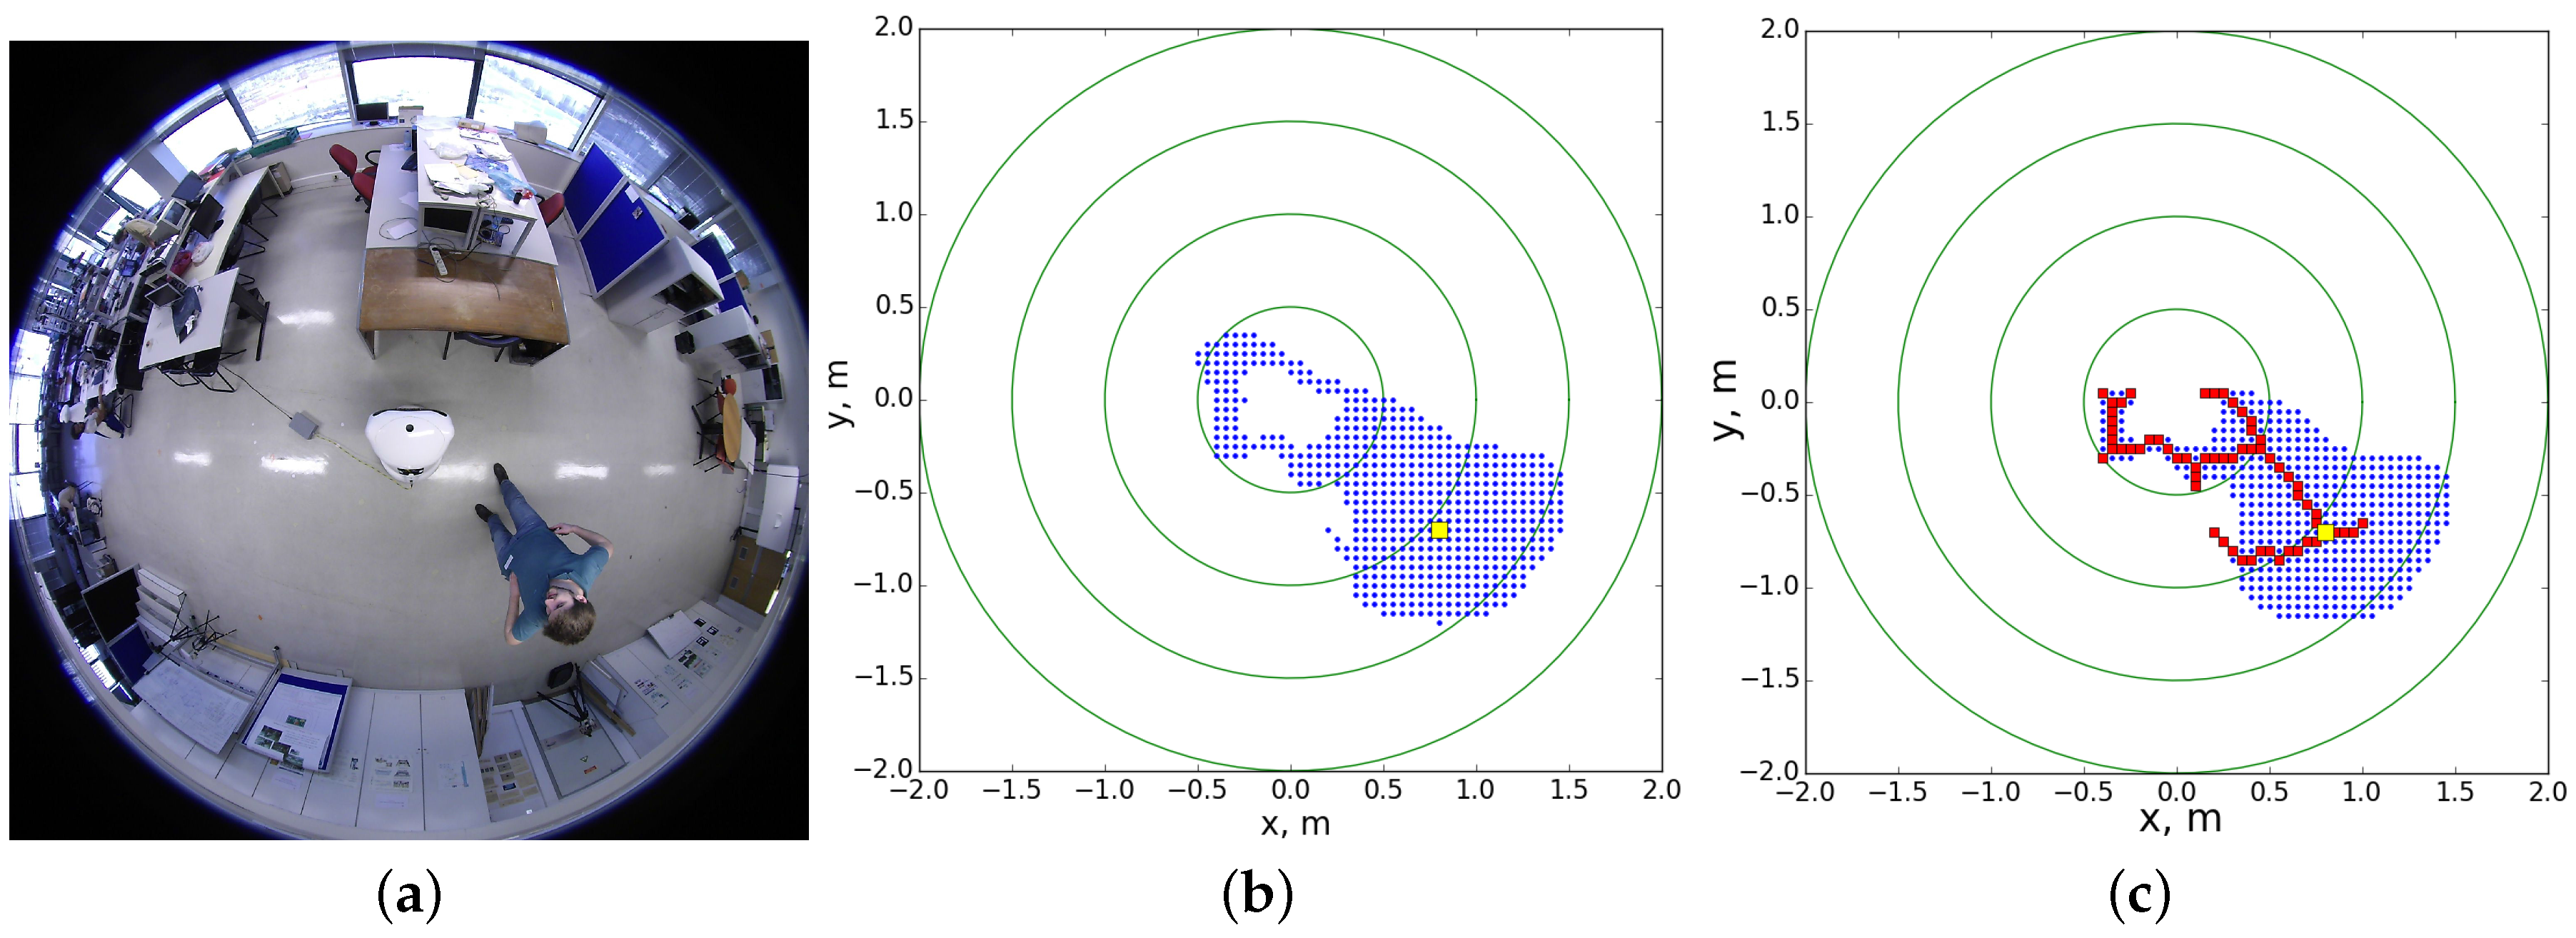
Require: Reader Model, Compute the area, according to the model, with Compute the medial skeleton of that area (see Figure 5c) Compute the point(s) in the skeleton with the biggest distance to the boundary of the area (this point, or one of these points, is the position estimate)
|
The rationale behind Algorithm 2 is that large area regions of the level set
implicitly account for uncertainty in
.
Figure 5 shows an example when a margin
is used as estimate of the uncertainty in
. For a time between readings of
, the total time between a tag position estimate is 5 s. In what concerns HRI, this can be considered as the maximum acceptable, though clearly insufficient for HRI with fast dynamics.
Given the aforementioned factors affecting the operation of a RFID system, it can be expected that the model in
Figure 4 changes when the environment has a dynamic of a typical, non-lab, social environment, where, for example, a tag can change height in time depending on the height of the person carrying it. Detection conditions may vary and hence also the interpolated surface. In this paper, the model will be assumed fixed. Learning techniques can be used (future work) in order to adjust the model.
Placing the RFID reader inside the robot may reduce its capabilities due to shielding and/or interference. The fiber glass of the outer shell does not contain any metallic component, but the touch sensors rely on a capacitive principle, and this means that large metallic areas are placed directly under the shell and this influences behavior of the antenna.
Figure 6 illustrates the interpolated surface, corresponding to a series of estimated probabilities at specific points in the neighborhood of the reader, now placed inside the robot. The tags were kept always at the same height relative to the reader (with random orientation), as in the experiment in
Figure 4.
Note that the models in
Figure 4 and
Figure 6 were obtained under different orientations for the reader antenna, vertical in the first case and almost horizontal in the second. Still, the shape of the interpolated surface does not change significantly.
4. Experiments
This section presents two types of experiments aiming at assessing the tag localization algorithm. The rationale behind this strategy is that different environments tend to induce specific disturbances, e.g., multipath, [
2], and hence a model obtained under controlled conditions only provides baseline information. The experiments thus consider both a controlled environment and the real hospital environment.
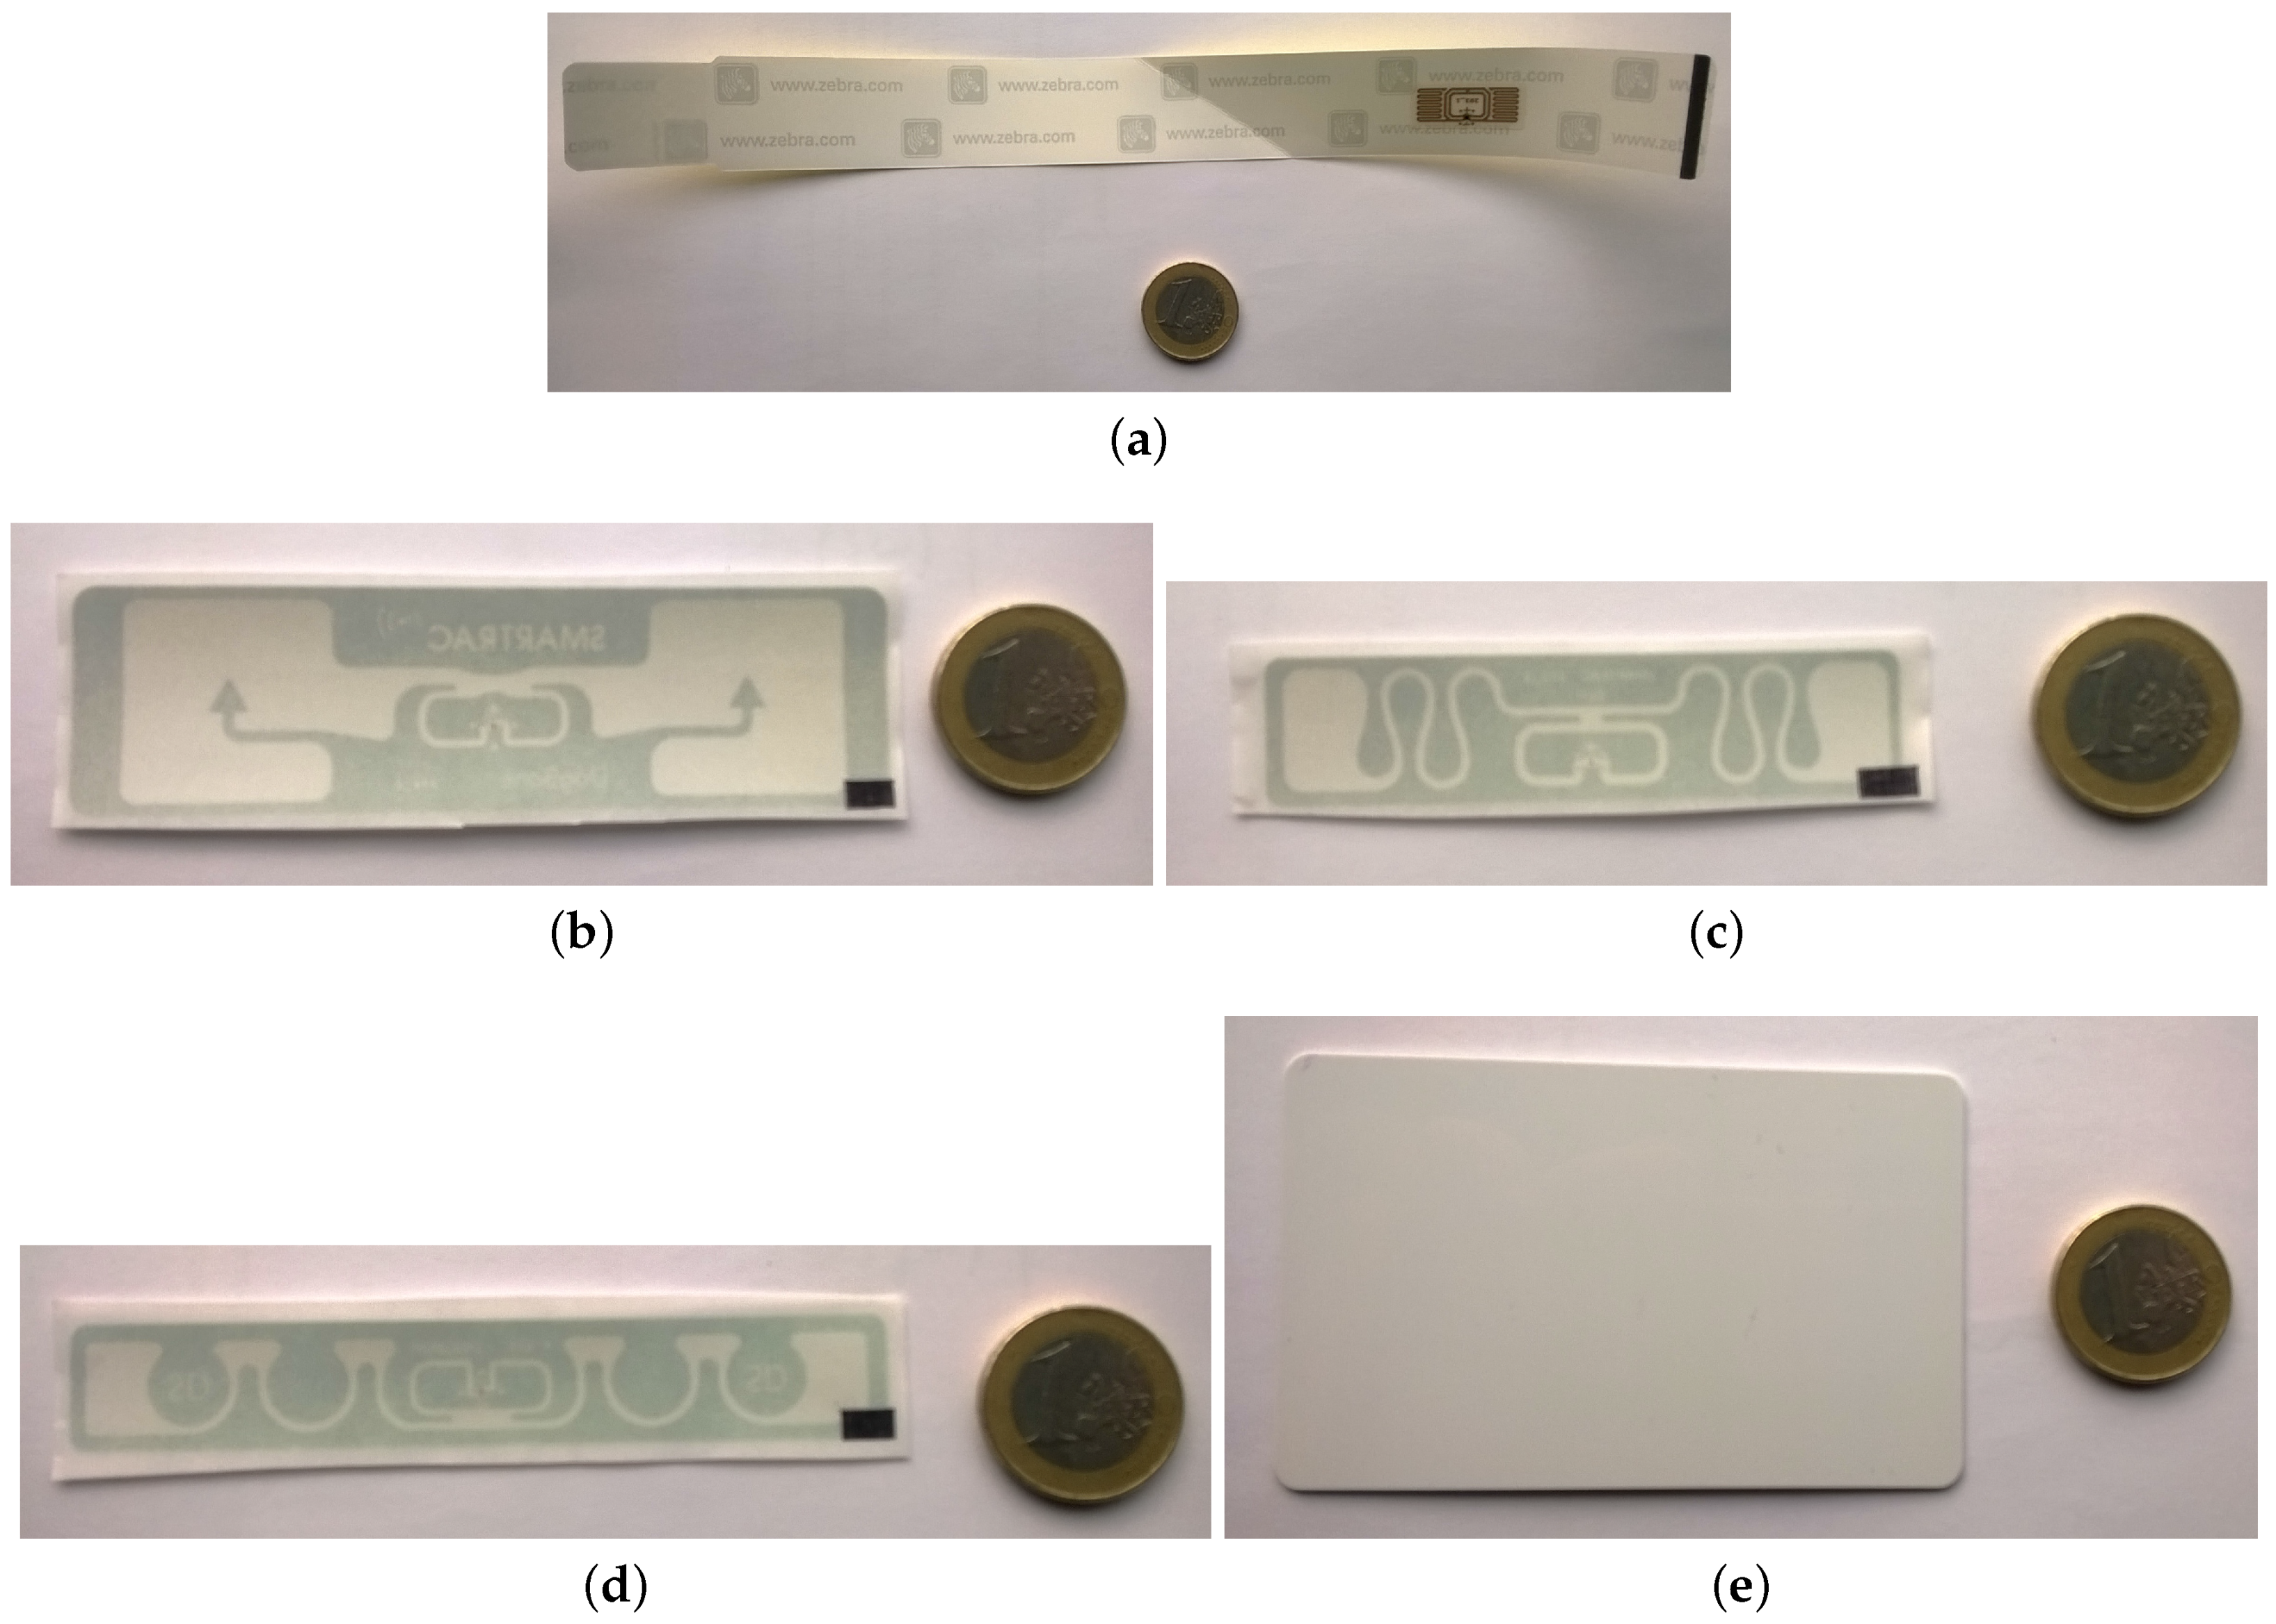
The tag in
Figure 7a is used as a wristband. The ones in
Figure 7b–d are flexible tags that can stick to virtually any surface. The tag in
Figure 7e is rigid and has a size of a bank/credit card. Tag type (a) is from Zebra Electronics (Lincolnshire, IL, USA) based on the SMARTRAC Technology tag TRAP. Tag types (b)–(d) are from SMARTRAC Technology (Amsterdam, The Netherlands), models DogBone_M4, Belt_M5, and ShortDipole_M4, respectively. Tag type (e) is from Synco.
Table 1 shows the typical ranges for the tags considered. These are limit values extrapolated from graphics in the tag datasheets.
In all experiments, two types of passive tags were used, namely the Synco, and the ShortDipole_M4. No relevant differences where found in random trials using the and Belt_M5 and DogBone_M4. In random trials, the TRAP tag resulted in a great degradation of performance and hence was not considered in this work.
In all experiments, the orientation of the tag was not accounted for. The primary reason being that this is the situation that better matches a normal experiment in social robotics in a real environment.
4.1. Raw Detection Experiments
The experiments in this section were performed in a hospital Pediatrics ward during periods of normal activity. For two years, the observations at the hospital already established that RF propagation conditions are not stable in the ward. The amount of people and objects in the areas the robot is moving can modify multipath and interference conditions significantly, e.g., reducing or enlarging the detection volume around the reader significantly. In a real environment like this, experiments can not be scheduled. Even simple testing, e.g., engaging people to carry tags while moving around the robot, may bias the perception on people towards the robot. Therefore, assessing accuracy in the localization is better estimated in a controlled environment, whereas experiments in the hospital environment define the baseline detection conditions, e.g., how the relative motion between robot and the RFID tag affects detection.
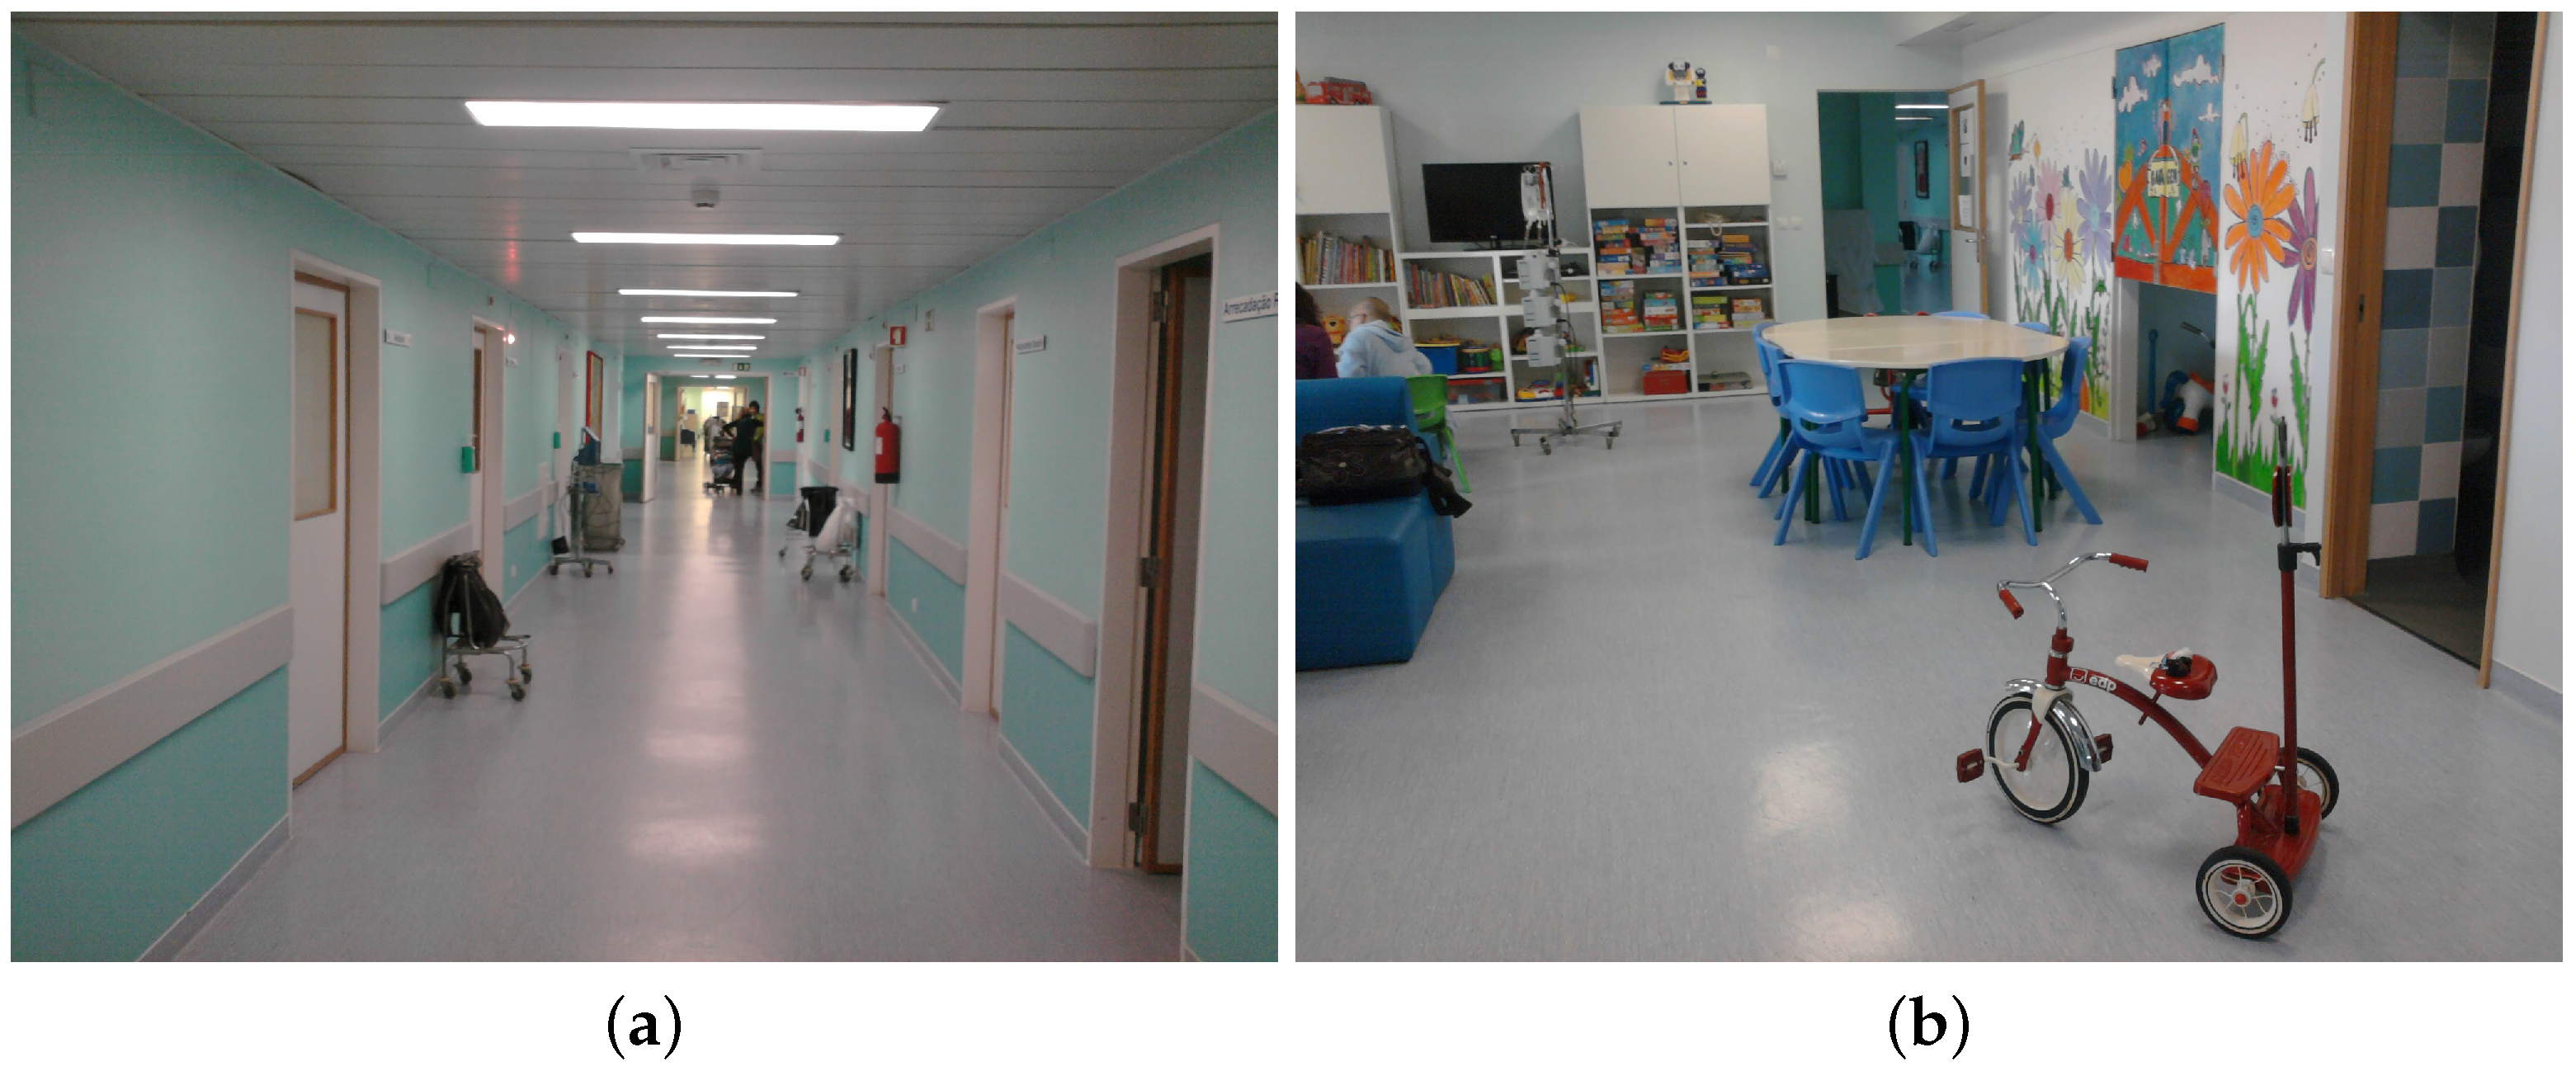
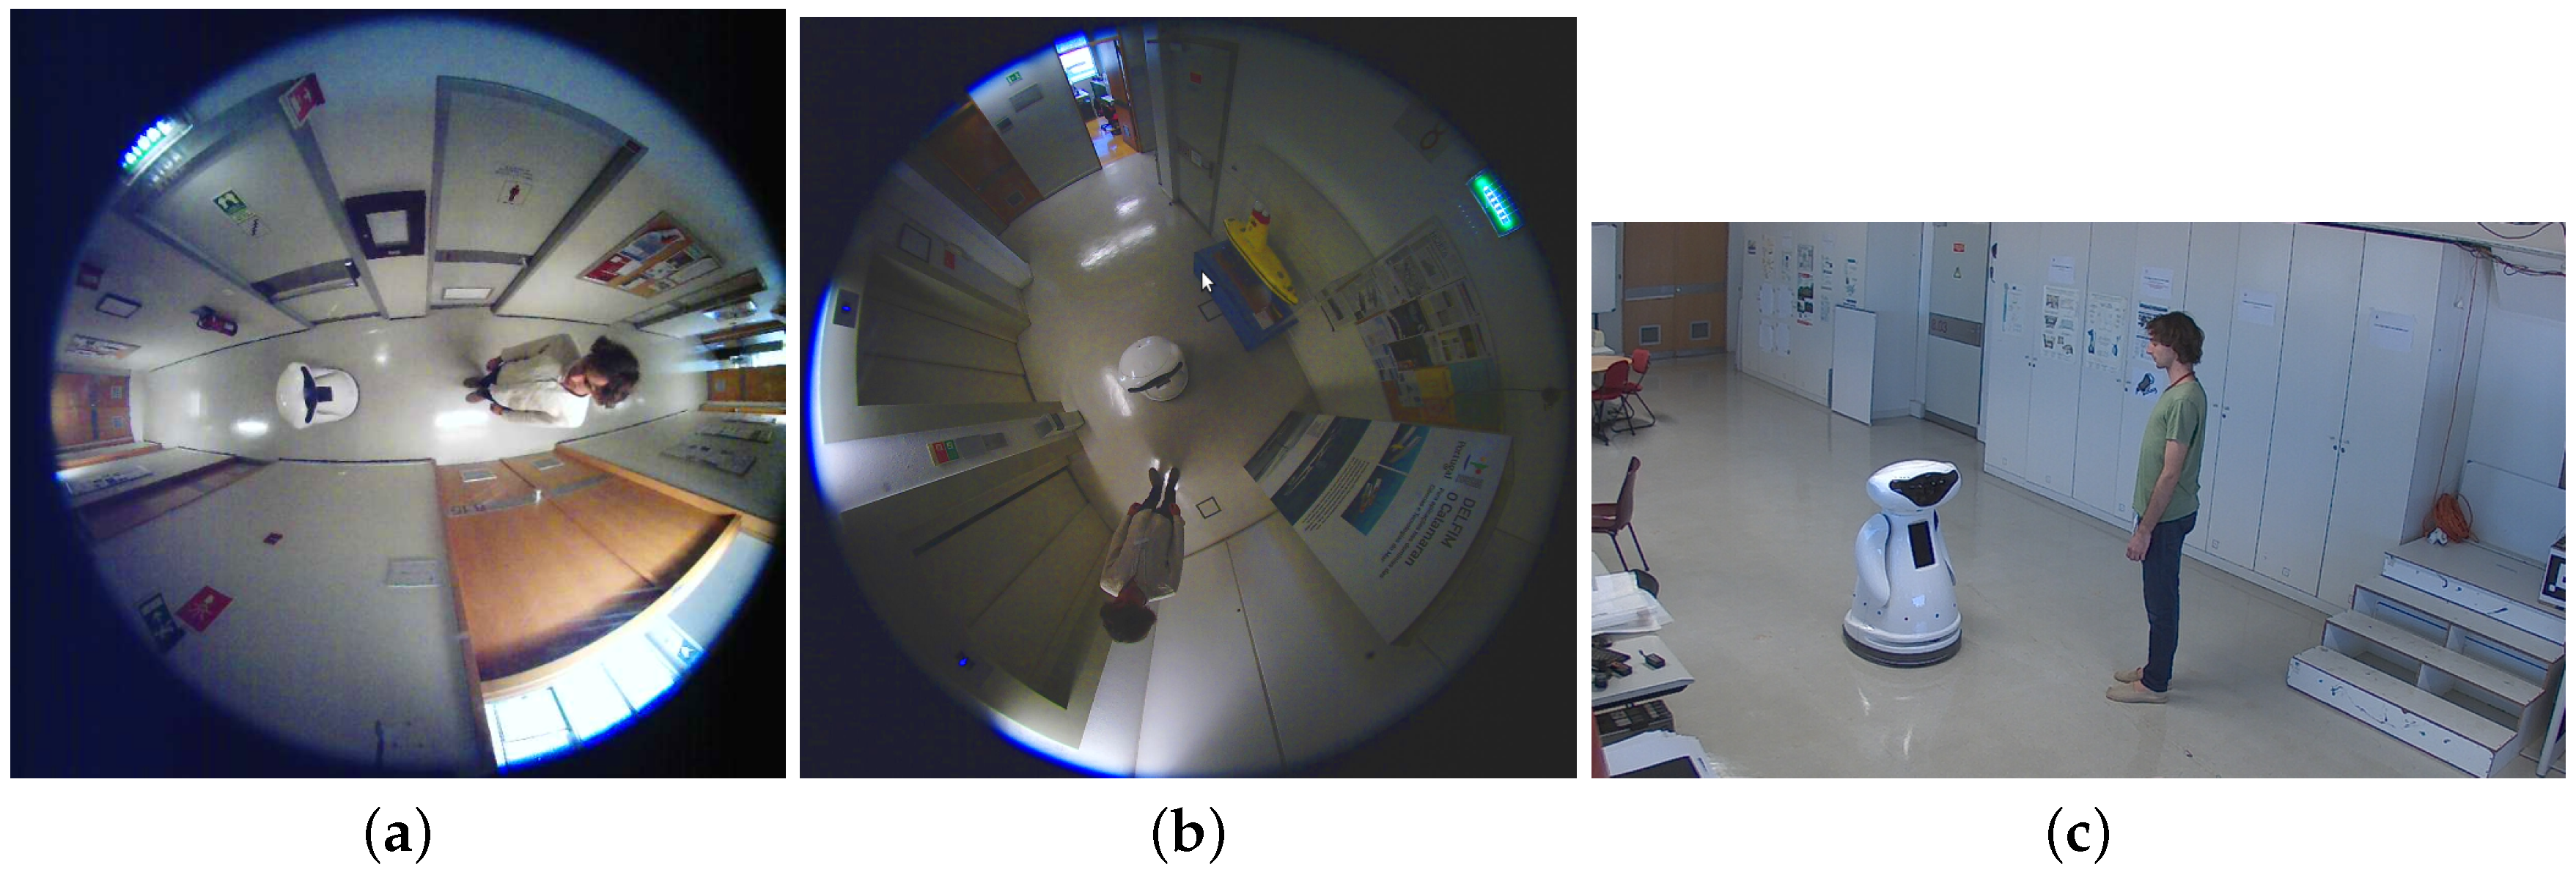
Two views of the main area where the experiments took place at a hospital environment are shown in
Figure 8. Side walls are concrete, doors are from wood, the floor is concrete with a plastic cover, and the ceiling is metallic. This environment has similarities with the in-lab test environment, except for the people. The robot wanders through this environment interacting with people and using RFID tag detection to take HRI related decisions.
The normal dynamics of the environment mean that (i) the usual people is in the premises, e.g., inpatients, staff, and parents; and also (ii) a small number of obstacles in the normal area spanned by the motion of the robot, i.e., no complex maneuvering is expected from the robot while wandering through the ward. As the number of people and objects in the areas accessible to the robot increases, so are the dynamics of the environment, as people’s interactions among each other means frequent breaks in normal movements, hence disturbing the detection conditions (and making the reader model less adapted to the environment).
The typical velocity for an adult walking at normal pace is in the range 1–1.8 m/s. Inside the hospital ward, the average velocity of the MOnarCH robot is around 0.6 m/s. Using the manufacturer’s data of 3 m detection range, this means that the overall system must complete the detection in less than s (worst case conditions, in which the robot and tag move in opposite directions at max speed). This value is clearly too small when compared with the 5 s sampling time used in Algorithm 1. Reducing the velocity of the robot is not an option, as it influences significantly the perception of people during HRI.
Moreover, as it will be clear below, the 3 m value could not be confirmed in the hospital environment. From a practical perspective, this means that acceptable accuracy in the angular position estimation for the tag (relative to the robot) can be difficult to achieve. Still, basic detection information is valuable for HRI purposes.
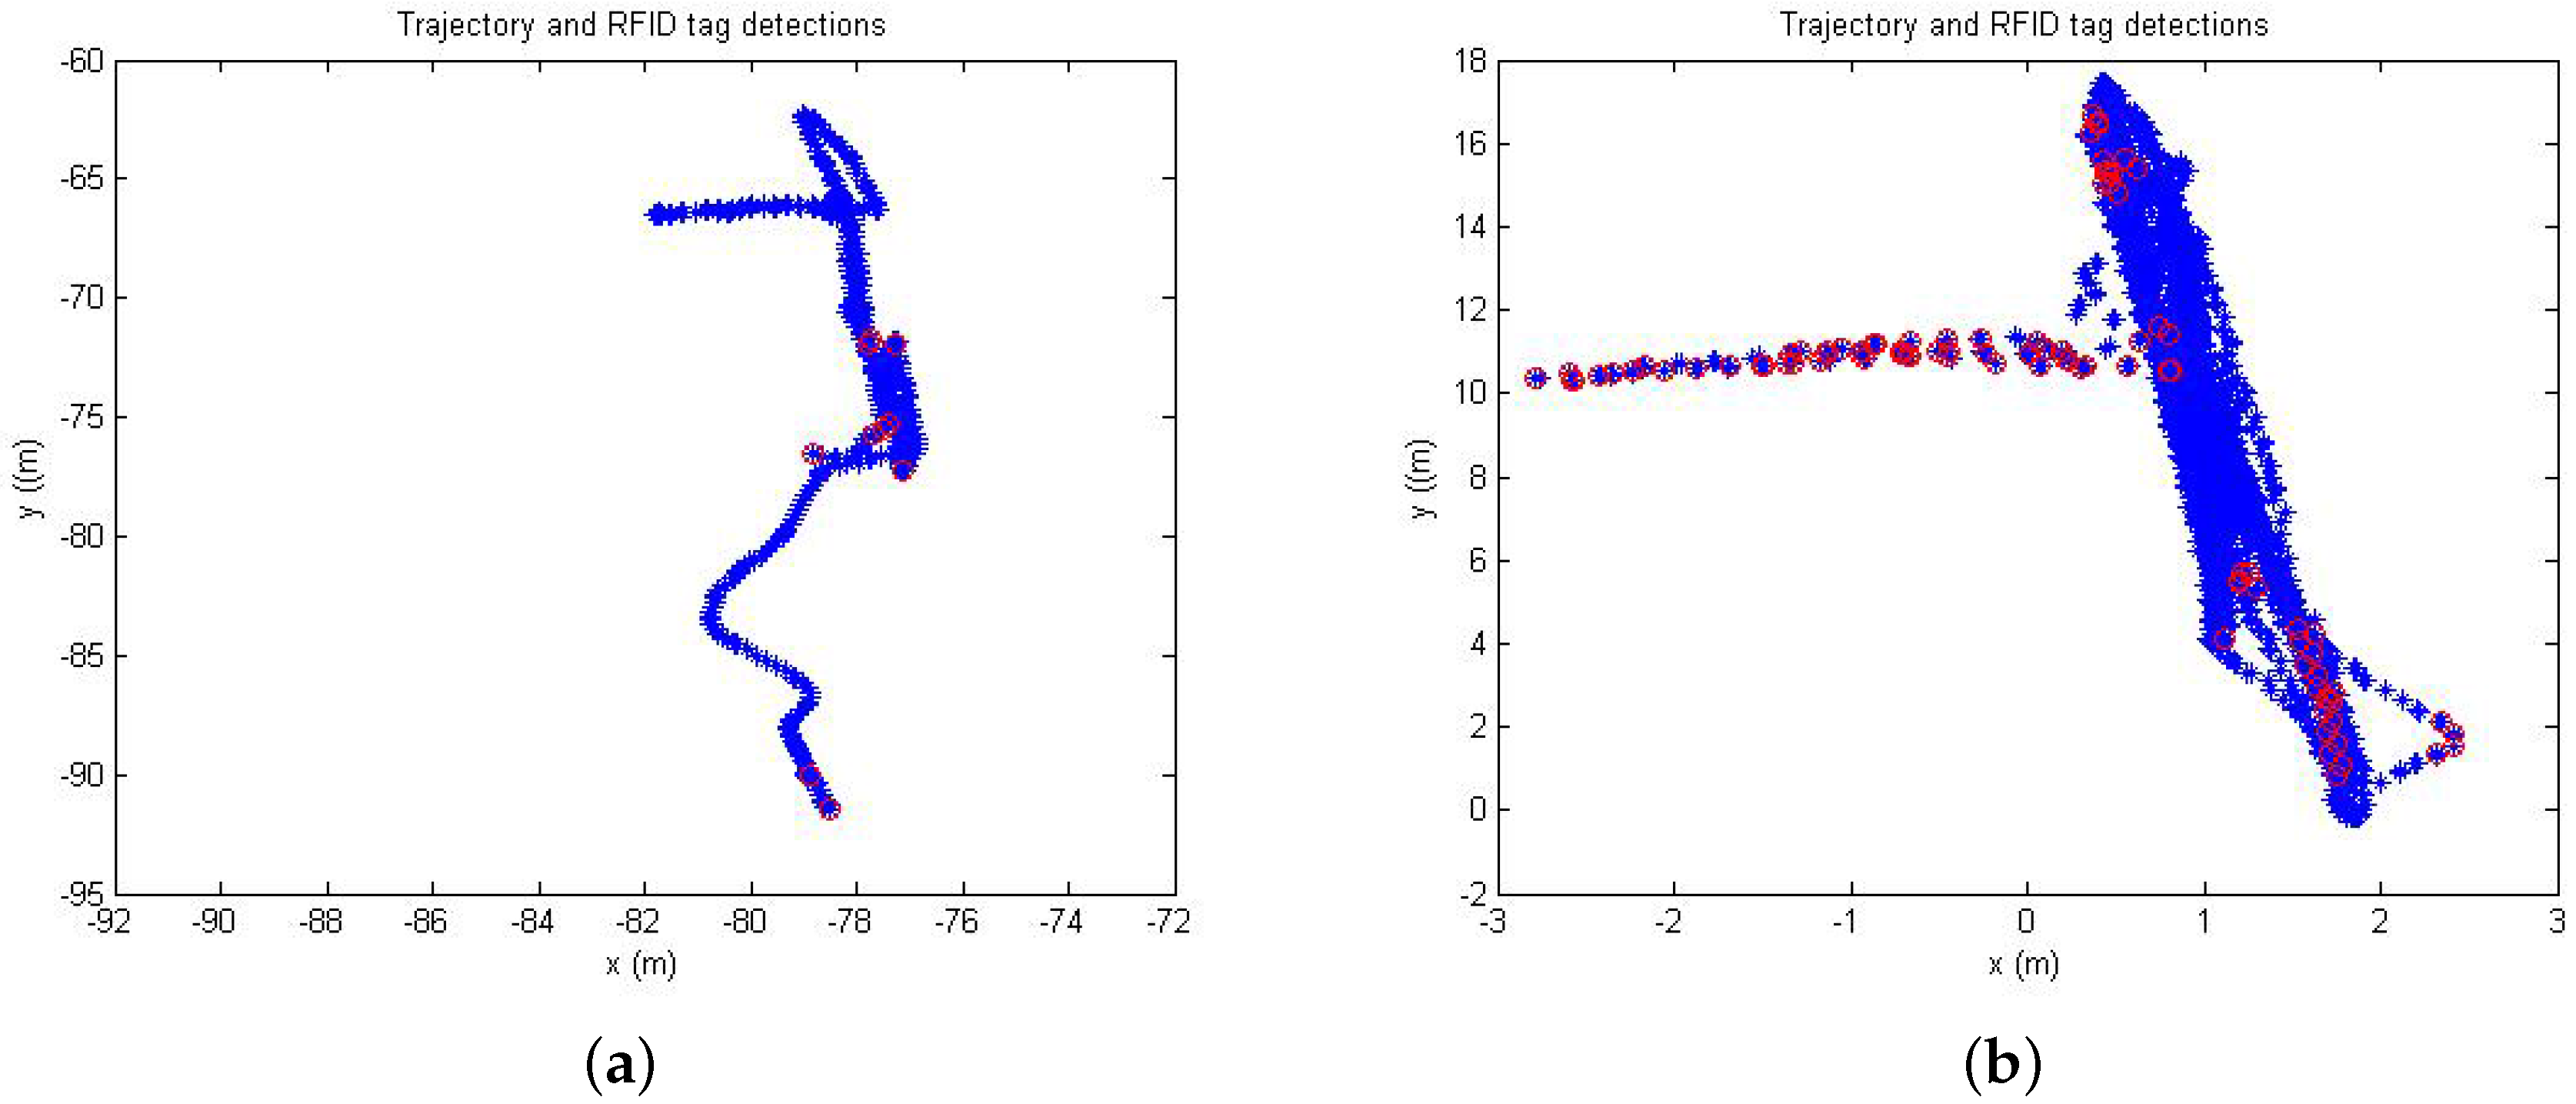
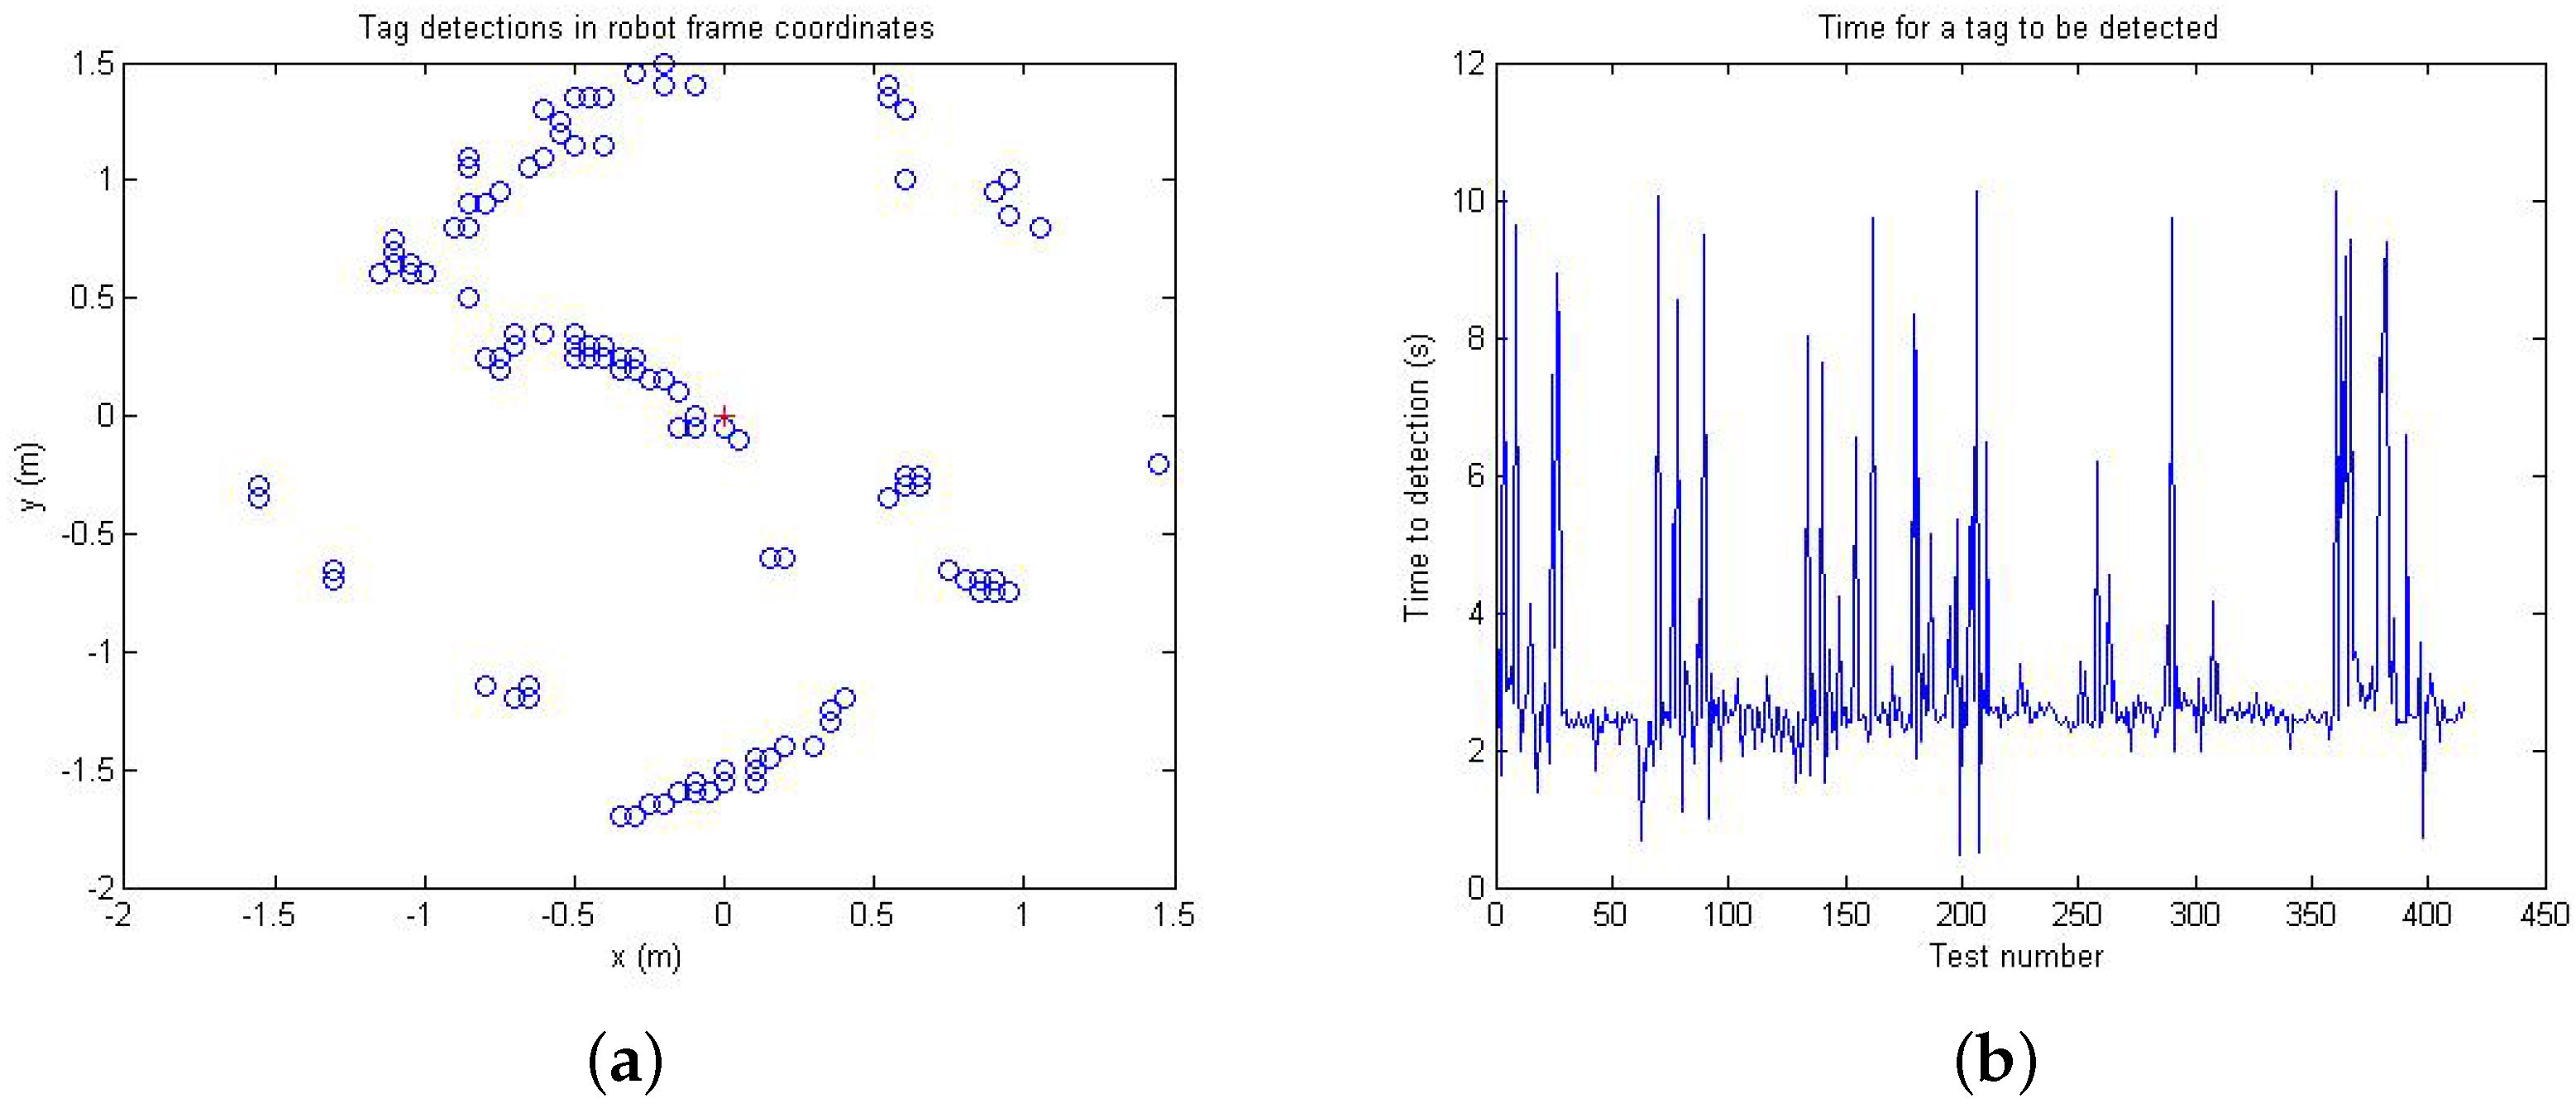
Figure 9 shows the position of the robot (in blue) and the positions at which tags were detected (in red).
Both plots were obtained in the main corridor in
Figure 8. Conditions at the time of the trials were normal, with just a few members of the staff executing their duties. In the left-hand plot, all of the detections occurred while the robot was stopped (the robot wandered for a while, then it was stopped, and a person carrying a tag would pass in a close neighborhood while the robot is stopped). Only a few detections occurred, which can be interpreted as people moving slowly (as when interacting with the robot).
In the right-hand plot, the robot was in a fully autonomous mode, wandering in the pediatrics ward, and detections occurred at random locations. An orientation bias in the pose estimation of the robot is visible in the right-hand plot. In the plot, it is visible that the density of detections is higher in the top, bottom, and at the left-oriented branch. This corresponds to regions where the velocity of the robot was reduced and hence detection was easier.
In both the left and right plots, it is clear that the 3 m detection range was not achieved.
In both tests, tags of the type Synco and ShortDipole_M4 were used. The real detection range could be observed to be below 1 m around the robot, well below the manufacturer’s estimated detection range.
While wandering in the ward, the robot tends to use the middle of the corridor. Often, medical devices are parked close to the walls, thus reducing the width of the corridor from the nominal 4 m to a usable 2.5 m. Thus, people tend to pass within close proximity of the robot, i.e., often within less than 1 m. Still, detection of the Synco tags was best observed when the tag was waived close to the reader in the head of the robot. The ShortDipole_M4 tag was observed to be slightly better. This can be observed in the left-oriented branch in plot (b) where only these types of tags were used.
4.2. Tag Localization Experiments
These tests were done in a lab environment with features comparable to the hospital.
Figure 10 shows three views of the tests in-lab. The premises are regular concrete walls, wooden doors and a metallic ceiling. A volunteer carrying a tag at half body-height approaches the reader (inside the robot head) until a predefined position.
An aggregate of all the experiments in the environment of
Figure 10 is shown in
Figure 11. The reader is located at coordinates
(marked ’+’) and each detection is marked by ’∘’. This collection corresponds to 10 tests with a tag of the type
7e, placed at 1.5 m height (over the clothes), in each of the four quadrants defined in the robot frame and for each of the environment main areas (lobby, corridor, lab).
A Lilliefors normality test performed on the time to detection set rejects the hypothesis that the values are normally distributed (at 5% significance). Mean and variance for other natural candidate distributions that are commonly associated with processes composed by multiple factors are shown in
Table 2.
The similarity of the values, namely those of the Gamma and Lognormal distributions, confirms that, as aforementioned, tag detection dynamics are fairly complex.
Figure 11a shows a pattern consistent with the asymmetric pattern of the antenna (see
Figure 6b).
Table 3 summarizes the detections per quadrant relative to the robot frame. Q1–Q4 represent the four quadrants, the reference quadrant (in the columns) indicates where the tag was presented, the detection quadrant (in the rows) indicates where the tag was detected, ND indicates no detections, and DR indicates the success detection percentage of the detections.
Each experiment was conducted in two variants, namely, (i) assuming no knowledge about the position of the reference tag and (ii) assuming that it is known if the tag is at the front/back of the reader. The first variant is shown in columns 3–5 in
Table 3, whereas the second variant corresponds to columns 6–9. This second variant makes full sense as the tag detection will be often used in conjunction with other techniques, e.g., vision to detect the existence of people at the front/back of the robot. In this case, the searching is restricted to the front/back of the reader (the readcounts were obtained under the exact same conditions).
For HRI purposes, the exact angular position is not that relevant. For example, the robot not turning the head exactly in the direction of a person wearing a tag does, in general, not cause acceptance issues (the robot can even turn the head in the opposite direction without leading to acceptance problems, provided the error rate is kept above some environment dependent level). Moreover, in environments such as the one in these experiments, where the main social area is a corridor, the relevant region for proxemics is the frontal area of the robot.
Though, in principle, the strategy above can yield a good discrimination among the four quadrants, and even the angular position in the robot frame, the results in
Figure 11 and
Table 3 show a clear bias imposed by the antenna detection pattern. Using a priori information on whether the tag is at the front/back, the detection achieves interesting values around 70% success for the quadrants 2 and 4, which are the aligned with the detection pattern obtained in
Figure 4b. The detection in quadrants 1 and 3 is poor. However, the results obtained above suggest that, combining antennas oriented along quadrants 2–4 and 1–3, a 70% success rate can be achieved anywhere around the robot.
The ND line in
Table 3 shows the no-detections, i.e., the false negatives. The wrong detections in lines Q1–Q4 indicate the false positives. True positives correspond to the correct detections. True negatives correspond to correct non-detections, which did not occur in this experiment.
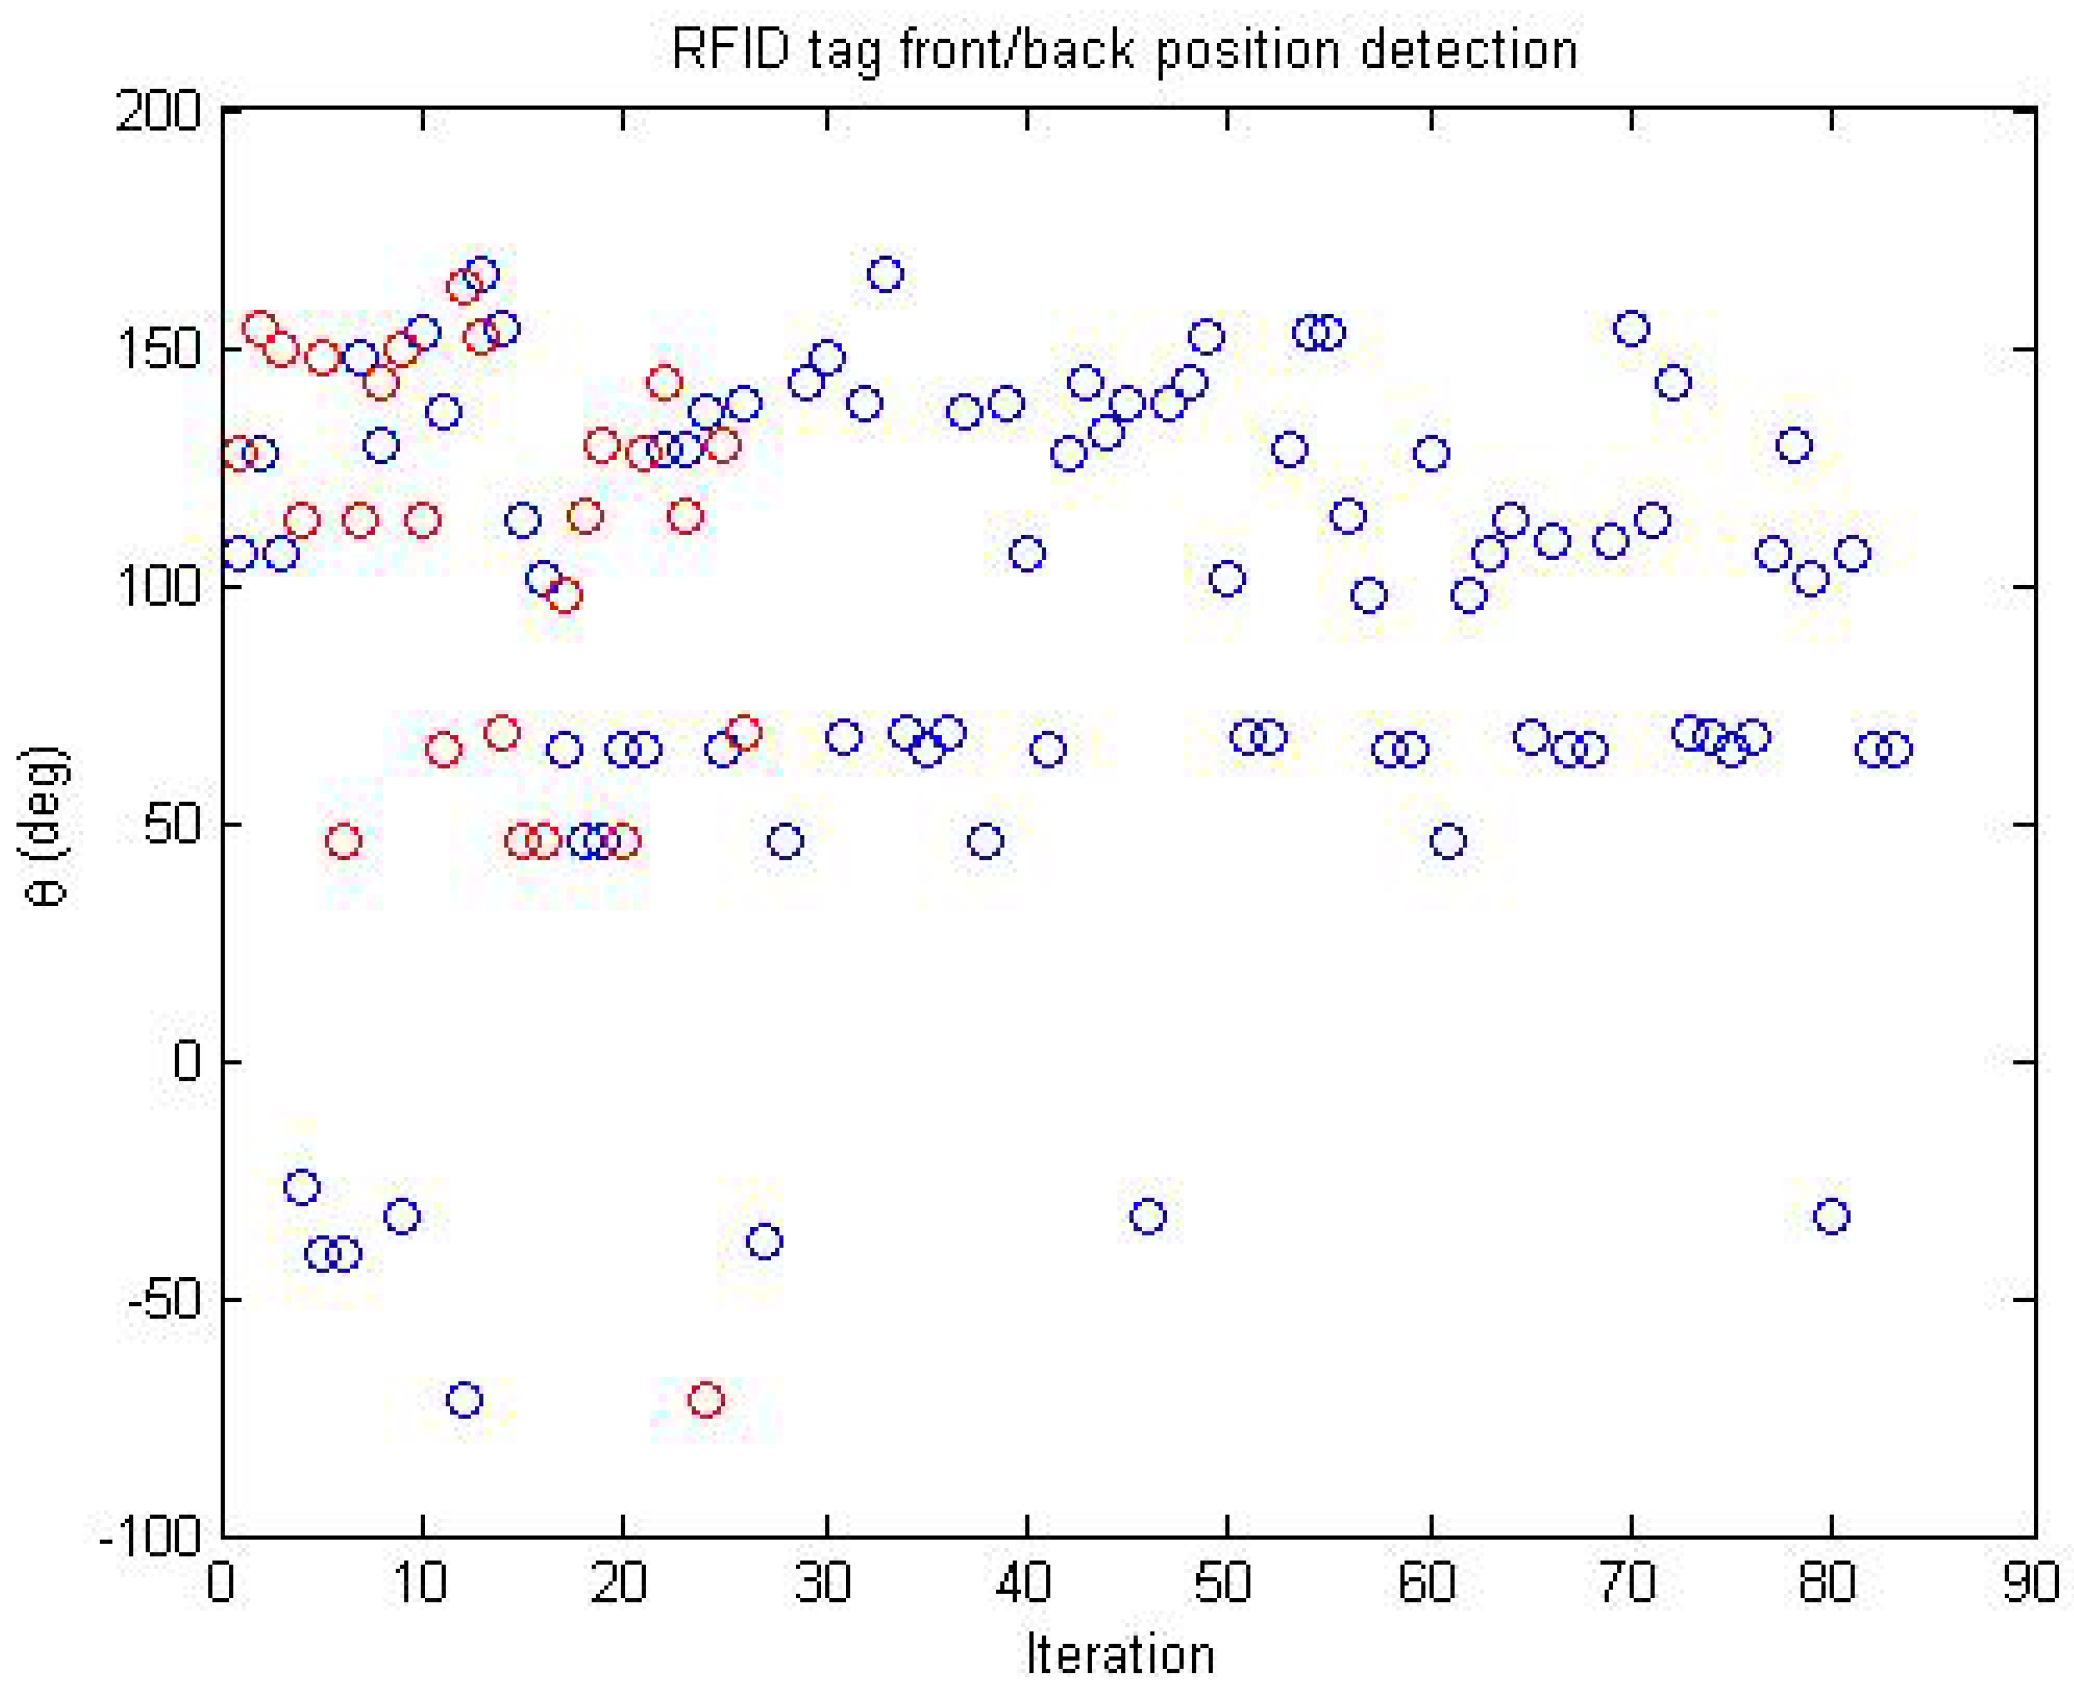
Figure 12 shows the angular detection when the tag passes by the robot (with the onboard reader) in the corridor shown in
Figure 8a. The frontal area of the robot corresponds to angles in the range
. The red/blue marks correspond to the person carrying the tag approaching the robot, head-to-head, passing through the right/left hand side of the robot, respectively, and continuing along the corridor. The plot contains multiple runs.
The density of the samples in the frontal area indicates that detection/localization was highly successful. As the tag moves away from the robot, in the opposite direction of motion, detection becomes poor, with only a few samples obtained.
5. Conclusions
The experiments demonstrate a number of features of interest of RFID technology for HRI purposes, in particular those related to proxemics. In ideal conditions, namely without disturbances, the anysotropic detection pattern of the antenna can be used to obtain a rough estimate of the angular position of the tag in the robot frame.
The specific antenna pattern considered yield a good agreement for tags in quadrants 2 and 4. This, in turn, is a clear indicator that good discrimination in all four quadrants can be achieved by combining two (or more) antennas such that the respective detection patterns are adequately oriented (or using a single orientable antenna). For applications requiring rougher angular discrimination, e.g., front/back, a single antenna can yield an interesting performance.
The experiments show that environment conditions may significantly influence the performance of the model. Thus, future work includes (i) identifying in real time the model of the reader installed onboard the robot; and (ii) studying motion strategies for the robot equivalent to a directional antenna that do not disturb the HRI.
In future work, dynamic maps containing the localization of people in the neighborhood of the robot, produced using the technique in the paper, can also be merged with dynamic maps produced using other sensors. In the case of the MOnarCH robot, such sensors can be the RGB-D cameras at the head and the lasers at the bottom of the robot.


