1. Introduction
The constant growth of electrical energy use and its inherent problems have forced the scientific and legislator communities to be involved in power quality (PQ) problems. Modern life depends on electrical energy. This makes the reliability of an electrical system and power quality important topics in electric power research. In literature there are many contributions in the power quality, but, in this research field, many things have to be better investigated [
1,
2,
3].
There is still no complete definition of the concept of power quality [
4]. One definition could be that it is the branch of science that studies all variations that can appear on the ideal waveform of the current and in the voltage in a generic electric power network. Another good definition could be the combination of phenomena that points out that the energy of the mains is corrupted compared with the ideal sinusoidal shape [
5].
There have been many deviations such as disturbances, unbalances, distortions, voltage fluctuations, and voltage flickers that, acting on the sine wave, allow the evaluation of energy quality [
4,
6].
In addition, the definitions of some of these deviations are not yet definitive, but they evolve with the progress of the knowledge associated with the phenomena.
These deviations are due to many causes, e.g., switching operations, flows of heavy currents, flows of fault currents, blown fuses, breaker openings, etc. [
1,
2,
3,
4,
5,
6,
7], and their effects can sometimes create very expensive economic problems [
8,
9,
10,
11,
12,
13,
14,
15].
For most of these deviations, it is possible to use some techniques to limit their effects; however, up to now, it has not been possible to eliminate the causes.
To quantify the effects of these phenomena, we need to study the power quality parameters. For this purpose, the International Electrotechnical Commission (IEC) defined a series of standards to deal with power quality issues. The IEC 61000-x-y (with x:1-6 and y:1-7) and the IEEE 1159 [
7,
16] are the most widely standards used in this field. These guidelines concern the description and the characterization of the phenomena, the principals sources of power quality problems, the impact on the equipment and on the power system, the mathematical description of the phenomena using indices or statistical analysis to provide a quantitative assessment of its significance, the measurements techniques and guidelines, the emission limits for different types and classes of equipment, the immunity or around the tolerance level of different types of equipment, the testing methods, the procedures for compliance with the limits, and the mitigation guidelines. To limit or better prevent the negative effects due to these phenomena, blocking them quickly is necessary. For this purpose, some studies have proposed passive technical approaches as the use of transformers or of passive filters able to cut or reduce the effects of some specific frequencies generated by some machines (e.g., 30 Hz for air-conditioning compressor motors). This approach has a limit: the problem must be a priori known in order to promptly act, but, unluckily, this condition is not common in an electrical network [
14].
Today, the great calculus capability of the digital systems allows for the development of instruments that are able to limit the effects of the deviations [
17]. To evaluate the PQ [
18], it is necessary to make measurements. Over the years, we realized and perfected a probe able to determine the quality parameters with a high confidence level in real time, and we developed an ad hoc instrument to satisfy some characteristics that are usually difficult to find in instruments available in the market.
The Electric and Electronic Measurement Laboratory of “Roma Tre” University has been engaged in the PQ evaluation for 12 years, and this article shows the innovations made on PQ instruments previously realized. These innovations are based on the Raspberry-Pi. It has the dual aim of controlling the acquisition card and of transferring data toward a remote server where they are evaluated. If necessary, this instrument can also locally evaluate the acquired data.
2. The First Version of the Instrument
We present here a synthesis of the first version of the instrument and of its upgrades over time [
19,
20,
21,
22,
23,
24].
The instrument allows for the determination of quality parameters with a high confidence level in real time. In particular, the instrument has been conceived to satisfy some exigencies that are usually difficult to find in a single instrument available on the market:
the provision of high accuracy measurements;
the assurance of a certain energy autonomy in case of black out—this allows for the accurate determination of the duration of the blackout;
the storage of the PQ parameters and the allowance of a great data storage capacity;
constant connection to the Internet to create an open data for constant monitoring of the trends of the PQ parameters from all over the world.
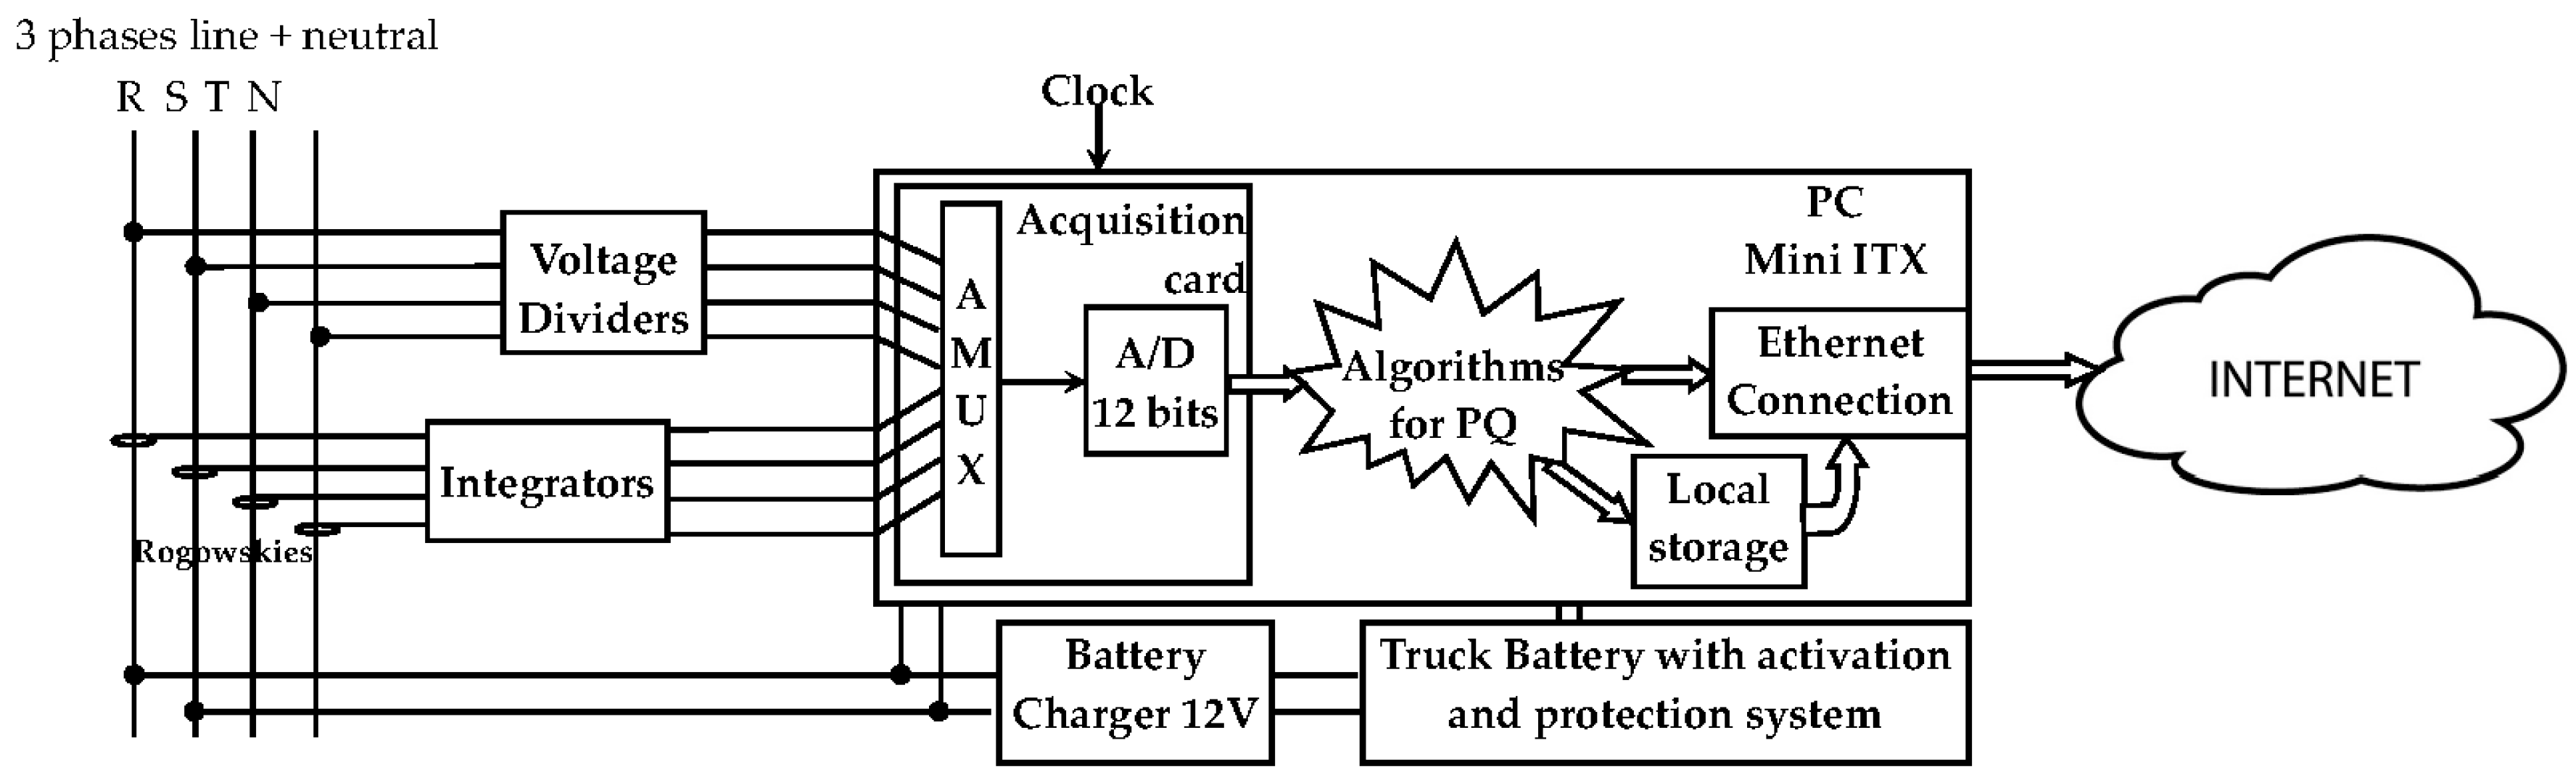
Figure 1 shows the block scheme of the first version of our instrument.
Figure 1 shows an eight-channel acquisition card mounted on a personal computer. This samples voltages and currents of a three-phase four-wire system (three phases and one neutral). The instrument was conceived for utilization in small environments; therefore, it was important that the overall dimensions of the system were small. The first version of the instrument used a mini personal computer (a Mini ITX), whose dimensions were 20.4 × 10.2 × 20.4 cm. The instrument’s case was 60 × 40 × 40 cm.
The acquisition card mounted inside the personal computer (PC) was a Measurement Computing Data Acquisition System (DAS) 8/12 [
19,
20] with eight input channels—four connected to the current sensors and four connected to the voltage ones. The current sensors were four Rogowskies (Rocoil Ltd., Harrogate, UK) [
25] with an accuracy of ±1%, whose pass band was typically at least three orders of magnitude wider than a current clamp. This allowed for the avoidance of the typical distortion introduced by ferromagnetic core devices. The output signal is proportional to the derivative of the current; therefore, an integration stage placed before the acquisition card was necessary. The sensors for the voltage were dividers built up with resistors, which have an accuracy of 0.1% mounted on a custom card. The dividers were necessary to reduce the high voltages of the mains to the values accepted by the input dynamic range of the acquisition card.
The sampling was managed by external timing that, in the first applications, was directly linked to the clock provided by the “INRIM” Institute (the Italian National Time Metrological Institute, Strada delle Cacce, Turin, Italy), which assures an accuracy of one part in 10
−14 for the time standard [
26].
A custom Uninterruptible Power Supply (UPS) with a 12-V battery powered by a battery charger ensured operation in the case of a blackout for a period of at least eight hours. We developed a custom UPS to directly supply the Mini ITX at 12 V DC instead of the usual UPS’s, which provide a 220/230 V AC. The instrument was connected to a modem by an Ethernet interface to transmit data toward a central server. This received the data from the probe and organized them to evaluate the PQ parameters during the day using a modified version of the well-known curve-fitting algorithm [
4,
27,
28,
29,
30].
Despite the fact that the instrument was conceived to satisfy many exigencies, the device showed some important drawbacks:
The acquisition card used a multiplexer to manage the input channels; therefore, the use of a high accuracy time reference did not ensure high accuracy in the timing of the sampling. This produced an incorrect registration of the phases of the signals under analysis. This problem was partially solved by a complex analysis of the uncertainty, as shown in [
27].
The acquisition card used a bus PCI (peripheral component interconnect). This obliged us to use a personal computer exclusively with this kind of bus, strongly limiting the flexibility of the system and preventing the possibility of reducing overall costs.
In case of operative system crash, there was no possibility of restarting the system using a remote control.
The voltage reference was integrated in the acquisition card, preventing us from using a more accurate reference.
The voltage sensors were spatially separated from the acquisition card, thus incurring assembly difficulties.
The mini personal computer, if used in stressful environment such as an electric cabin, showed serious reliability problems.
During the time, in order to face these problems, many improvements were implemented:
In order to limit the interventions in case of probe malfunctions, we realized a remote control device that, using a common phone line, namely a PSTN (public switched telephone network), allowed us to manage the base functionality of the PC. In fact, the device, interpreting the command tones (DTMF (dual-tone multi-frequency)) generated the signals to switch on or reset the PC [
24]. Moreover, the device was able to check the status of the PC (on or off) and the charging status of the battery.
Then, we developed a custom acquisition board that improved the overall performance of the instrumentation [
19,
20,
31,
32,
33]. In order to preserve all the information of the phases between the voltages and the currents, the new acquisition card was capable of simultaneously acquiring eight channels without multiplexing.
It worked at 24.976 kHz per 499 samples per period of the fundamental frequency, beyond the limit of 256 samples recommended by standards such as IEC 61850 [
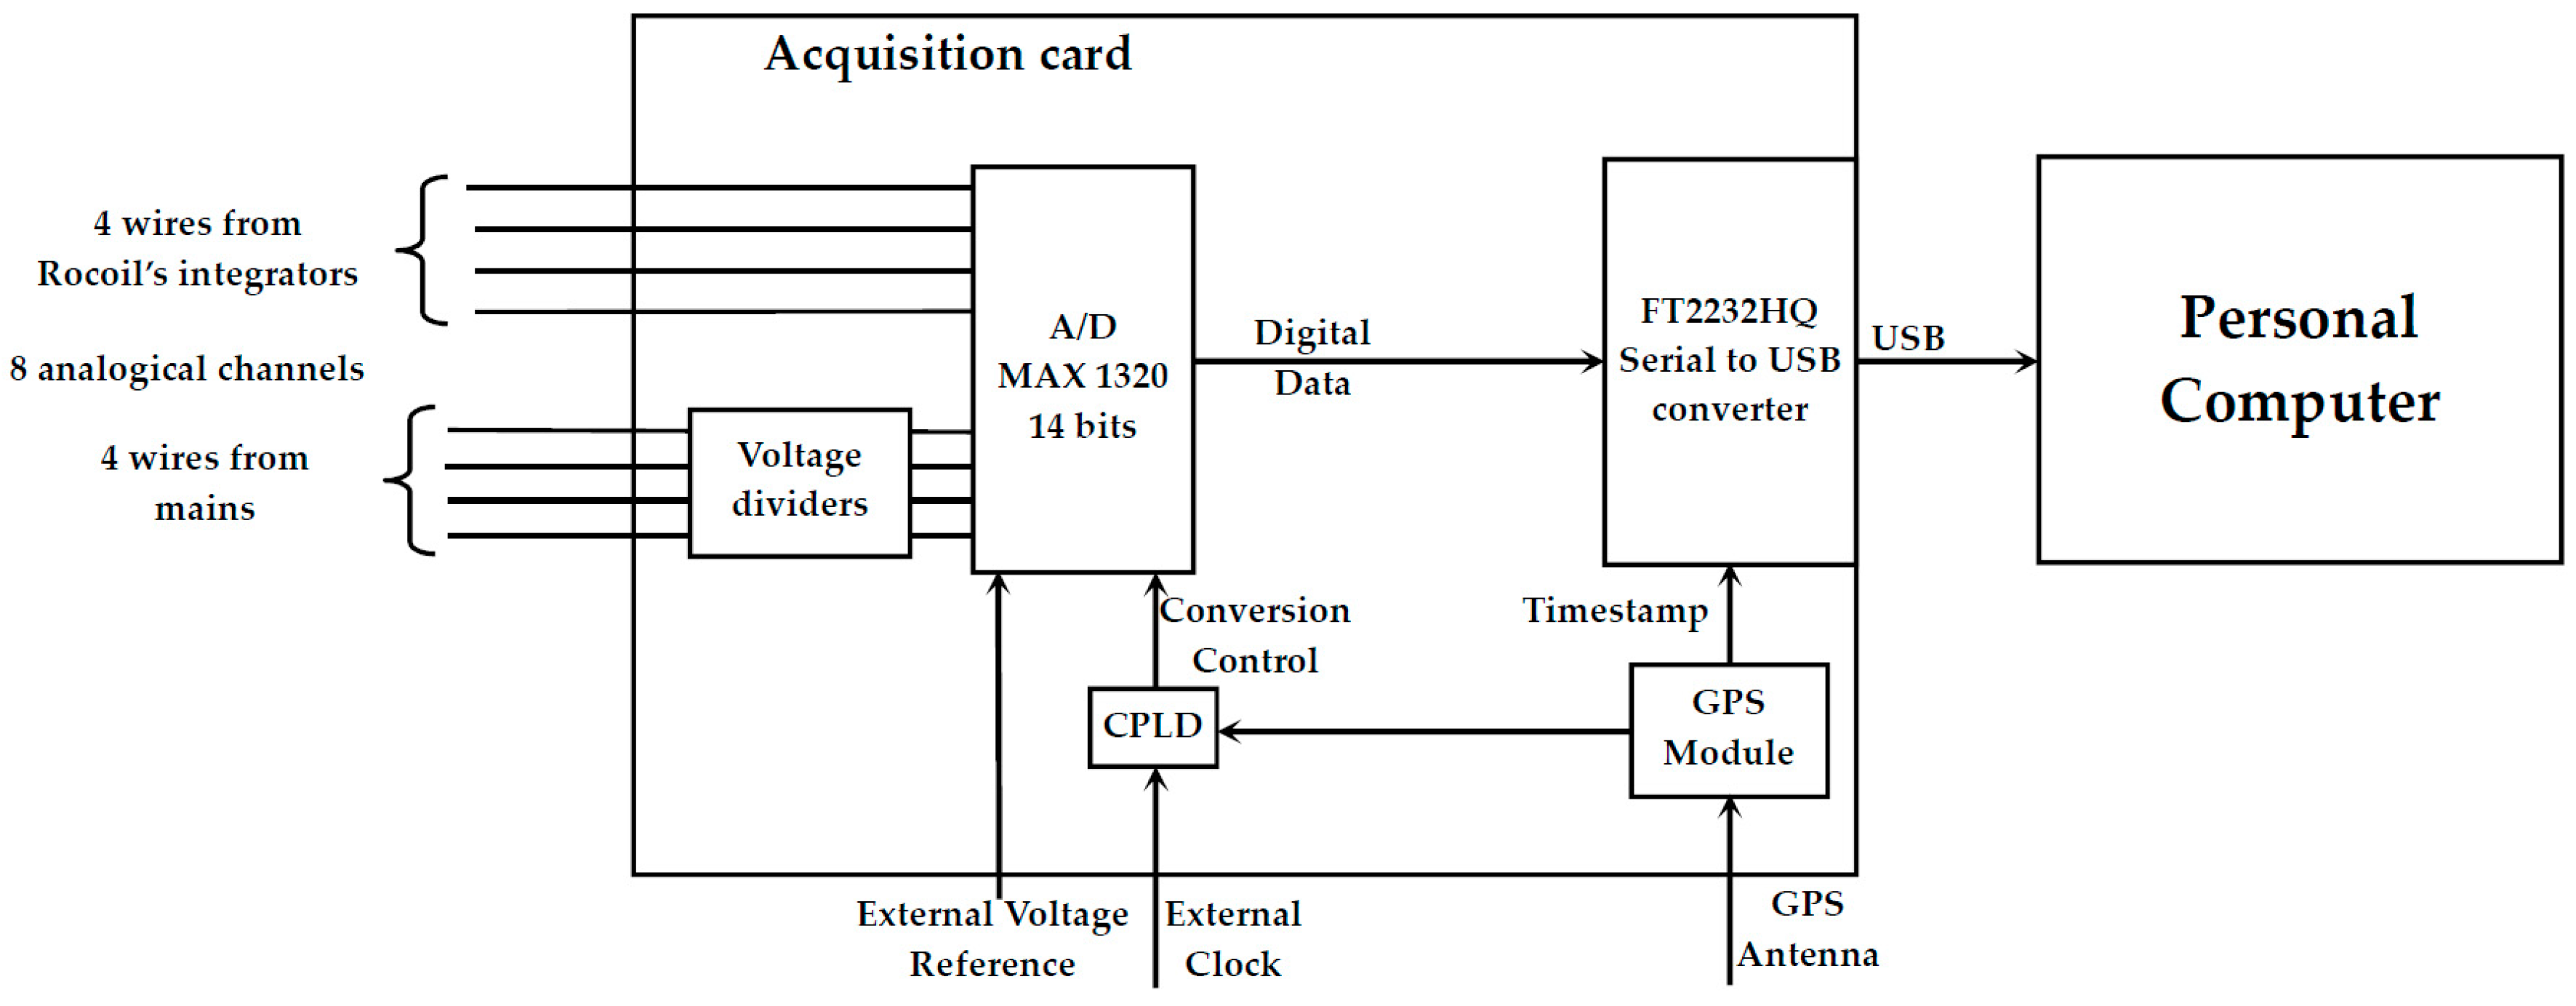
34]. The A/D resolution was 14 bit and used the FT2232HQ USB, which is a high speed USB 2.0 interface whose drivers are available for Windows©, Linux, and Mac OSX operative systems. The possibility of setting up external references for metrological purposes was still present. The board had its own time and voltage reference mounted. The system control was carried out with a very simple command set over a bidirectional 9600 bps null modem channel obtained by a Virtual Com Port (VCP) driver. A second VCP realized on a high-speed one-way channel was dedicated to transmit captured data over a USB connection. The driver manages both the control and the data channel according to the RS232 protocol. The proposed solution was a universal cross platform interface for all hardware equipped with a USB 2.0 interface. Despite the PCI interface, this solution provides important advantages in terms of software and hardware compatibility. This solution allows the possibility of developing software in ANSI C or C++ languages to write its own custom data acquisition software rather than using a proprietary SDK (software development kit) package for control applications of the board, usually made with inaccessible precompiled program libraries. Our DAS was designed to be simple and to be used on different hardware and powered via USB bus (power consumption of 1.5 W). Finally, the core of the new board was the data acquisition obtained using a Maxim ADC MAX1320 [
35]. It used a very fast SAR (Successive Approximation Register) technology and was able to acquire eight channels simultaneously at a frequency of 250 kS/s per channel with a resolution of 14 bits. Each channel has a “Track and Hold” circuit, which ensured an aperture time of 10 ns and a channel-to-channel matching of 50 ps. In order to obtain the optimal operating setup, at the beginning, it works on its original Evaluation Kit. Analogue input ranges were ±5 V, 77 dB SNR at 100 kHz. The voltage inputs were scaled down with high precision dividers (accuracy of 0.01%) to tolerate peaks up to 500 V. Current signals still arrived from integrators by Rocoil Ltd. [
25], which allows us to integrate the signal incoming from the Rogowsky coils. Voltage and current channels were disposed alternately and spaced on the board to reduce cross-talking noise and capacitive couplings as much as possible.
Figure 2 shows the structure of the new acquisition card.
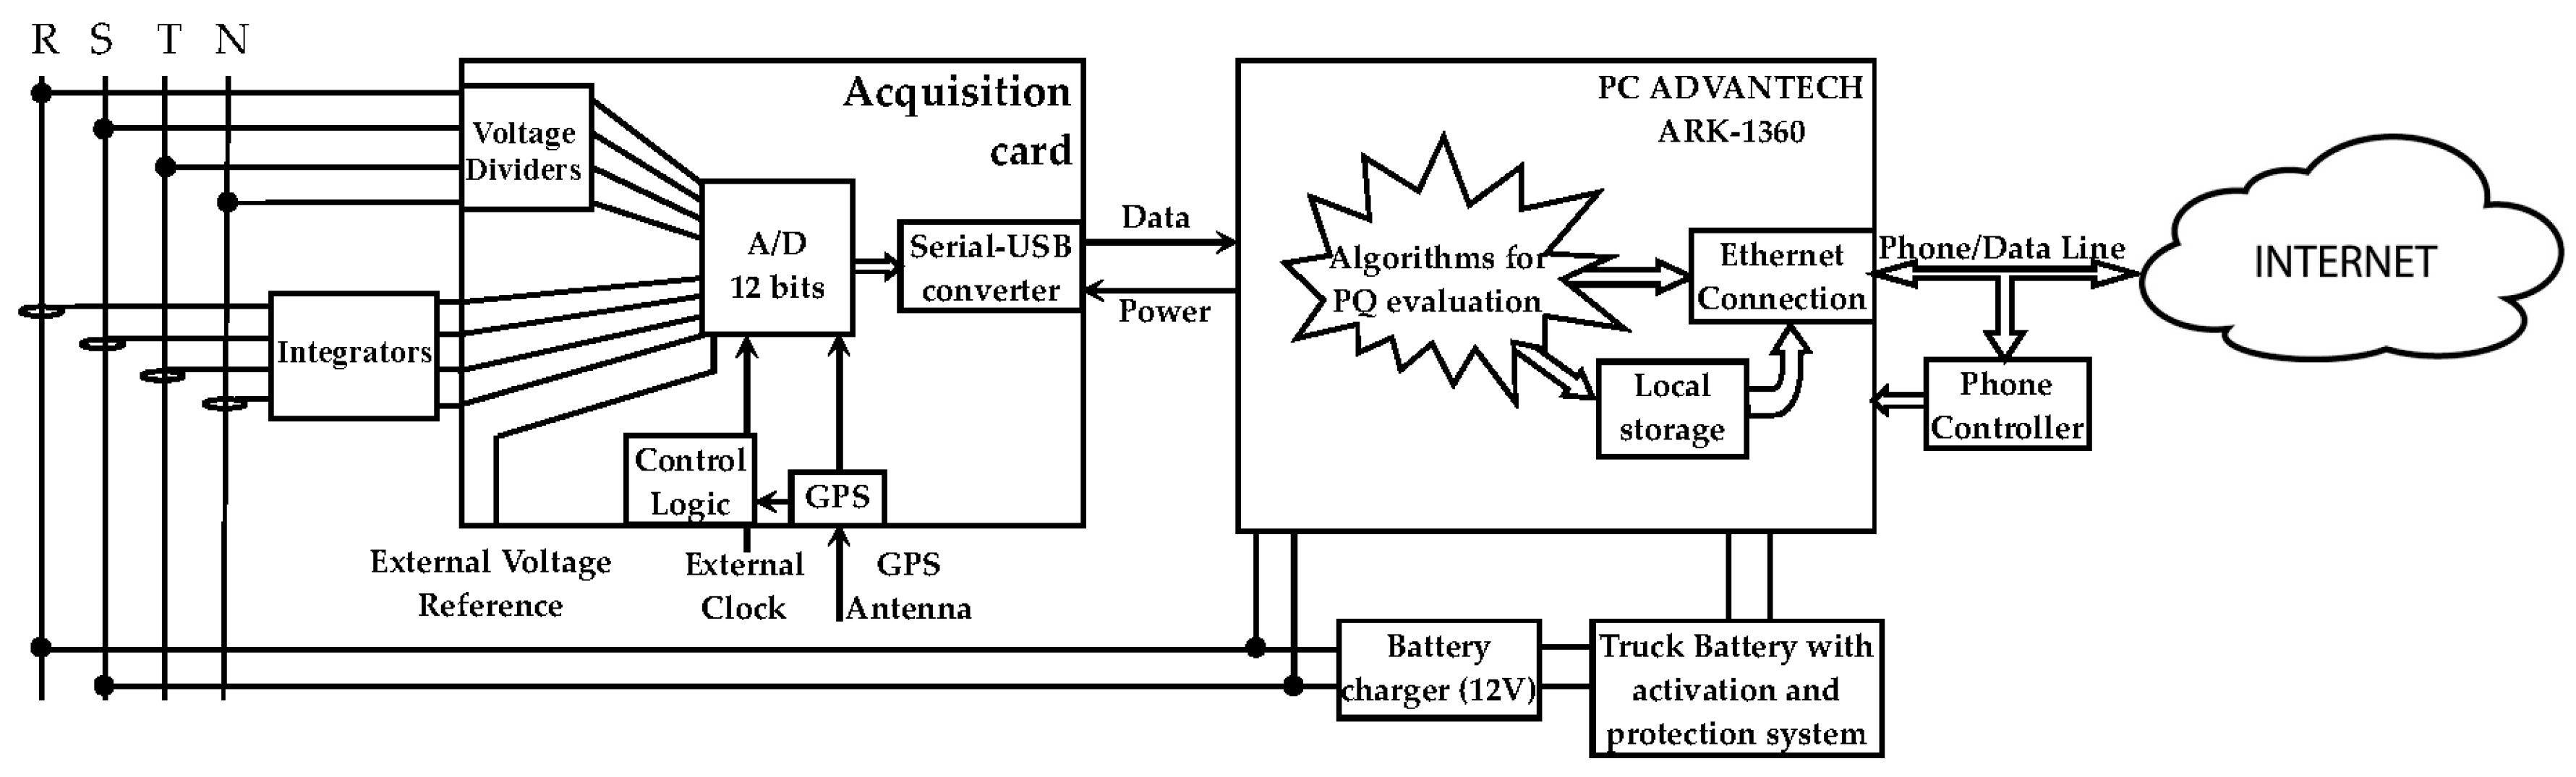
In order to increase the overall reliability of the probe, another improvement was the substitution of the Mini-ITX with an industrial PC. We chose an ADVANTECH PC, the ARK-1360 [
36], which was an ultra-compact fanless embedded computer conceived to work in stressful environments such as electric cabins that are dusty and hot. In fact, the absence of the fan eliminates the necessity of cooling the processor, drawing air from the outside of the case while avoiding the accumulation of dust inside the case, which is the primary cause of fan breakdown. The wide range of working temperatures, from −40 to 60 °C, assured that performances would be suitable for our operational needs.
To certify a possible event on the mains with the highest accuracy, it was fundamental to join the acquisitions to a time reference. For this aim, the first version of the acquisition card had an input for an external time reference useful in our first application of the probe located inside the transformer cabin, where the time reference provided by INRIM was present. Unfortunately, an application outside of these cabins makes the use of this timing impossible, corrupting the time accuracy of the measurements. To face this problem, the card was modified to accept a time reference coming from the Global Positioning System (GPS). This was obtained by adopting the module Resolution T [
37] of the Trimble, responding to the need of accurate timing when you need it, linking the card to the UTC (Universal Time Coordinated) time. This device was able to provide an accuracy of less than 15 ns (1 Sigma, Sigma, St. Louis, MO, USA) for the one PPS (pulse per second) output. The rising edge of the pulse was less than 20 ns and was synchronized to the GPS.
Figure 3 shows the improvements implemented over time that highlight the new architecture for the system compared to the first version.
3. The Revolution: The Introduction of the Raspberry-Pi
The numerous changes deeply modified the architecture of the first version of the instrument opening new scenarios in terms of further improvements. In particular, the separation between the PC and the acquisition card that, in the last version of the instrument, talked back and forth through a USB connection, allows for the introduction of a further revolutionary innovation: the use of the Raspberry-Pi.
The hardware and software characteristics of the Raspberry-Pi Model B (CPU: 700 MHz; RAM: 256 MB; FLASH/HD: 4 GB; O. S.: Linux; USB and Ethernet connections) were sufficient to control the acquisition card and allowed data transmission to the remote server. The algorithms for the PQ parameter evaluation that were translated for the Raspberry ran easily. Being a fanless device, it preserves the advantages in terms of reliability warranted by the ADVANTECH PC. These preliminary checks certified the possibility of use, thus realizing the substitution of the PC with the Raspberry.
As is known, the Raspberry offers a long series of positive characteristics that have been well described in many articles [
38,
39,
40,
41], indicating numerous advantages of our instrument:
Its power consumption is about four times less than the PC of the ADVANTECH; this leads to a further advantage that the UPS needs a battery with a capacity four times lower and a volume at least 5 times lower.
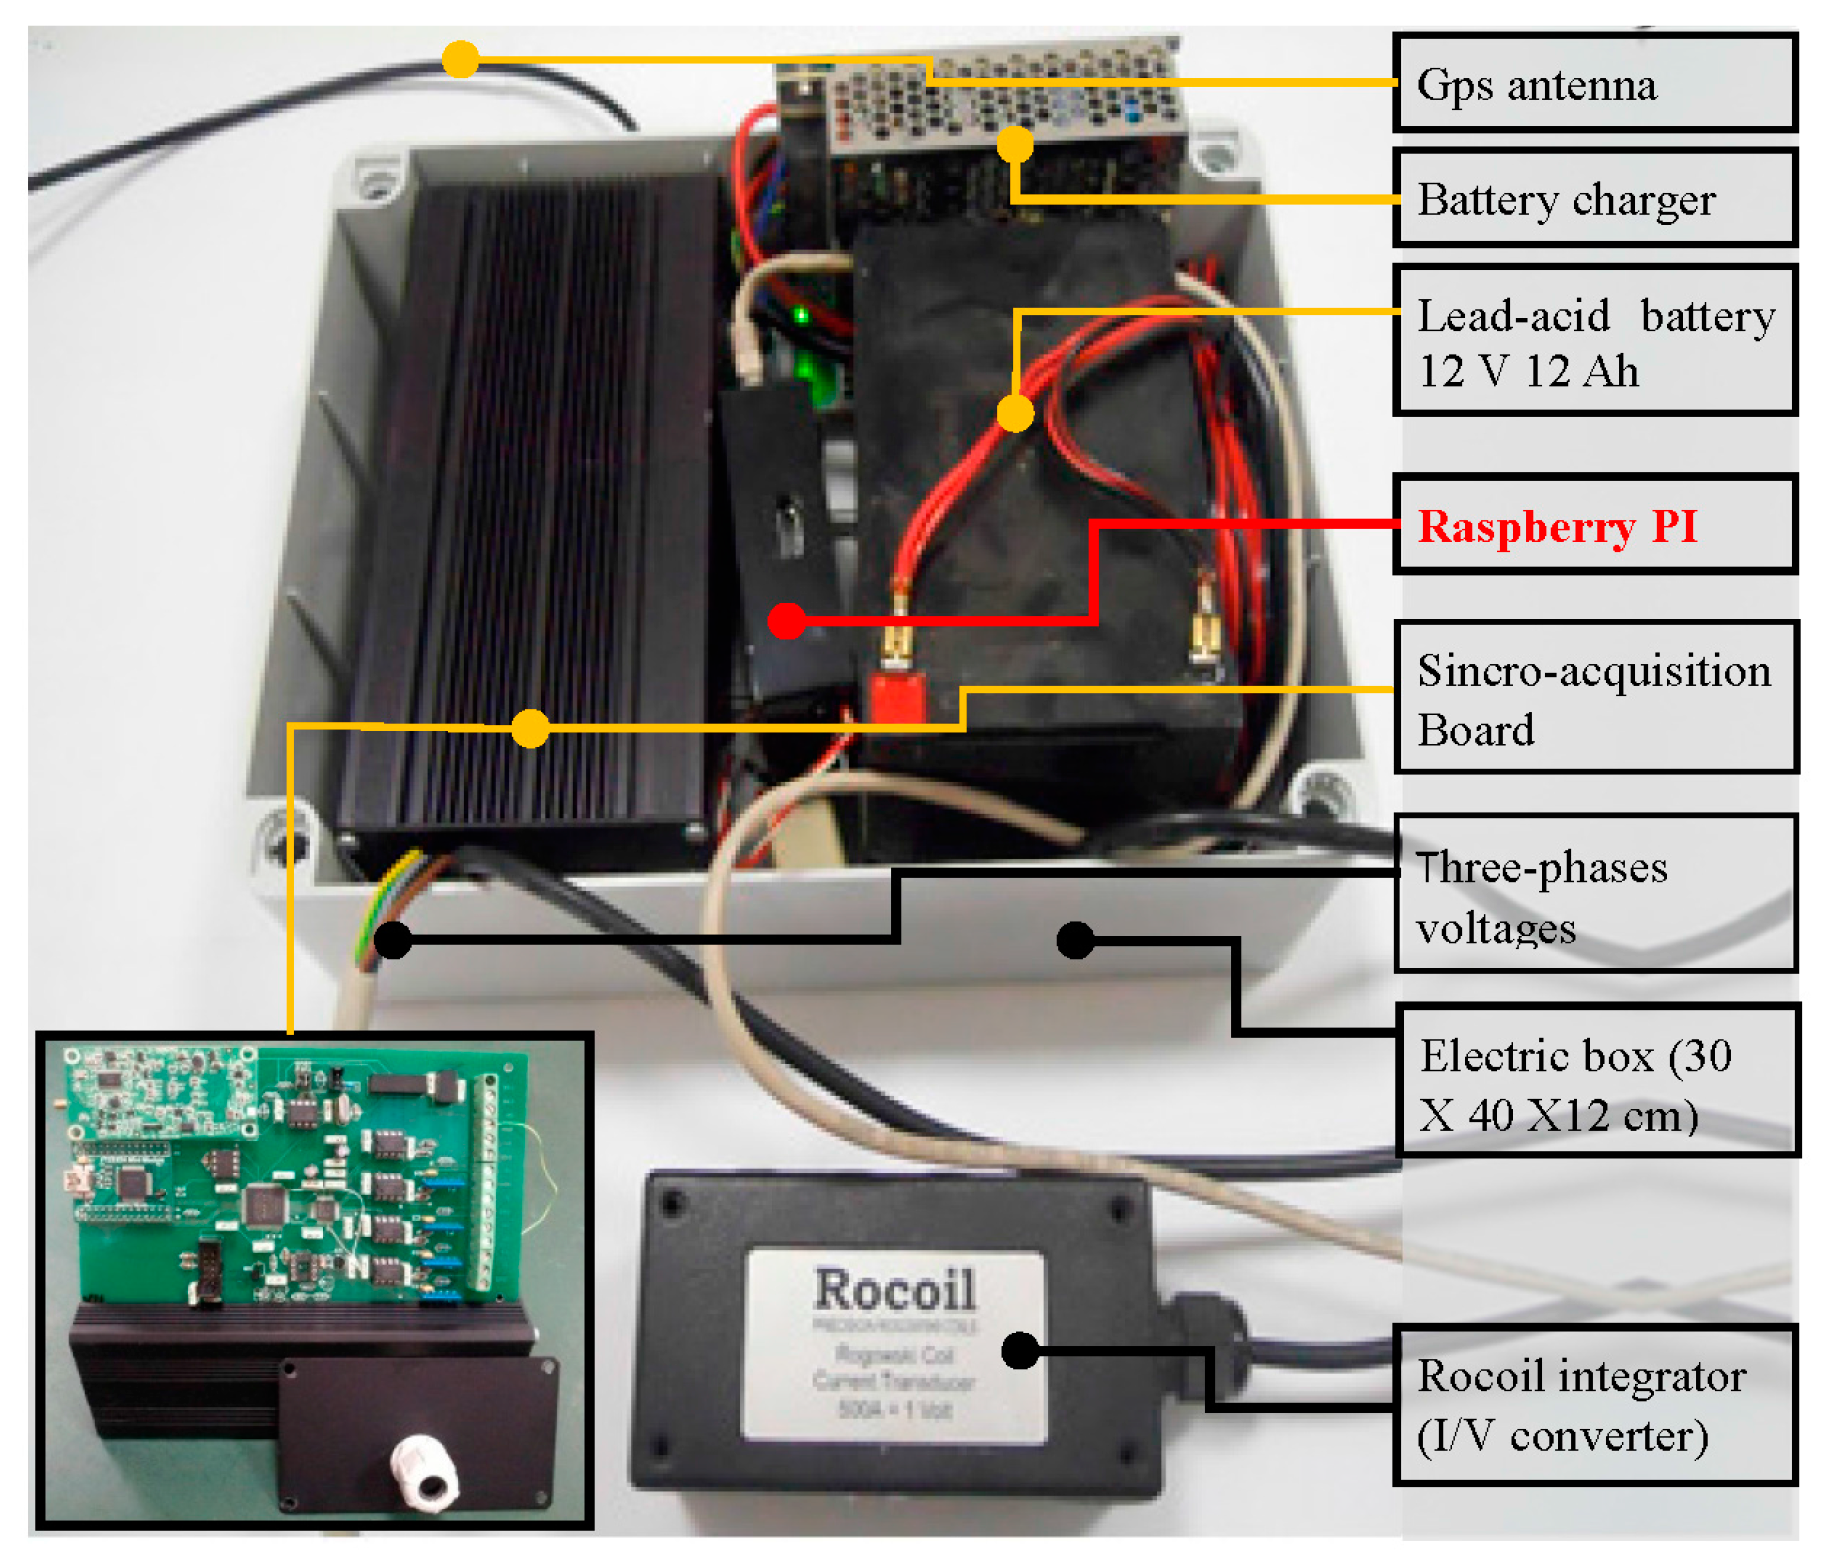
Its dimensions are about nine times less than the PC; this, joined with the reduced dimensions of the battery, allows for the reduction of the overall dimensions of the instrument that is now encased in a box of 30 cm × 40 cm × 12 cm. This allows its easier positioning inside uncomfortable sites.
It costs less than half that of a PC. Summing this cost reduction with the lower cost of the battery and the box, the instrument cost is lowered by 60% (from about 2000 to 600 Euros).
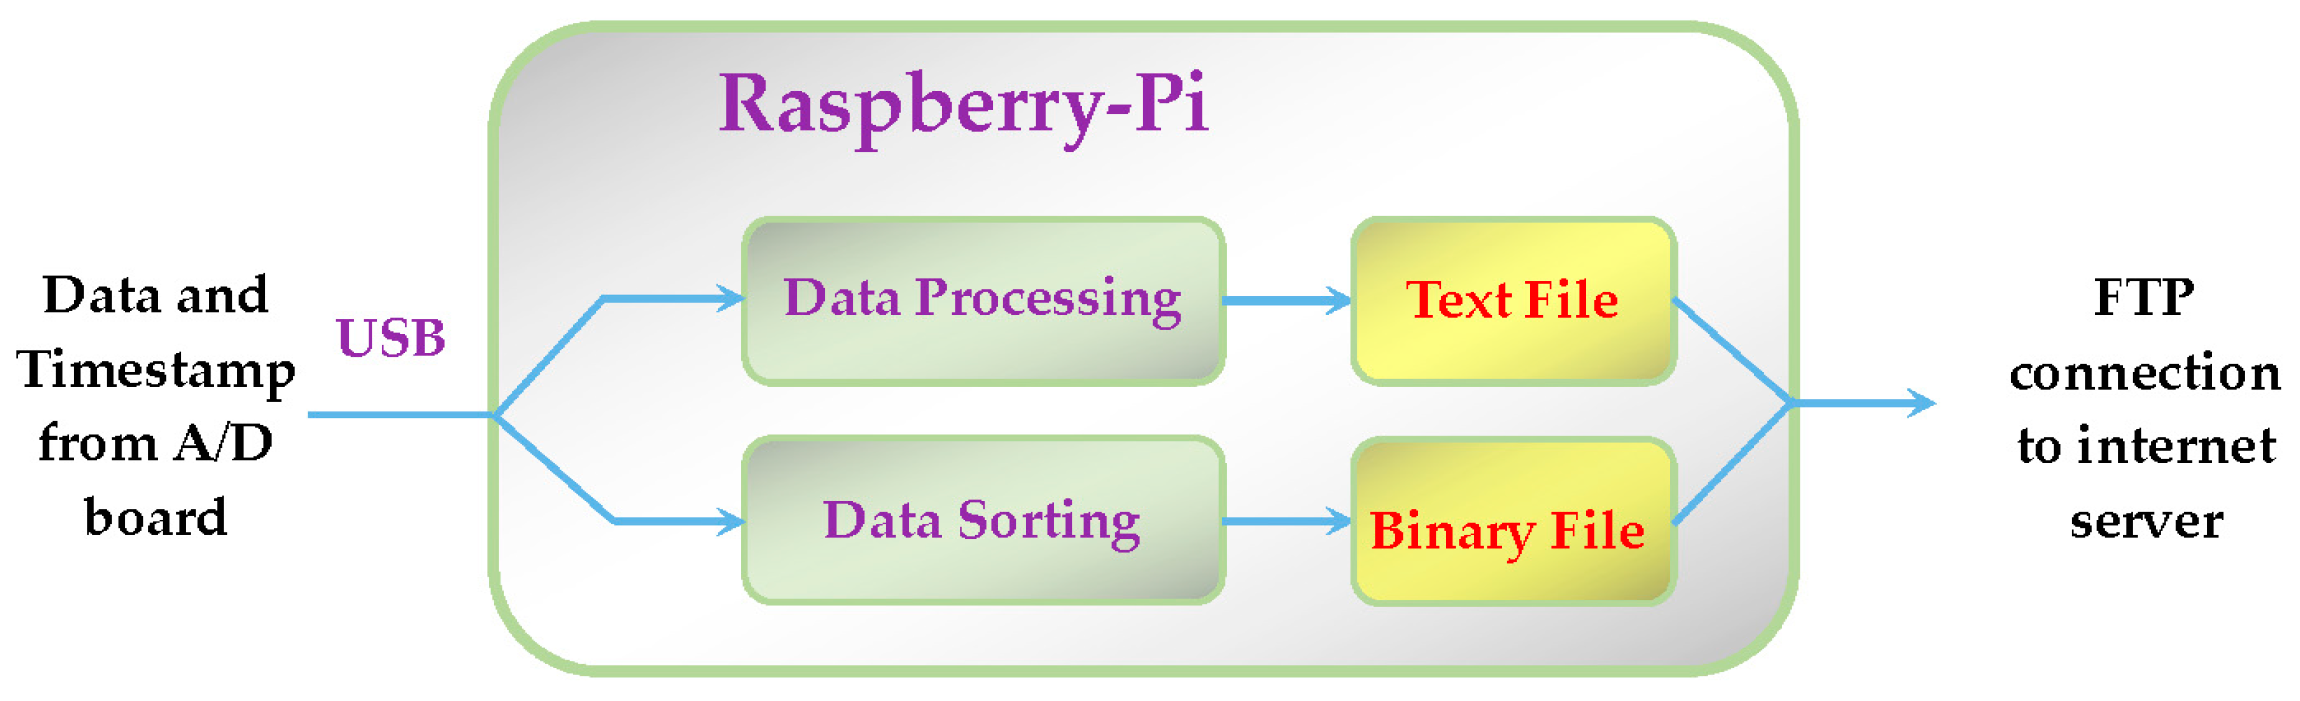
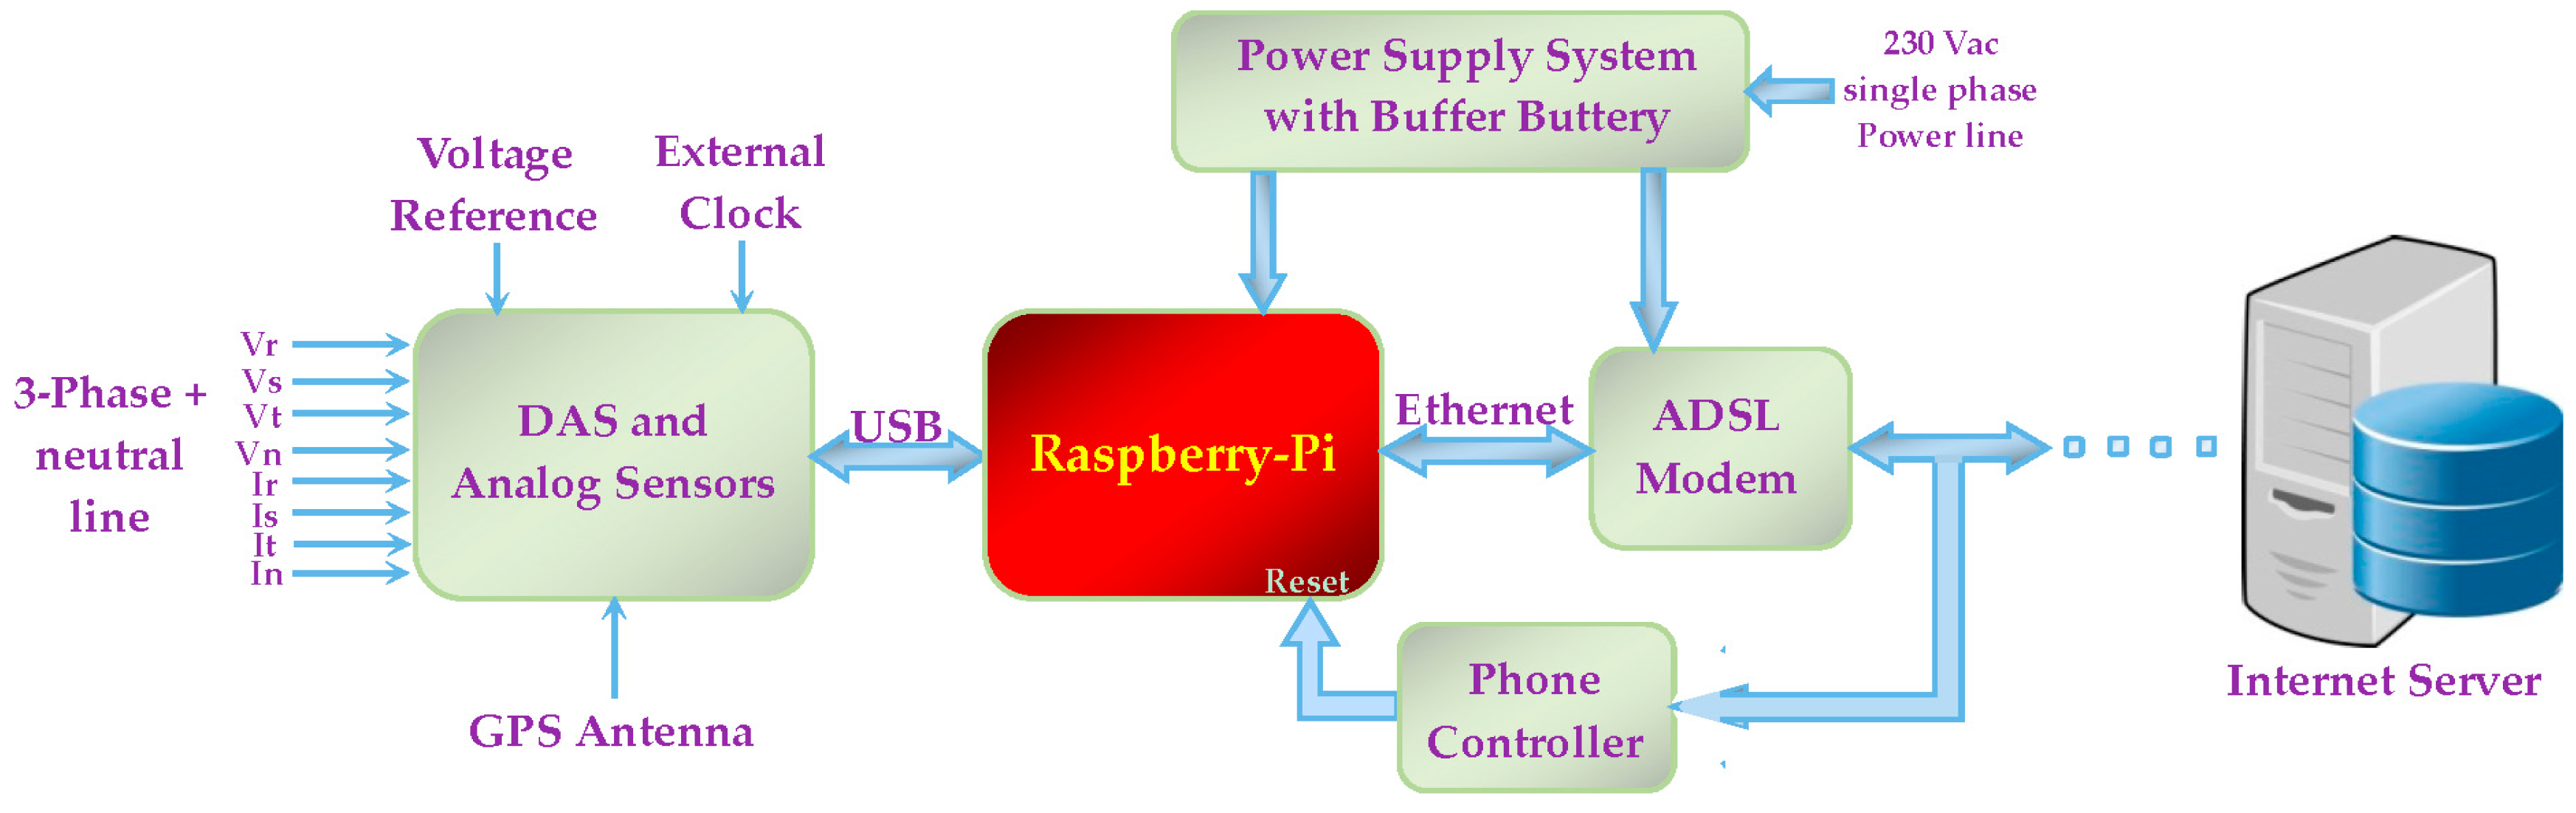
Figure 4 shows the new architecture of the instrument in which the Raspberry is highlighted.
As is possible to see, in this new architecture, the Raspberry has the fundamental role of control of the acquisition, of data storage, and of data transmission to the Internet server. All the activities previously performed by the PC are now fully satisfied by the Raspberry, including data elaboration. The functional diagram of the algorithms that run on the Raspberry is represented in
Figure 5.
As
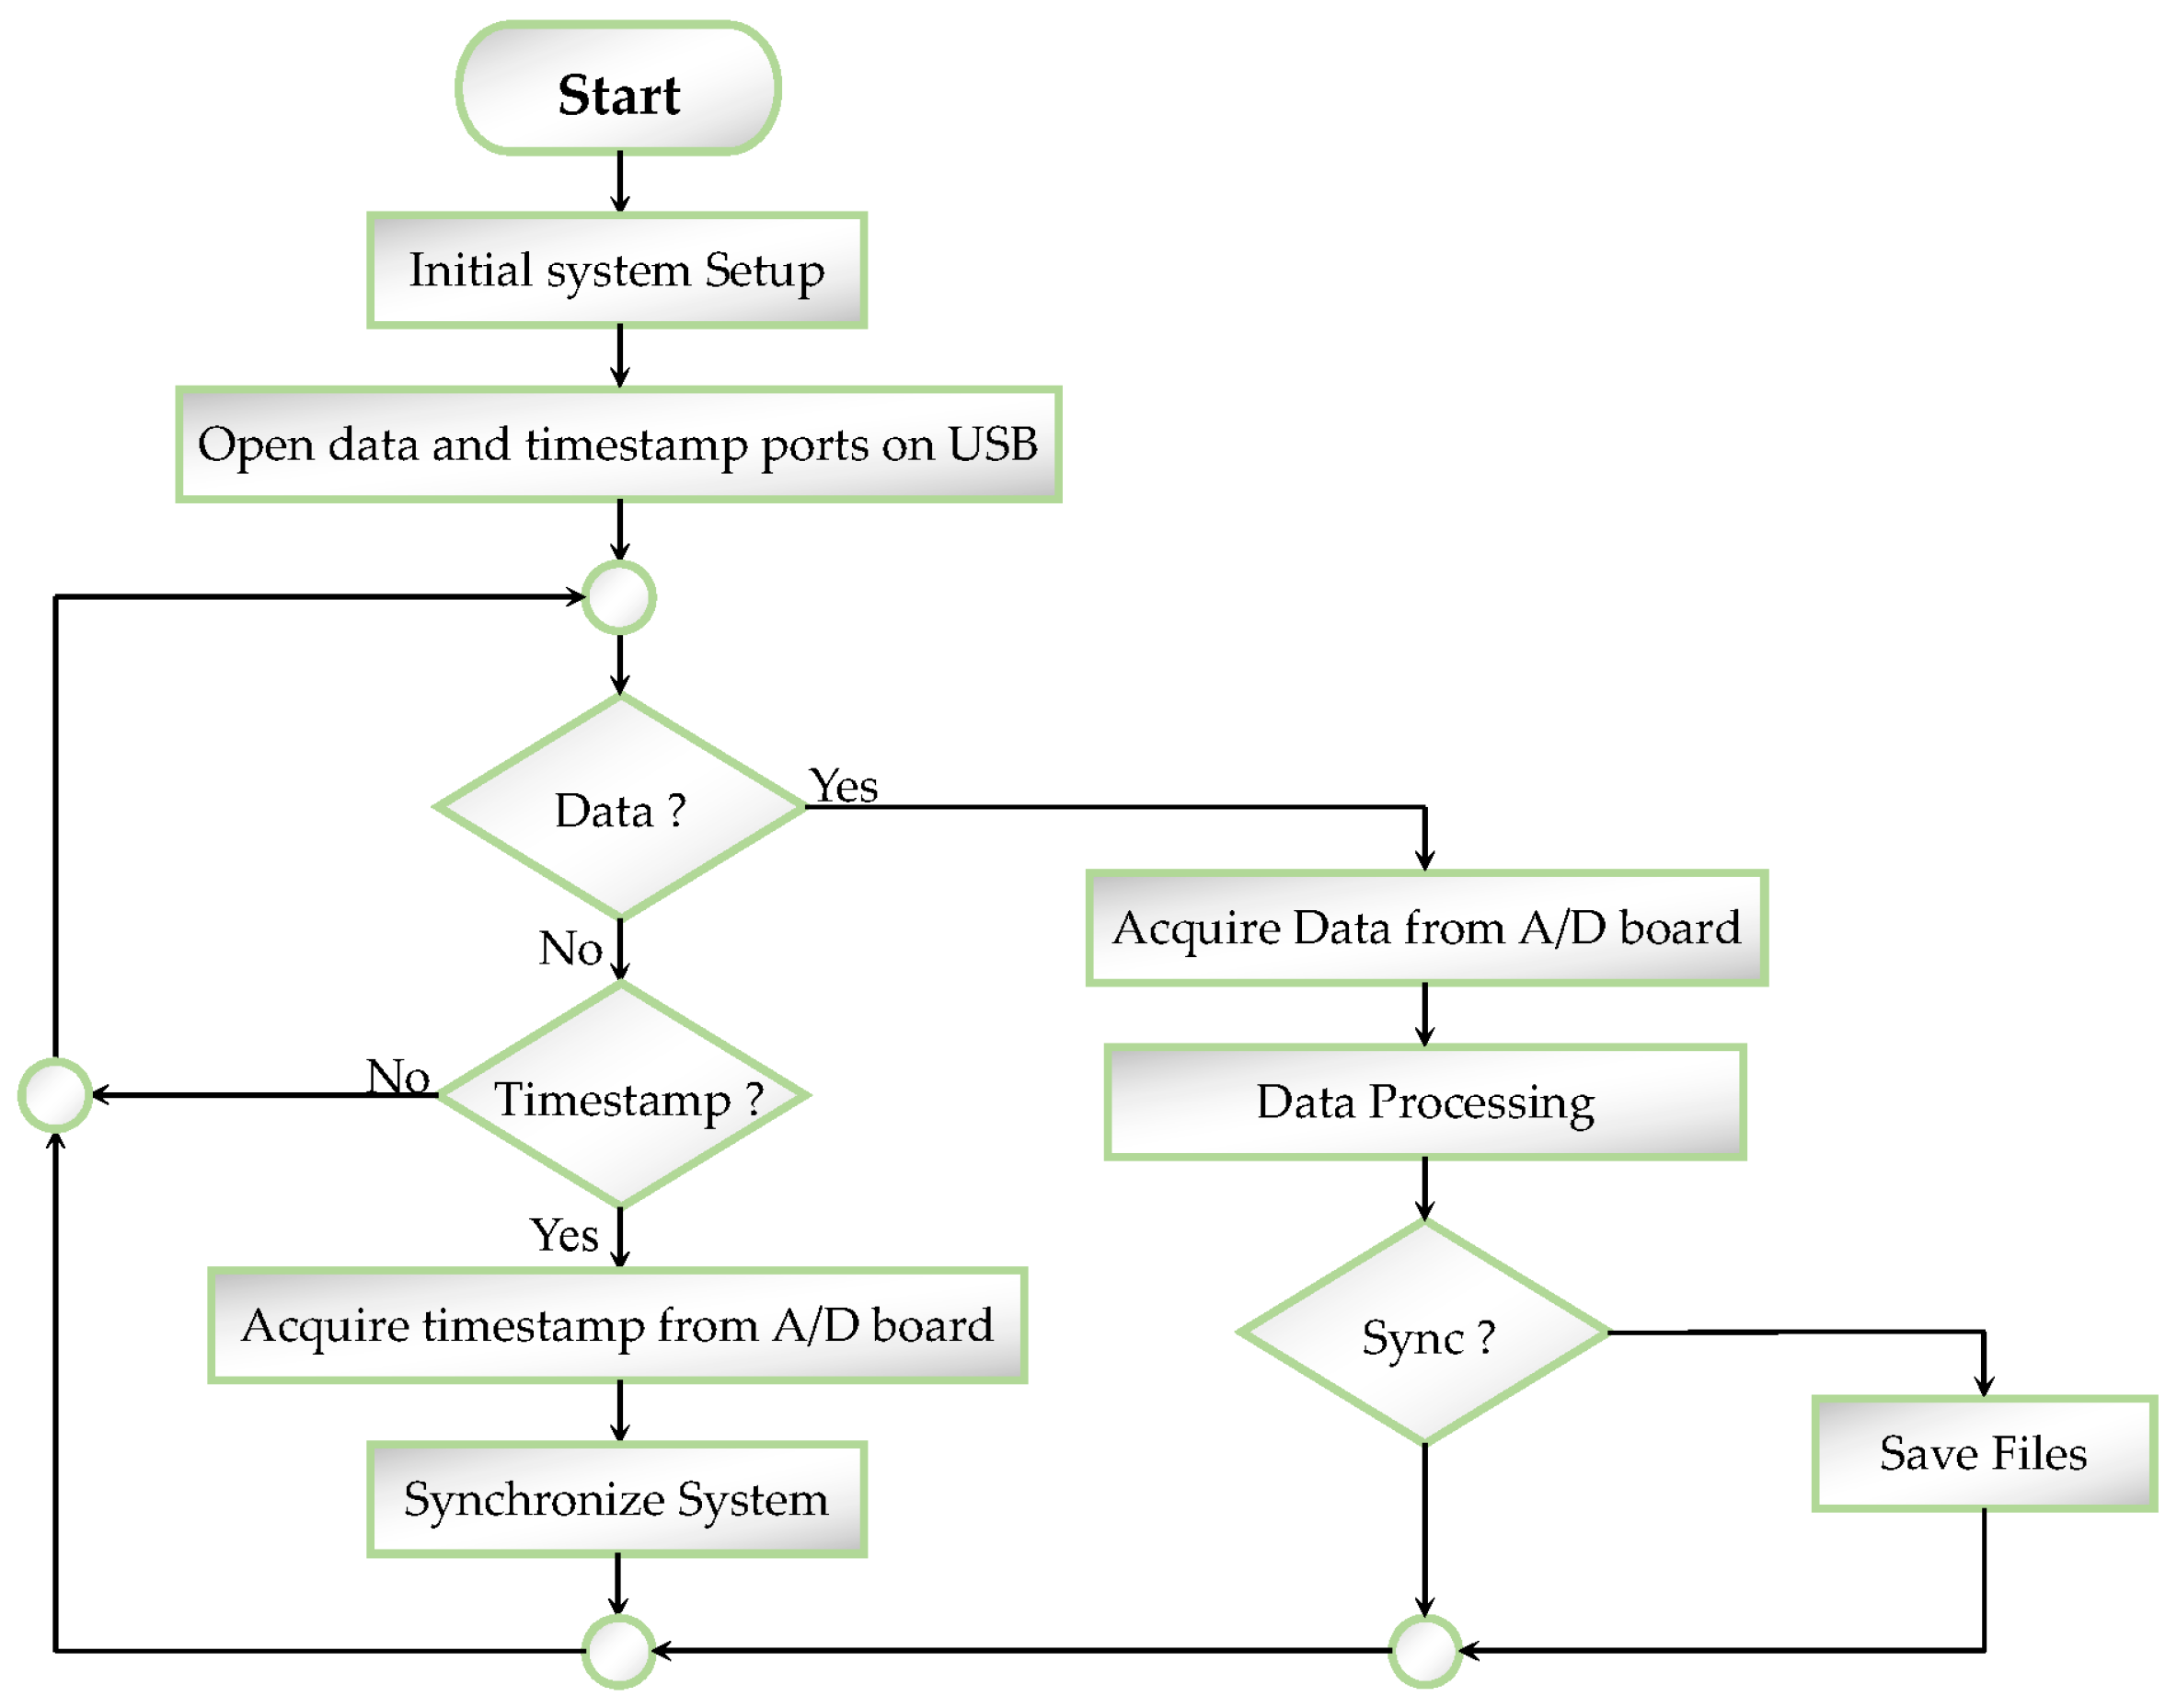
Figure 5 shows, the Raspberry performs both the role of data processing and the role of data sorting. It manages all acquisition chains up to the elaboration of the data, and builds the text files and the binary files ready to be sent to a remote server. In the binary files, there are raw data, and they are stored only when the limits of the PQ parameters are exceeded; instead, in the text files, there are elaborations that give summary information on the PQ parameters.
A more explicit flux diagram shows the single steps of the programs that run in the Raspberry-Pi (see
Figure 6).
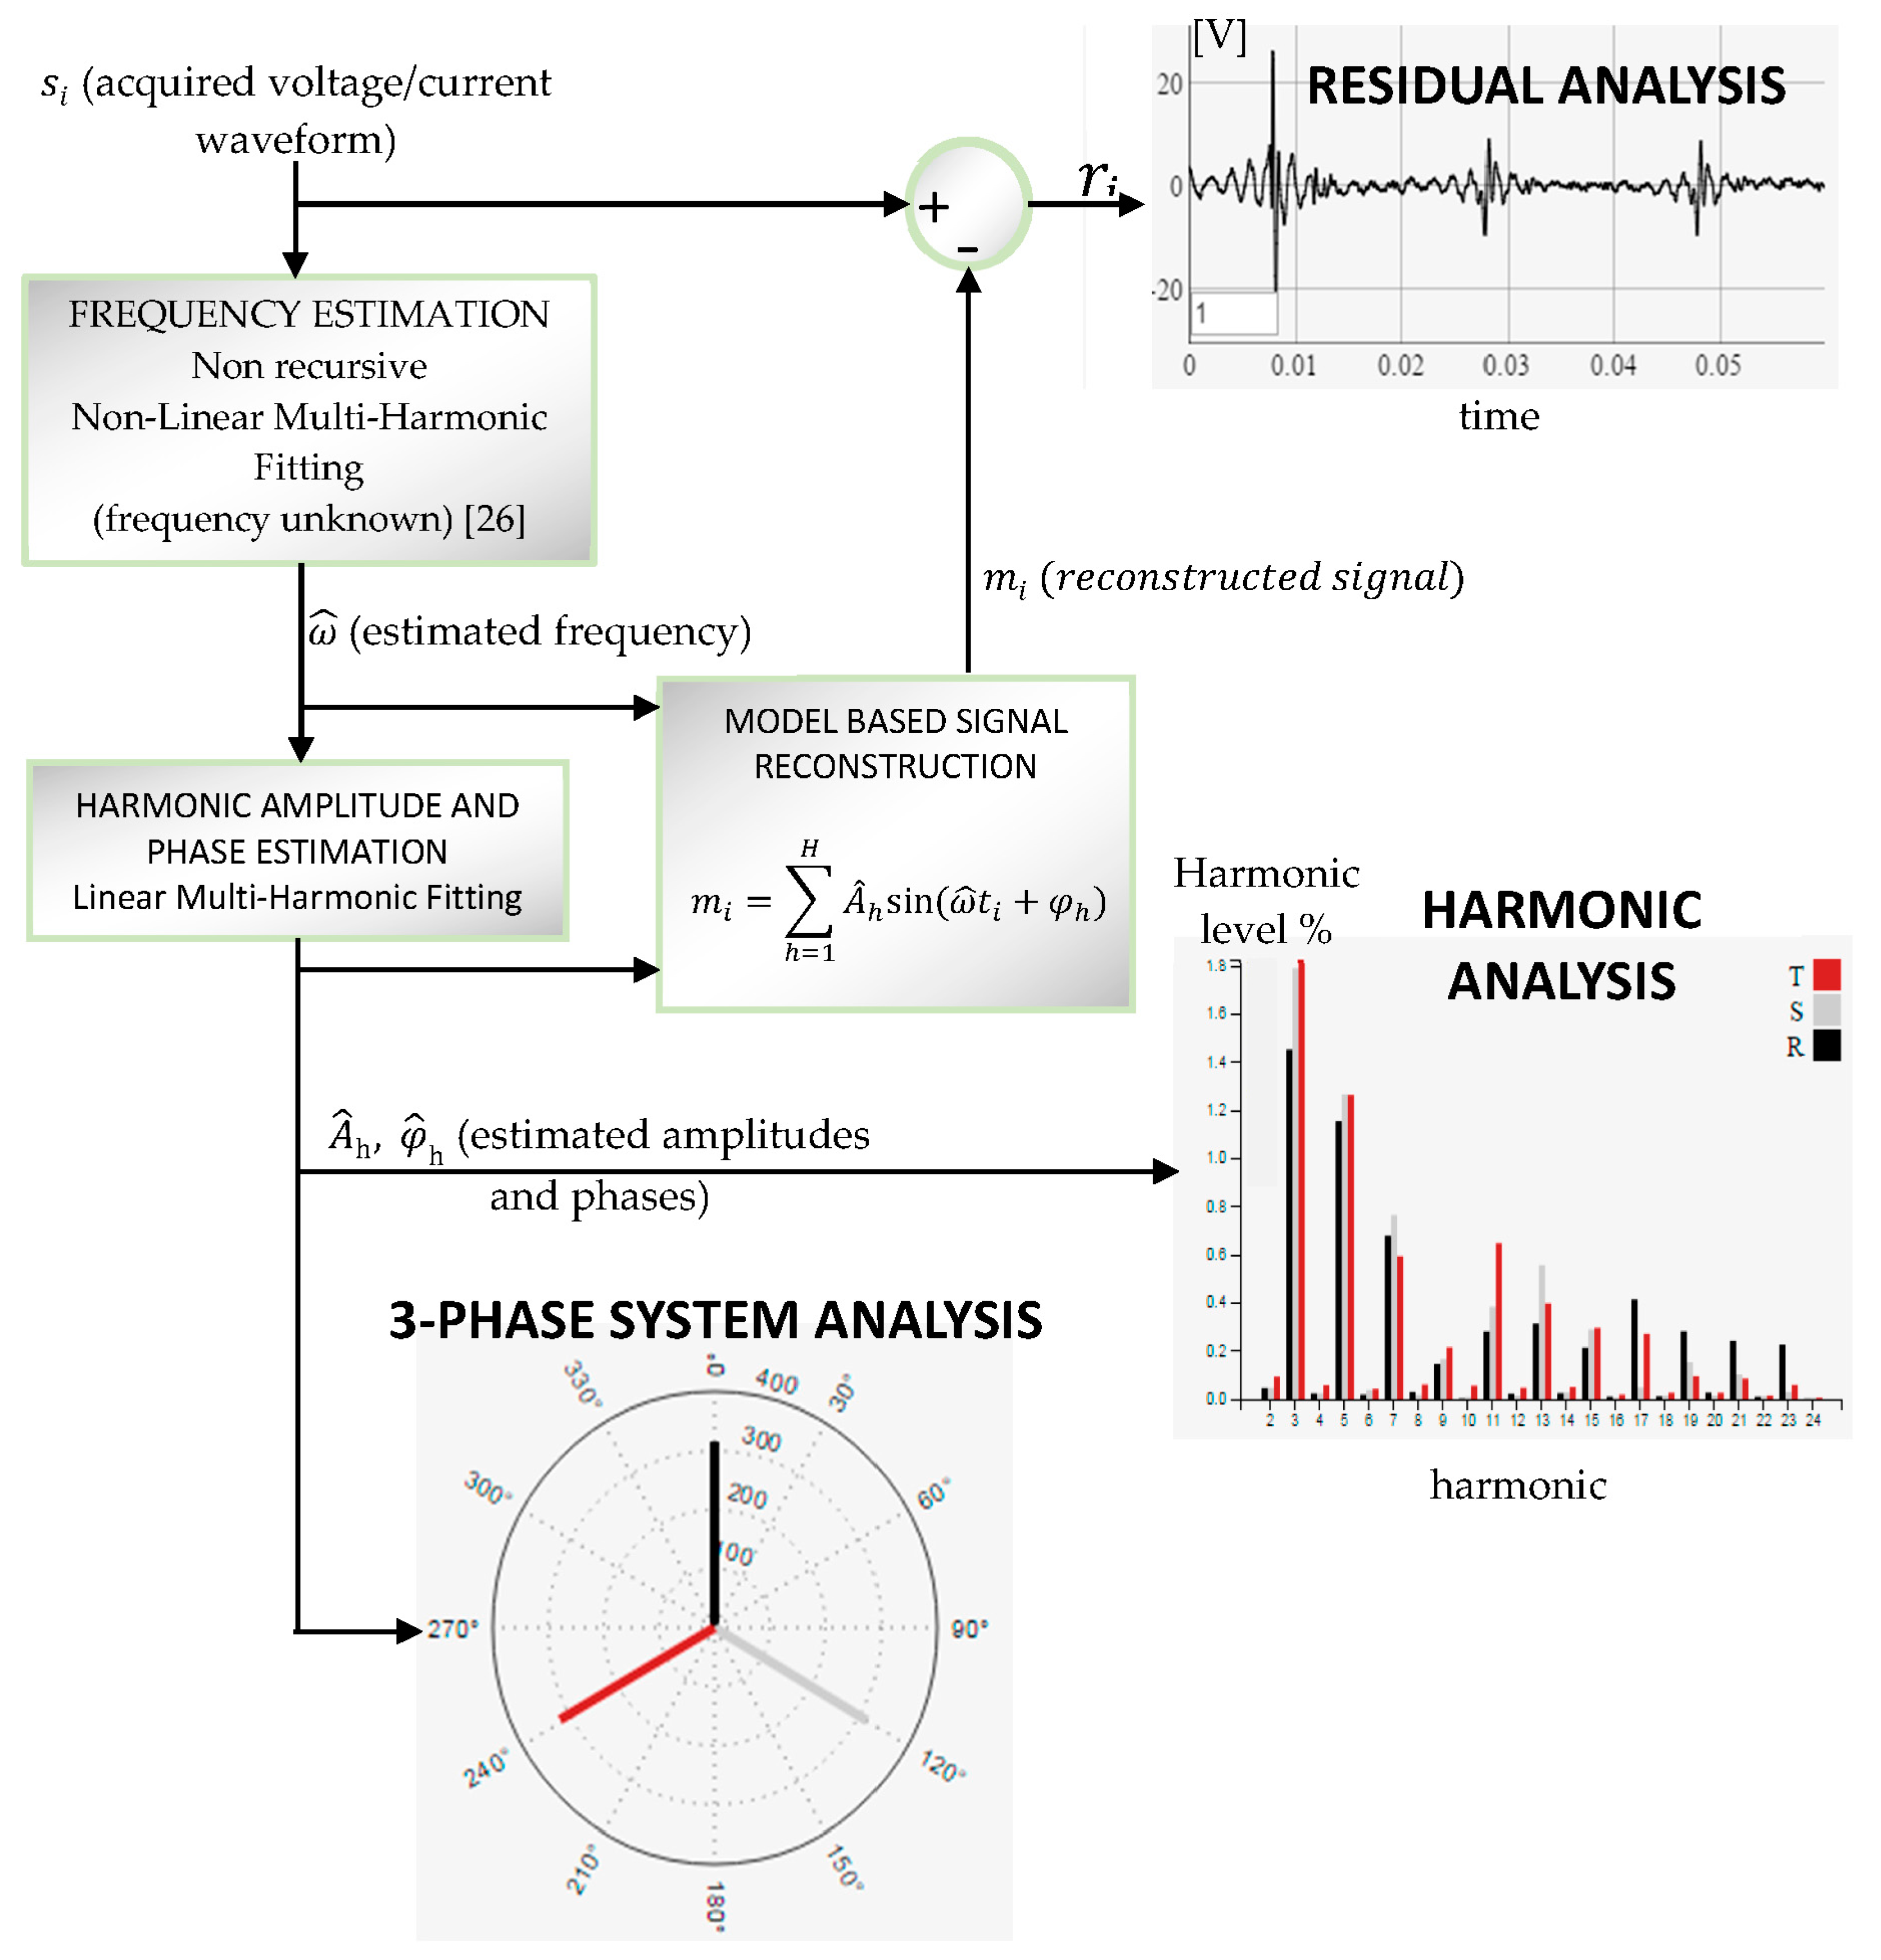
The most important step in the last flow chart is the data processing.
Figure 7 shows a schematic representation of the signal processing implemented. Once the signal samples
si is acquired, the fundamental frequency
is estimated. The algorithm used for the estimation of the frequency is the multi-harmonic least squares fitting [
4,
22,
24]. Compared with the more widely used methods such as FFT and zero crossing [
4,
22,
24,
27], these methods do not require a coherent sampling and produce good estimations also acquiring few cycle of the fundamental [
4,
22,
24,
27]. To reduce the computational burden of the algorithm, a non-recursive approach presented in [
28] was used.
Knowledge of the frequency allowed for the estimation of the amplitudes and the phases of the harmonics simply solving a linear system [
42]. These characteristics provide the harmonic analysis as shown in the harmonic analysis graph in
Figure 7. The amplitudes and phases of the three-phase system produce information in order to study the unbalance and the symmetry of the system, as shown in the three-phase system analysis graph in
Figure 7.
Moreover, the phases and the amplitudes of the harmonics are used to reconstruct the signal using a multi-harmonic model. The difference between the acquired signal and the reconstructed one only has the non-harmonic components, as shown in the residual analysis graph in
Figure 7. For this reason, the residual analysis is useful for studying interharmonics, subharmonics, and transients.
An interface to show the results of the processing was implemented. A screenshot of this interface is shown at the end of the article.
At the end, an image of the system is shown in
Figure 8.
4. Discussion
The use of the Raspberry-Pi to replace the PC allowed for many advantages as the reduction of the overall costs and of the power consumption increased the autonomy in case of blackout.
The cost of an old probe was about €2000, while the introduction of the Raspberry allowed savings up to 60% for a final cost of €600.
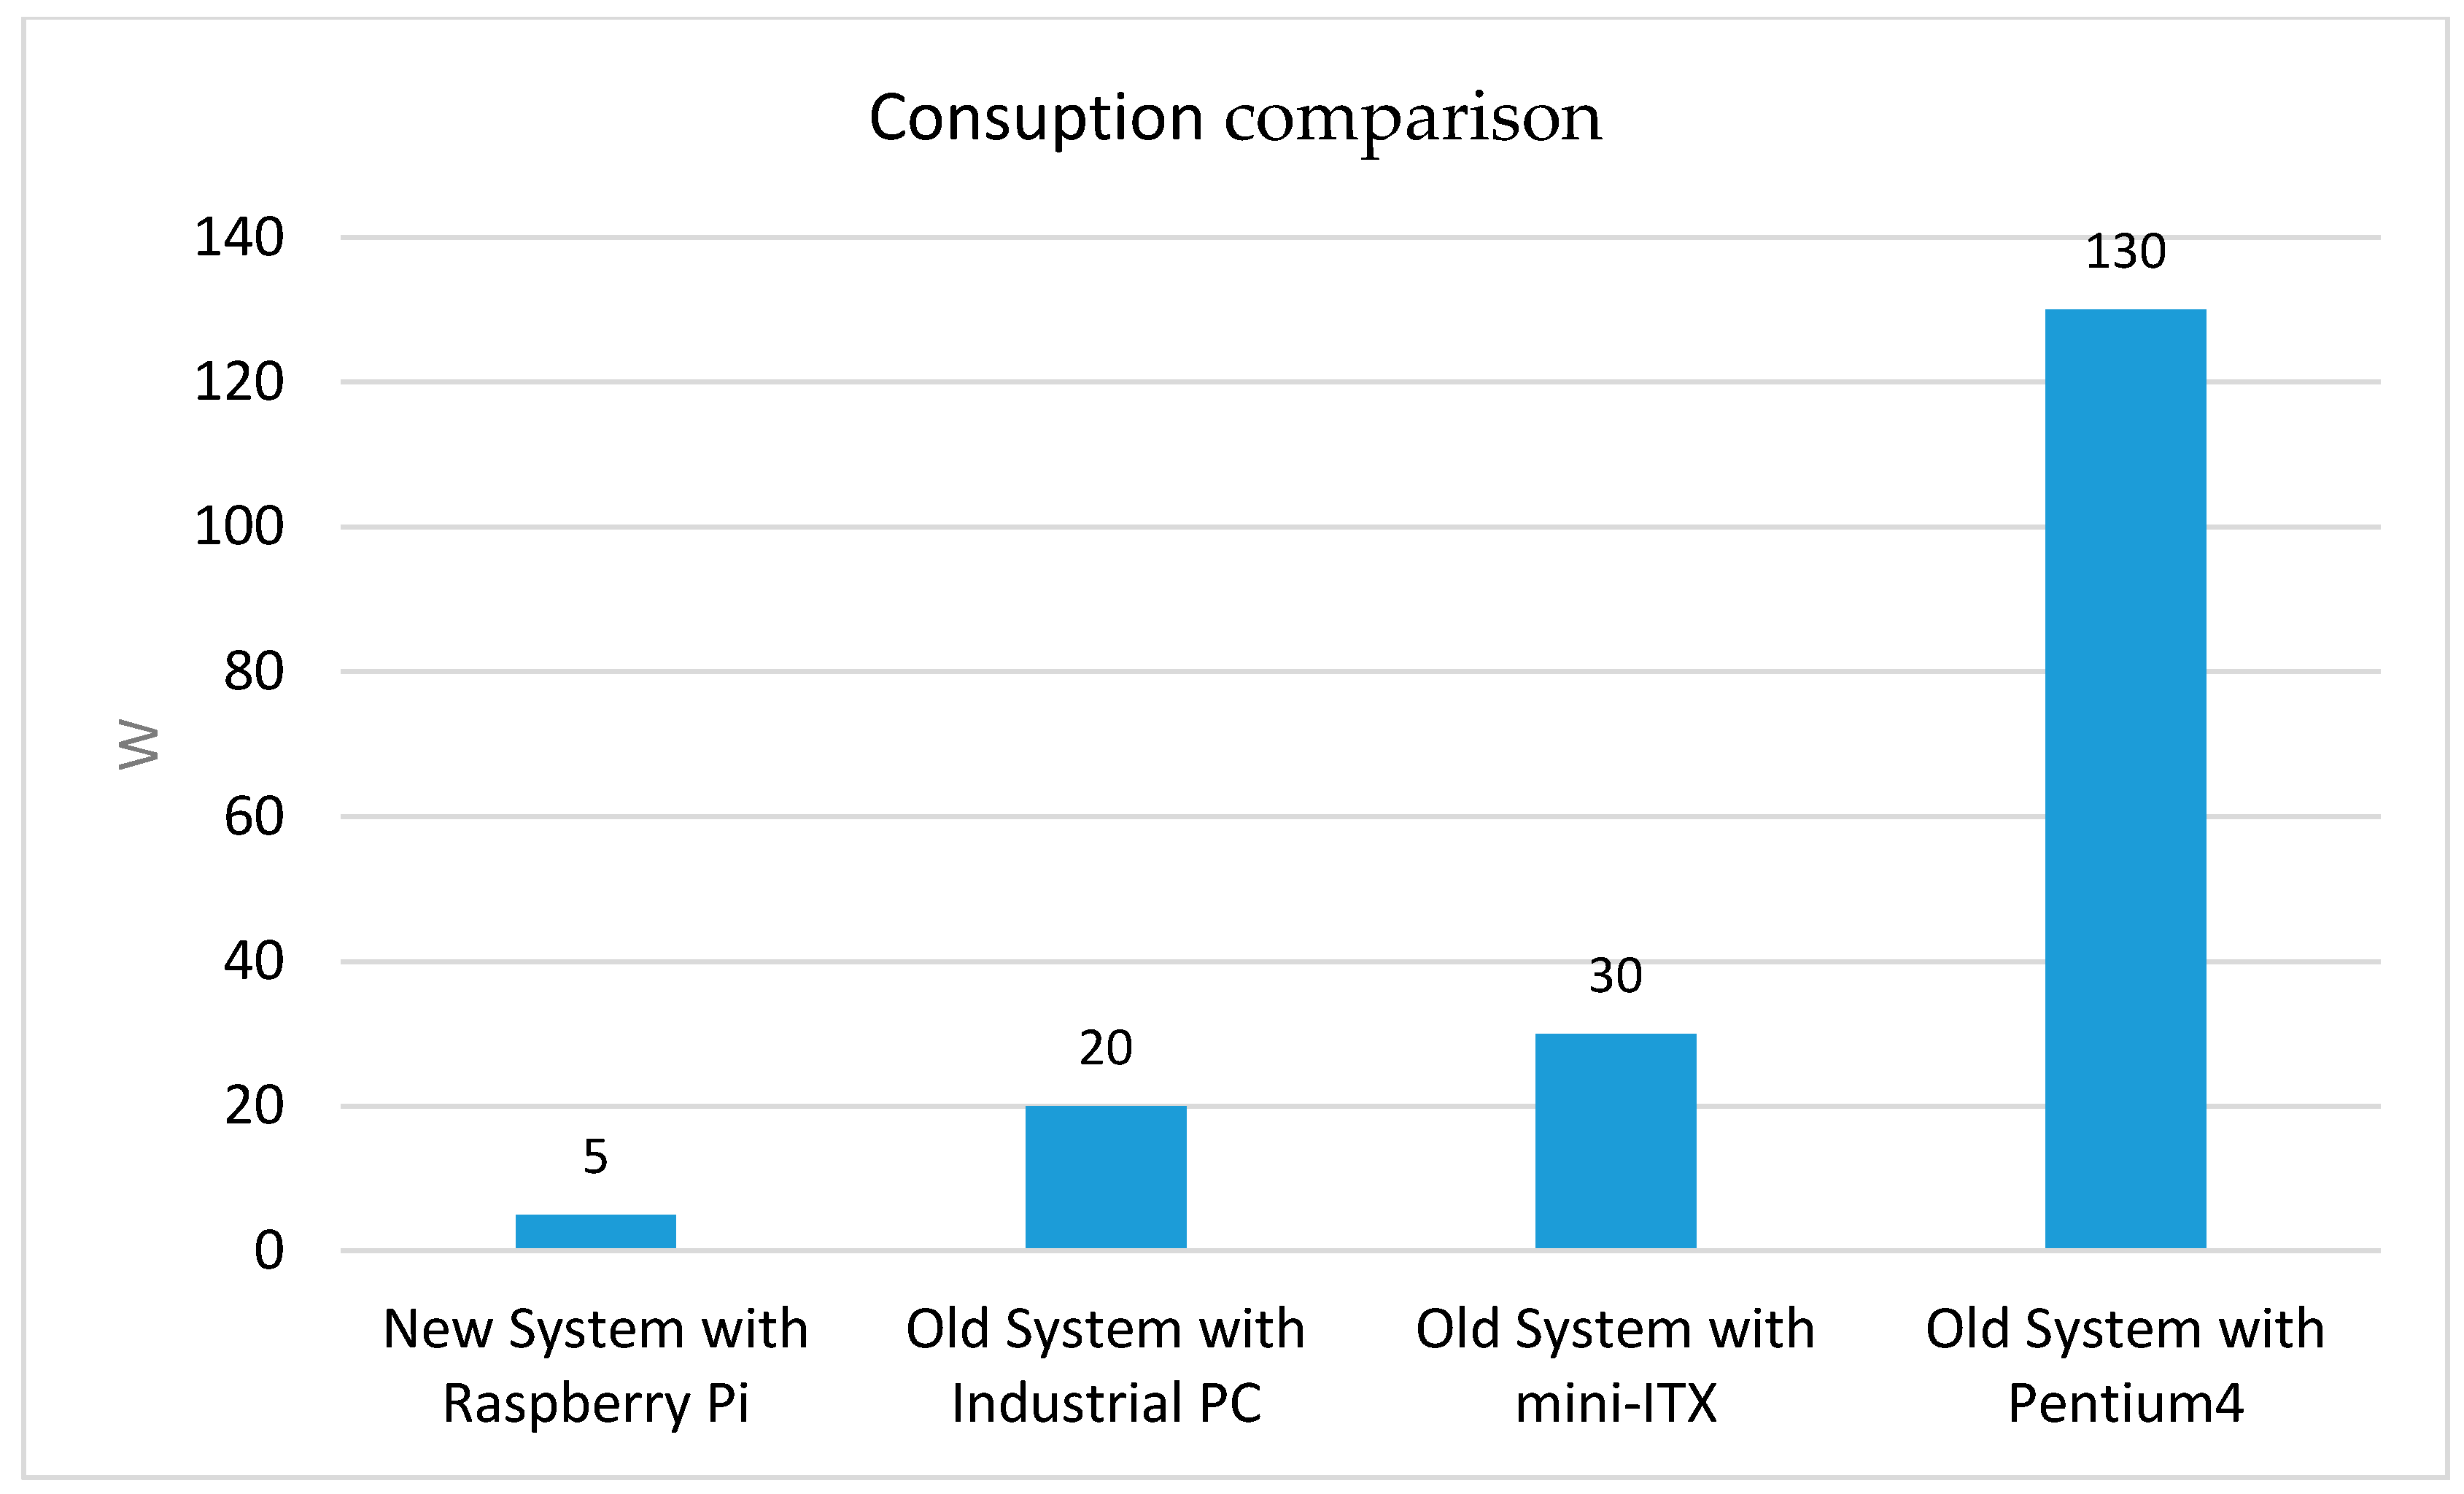
The power consumption of the whole probe was experimentally measured and was about 5 W, while the device with the ADVANTECH PC was 20 W (saving up to 75%).
Figure 9 shows the power consumption comparison between the new instrument and the previous versions.
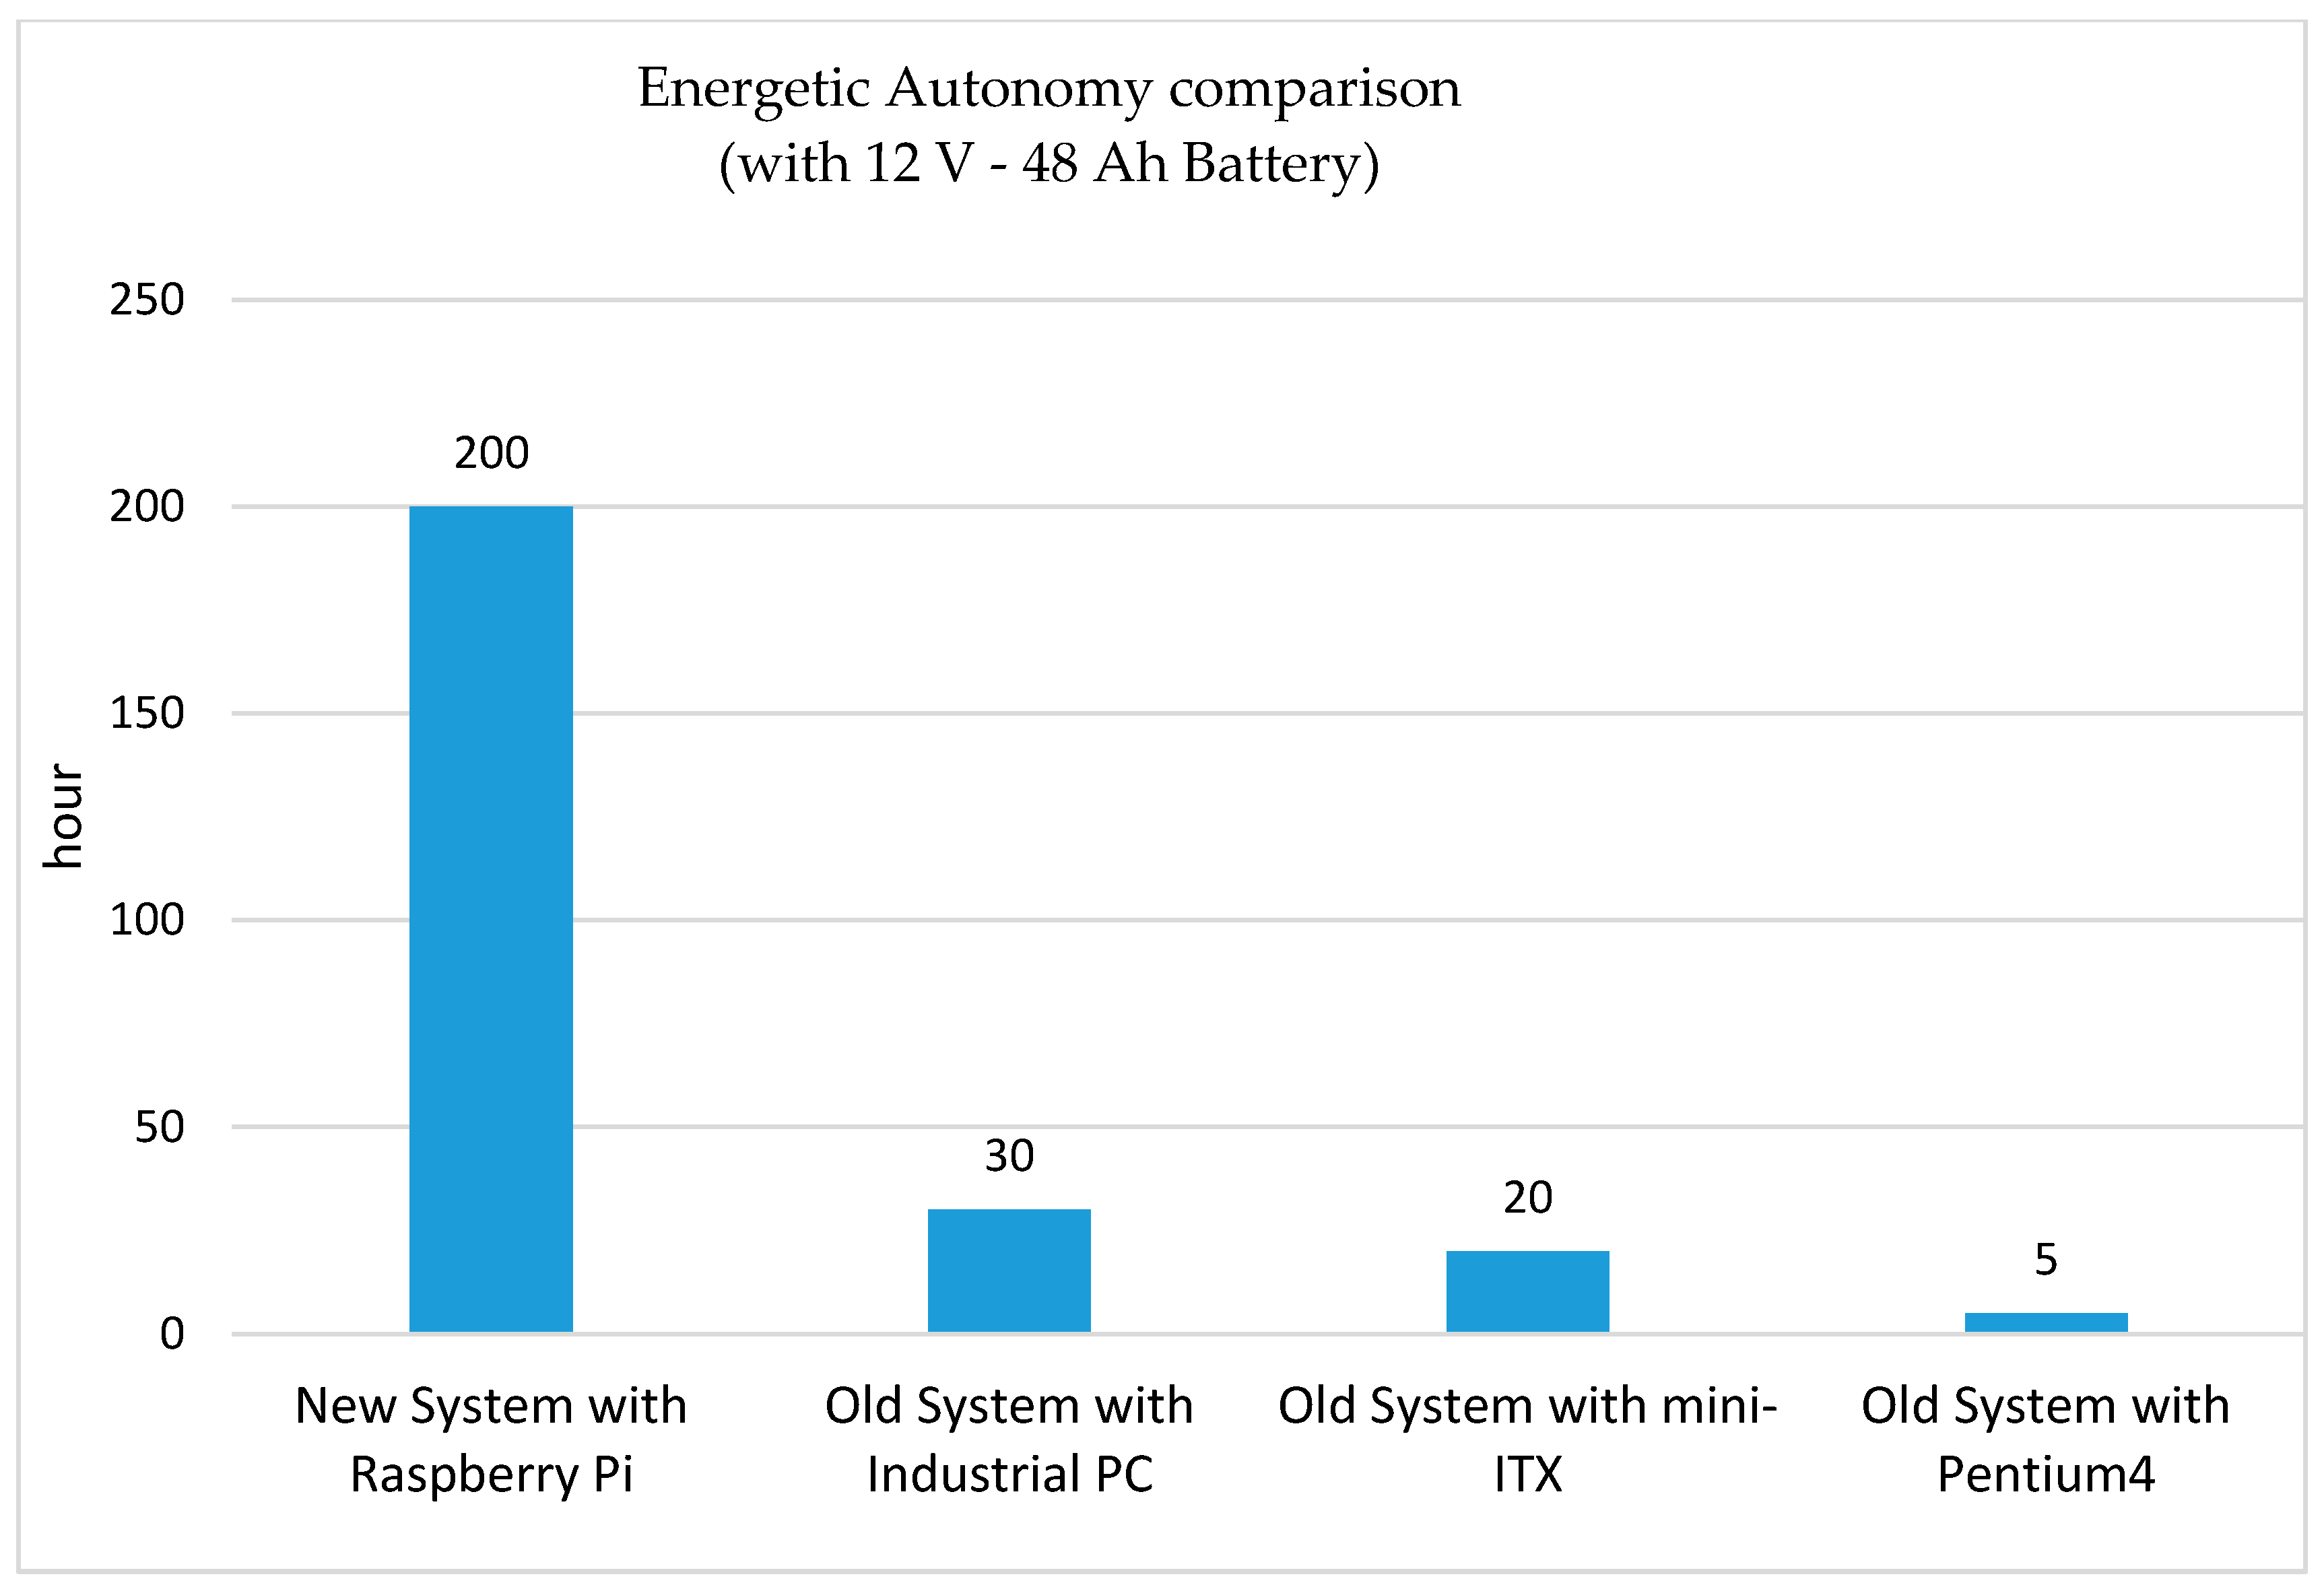
The whole system had an energetic autonomy of 36 hours in case of blackout. The last probe satisfied this requirement with a battery of 12 V and 12 Ah (experimental tests showed activity up to 48 h). Using the same battery,
Figure 10 shows the autonomy between the last version of the probe and the previous versions.
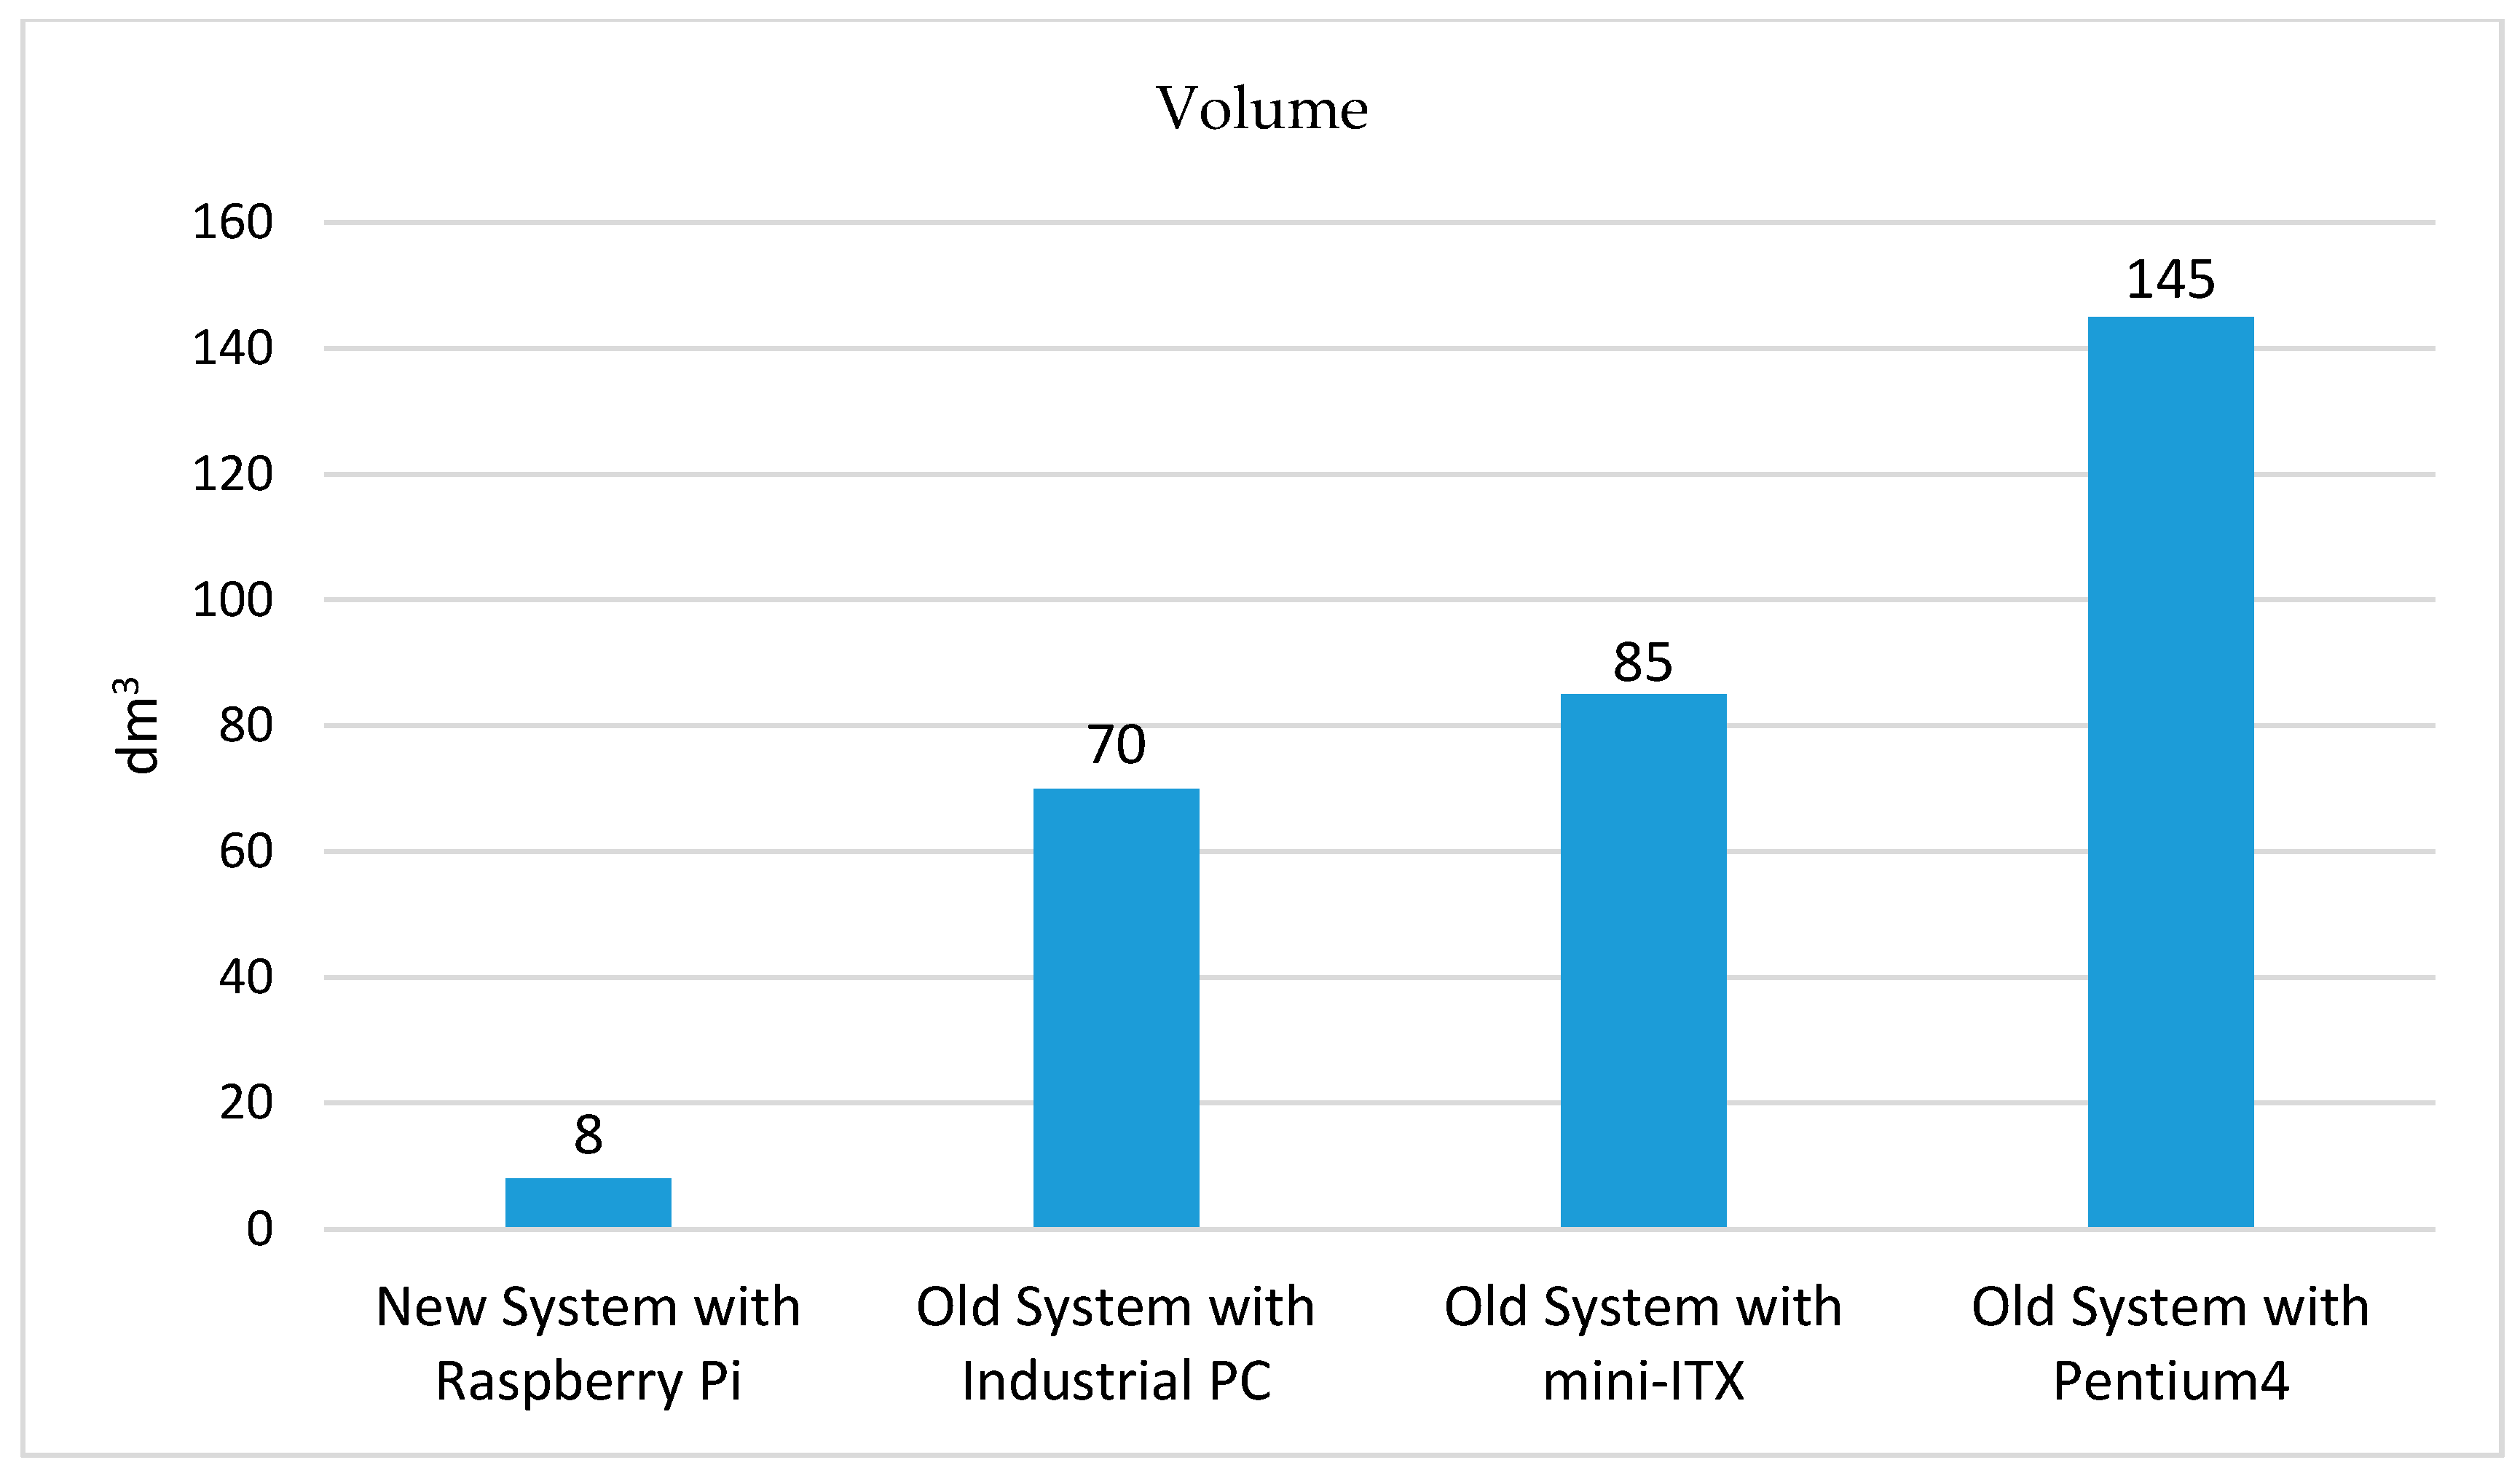
At the end,
Figure 11 shows the comparison between the dimensions of the older probes and the new version. This graph well shows how the use of the Raspberry changes the perspectives to use of the probe.
5. Application
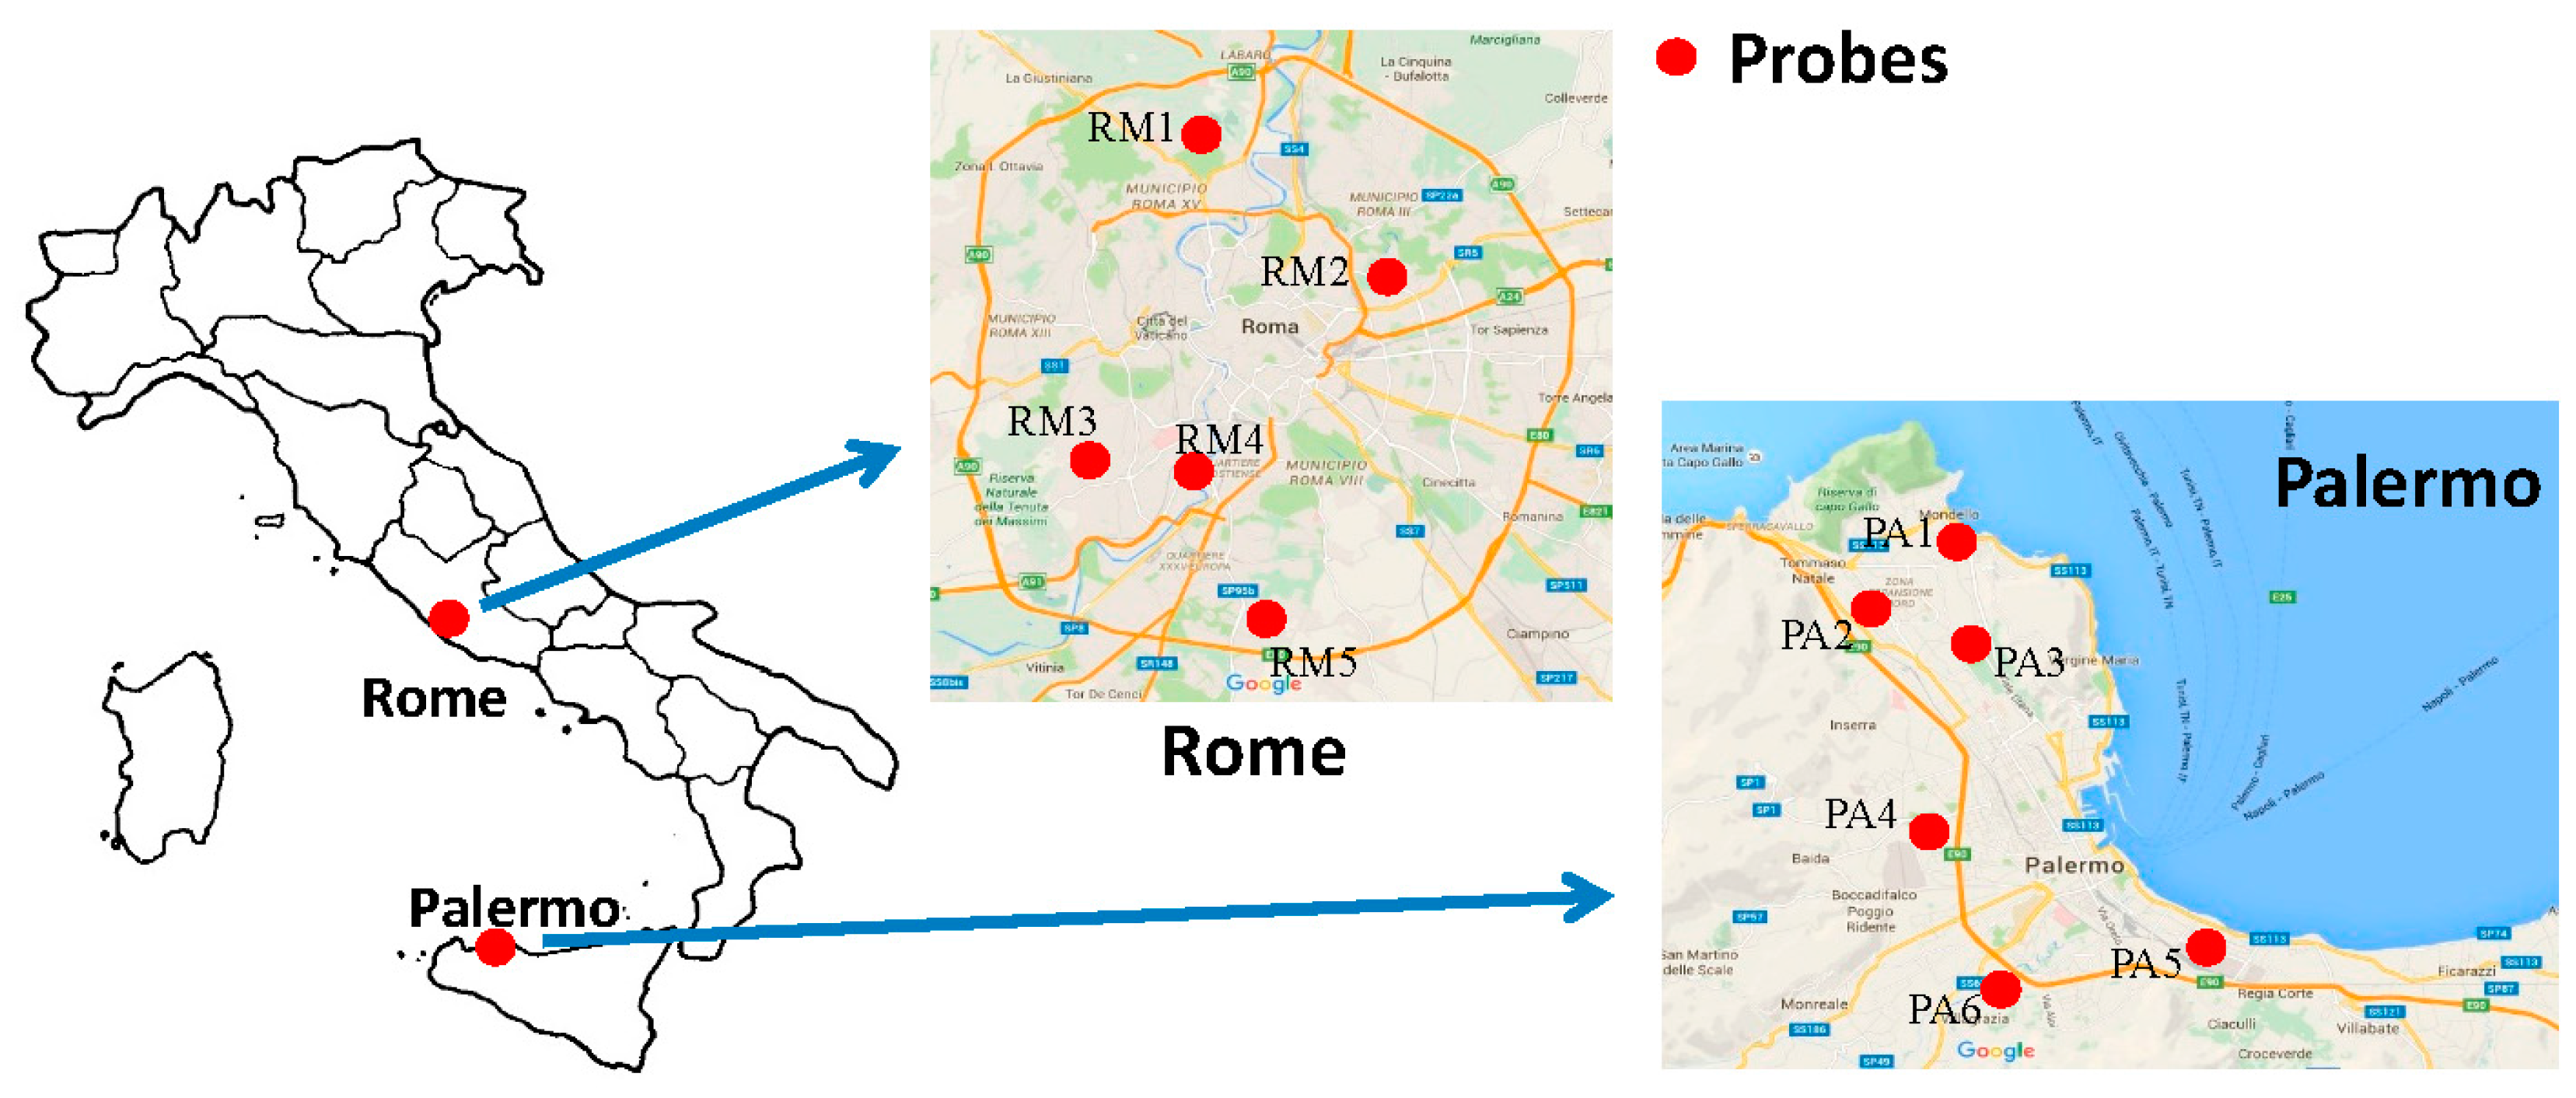
The instrument so made is active in providing information on the PQ of the mains and is part of a network of instruments already operative and distributed in Italy, as shown in
Figure 12. There are six probes placed in Palermo and five in Rome. Each probe acts independently, analyzing the mains of the transformer cabin where they are placed, and sends PQ data towards the remote server placed in Rome inside the Electric and Electronic Measurements Laboratory of “Roma Tre” University. Here, the data are stored in a database and can be visualized both locally and from a remote client using a graphical interface.
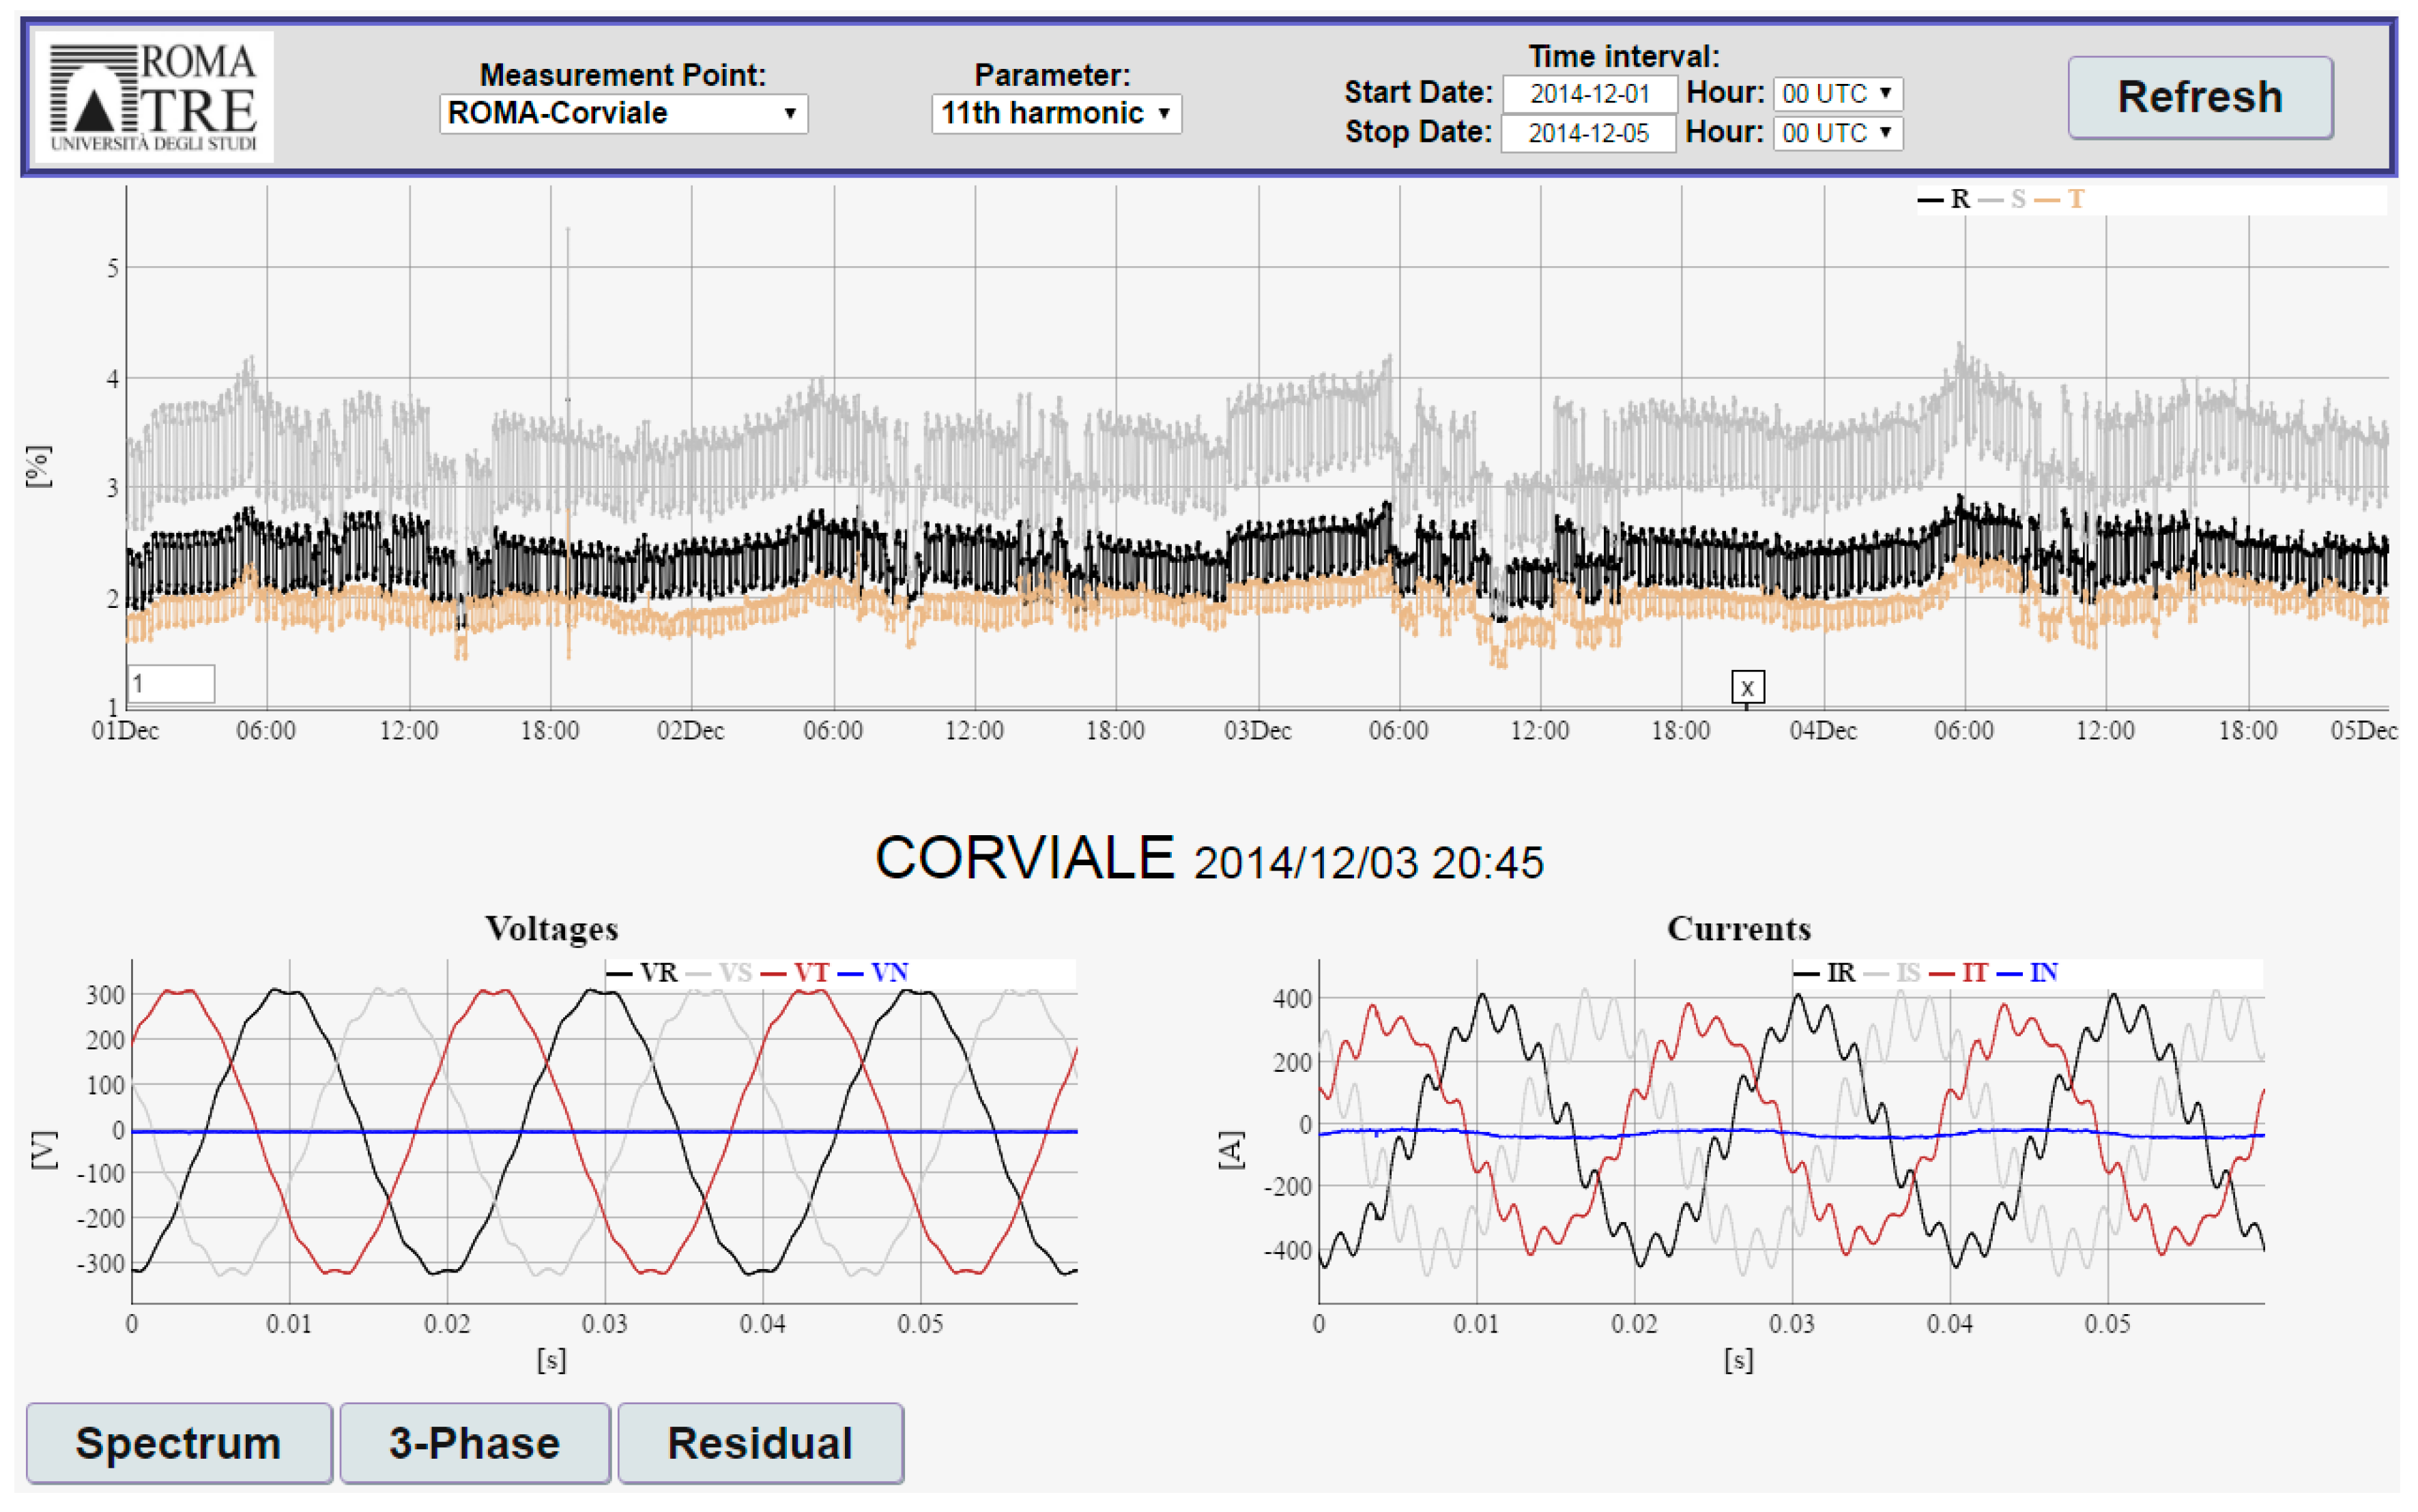
Figure 13 shows a screenshot of the data: on the top, it is possible to see the time trend of one of the measured parameters, while the recorded waveforms, in a given timestamp, are shown in the bottom of the figure. For the site called “Corviale” (probe RM3), located in Rome, the figure shows the time evolution of the 11th harmonic on the top, while the trend of the voltages and current waveforms are viewable on the bottom of the figure.
Using a graphical interface, the Raspberry can display the PQ information.
All underlying data used in this publication can be found in [
43].
6. Conclusions
A general architecture for distributed PQ monitoring foresees a wide network with many instruments that are deployed on a territory and that locally sample the mains and elaborate the data to find PQ parameters. Until now, the cost and the size of the instrument have been a disincentive to the development of this network. Instead, the characteristics of the Raspberry open new perspectives in these studies. Its performances allow for its substitution for the personal computer that has usually been used with instruments, obtaining a reduction of volume and costs.
In the future, the integration between the Raspberry and the acquisition card will allow further additional savings that will make the use of the instrument and the expansion of the PQ network easier.
Author Contributions
Fabio Leccese and Stefano Di Pasquale wrote the article; all authors contributed to realizing the instrumentation and conceiving, designing, and performing the experiments; Maurizio Caciotta, Sabino Giarnetti, and Fabio Leccese analyzed the data.
Conflicts of Interest
The authors declare no conflict of interest.
References
- Arrillaga, J.; Bradley, D.; Bodger, P.S. Power System Harmonics; John Wiley & Sons: Hoboken, NJ, USA, 1985. [Google Scholar]
- Dugan, R.C.; McGranaghan, M.F.; Santoso, S.; Beaty, H.W. Electrical Power Systems Quality; McGraw-Hill: New York, NY, USA, 1997. [Google Scholar]
- Arrillaga, J.; Smith, B.C.; Watson, N.R.; Wood, A.R. Power System Harmonic Analysis; John Wiley & Sons: Hoboken, NJ, USA, 1997. [Google Scholar]
- Caciotta, M.; Leccese, F.; Trifirò, T. From Power Quality to Perceived Power Quality. In Proceedings of the IASTED International Conference on Energy and Power Systems (EPS 2006), Chiang Mai, Thailand, 29–31 March 2006; pp. 94–102.
- Leccese, F. Subharmonics Determination Method based on Binary Successive Approximation Feed Forward Artificial Neural Network: A preliminary study. In Proceedings of the 9th International Conference on Environment and Electrical Engineering, Prague, Czech Republic, 16–19 May 2010.
- Arrillaga, J.; Watson, N.R.; Chen, S. Power System Quality Assessment; John Wiley & Sons: Hoboken, NJ, USA, 2000. [Google Scholar]
- IEC 61000-x-y (with x:1-6 and y:1-7) Electromagnetic Compatibility “Guide”, 1984–1995. Available online: http://www.iec.ch/emc/basic_emc/basic_emc_immunity.htm (accessed on 22 September 2016).
- De Abreu, J.P.G.; Emanuel, A.E. The need to limit subharmonic injection. In Proceedings of the 9th International Conference on Harmonics and Quality of Power, Orlando, FL, USA, 1–4 October 2000; Volume 1, pp. 251–253.
- Lin, D.; Batan, T.; Fuchs, E.F.; Grady, W.M. Harmonic losses of single-phase induction motors under nonsinusoidal voltages. IEEE Trans. Energy Convers. 1996, 11, 273–286. [Google Scholar] [CrossRef]
- Fuchs, E.F.; Roesler, D.J.; Masoum, M.A.S. Are harmonic recommendations according to IEEE and IEC too restrictive? IEEE Trans. Power Deliv. 2004, 19, 1775–1786. [Google Scholar] [CrossRef]
- Fuchs, E.F.; Roesler, D.J.; Alashhab, F.S. Sensitivity of electrical appliances to harmonics and fractional harmonics of the power system’s voltage, part I: Transformers and induction machines. IEEE Trans. Power Deliv. 1987, 2, 437–444. [Google Scholar] [CrossRef]
- Fuchs, E.F.; Roesler, D.J.; Kovacs, K.P. Sensitivity of electrical appliances to harmonics and fractional harmonics of the power system’s voltage, part II: Television sets, induction watthour meters and universal machines. IEEE Trans. Power Deliv. 1987, 2, 445–453. [Google Scholar] [CrossRef]
- Leccese, F. Subharmonics determination method based on binary successive approximation feed forward artificial neural network: A first improvement. Prz. Elektrotech. 2010, 86, 18–22. [Google Scholar]
- Fuchs, E.F. Power Quality in Power Systems and Electric Machines; ECEN 5787 Course Notes; Department of Electrical and Computer Engineering, University of Colorado: Boulder, CO, USA, 2005. [Google Scholar]
- Fuller, J.F.; Fuchs, E.F.; Roesler, D.J. Influence of harmonics on power system distribution system protection. IEEE Trans. Power Deliv. 1988, 3, 546–554. [Google Scholar] [CrossRef]
- IEEE 1159: Recommended Practice on Monitoring Electric Power Quality. 1995. Available online: http://ieeexplore.ieee.org/document/5154067/?part=1 (accessed on 22 September 2016).
- Barros, J.; de Apraiz, M.; Diego, R.I. Measurement of Subharmonics in Power Voltages. In Proceedings of the Power Tech 2007, Lausanne, Switzerland, 1–5 July 2007.
- Henryk, M.; Antoni, K. CEI EN 50160: Voltage Characteristics of Electricity Supplied by Public Distribution Systems; Copper Development Association: New York, NY, USA, 2004. [Google Scholar]
- Caciotta, M.; Giarnetti, S.; Lattanzi Cinquegrani, G.; Leccese, F.; Trinca, D. Development and characterization of a multi-platform Data Acquisition System for Power Quality metrological certification. In Proceedings of the International Conference on Renewable Energies and Power Quality (ICREPQ´11), Las Palmas de Gran Canaria, Spain, 13–15 April 2011.
- Caciotta, M.; Giarnetti, S.; Leccese, F.; Trinca, D. Development of an USB Data Acquisition System for Power Quality and Smart Metering applications. In Proceedings of the 11th International Conference on Environment and Electrical Engineering, Venice, Italy, 18–25 May 2012.
- Leccese, F. Rome: A First Example of Perceived Power Quality of Electrical Energy. In Proceedings of the Seventh IASTED International Conference on Power and Energy Systems, Palma de Mallorca, Spain, 29–31 August 2007; pp. 169–176.
- Leccese, F. Analysis of Power Quality Data on some Telecommunication Sites in Rome. In Proceedings of the Eight IASTED International Conference on Power and Energy Systems, Corfù, Greece, 23–25 June 2008; pp. 62–67.
- Leccese, F. Study and Characterization of a New Protection System against Surges and Over Voltages for Domestic Telecommunication Networks. In Proceedings of the International Telecommunications Energy Conference, Rome, Italy, 30 September–4 October 2007; pp. 363–368.
- Leccese, F. Rome, a first example of Perceived Power Quality of electrical energy: The telecommunication point of view. In Proceedings of the International Telecommunications Energy Conference, Rome, Italy, 30 September–4 October 2007.
- Rocoil Ltd., Rogowsky Coil Datasheet. Available online: http://www.rocoil.co.uk/Specification%204000%20series%20coils.pdf (accessed on 14 September 2016).
- INRIM Research Institute, Time Reference Datasheet. Available online: http://www.inrim.it/ (accessed on 14 September 2016).
- Caciotta, M.; Leccese, F.; Trifirò, T. Frequency Valuation in Curve Fitting Algorithm. In Proceedings of the XVIII Imeko World Congress, Metrology for a Sustainable Development, Rio de Janeiro, Brazil, 17–22 September 2006.
- Giarnetti, S.; Leccese, F.; Caciotta, M. Non Recursive Multiharmonic Least-Square Fitting for Frequency Estimation for Power Quality Assessments. Measurement 2015, 66, 229–237. [Google Scholar] [CrossRef]
- Aprigliano, A.; Caciotta, M.; Giarnetti, S.; Leccese, F. Digital Signal Generator for real-time FPGA Power Quality Algorithm test. In Proceedings of the 11th International Conference on Environment and Electrical Engineering, Venice, Italy, 18–25 May 2012.
- Caciotta, M.; Giarnetti, S.; Leccese, F.; Pedruzzi, E. Curve fitting algorithm FPGA implementation. In Proceedings of the 2011 10th International Conference on Environment and Electrical Engineering, Rome, Italy, 8–11 May 2011.
- Caciotta, M.; Giarnetti, S.; Leccese, F.; Trinca, D. A Multi-Platform Data Acquisition Device for Power Quality Metrological Certification. In Proceedings of the 9th International Conference on Environment and Electrical Engineering—EEEIC 2009, Prague, Czech Republic, 16–19 May 2010.
- Caciotta, M.; Di Pasquale, S.; Giarnetti, S.; Leccese, F.; Trinca, D. A New Multi-Platform Data Acquisition System for Power Quality Metrological Certification. J. Energy Power Eng. 2014, 8. Available online: http://www.davidpublishing.org/show.html?17255 (accessed on 21 September 2016). [Google Scholar]
- Di Pasquale, S.; Giarnetti, S.; Leccese, F.; Trinca, D.; Caciotta, M. A New Platform for High Accuracy Power Quality Measurements: The Forensic Point of View. In Proceedings of the 20th IMEKO TC-4 International Symposium Measurement of Electrical Quantities, Benevento, Italy, 15–17 September 2014; pp. 402–407.
- IEC. 61850 International Standard: Communication Networks and Systems in Substations. Available online: https://webstore.iec.ch/p-preview/info_iec61850-5%7Bed1.0%7Den.pdf (accessed on 13 September 2016).
- Maxim, MAX1320 ADC Datasheet. Available online: https://datasheets.maximintegrated.com/en/ds/MAX1320EVKIT.pdf (accessed on 13 September 2016).
- Advantech, ARK-1360 Datasheet. Available online: http://www.alldatasheet.com/datasheet-pdf/pdf/328620/ADVANTECH/ARK-1360.html (Accessed on 13 September 2016).
- Trimble, Resolution T System Designer Reference Manual. Available online: http://www.trimble.com/timing/resolution-t.aspx (accessed on 13 September 2016).
- Cagnetti, M.; Leccese, F.; Trinca, D. A New Remote and Automated Control System for the Vineyard Hail Protection Based on ZigBee Sensors, Raspberry-Pi Electronic Card and WiMAX. J. Agric. Sci. Technol. B 2013, 3, 853–864. [Google Scholar]
- Leccese, F.; Cagnetti, M.; Calogero, A.; Trinca, D.; Di Pasquale, S.; Giarnetti, S.; Cozzella, L. A New Acquisition and Imaging System for Environmental Measurements: An Experience on the Italian Cultural Heritage. Sensors 2014, 14, 9290–312. [Google Scholar] [CrossRef] [PubMed]
- Leccese, F.; Cagnetti, M. An Intelligent and High Efficiency Street Lighting System Isle Based on Raspberry-Pi Card, ZigBee Sensor Network and Photovoltaic Energy. Int. J. Eng. Sci. Innov. Technol. 2014, 3, 274–285. [Google Scholar]
- Leccese, F.; Cagnetti, M.; Trinca, D. A Smart City Application: A Fully Controlled Street Lighting System Isle Based on Raspberry-Pi Card, ZigBee Sensor Network and WiMAX. Sensors 2014, 14, 24408–24424. [Google Scholar] [CrossRef] [PubMed]
- Händel, P. Properties of the IEEE-STD-1057 four-parameter sine wave fit algorithm. IEEE Trans. Instrum. Meas. 2000, 49, 1189–1193. [Google Scholar] [CrossRef]
- Leccese, F. Data Used in the Paper. Available online: http://doi.org/10.5281/zenodo.153830 (accessed on 13 September 2016).
© 2016 by the authors; licensee MDPI, Basel, Switzerland. This article is an open access article distributed under the terms and conditions of the Creative Commons Attribution (CC-BY) license (http://creativecommons.org/licenses/by/4.0/).


