Article

Current-Adaptive Control for Efficiency Enhancement in Interleaved Converters for Battery Energy Storage Systems

Faculty of Electrical Engineering, Computer Science and Information Technology Osijek, Josip Juraj Strossmayer University of Osijek, 31000 Osijek, Croatia
*
Author to whom correspondence should be addressed.
Electronics 2025, 14(9), 1862; https://doi.org/10.3390/electronics14091862
Submission received: 6 March 2025 / Revised: 15 April 2025 / Accepted: 28 April 2025 / Published: 2 May 2025

Abstract

:
Battery energy storage systems are essential for grid stability and the efficient integration of renewable energy sources. Their performance is influenced by the efficiency of bidirectional converters, particularly under varying load conditions. This study presents a novel current-adaptive control strategy for a two-stage non-isolated bidirectional DC-DC converter designed to dynamically adjust the number of active branches based on real-time load variations. The proposed approach introduces a current-adaptive algorithm for branch activation and deactivation, combined with real-time temperature-based control decision making, which has not been explored in existing studies. The validation was conducted using real-time Hardware-in-the-Loop simulation with the Typhoon HIL 402 system, ensuring accurate system representation. The results show an increase in average efficiency from 77.69 % to 83.15 % in Buck mode and from 81.00 % to 83.71 % in Boost mode, with a reduction in average power losses by 8.67 % and 13.31 % , respectively. These findings underscore the need for further research on temperature-adaptive control for efficiency optimization and thermal management, which is currently ongoing and will be expanded in future work. Future efforts will focus on experimental validation using a physical prototype and further refinement of temperature-adaptive control strategies.

1. Introduction and Motivation

Among various energy storage technologies, batteries or battery energy storage systems (BESS), as members of the electrochemical storage category, are the most commonly chosen solution today due to their rapid response capabilities while maintaining an optimal balance between power and energy density. Advances in next-generation battery cell technologies have resulted in more efficient and cost-effective systems, making them suitable for a wide range of applications, from residential to industrial and commercial sectors [1]. Additionally, BESS play a crucial role in mitigating peak energy demands, managing frequency and voltage regulation, and enhancing the effective utilization of renewable energy sources (RES) [2]. Given the growing challenges of energy stability and security, BESS have been the focus of extensive research and innovation over the past decade.
As stated in [3], the global stationary energy storage market is projected to grow significantly, reaching U S D   450.52   B by 2034, with a compound annual growth rate of 23.67 % from 2025, as illustrated in Figure 1. This expansion is driven by the increasing deployment of BESS, where power electronic converters are essential for efficient energy conversion and grid integration.
In the context of converters for BESS, the first step in system design involves evaluating available topological configurations of power converters to select the optimal topology for the given BESS application. The primary and essential requirement when selecting a BESS converter topology is the capability of bidirectional energy flow (i.e., bidirectionality), which must be fulfilled by any BESS system.
There are two fundamental types of bidirectional converters, single-stage and multi-stage conversion, with their basic block diagrams illustrated in Figure 2. Each of these categories includes both isolated and non-isolated configurations. There are various classifications of BESS converters, with some fundamental ones outlined in [4,5].
Single-stage converters directly convert DC to AC (or vice versa) without intermediate stages. Non-isolated versions commonly use single-phase or three-phase rectifiers, while isolated configurations integrate high-frequency transformers or resonant topologies to ensure galvanic isolation. Multi-stage converters, on the other hand, consist of cascaded DC-DC and AC-DC stages. Non-isolated variants usually employ a DC-DC converter followed by a rectifier/inverter, whereas isolated multi-stage designs often incorporate dual active bridge (DAB) or LLC resonant converters to enhance efficiency and voltage adaptation.
Topologies without galvanic isolation in a two-stage configuration can also be considered as two cascaded converters: a DC-DC converter followed by a rectifier/inverter. Therefore, these topologies can be analyzed by separately examining each stage of the conversion process. An example of a converter topology in a two-stage conversion without galvanic isolation, as utilized in this study, is presented in Figure 3.
Each of the aforementioned converter topology types has its limitations; therefore, researchers continuously modify and refine basic topologies to enhance specific converter characteristics. This study focuses on enhancing the operation of a half-bridge topology of a bidirectional buck–boost converter, which serves as the Stage 1 converter in the topology illustrated in Figure 3.

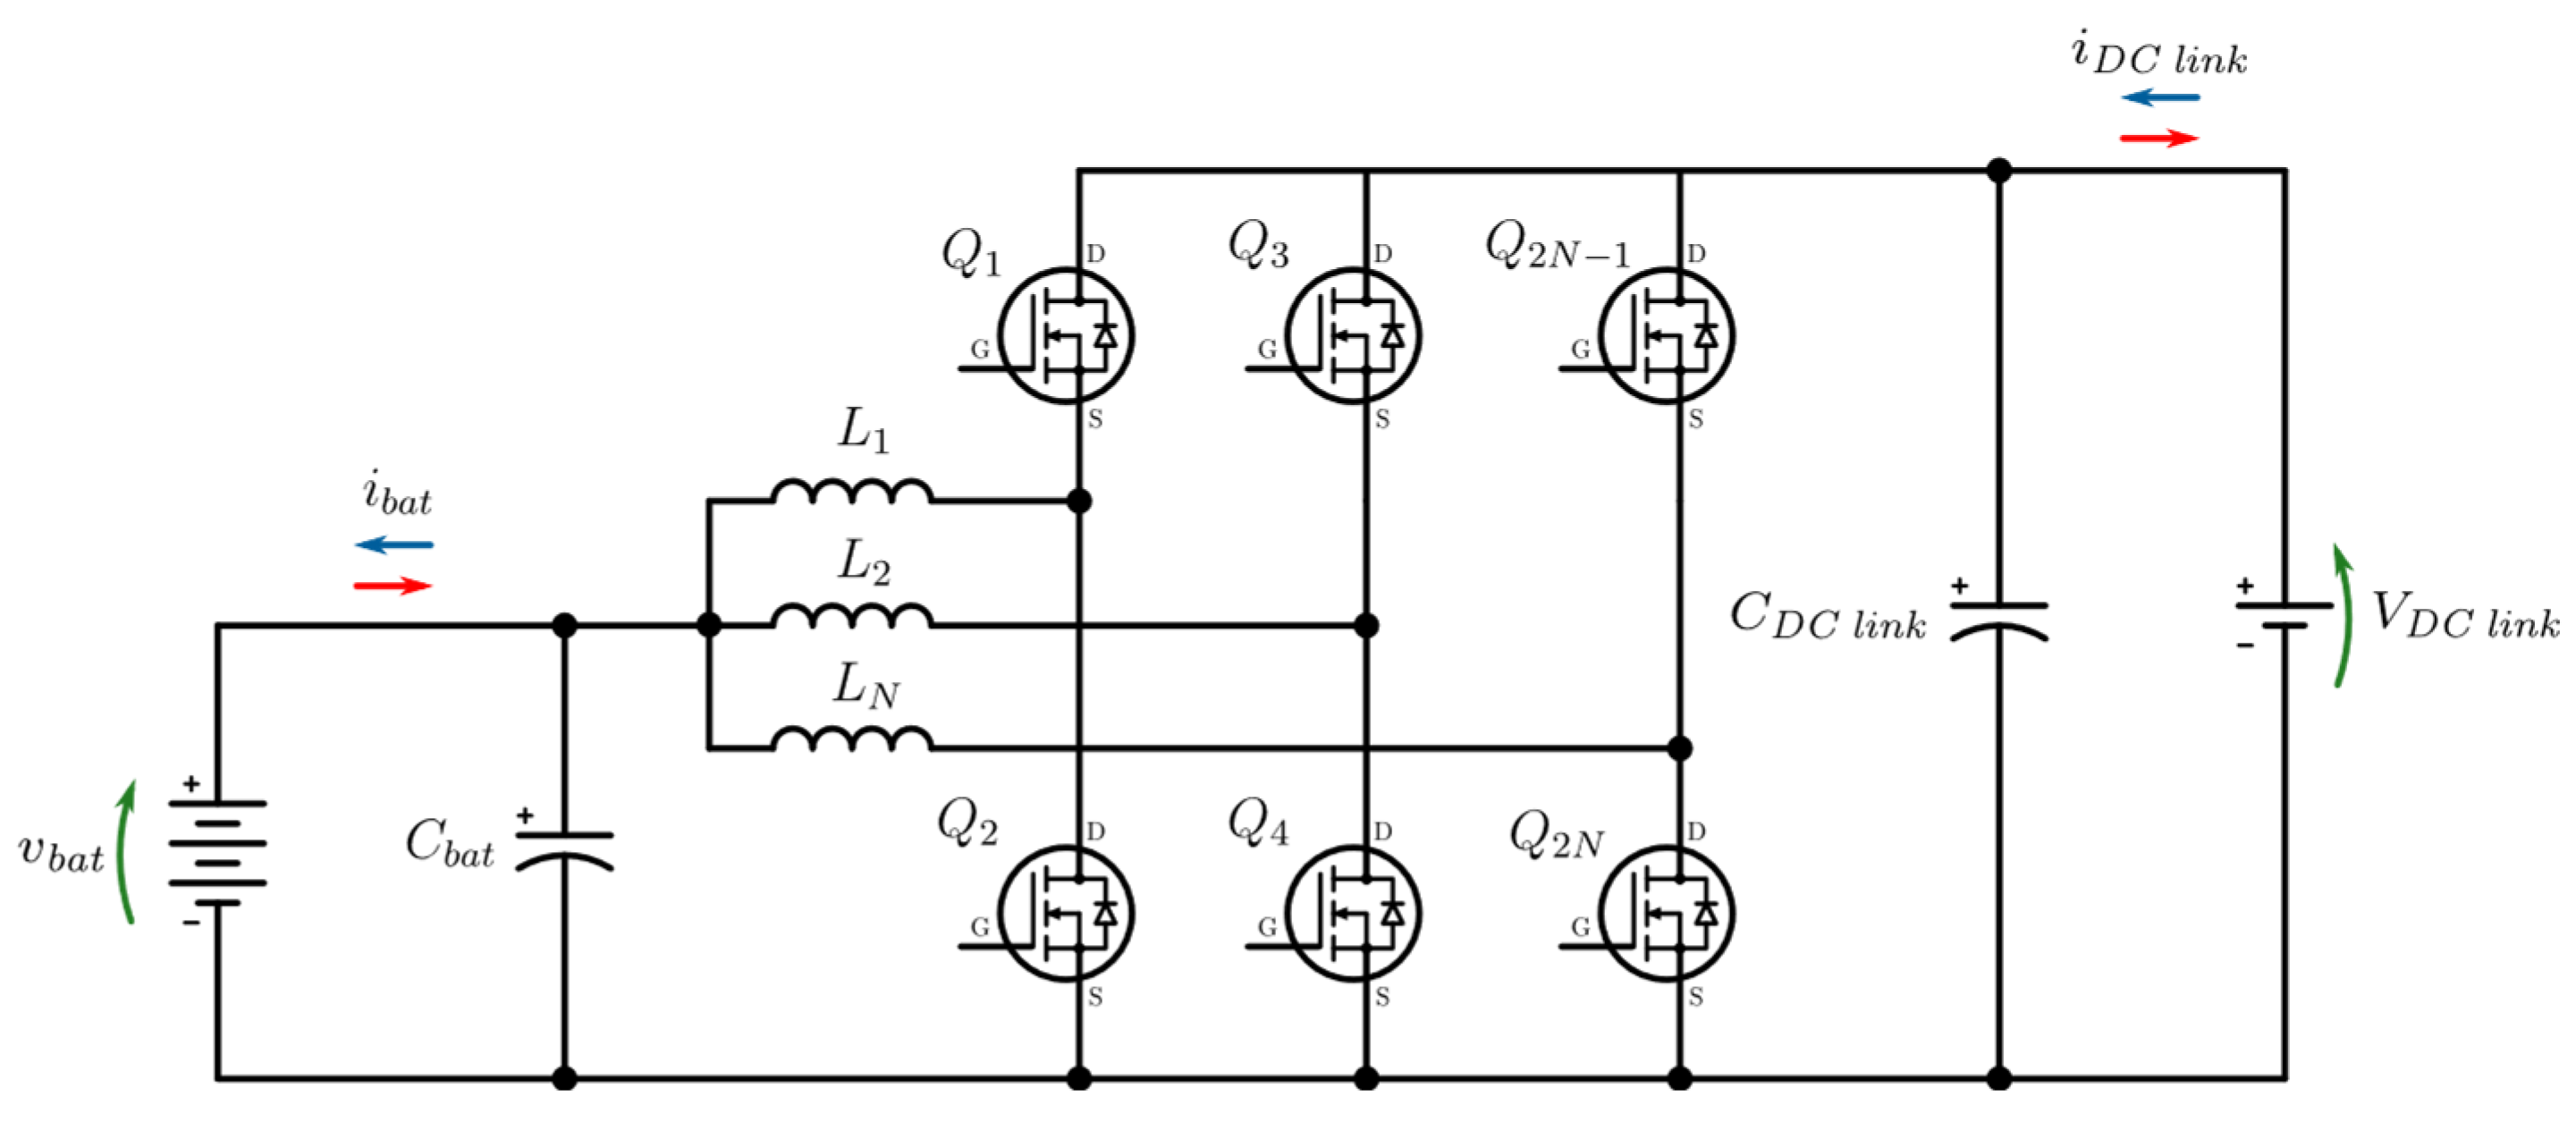
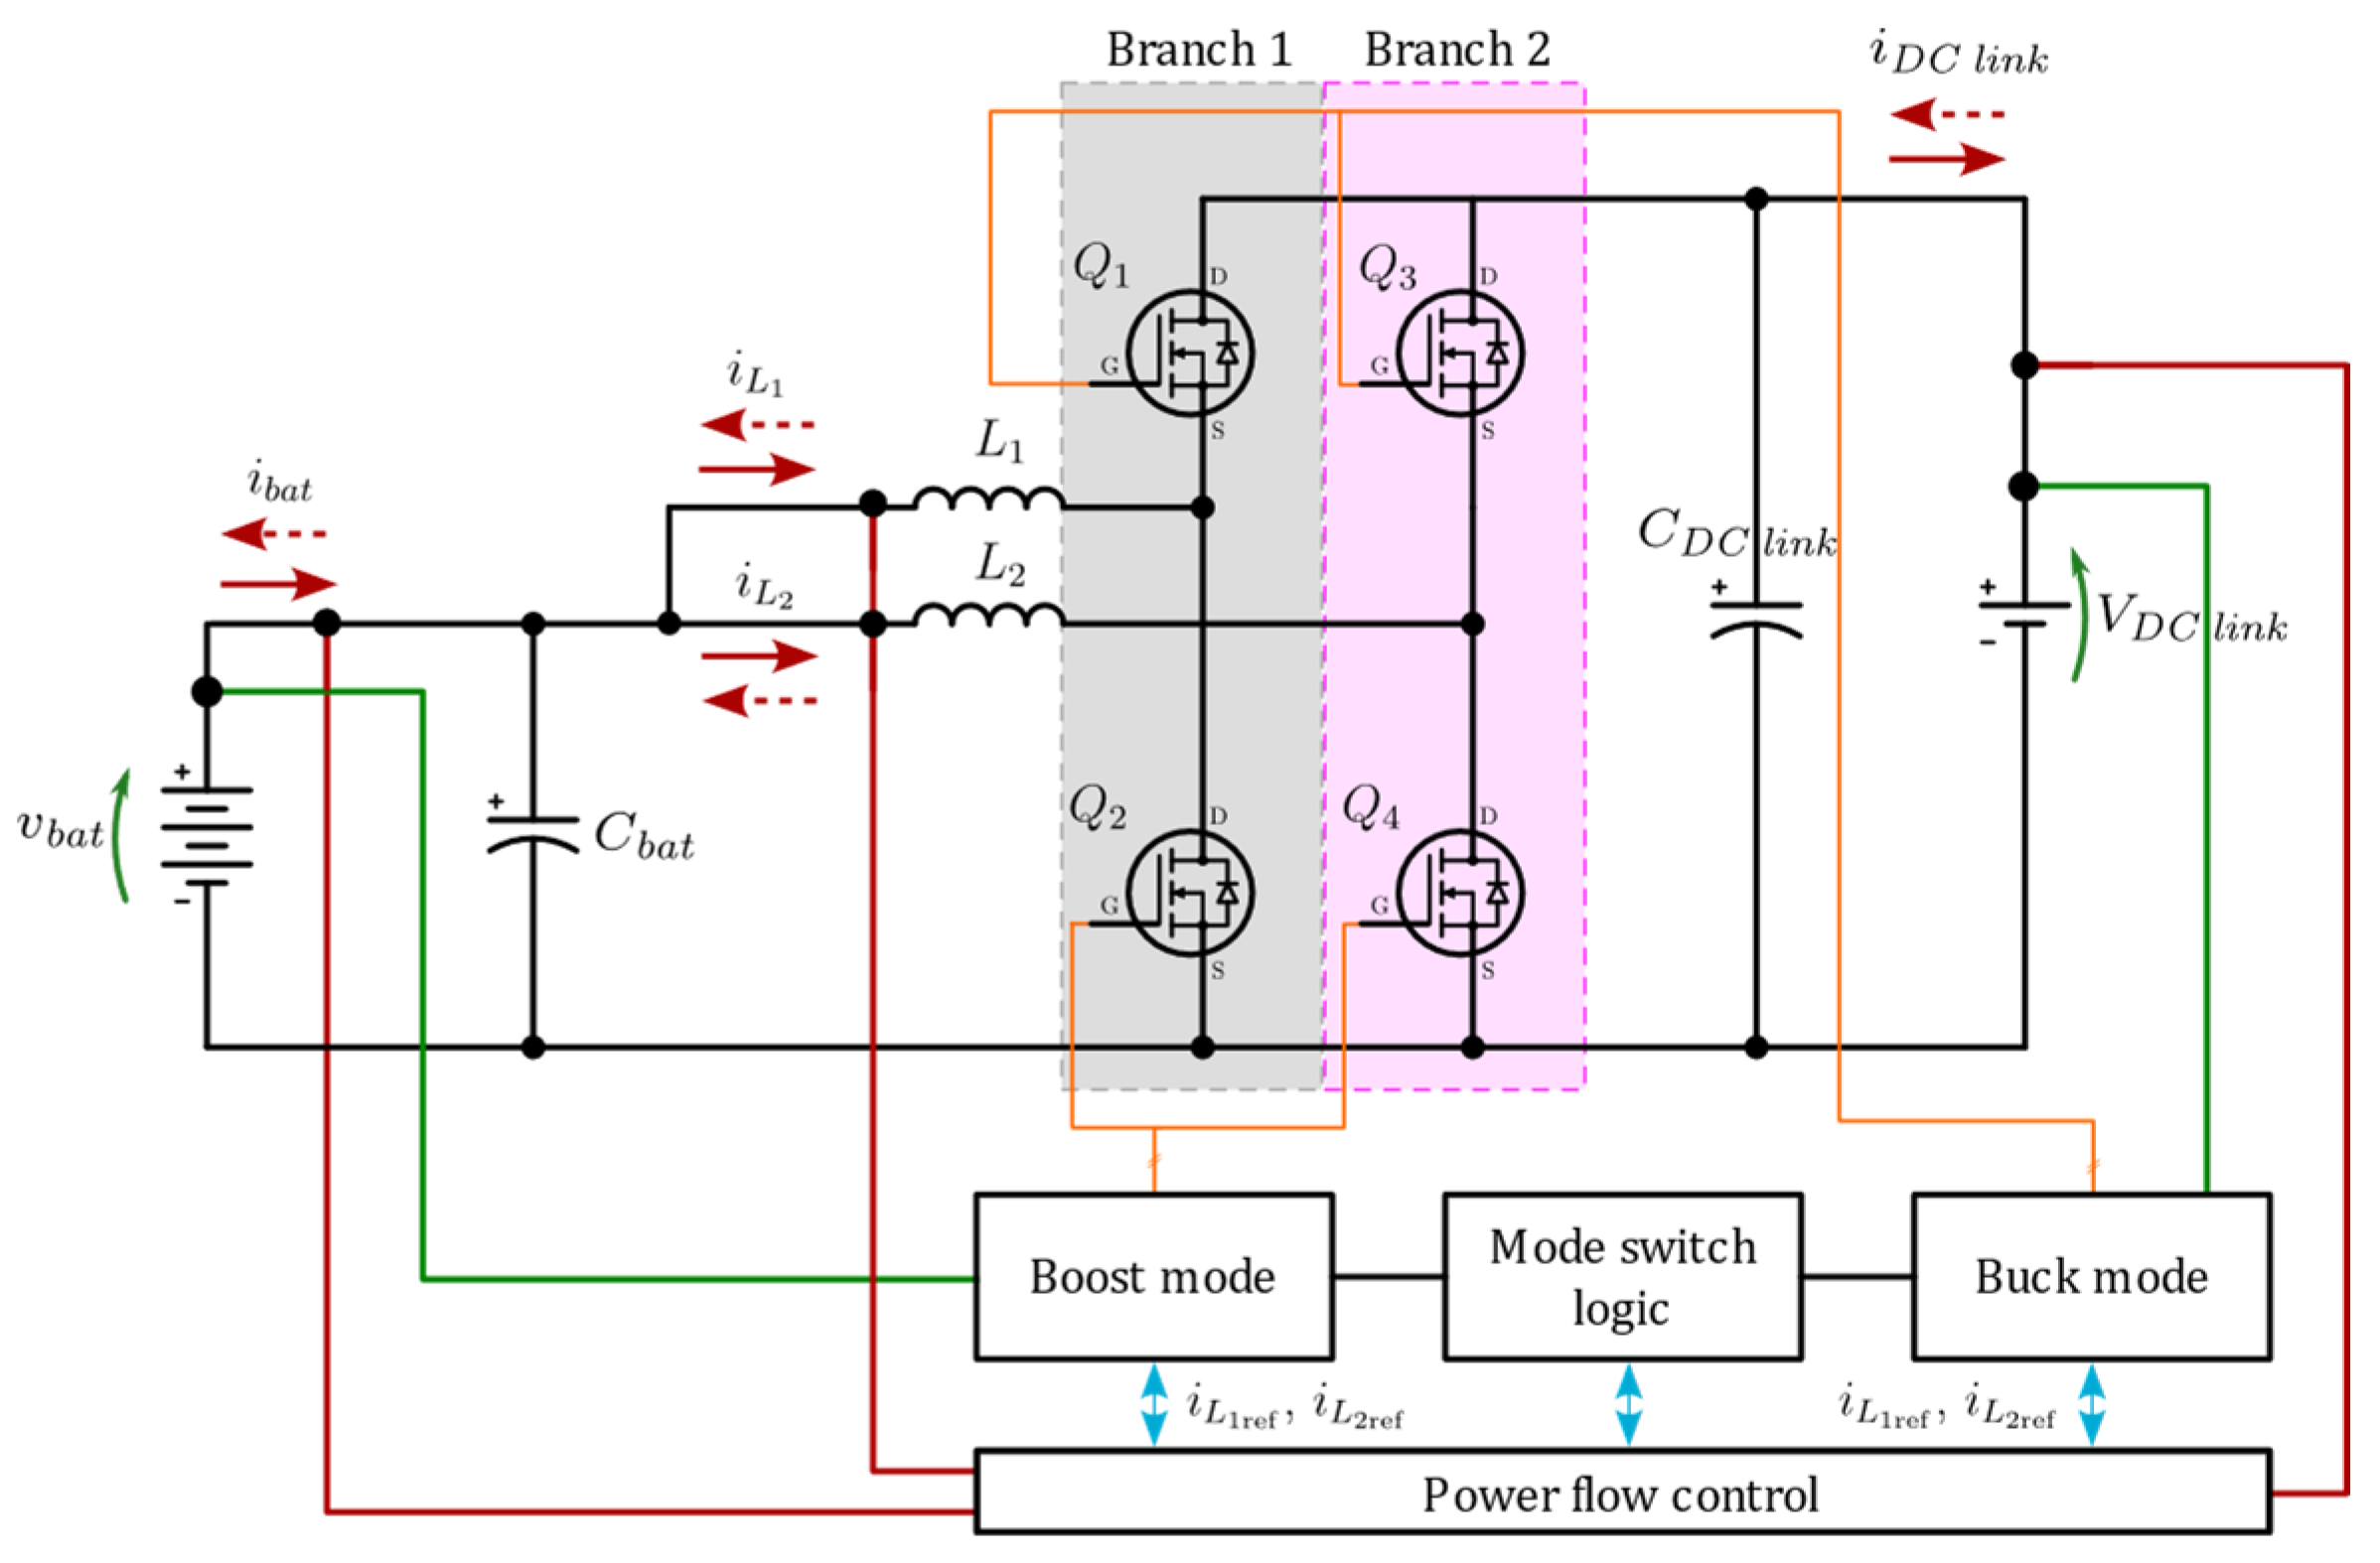
1.1. Interleaved Half-Bridge DC-DC Converter

The authors of [6] identify eight fundamental techniques used to modify half-brige (buck–boost) converter topologies to achieve enhanced performance characteristics, including synchronous rectification (SR), coupled inductors (CI), dual active bridge (DAB) topology, cascaded topology integration, resonant circuit implementation, the multiport or multi-input technique, auxiliary clamp circuits, and the interleaving technique. This study specifically focuses on the last technique—interleaving. By applying the interleaving technique to the Stage 1 topology depicted in Figure 3, an enhanced topology can be achieved, referred to as the bidirectional interleaved converter, or BIC. The conceptual schematic of such a converter with N branches is presented in Figure 4.
It Is Important to note that throughout this study, the right side of the BIC will always be referred to as the DC link side. This designation is used because the converter represents Stage 1 of a larger power conversion system for BESS, where the DC link must maintain a stable voltage regardless of the direction of energy flow.
The use of BIC in BESS is not a new concept. However, it has gained significant interest in recent years, particularly with the development of Vehicle-to-Grid (V2G) and Grid-to-Vehicle (G2V) technologies in the automotive sector, which essentially serve the same function in energy storage as stationary BESS [5]. Since the optimal number of branches in a bidirectional interleaved converter (BIC) depends on the specific application, research on multi-branch BIC implementations has been conducted across various configurations, ranging from 2 branches to 16 or more [7,8].
There are several key reasons for increasing the number of converter branches, depending on the desired objectives:
  • Increased Power Capability—A higher number of branches allows for the distribution of power across multiple branches, thereby enabling higher power transfer.
  • Reduction in Current Ripple—With a proper control strategy, a multi-branch DVC can reduce inductor current ripple, thereby minimizing the need for additional filtering components.
  • Enhanced Efficiency—For the same rated power, increasing the number of branches leads to smaller component sizes, which in turn reduces power losses.
With advancements in control algorithms, it is possible to further improve efficiency, particularly for systems operating over a wide power range. It is well established that converter efficiency decreases when the system is significantly underloaded [9]. In BIC, there exists a specific load point where deactivating one or more branches becomes beneficial for enhancing overall efficiency. This principle forms the central focus of this study, which aims to improve the efficiency of BIC by dynamically activating and deactivating individual branches based on load conditions. The proposed approach, referred to as the current-adaptive or I-ad control strategy, optimizes power distribution to achieve higher efficiency across varying operating conditions.
The methodology developed for implementing this strategy is systematically presented throughout this study. To support this, the next subsection provides a brief overview of existing control methods for activating and deactivating branches in interleaved converter topologies. This background is essential for understanding the context and motivation behind the proposed current-adaptive control algorithm.

1.2. Overview of Existing Methods for Efficiency Optimization via Branch Control in BIC

In this study, the authors conducted up-to-date research regarding advanced techniques for the adaptive control of active branches in interleaved converters. Although the number of published studies on this specific topic remains limited, a brief review of the most relevant contributions in the field follows.
The authors of [10] propose an algorithm for managing the number of active branches, which is based on a numerically constructed lookup table and a configuration-selection mechanism. This mechanism facilitates the automatic determination of switching moments for activating and deactivating branches under low-load conditions. The algorithm utilizes a lookup table to evaluate the load-switching points and employs a branch configuration selector that automatically identifies and adjusts the load-switching points between branches. This approach optimizes the system’s operation across various operating conditions.
In [11], the application of a digital controller for optimizing temporal parameters in managing the number of active branches in a three-branch buck converter was investigated. The proposed approach effectively manages transitions in the number of active branches, ensuring minimal deviations and facilitating fast transitions between configurations. However, the detailed logic underlying the algorithm for selecting the number of active branches was not the primary focus of this research. The algorithm was tested on a 30   W a converter, and the results demonstrated its effectiveness in a practical operating environment.
In [12], the authors explored a technique based on the dynamic adjustment of the number of active branches depending on the load, thereby reducing losses under low-load conditions. To validate the proposed technique, two different prototypes were tested, examining the practical aspects of implementing dynamic branch adjustments. The prototypes were rated at 1   k W , with one featuring 4 branches and the other 16 branches. However, the focus of the study was primarily on loss analysis, while a detailed research of the algorithm and logic for dynamic branch adjustment was not conducted.
In [13], a fast charger for electric vehicles, comprising three modular converters with six phases each, was introduced. This system was designed to optimize the number of active phases based on the required charging voltage, current, and duty cycle. The primary objective of the proposed control strategy was to reduce the ripple in the output charging current, thereby extending the lifespan of the electric vehicle’s battery while simultaneously enhancing the overall system efficiency. Specifically, the study investigated the adjustment of the number of active branches to optimize efficiency under varying load conditions. This approach accounted for the increased current ripple associated with a reduced number of active branches. The optimization was achieved by analyzing the dependency of ripple on the control factor, identifying combinations that ensured minimal ripple for a given control factor value. While employing three separate converters with a total of 18 branches may be overdimensioned for most applications, such a configuration introduces significant management complexity due to the need for coordination among three units, each comprising six branches.
In [14], the authors explored the concept of active branch management in a photovoltaic system using a 1   k W converter with two branches, aiming to enhance the overall system efficiency. One of the key challenges addressed in the research was the issue of current overshoot occurring during the deactivation of one of the branches. To mitigate this issue, the authors proposed an algorithm that involves a gradual increase in the control factor, facilitating a smooth transition and reducing the adverse effects of this phenomenon.
In [15], an active branch management strategy for a three-branch buck converter was proposed to enhance efficiency under low-load conditions. The results demonstrated an increase in efficiency.
In [16], the authors implemented active branch management on a two-branch buck converter operating at low voltages ( 3.3 1   V ) and a switching frequency of 1   M H z . The focus of the study was on current balancing between the branches. However, the issue of current ripple was not addressed, and the converter was specifically designed for low-voltage operation.
A review of previous studies [10,11,12,13,14,15,16] reveals that the concept of active branch management based on load conditions is not new. Activation and deactivation of branches are typically implemented using a lookup table (LUT), which relies on the observed current (in the context of BSE, this is the battery current). In most cases, the same branches are repeatedly activated and deactivated, representing the simplest technical approach. However, this method carries the risk of uneven load distribution, which may lead to accelerated aging of components that are more frequently utilized. Among these, converter components are particularly susceptible to degradation.
Only in a few recently published studies [17,18] has this issue been identified, where the authors, in addition to managing the number of active branches, also propose a so-called branch rotation strategy. This approach ensures that the load is evenly distributed among the branches over the transistor’s lifetime, thereby extending the lifespan of the entire assembly.
However, all the strategies considered in [10,11,12,13,14,15,16,17,18] for activating and deactivating individual branches in converters primarily rely on two approaches: the random selection of active branches or the use of a counter that stores the frequency of activation or deactivation of individual branches.

1.3. Research Scope and Main Contributions

Unlike previous approaches, the proposed solution introduces a novel method for activating and deactivating individual branches in a converter, utilizing temperature as the primary decision-making criterion. This temperature-based control approach enables further enhancement of the algorithm, aiming to regulate the average temperature of the transistors, which will be addressed in a forthcoming study. Given the extensive scope of this research, such an investigation exceeds the limits of a single scientific paper. Therefore, as previously emphasized, the primary focus of this study is the current-adaptive control strategy, aimed at improving the efficiency of BICs.
To evaluate the proposed approach, a simulation model of a two-branch BIC was developed using the Typhoon HIL 402 system (Typhoon HIL Inc., Austin, TX, USA; Serial No. 00402-02-00102, manufactured in 2018) [19]. This configuration was selected because it represents the simplest setup that still allows for proper demonstration of the proposed efficiency improvement strategy. It also complies with the technical limitations of the Typhoon HIL 402 system, particularly when a thermal model is included. A dual-step simulation method was applied: the control part of the model was executed with a time step of 50   µ s , while the thermal model used a 100   µ s time step. Due to Typhoon HIL 402 hardware limitations—mainly the limited number of available FPGA cores—Configuration 4 was used, as it is the only option in the Typhoon HIL 402 system that supports real-time electro-thermal simulation [19]. The Typhoon HIL 402 simulation model, together with detailed schematics and diagrams, is provided in the Supplementary Materials available in the public repository. These files also include the exact version of the Typhoon HIL schematic used during the measurements, ensuring that the simulation setup and results can be fully reproduced.
The key contributions of this research can be summarized as follows:
  • Development of a current-adaptive control algorithm for dynamically adjusting the number of active branches in a bidirectional interleaved converter (BIC) based on the battery operating curve, thereby enhancing the converter’s efficiency.
  • Integration of a temperature-based control mechanism within the current-adaptive control strategy, incorporating a real-time thermal model to ensure operational reliability and mitigate thermal stress on semiconductor components.
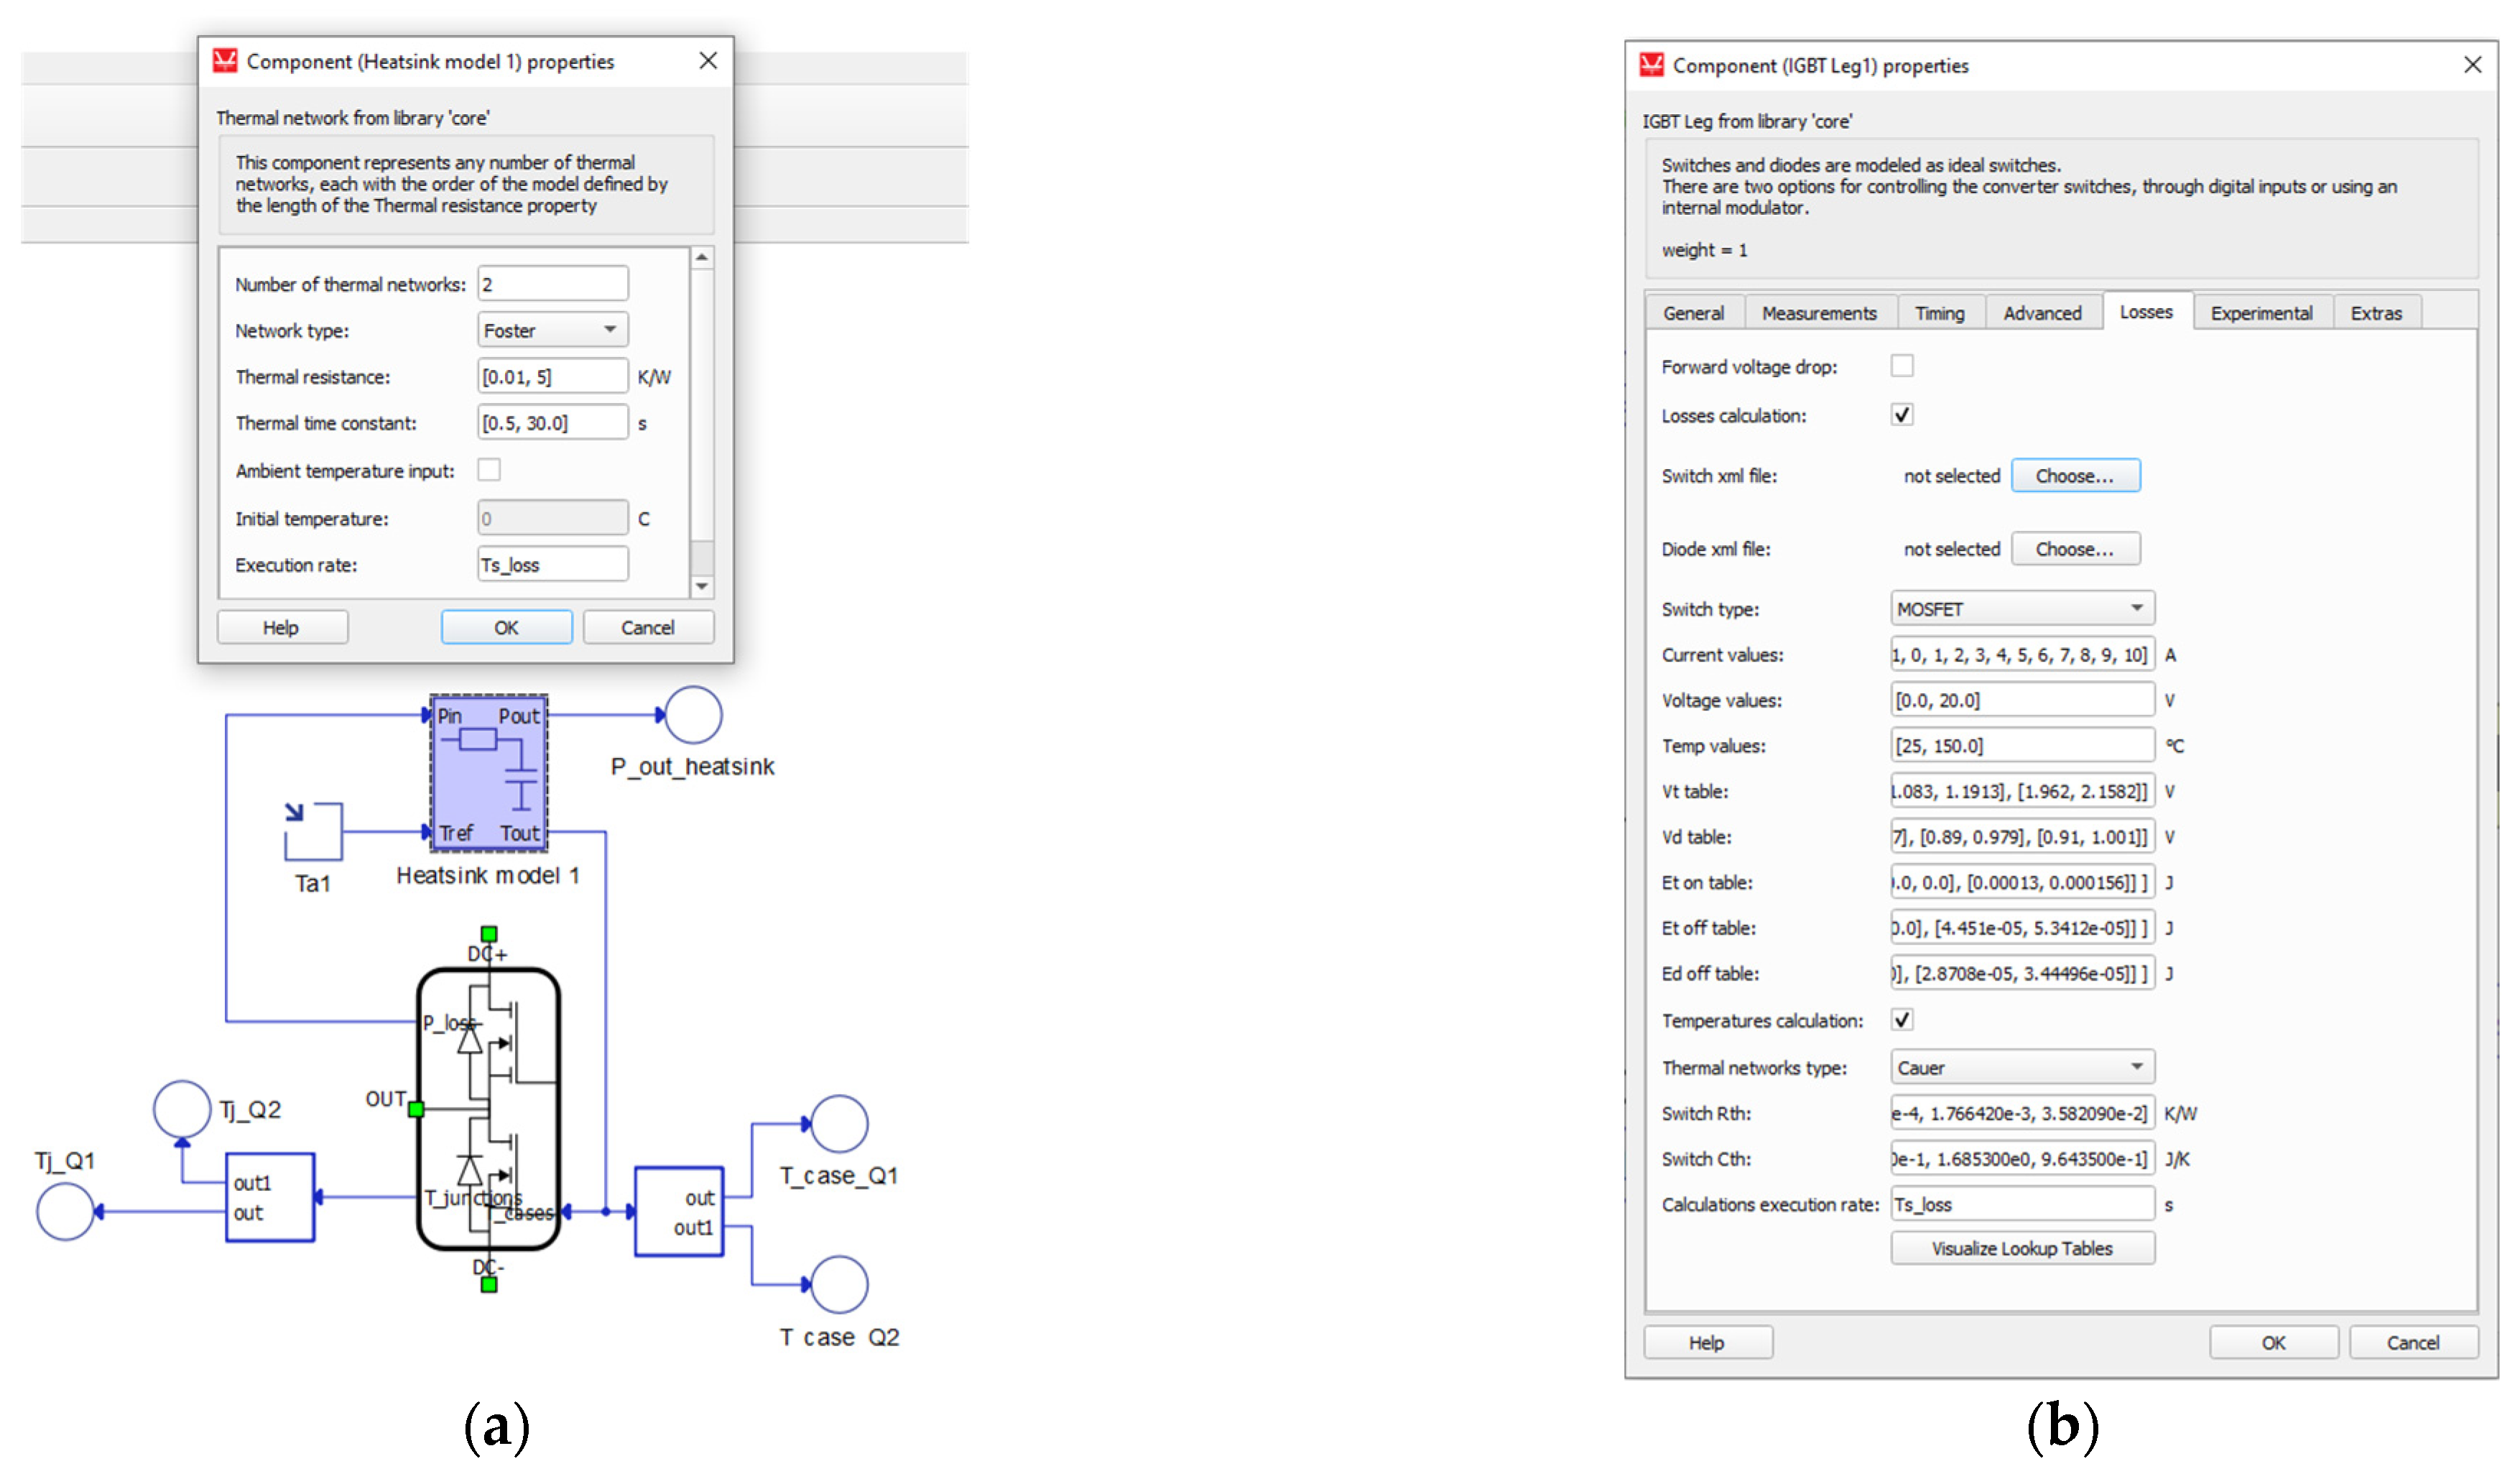
  • Design and implementation of a real-time simulation model with integrated electro-thermal modeling, developed using the Typhoon HIL 402 system. This model enables a realistic evaluation of the proposed control strategy under various operating conditions and confirms its applicability in practical scenarios.
  • Provision of an open-access Typhoon HIL model, ensuring full reproducibility of the experimental setup and results, serving as a foundation for further research in adaptive control strategies for power electronic converters.

1.4. Paper Structure

The remainder of this paper is organized as follows. Section 2 presents the modeling and simulation of the two-branch BIC, detailing the selected system parameters and implementation within the Typhoon HIL 402 environment. Section 3 introduces the current-adaptive or I-ad control strategy, describing its operational principles and integration with real-time electro-thermal modeling. Section 4 discusses the validation process using Hardware-in-the-Loop (HIL) simulations, providing insights into the efficiency improvements achieved through the proposed strategy. Section 5 presents the discussion of the findings, emphasizing the implications of real-time control, electro-thermal interactions, and future research directions. Finally, Section 6 provides the conclusion, summarizing the key contributions and outlining future steps, including experimental validation on a physical prototype and further enhancements through temperature-adaptive control strategies.

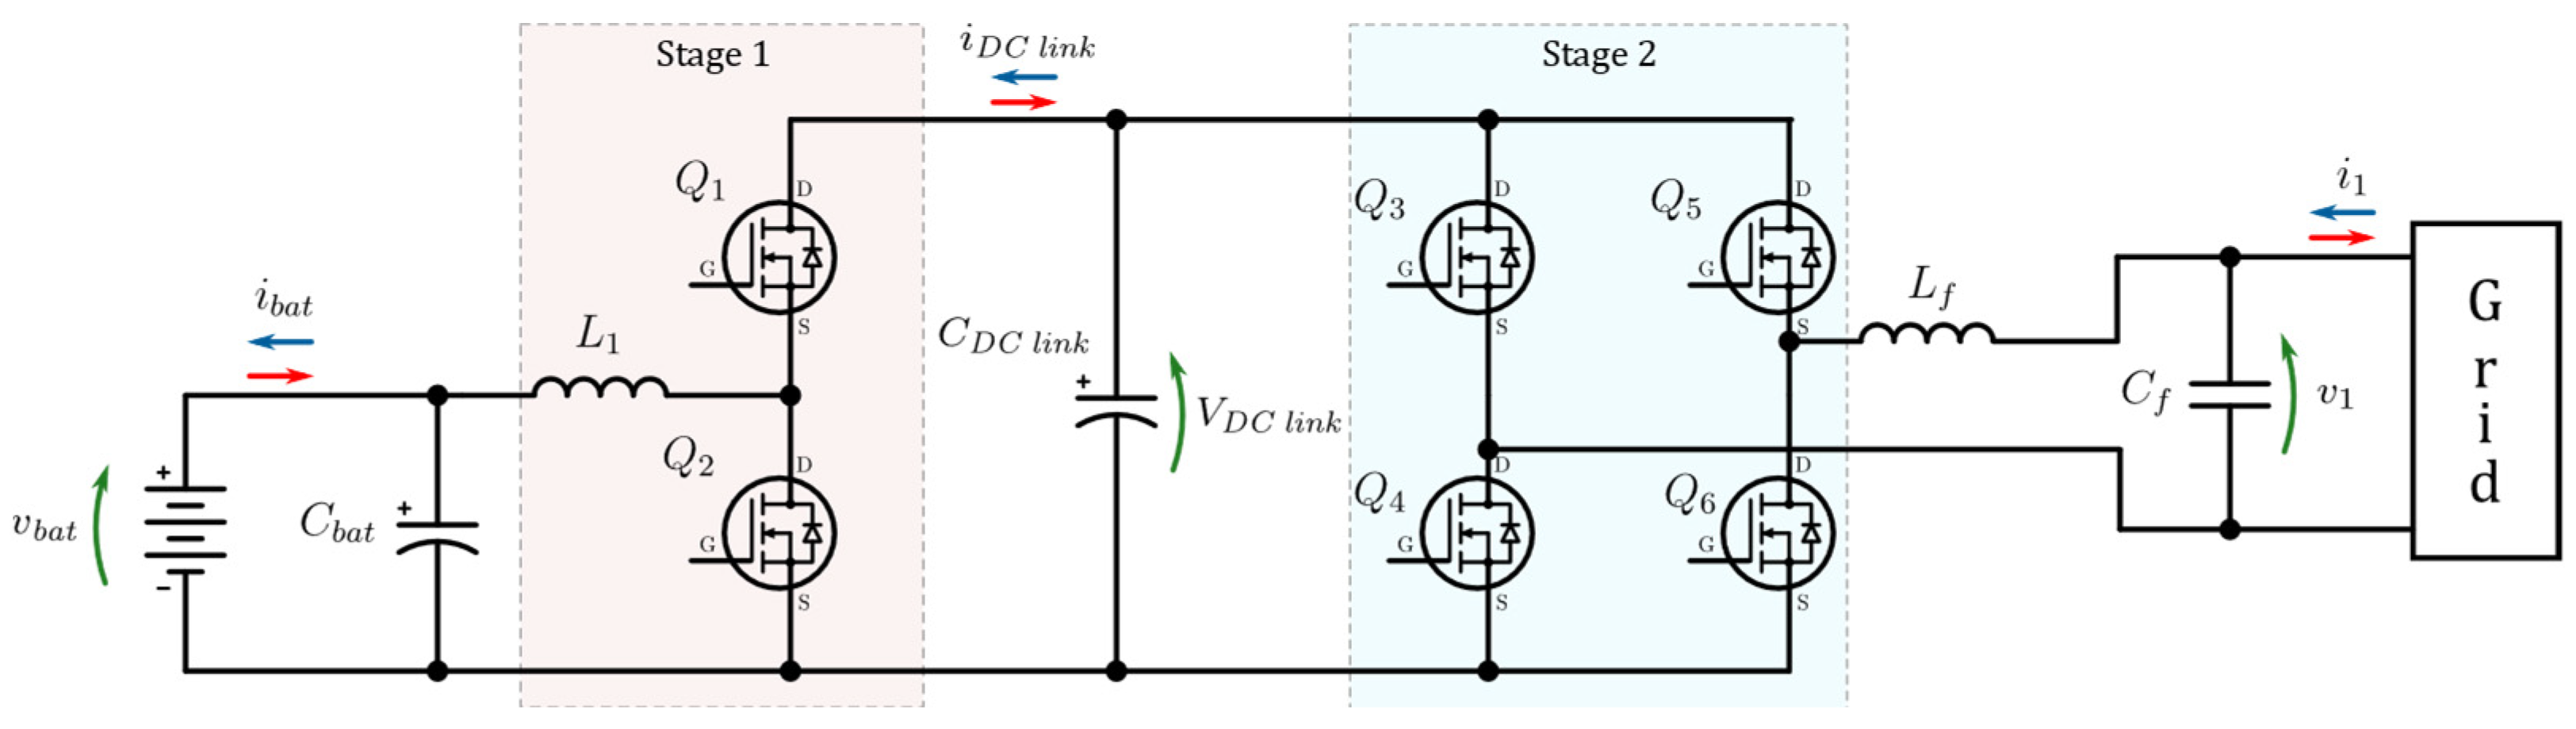
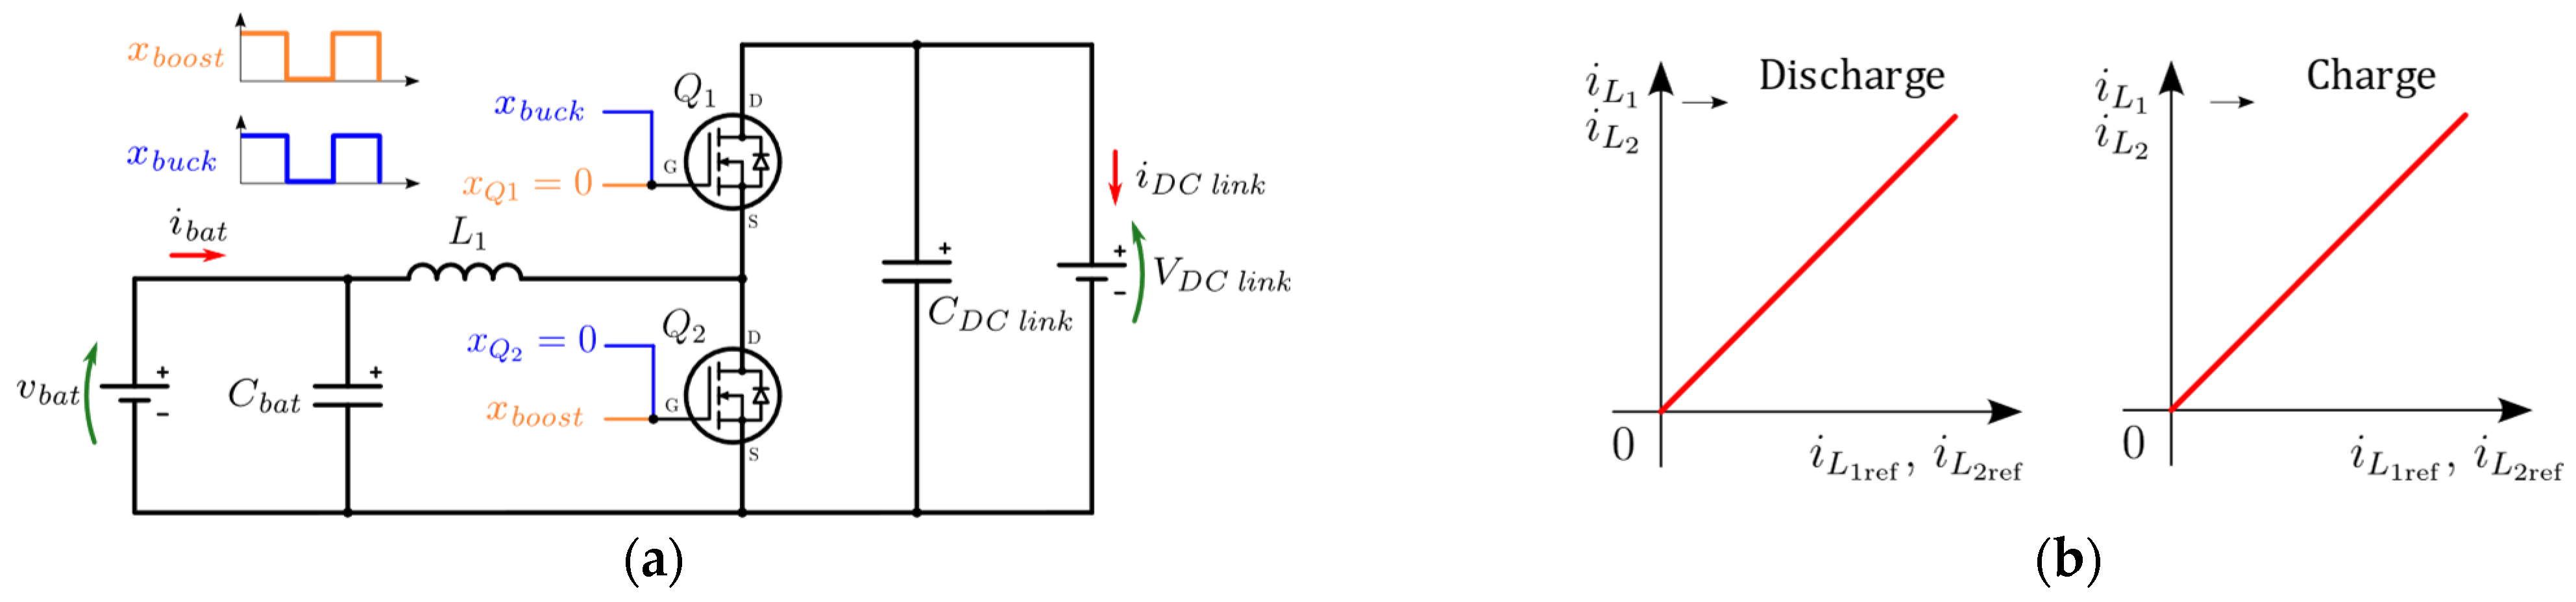
2. Two-Branch Interleaved Bidirectional DC-DC Converter Modeling
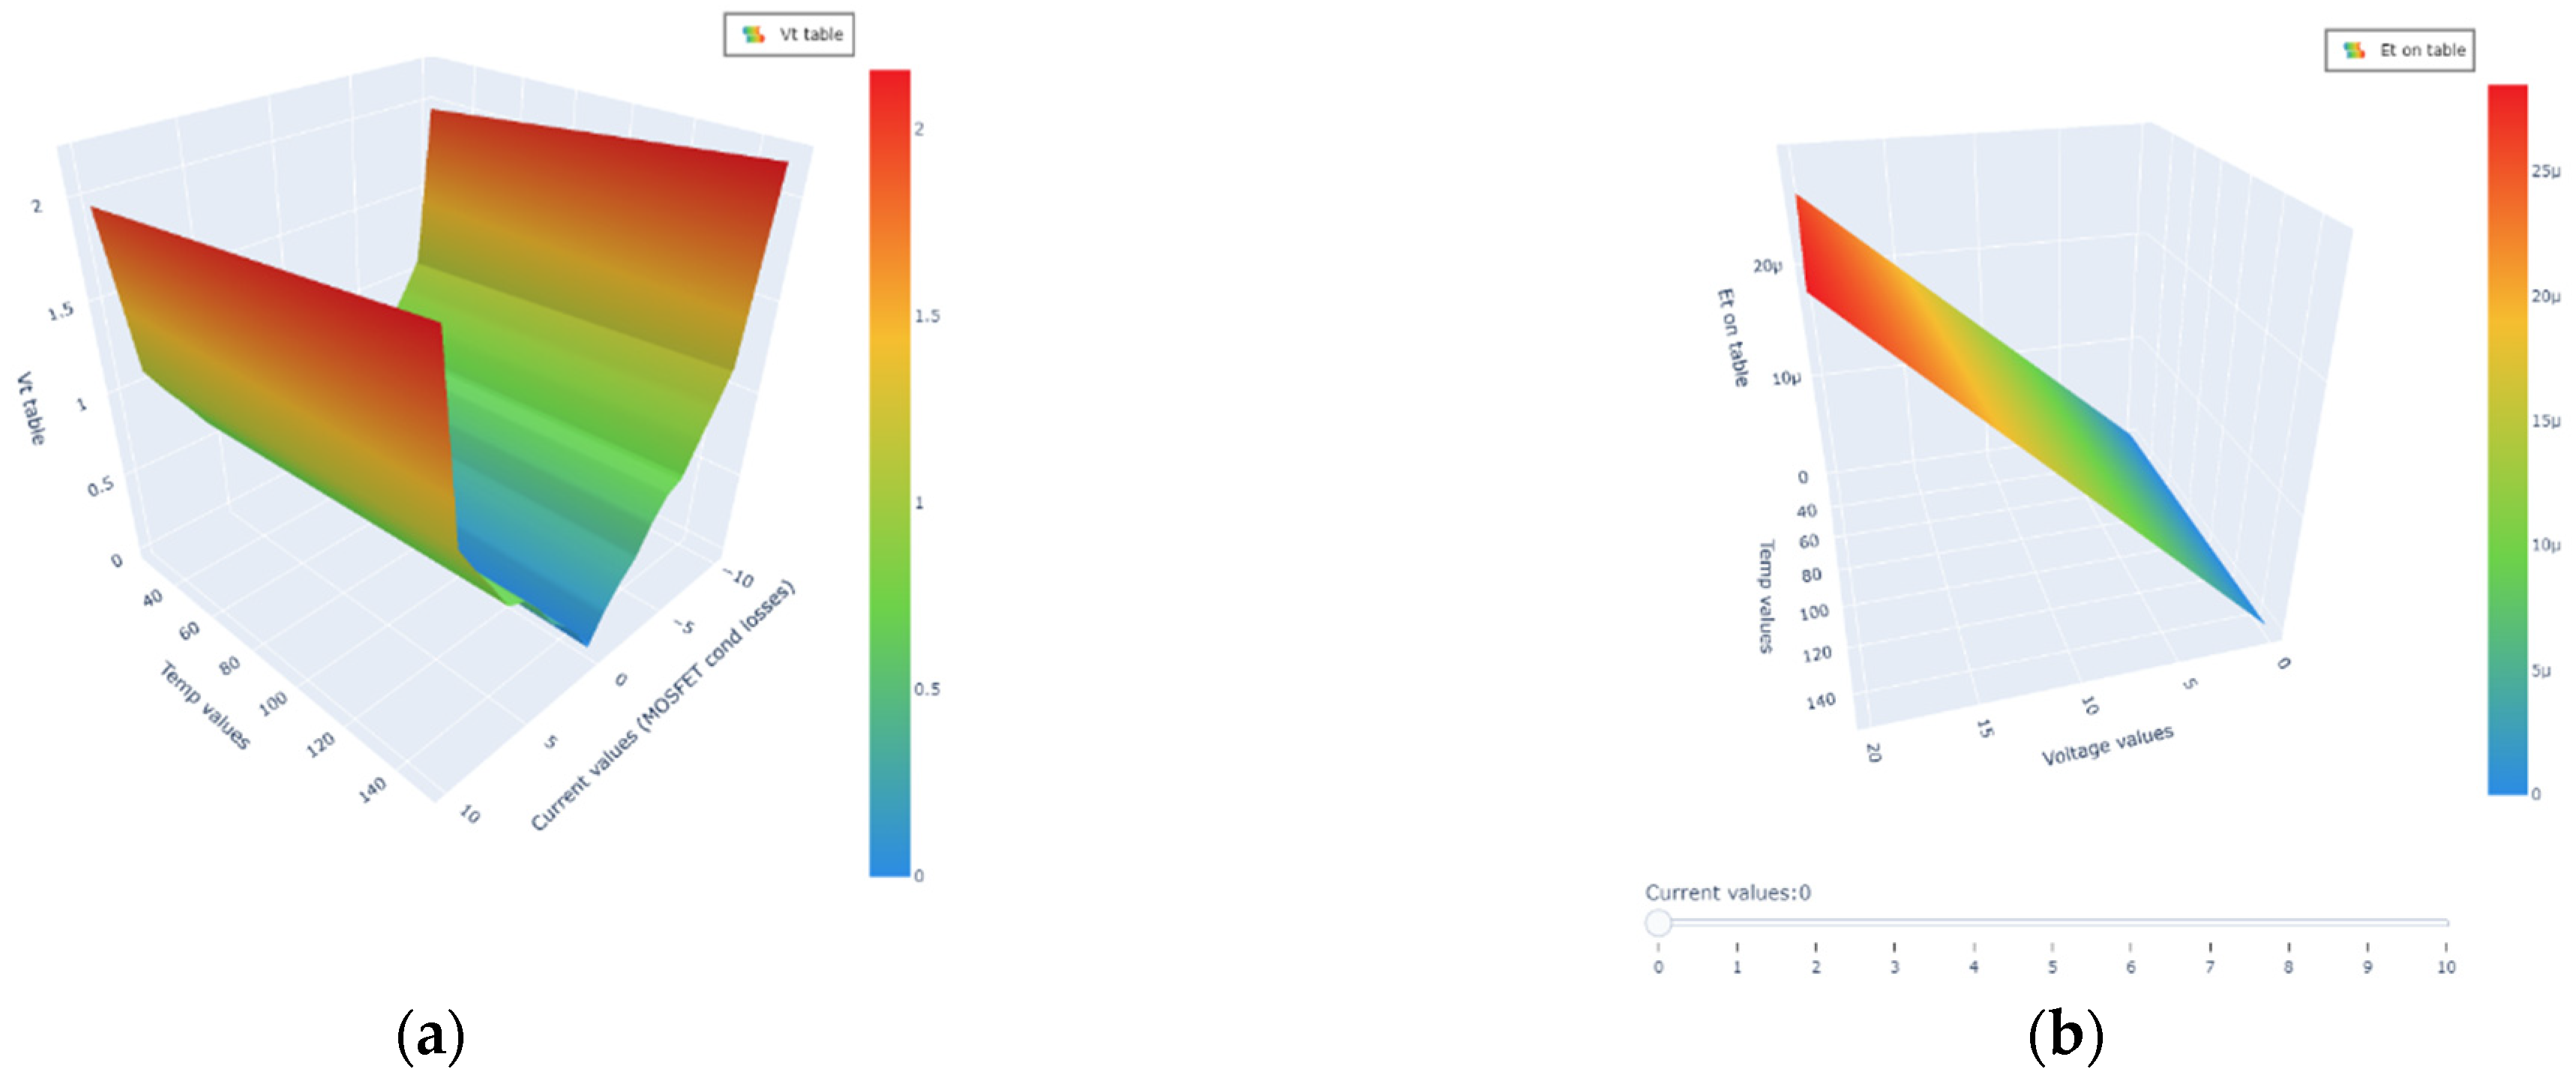
The research and contributions presented in this study were conceptualized and implemented using the Typhoon HIL 402 system. Table 1 presents the fundamental parameters of the BIC, providing a comprehensive overview of the selected converter system. The system parameters were chosen to enable the development of a scaled physical model of the converter, specifically adapted for laboratory conditions, by using suitable development boards with predefined half-bridge topology converters, such as commercially available evaluation boards (e.g., Infineon EVAL-1ED020I12-BT [20], or similar).
Given the complexity and scale of the schematic model, a detailed representation is provided in the Supplementary Materials, while a simplified block diagram of the system is presented in Figure 5 to facilitate comprehension and contextual understanding. A detailed description of the converter’s power stage, as illustrated in Figure 5, is provided below. The system consists of a BIC with two branches, denoted as Branch 1 and Branch 2. The battery is positioned on the left side, while the DC link is located on the right. Each converter branch is equipped with an associated inductance, whereas both the battery and the DC link integrate capacitive voltage filters to ensure stable operation. Due to the bidirectional nature of the system, the source and load functionalities dynamically interchange depending on the operating mode—boost or buck. Consequently, both the battery and the DC link are consistently represented by battery symbols throughout this study, with the designations battery side and DC link side employed for terminological clarity.
The control architecture of the converter is also depicted in Figure 5, illustrating the various operational blocks governed by the higher-level Power flow control system block. In the Typhoon HIL software environment, the control was implemented in its most straightforward form, allowing for manual selection between boost and buck operation modes. Additionally, Figure 5 specifies the active MOSFETs for each mode: in Buck mode, the lower MOSFETs ( Q 2 and Q 4 ) are engaged, whereas in Boost mode, the upper MOSFETs ( Q 1 and Q 3 ) are activated.
The transition between operating modes is managed by the higher-level Power flow control system in coordination with the Mode switch logic circuit block. Furthermore, Figure 5 presents the block diagram of the measurement system, which includes four current sensors dedicated to monitoring individual branch currents ( i L 1 , i L 2 ), battery current ( i b a t ), and DC-link current ( i D C   l i n k ). Additionally, two voltage sensors are implemented to measure the battery voltage ( v b a t ) and DC-link voltage ( V D C   l i n k ). In Boost mode, the critical parameters include the individual branch currents and the DC-link voltage, while in Buck mode, the key variables are the branch currents and the battery voltage.
Within the Boost mode and block Buck mode blocks in Figure 5, independently configured PI controllers are embedded, specifically designed for their respective operating modes. Since the PI control architecture is not the primary focus of this study, the description of the control loop will be briefly outlined, highlighting only the essential aspects relevant to the scope of this research.
In general, converter control is classified as analog or digital [21]. Analog controllers offer fast response, simplicity, and lower cost, but are prone to noise and disturbances. Digital controllers offer flexibility, easy updates, and advanced control capabilities, but lead to higher costs and reduced bandwidth due to processing delays. The presented Typhoon HIL model employs digital control, which can generally be classified into linear and nonlinear [22]. Linear controllers, such as PID, utilize simplified mathematical models and are easier to implement; however, they may be less effective under dynamic operating conditions. In contrast, nonlinear methods, including Sliding Mode Control (SMC), Fuzzy Logic Control (FLC), and Neural Networks (NNs), provide superior performance in systems with inherent nonlinearities but require more complex design and higher implementation costs [23].
For the purposes of this research, a linear PI controller was selected, as it meets the digital resource constraints of the Typhoon HIL 402 system. With comparable precision and control quality to Sliding Mode Control within the operating point, the linear PI controller can deliver satisfactory results while offering the advantages of robust and straightforward digital implementation, as confirmed by the findings in [24]. The PI controller enables the regulation of current, voltage, and consequently, power. Voltage regulation is particularly suitable for systems with minimal load variations or those characterized by low current fluctuations, as demonstrated, for example, in [25] for a four-branch boost DC-DC converter. However, for more precise current regulation, particularly in multi-branch converters, the industry standard is dual-loop control. This control strategy was also implemented in the model, as illustrated in Figure 6.
While regulation itself is not the primary focus of this research, it is crucial for ensuring the proper operation of the model. Therefore, a brief explanation was necessary. The voltage and current regulator responses with a short explanation are provided in Appendix B.
In BIC topologies, the choice of control mode is crucial and can be implemented in either synchronous or asynchronous mode [26]. In asynchronous mode, one MOSFET conducts during a given interval while its complementary diode conducts in the other, whereas in synchronous mode, MOSFETs operate in a complementary manner, with the main MOSFET dictating the operating mode and the auxiliary MOSFET replacing the diode function [26]. In this research, asynchronous control is used, which is elaborated below. Another important consideration in BESS converter control, as noted by the authors in [27], is the distinction between unified and separate controllers, which represent the two primary control strategies.
The choice between synchronous and asynchronous operating modes is directly linked to the selected control strategy. This relationship, particularly between the asynchronous operation mode and the separate controller strategy, is comprehensively illustrated in Figure 7 (see Figure 5, where buck and boost controls are separated subsystems). Detailed differences between all the aforementioned aspects are provided in [28].
Figure 7 illustrates the separate controller used for asynchronous converter control in a single branch of the converter. The higher-level supervisory system (Power flow control, Figure 5) determines whether the battery operates in the charging or discharging mode, thereby controlling the transistors responsible for boost or buck operation (Boost mode or Buck mode; Figure 5). The decision to implement an asynchronous mode with separate regulator circuits is primarily motivated by the need for precise tuning of control loops for each operating mode. Additionally, from a practical standpoint, this approach helps mitigate complications associated with transistor dead time and other technical challenges inherent in synchronous control, which could present significant issues in future real-world implementations.

Thermal Modeling

The fundamental simulation model (simplified block model version in Figure 5) developed within the Typhoon HIL environment (Supplementary Materials) was further enhanced with a thermal model. A review of existing research and state-of-the-art modeling approaches revealed a lack of scientific studies that integrate thermal models alongside electrical models for real-time temperature prediction of power converters, particularly using HIL devices. Therefore, this study presents a novel contribution, requiring a concise explanation of the developed model. While real-time temperature monitoring is not the primary focus, it plays a crucial role in the current-adaptive algorithm (detailed in the next section), necessitating an overview of its implementation within the Typhoon HIL environment. Given that the simulation model and current-adaptive algorithm are central to this research, the following section provides a concise description of the real-time thermal model implementation, without revisiting the theoretical foundations of electro-thermal modeling, which is a broad topic in itself and beyond the scope of this study [29].
The Typhoon HIL software package version 2021.3 introduced support for the development of thermal models for power converter components. Figure 8 illustrates the thermal modeling options in Typhoon HIL, showing the heat sink parameterization (Figure 8a) and the thermal model configuration for power converter components (MOSFETs or IGBTs) (Figure 8b) [30].
These models allow the calculation of conduction and switching losses of th transistors using Cauer or Foster thermal modeling approaches [31]. Based on these models, heatsink thermal modeling is also included. With the use of Typhoon HIL 402 hardware, real-time thermal model simulation is possible, improving the accuracy of temperature predictions.
By activating the ‘Losses Calculation’ and ‘Temperature Calculation’ options (Figure 8b), the basic MOSFET semiconductor model (Figure 8a) is extended with additional inputs and outputs. The ‘T_junctions’ output is used for estimating the chip junction temperature (PN junctions) of the transistor, while the ‘P_loss’ and ‘T_cases’ outputs provide feedback between the MOSFET and its corresponding heatsink model (‘Heatsink model 1’). This thermal model enables a comprehensive simulation of the thermal characteristics of converter components, including a detailed estimation of the MOSFET PN junction temperatures and corresponding heatsinks. The simulation relies on the entered thermal parameters, allowing for precise modeling of both switching and conduction losses, providing a detailed thermal analysis of the system. In the enhanced thermal model, conduction and switching losses are no longer constant but depend on the estimated junction temperature. The parameters for input into the MOSFET and heatsink thermal model are obtained from the manufacturer’s technical specifications (most commonly using the Foster model).
The calculation of MOSFET conduction losses is based on the voltage drop across the transistor ‘Vt’ and the body diode ‘Vd’, both of which vary as a function of current and temperature. These parameters, extracted from manufacturer specifications, are implemented in a two-dimensional lookup table (2D LUT) within the simulation model (Figure 8b). Conversely, switching losses are determined from the energy dissipated during the turn-on and turn-off transitions of both the transistor and its body diode. These losses are influenced not only by current and temperature but also by the drain-to-source voltage, requiring a three-dimensional lookup table (3D LUT) for accurate representation.
Figure 9a illustrates the conduction voltage dependence on temperature and current, derived from the 2D LUT, while Figure 9b presents a four-variable 3D plot, demonstrating how switching energy losses vary with current, temperature, and drain-to-source voltage. These diagrams are generated using data extracted from manufacturer-provided datasheets, such as [32] in this case.
Since switching loss parameters are often missing from manufacturer datasheets, and energy loss tables are inconsistently provided, Typhoon HIL recommends using similar transistors with available data for model integration. A further challenge is the limited availability of ready-to-use electro-thermal models in XML format, despite this being the most accurate method for modeling transistor parameters in Typhoon HIL. However, the specific transistor selection is not critical in this study, as the focus is more on the modeling approach. While the data are sourced from manufacturer datasheets [32], electro-thermal modeling is still in its early stages, with few manufacturers providing dedicated models in the form of Foster or Cauer networks. A further complication arises from the inconsistency of datasheets across different manufacturers, each of which follows its own standard for structuring technical specifications. In addition to format variations, manufacturers employ different testing methodologies for characterizing transistors, making it difficult to accurately replicate real-world transistor behavior based solely on datasheet information.
In conclusion to thermal modeling, the converter schematic with an integrated thermal model is provided in the Supplementary Materials. By incorporating electro-thermal modeling and enabling temperature estimation of individual converter components, the simulation model was further enhanced with a current-adaptive control strategy for managing active converter branches. Beyond the electro-thermal modeling capabilities of the Typhoon HIL platform, the current-adaptive control strategy represents one of the key contributions of this research.

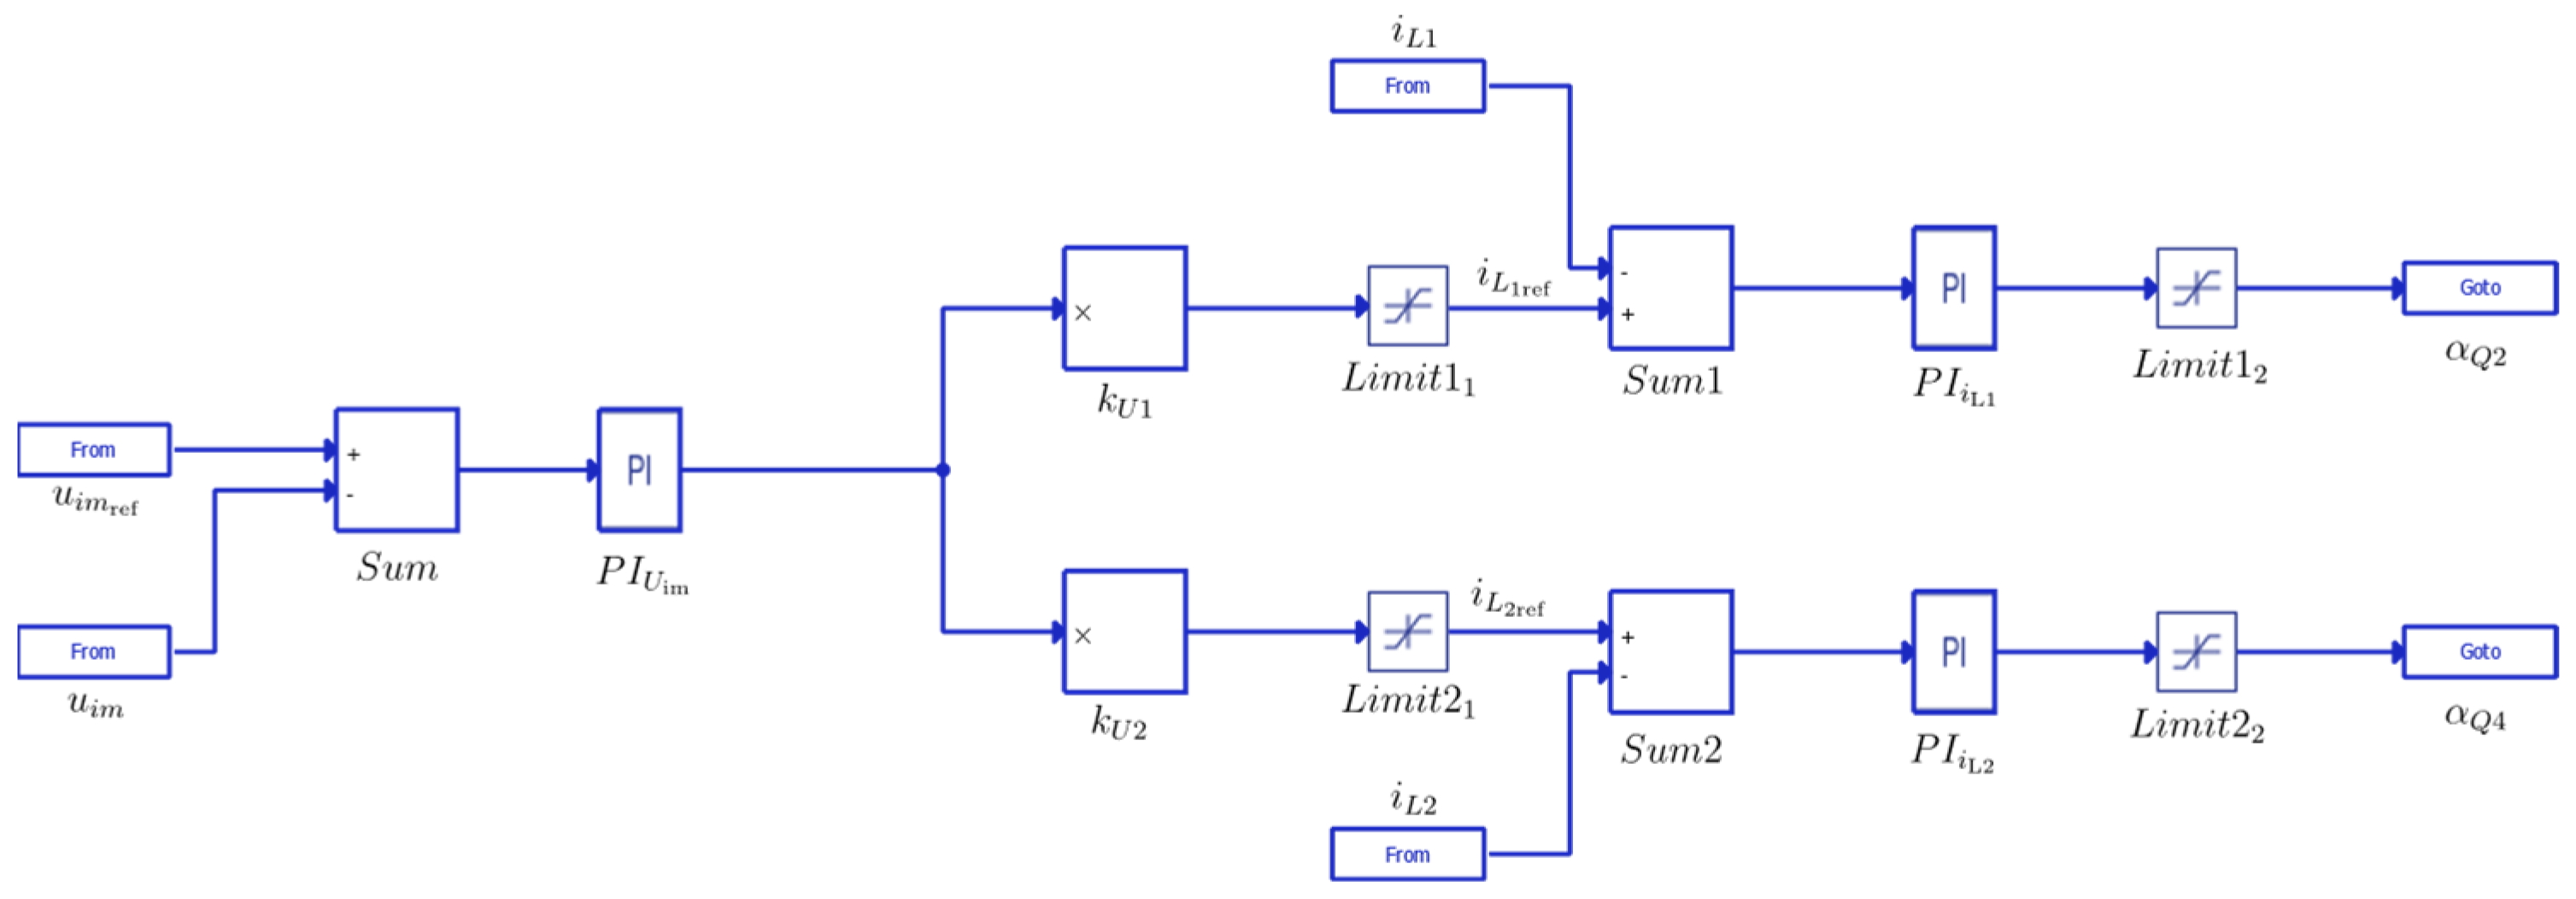
3. Current-Adaptive Control Strategy

By integrating the enhanced thermal model discussed in the previous section into the basic simulation framework, the converter’s efficiency was calculated not only as a function of the generated thermal losses but also accounting for temperature dependency. Consequently, the thermal losses generated within the system were no longer solely influenced by load variations (i.e., current levels) but also by the temperature estimated through the thermal model of the converter. The model also includes the capability for manual selection of branch activation and deactivation, enabling controlled testing under different operating conditions. This feature facilitated simulations of the converter’s losses under varying load conditions. Specifically, the model was tested in two scenarios: one with a single active branch and another with both branches operating simultaneously. Simulations corresponding to these scenarios were conducted, and the resulting data are presented in Figure 10.
The simulation measurement results shown in Figure 10 indicate that the converter efficiency is influenced by the number of active branches under different load conditions. From the perspective of power losses, a higher number of active branches is beneficial for higher loads, while fewer active branches are more suitable for lower loads. Additionally, the results reveal that the current threshold (the intersection point of the efficiency curves) for the boost operating mode is approximately 5.3   A , whereas for the buck operating mode, it is around 6.1   A . These findings suggest that, to maximize the efficiency of the converter system analyzed in this study, a single branch should remain active when the battery current is below 5.3   A in Boost mode or below 6.1   A in Buck mode. Conversely, when the battery current exceeds these thresholds, both branches should be activated to optimize overall system performance.

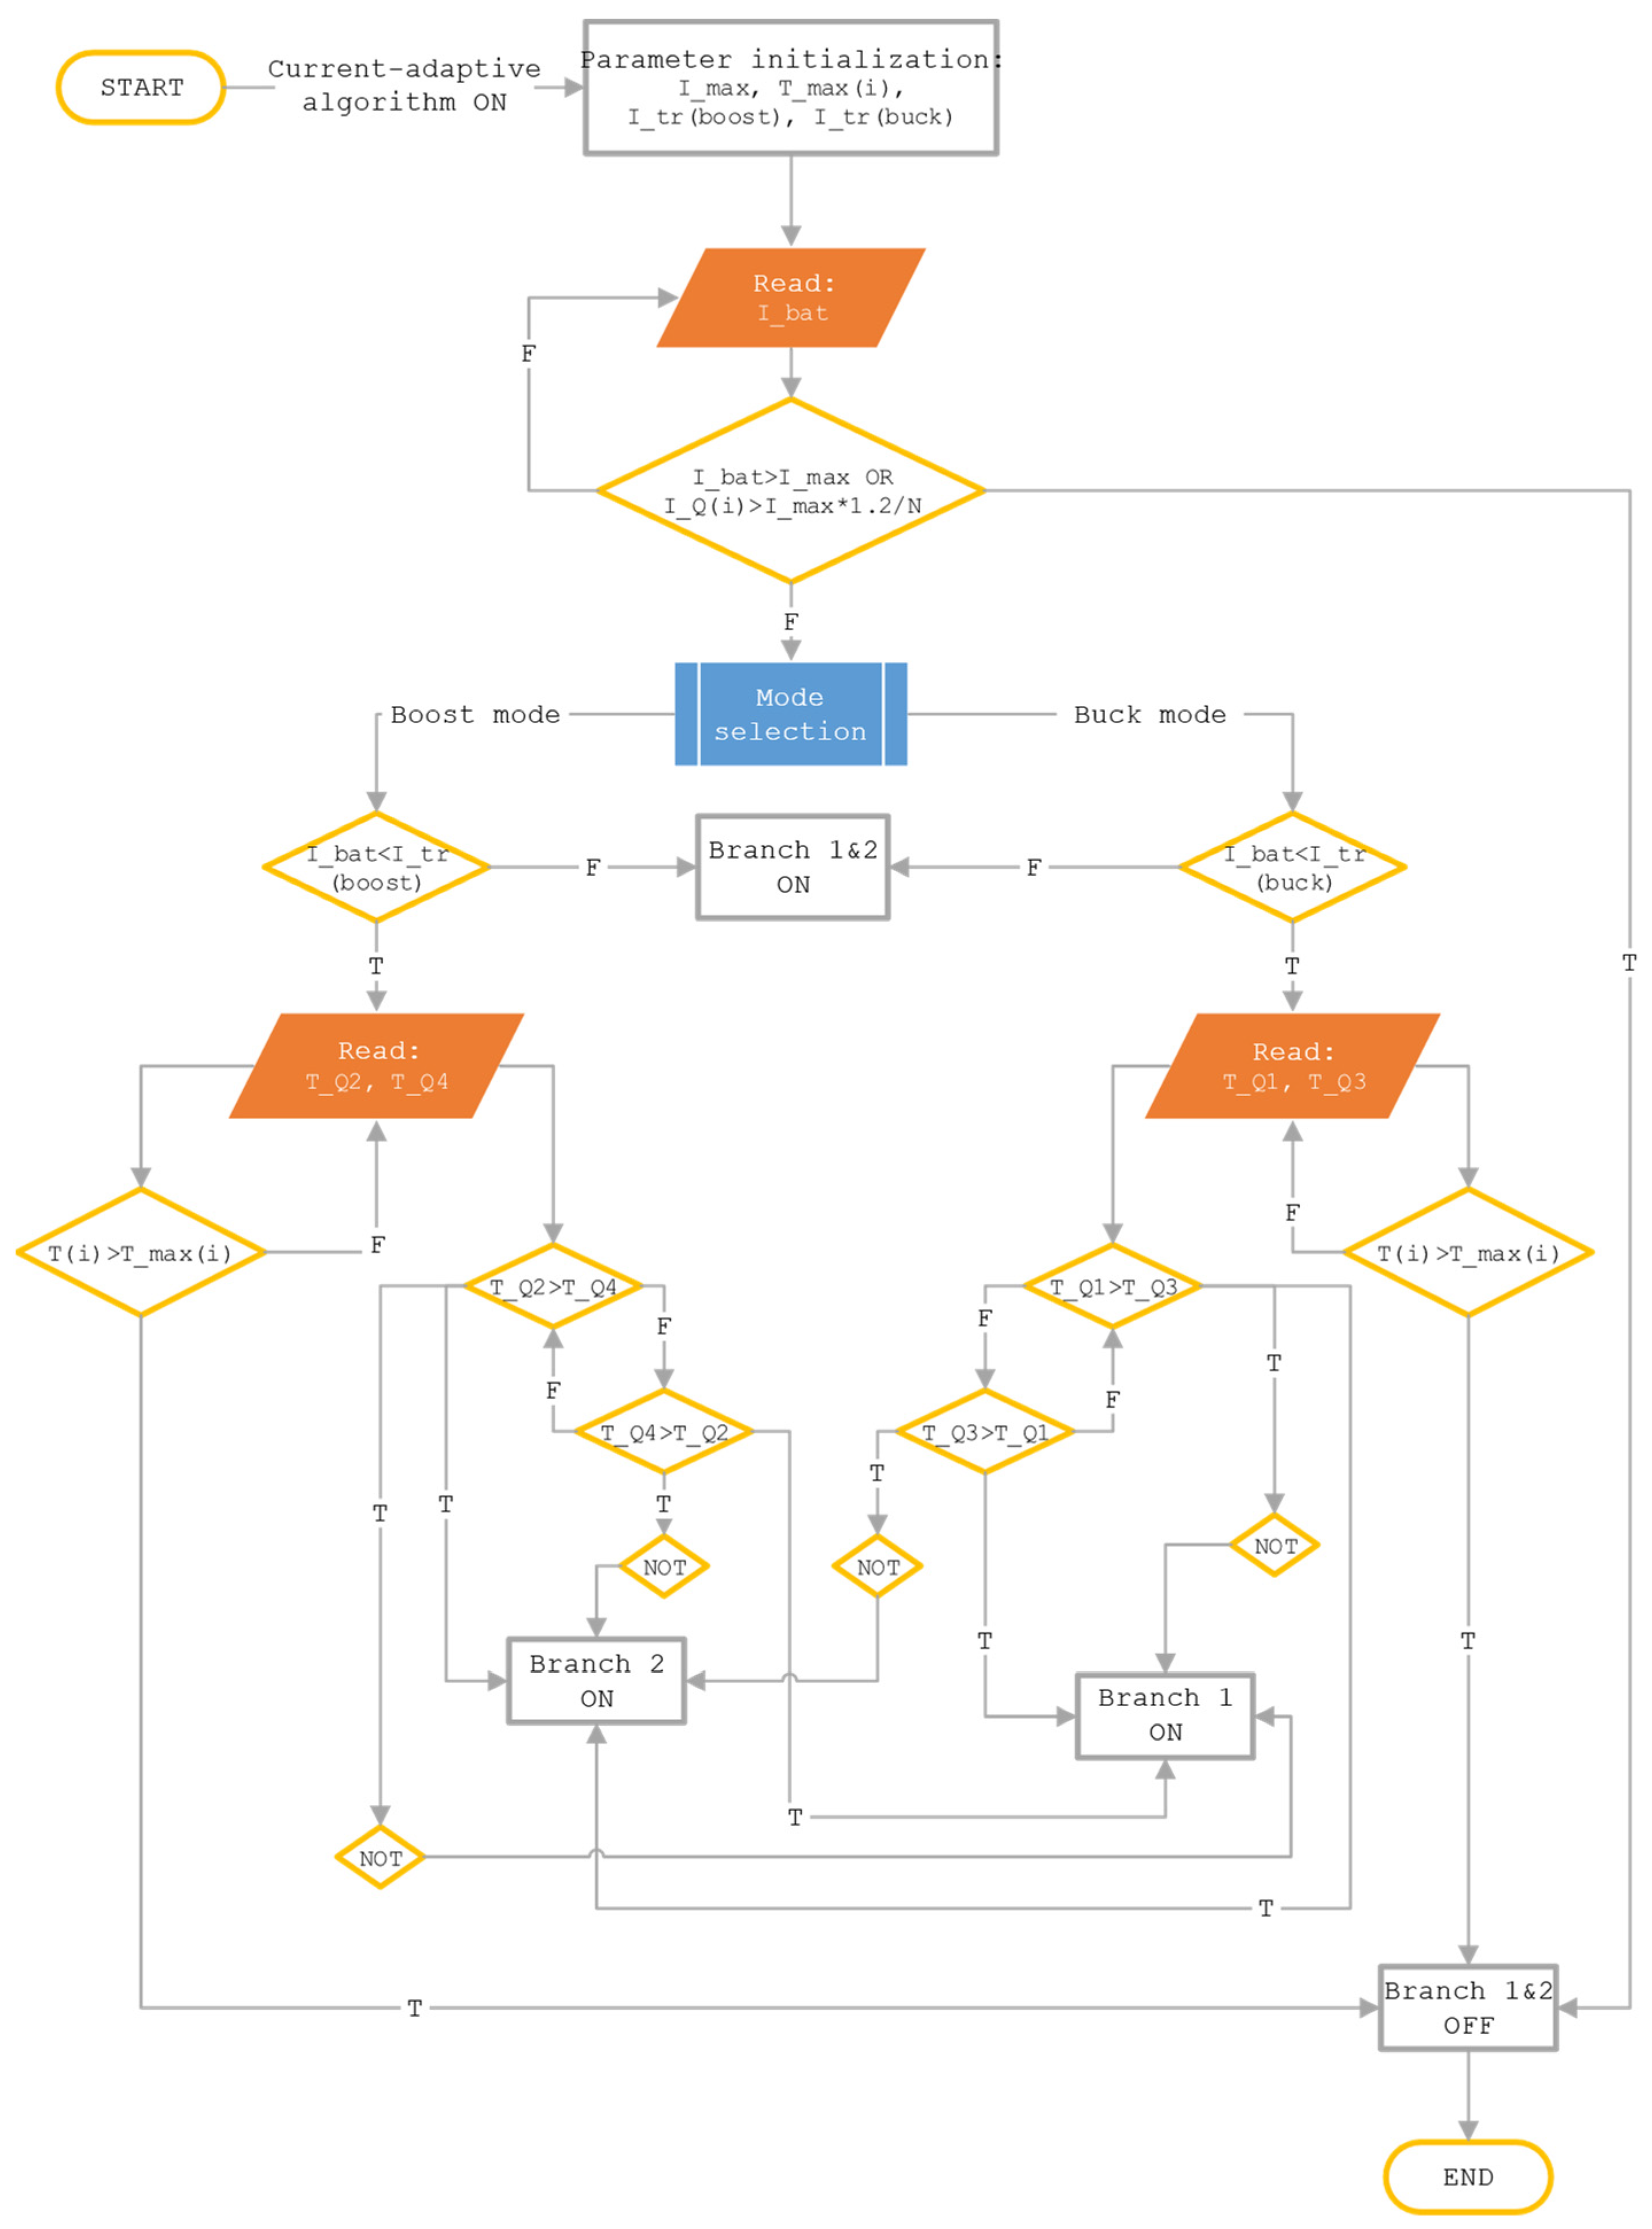
Current-Adaptive Control Strategy Algorithm

Building on aformentioned concept, an algorithm was developed to dynamically adjust the number of active branches in the two-branch BIC. The structure of the proposed current-adaptive algorithm is presented in the flowchart in Figure 11, while its software implementation within the Typhoon HIL Schematic Editor is given in the Supplementary Materials.
The algorithm is based on a current-adaptive control strategy specifically designed to follow the operating regime curve of the battery, ensuring optimized performance in BESS. Considering the bidirectional nature of the converter, the current-adaptive control strategy is integrated within the control loops of both operational modes (as discussed in Section 2). In each iteration, these control loops continuously monitor the battery current and dynamically adjust the activation or deactivation of individual branches based on predefined thresholds.
The current-adaptive algorithm, as depicted in the flowchart in Figure 11, begins when the user activates the current-adaptive algorithm via the Typhoon HIL SCADA interface. The initialization of key parameters necessary for the algorithm’s proper functioning includes the following:
  • I_max: The maximum allowable current in the system.
  • T_max(i): The maximum allowable temperature for each transistor.
  • I_tr(boost): The threshold current triggering the transition from two branches to one, and vice versa, in the boost (ascending) mode.
  • I_tr(buck): The threshold current triggering the transition from two branches to one, and vice versa, in the buck (descending) mode.
After these parameters are set, the algorithm continuously monitors the battery current ‘I_bat’ and the current of each transistor ‘I_Q(i)’. If at any point these currents approach or exceed the predefined limits of ‘I_max’ or ‘I_max(i)’, the algorithm activates protective mechanisms and shuts down all transistors to safeguard the system (the algorithm is intended for integration into the real system).
Depending on the operating mode of the converter selected by the user, the algorithm determines the threshold current, which subsequently governs the activation logic of one or two branches of the converter. Specifically, if the battery current ‘I_bat’ exceeds ‘I_tr(boost)’ in the Boost mode or ‘I_tr(buck)’ in the Buck mode, the algorithm activates both branches of the converter. Conversely, if the battery current ‘I_bat’ is below ‘I_tr(boost)’ or ‘I_tr(buck)’, the algorithm either activates or deactivates the selected branch.
The criterion used by the algorithm to decide which branch to activate or deactivate is based on the current temperature of the transistors. In the selected operating mode, the algorithm deactivates the branch with the transistor exhibiting a higher temperature. In the Boost mode, this involves the temperatures of transistors Q2 and Q4 (‘T_Q2’ and ‘T_Q4’), while in the Buck mode, the relevant transistors are Q1 and Q3 (‘T_Q1’ and ‘T_Q3’), as illustrated in the simulation model schematics provided in the Supplementary Material.
Similar to the current monitoring process, the algorithm activates a protective mechanism and shuts down both branches if the measured temperatures of any transistors, ‘T(i)’, reach the maximum allowable temperature, ‘T_max’. The proposed algorithm, as illustrated in the flowchart in Figure 11, was validated using the Typhoon HIL software system and the Control Hardware-in-the-Loop (CHIL) development methodology.

4. Real-Time Hardware-in-the-Loop Simulation

As mentioned, the validation of the proposed current-adaptive control algorithm was carried out using the CHIL methodology, which serves as a bridge between offline simulations and real-world testing [33]. This approach allows for the implementation and evaluation of control algorithms in real time, while the power stage of the converter remains simulated within the Typhoon HIL 402 platform. In this configuration, the converter’s control system is executed on a dedicated 32-bit ARM Cortex A9 microcontroller integrated within the Typhoon HIL 402 hardware interface, enabling realistic control behavior without the need for a physical power circuit. The previously developed algorithm was implemented on this internal microcontroller to support direct interaction with the simulated converter model during validation. The laboratory setup used for testing is shown in Figure 12. It provides a complete and practical environment for running real-time simulations and checking system performance. In addition to the hardware platform, a SCADA (Supervisory Control and Data Acquisition) system—also called the human–machine interface (HMI)—was used to interact with the model during testing. The SCADA interface (marked as component 2 in Figure 12) allowed the user to monitor key signals, record data, and manage the simulation process easily.
CHIL-based validation offers several advantages for power electronics research, including reduced development time, improved safety, and high model flexibility. By simulating the electrical domain on a real-time FPGA solver and executing the control logic on a user microcontroller (internal or external), the system replicates the behavior of an actual converter under operating conditions. The real-time interaction between control and simulated hardware makes this method suitable for testing advanced strategies such as the current-adaptive algorithm presented in this study.
The Typhoon HIL 402 platform used in this work was configured to support real-time electro-thermal modeling, which is essential for capturing temperature-dependent switching and conduction losses. The developed model includes digital interfaces for control signal routing, a SCADA-based user interface for monitoring, and a configuration that ensures stable operation within the available hardware resources. A simulation step of 500   n s was selected for the FPGA solver, while control loops operated with an execution interval of 50   μ s . Configuration 4 was chosen for this study as it enables thermal model integration, which plays a central role in the algorithm’s temperature-aware decision-making process. This methodological setup allows the proposed control algorithm to be tested in real time without the need for early-stage physical prototyping. The use of real-time simulation combined with integrated control execution helps to evaluate the performance of the control strategy under realistic operating conditions in a safe and controlled environment.

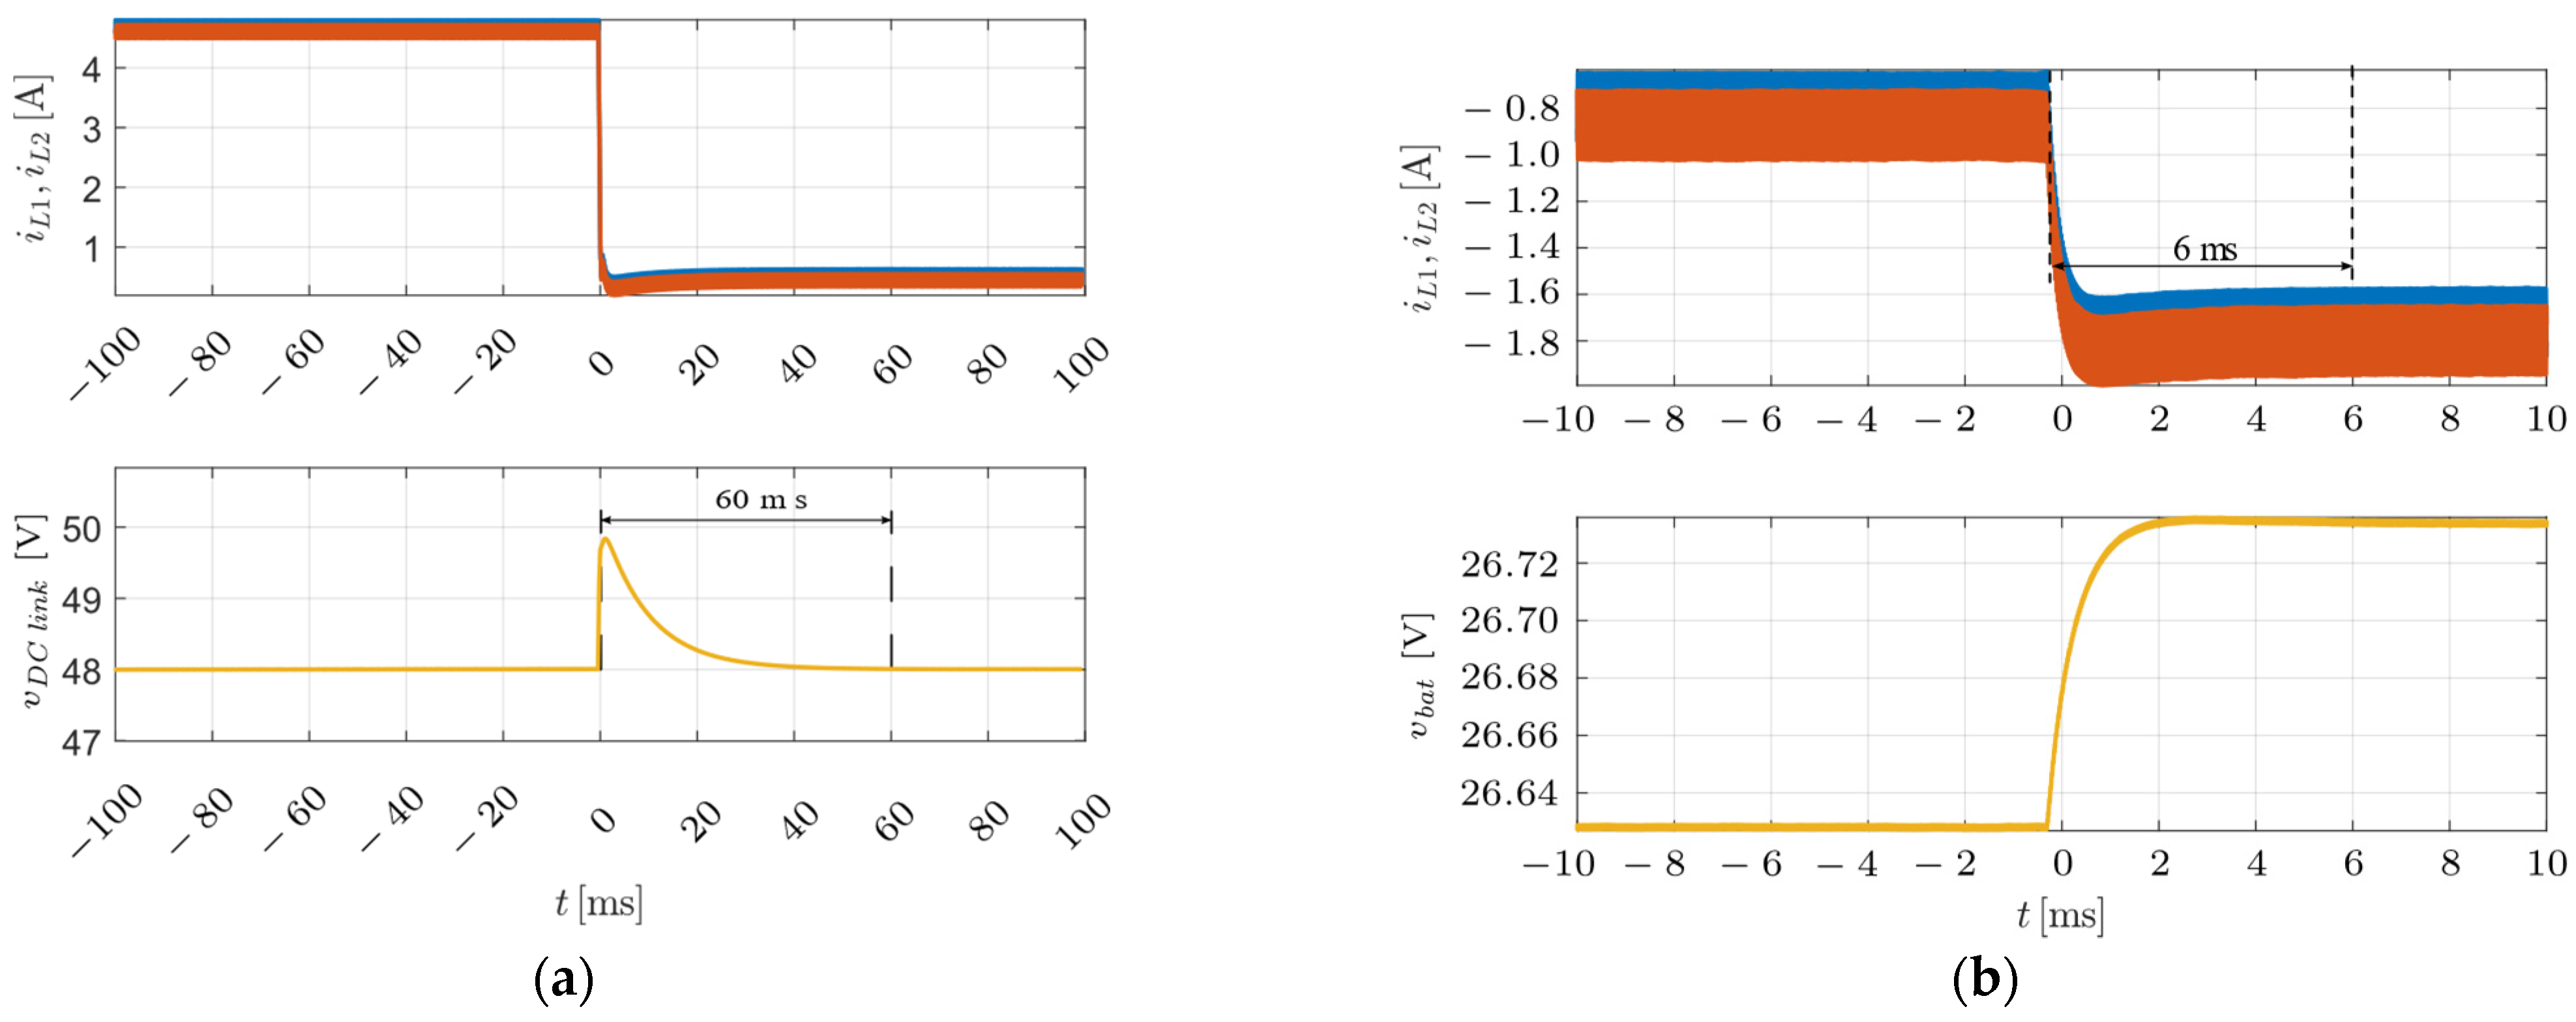
4.1. Converter Simulation Model Validation

To validate the regulated simulation model of the converter, an initial set of measurements was designed for both operating modes, including battery charging and discharging, to ensure proper operation by analyzing the recorded waveforms and verifying the direction of energy flow. The basic parameters of the converter used in the simulation are given previously in Table 1. The parameters of the two measurement sets are given in Table 2.
The recorded waveforms of the converter (Figure 5), corresponding to the measurement sets in Table 2, are shown in Figure 13. These waveforms were sampled with a period of t u = 1   μ s using the Typhoon HIL environment for data acquisition, followed by final data processing in MathWorks MATLAB (R2023b) environment.
Figure 13 illustrates the phase shift of the control signals, which is ϕ = 180 ° in both operating modes. This phase shift is clearly reflected in the inductances currents i L 1 and i L 2 .
The direction of energy flow is clearly depicted in Figure 13, where the reference direction (positive sign) corresponds to Boost mode, indicating battery discharging, while the opposite direction (negative sign) represents Buck mode, indicating battery charging. Overall, based on the recorded waveforms in Figure 13, it can be concluded that the simulation model of the converter operates correctly, as intended. The next step is to validate the current-adaptive control algorithm.

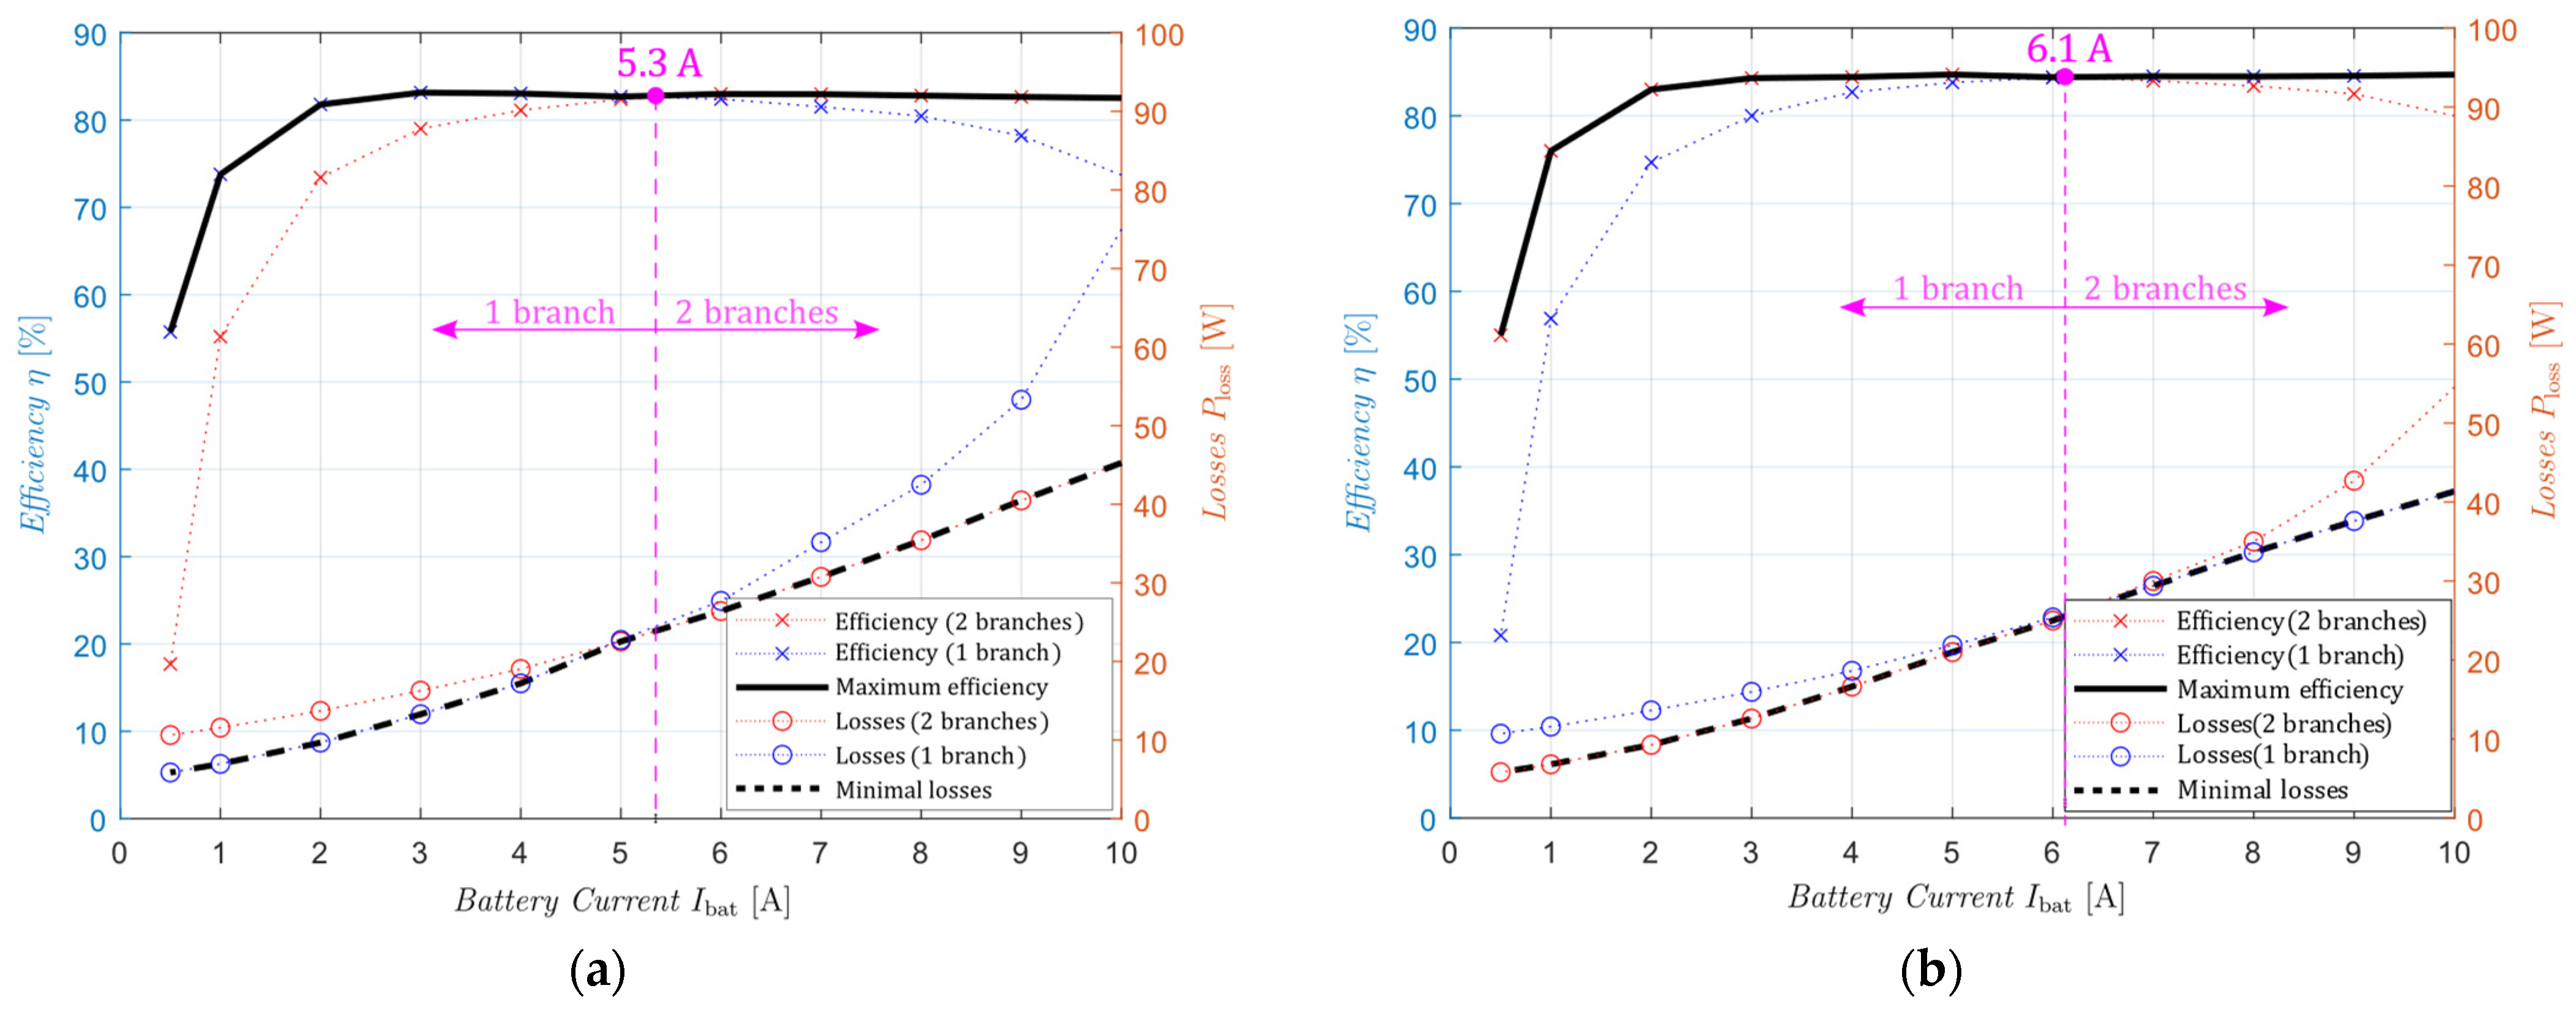
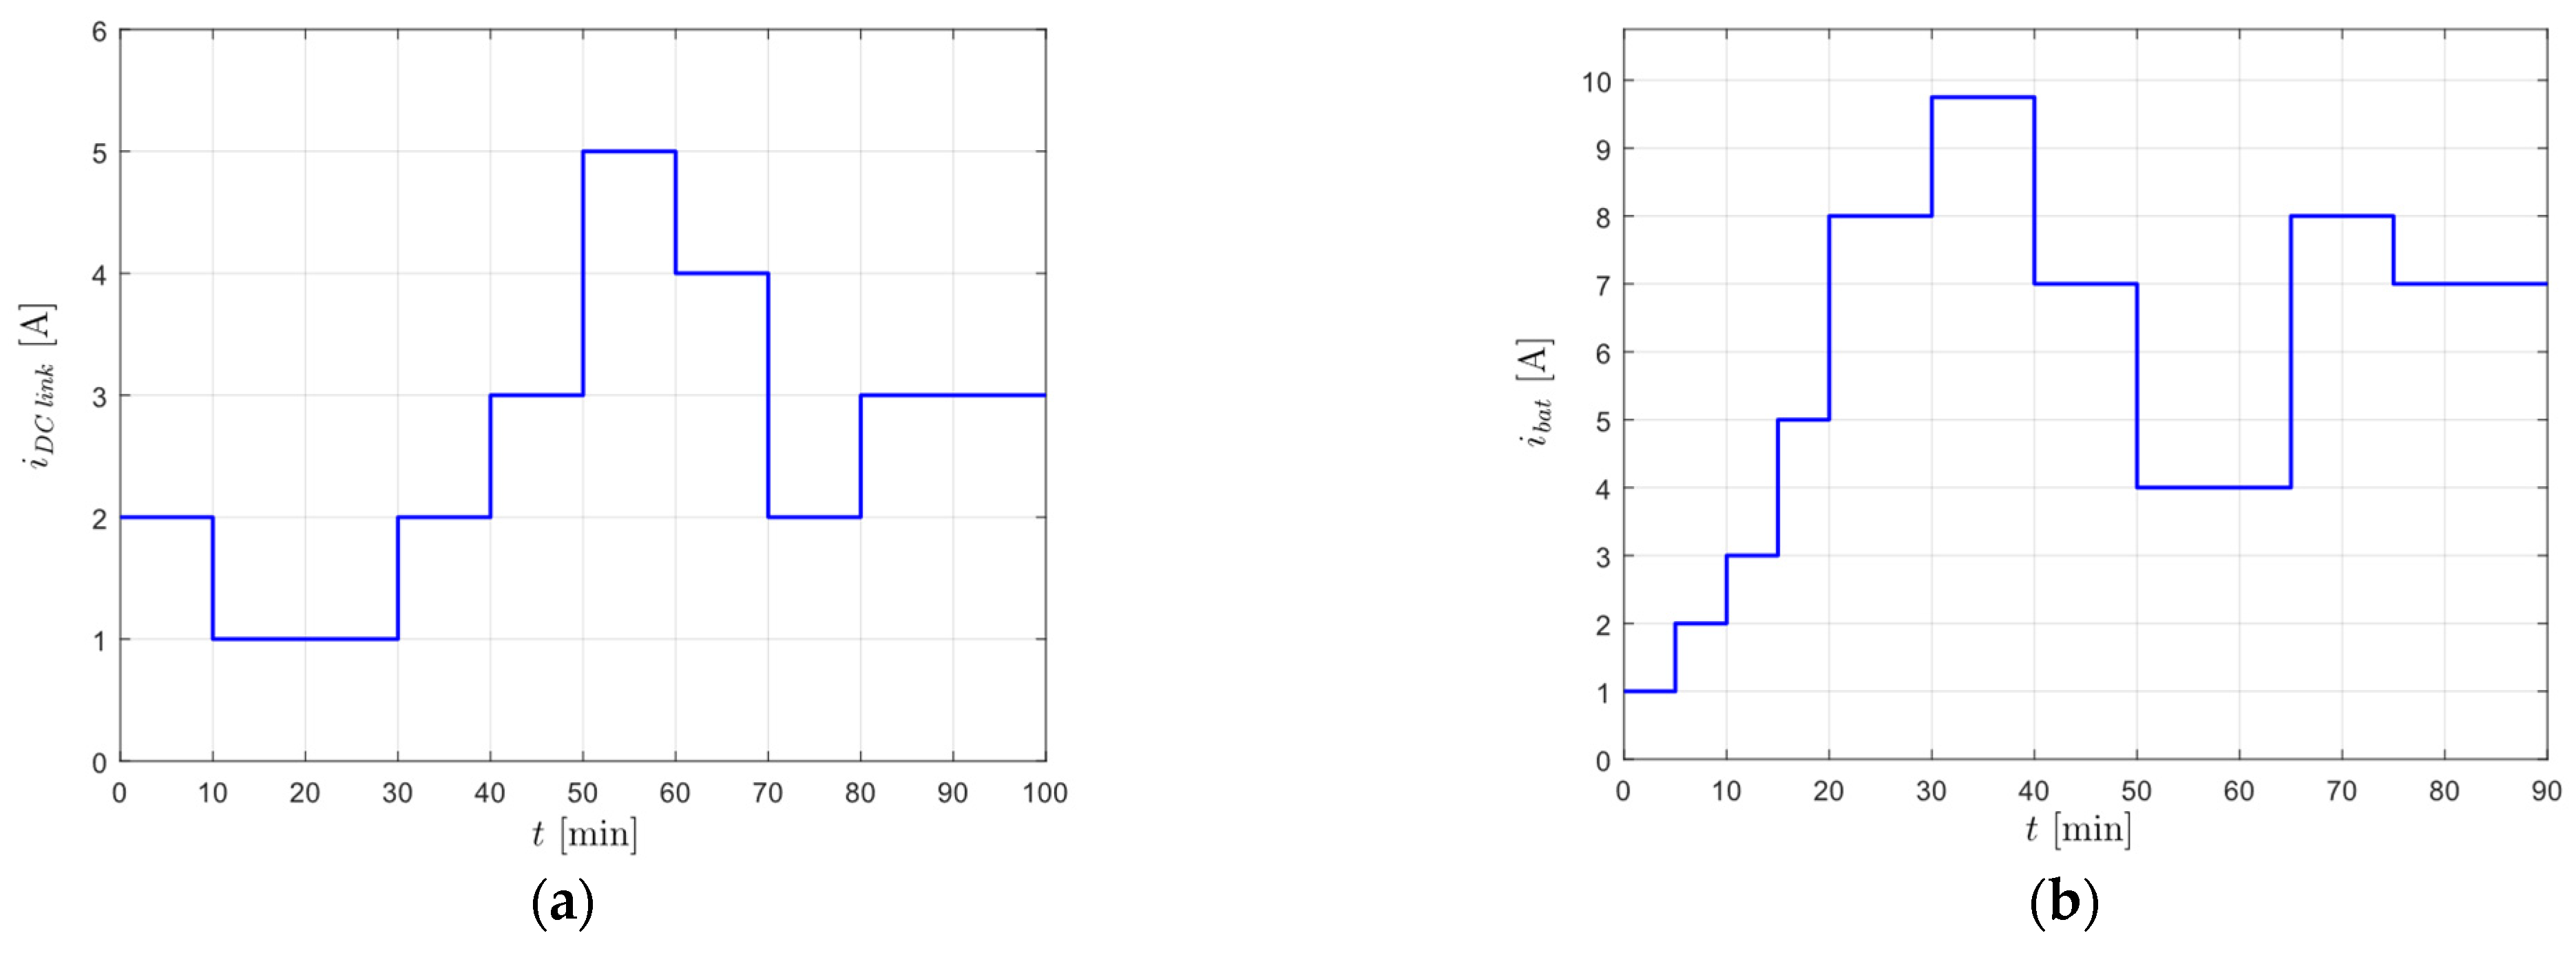
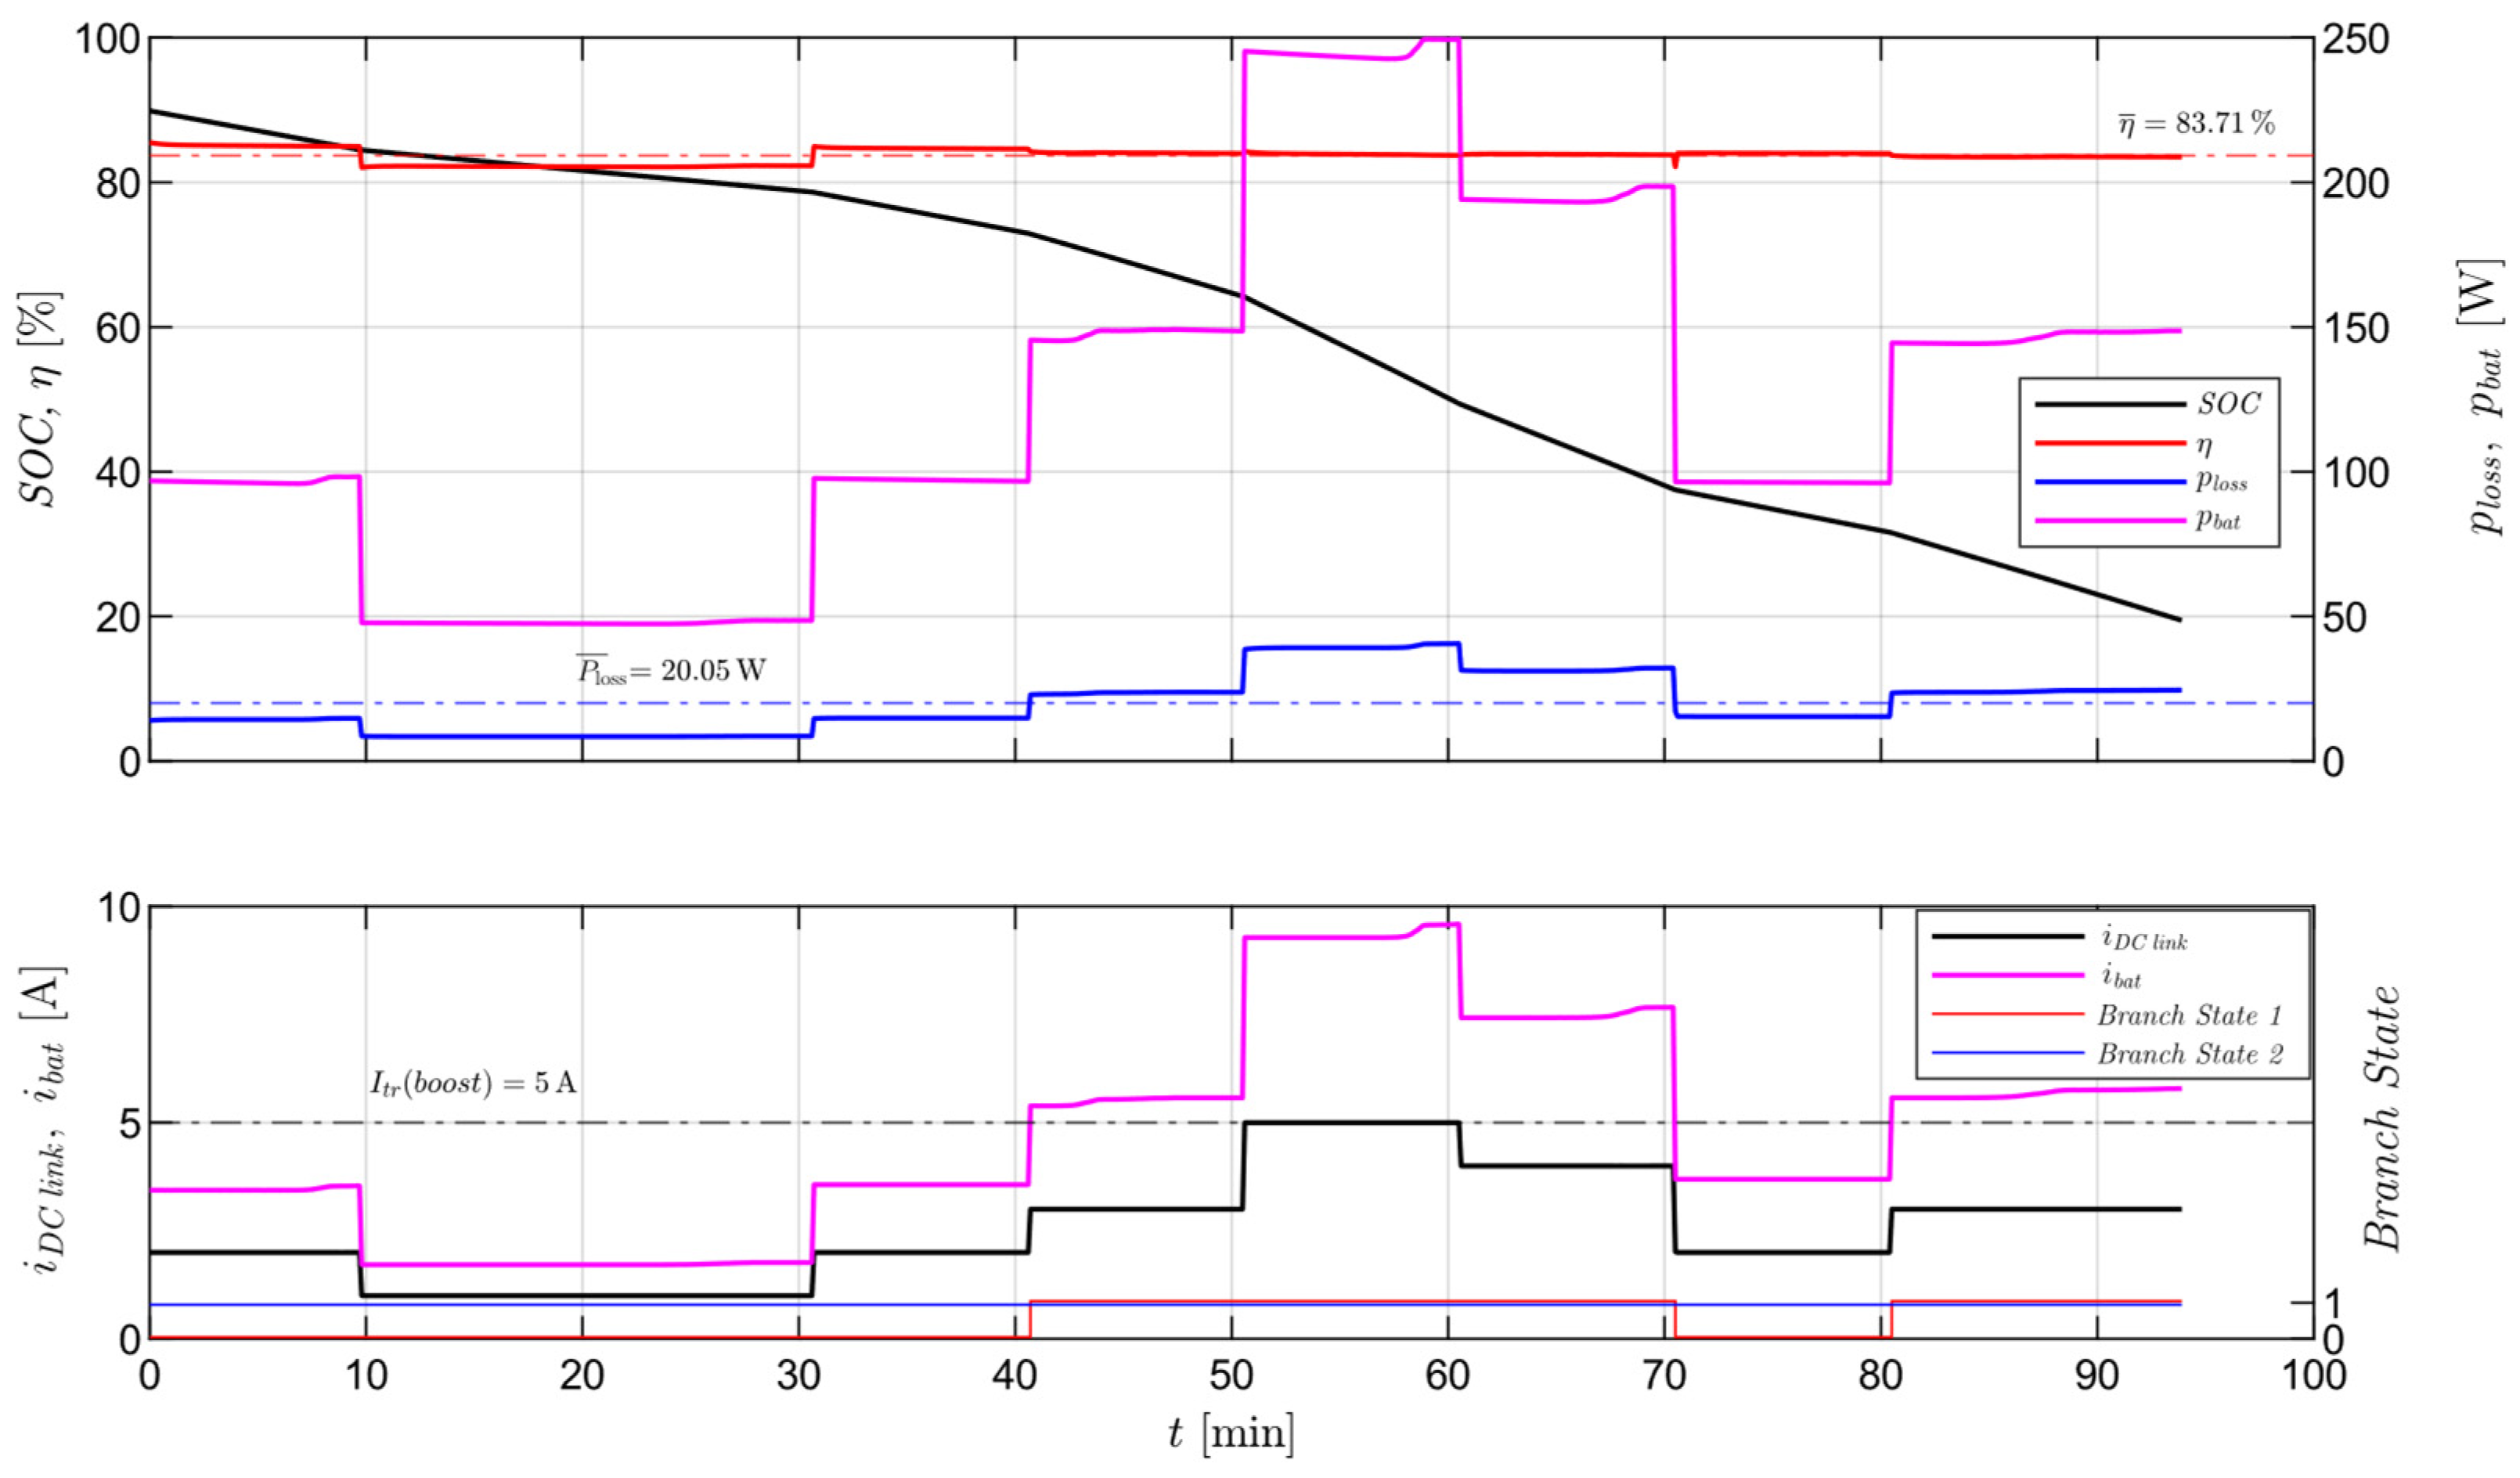
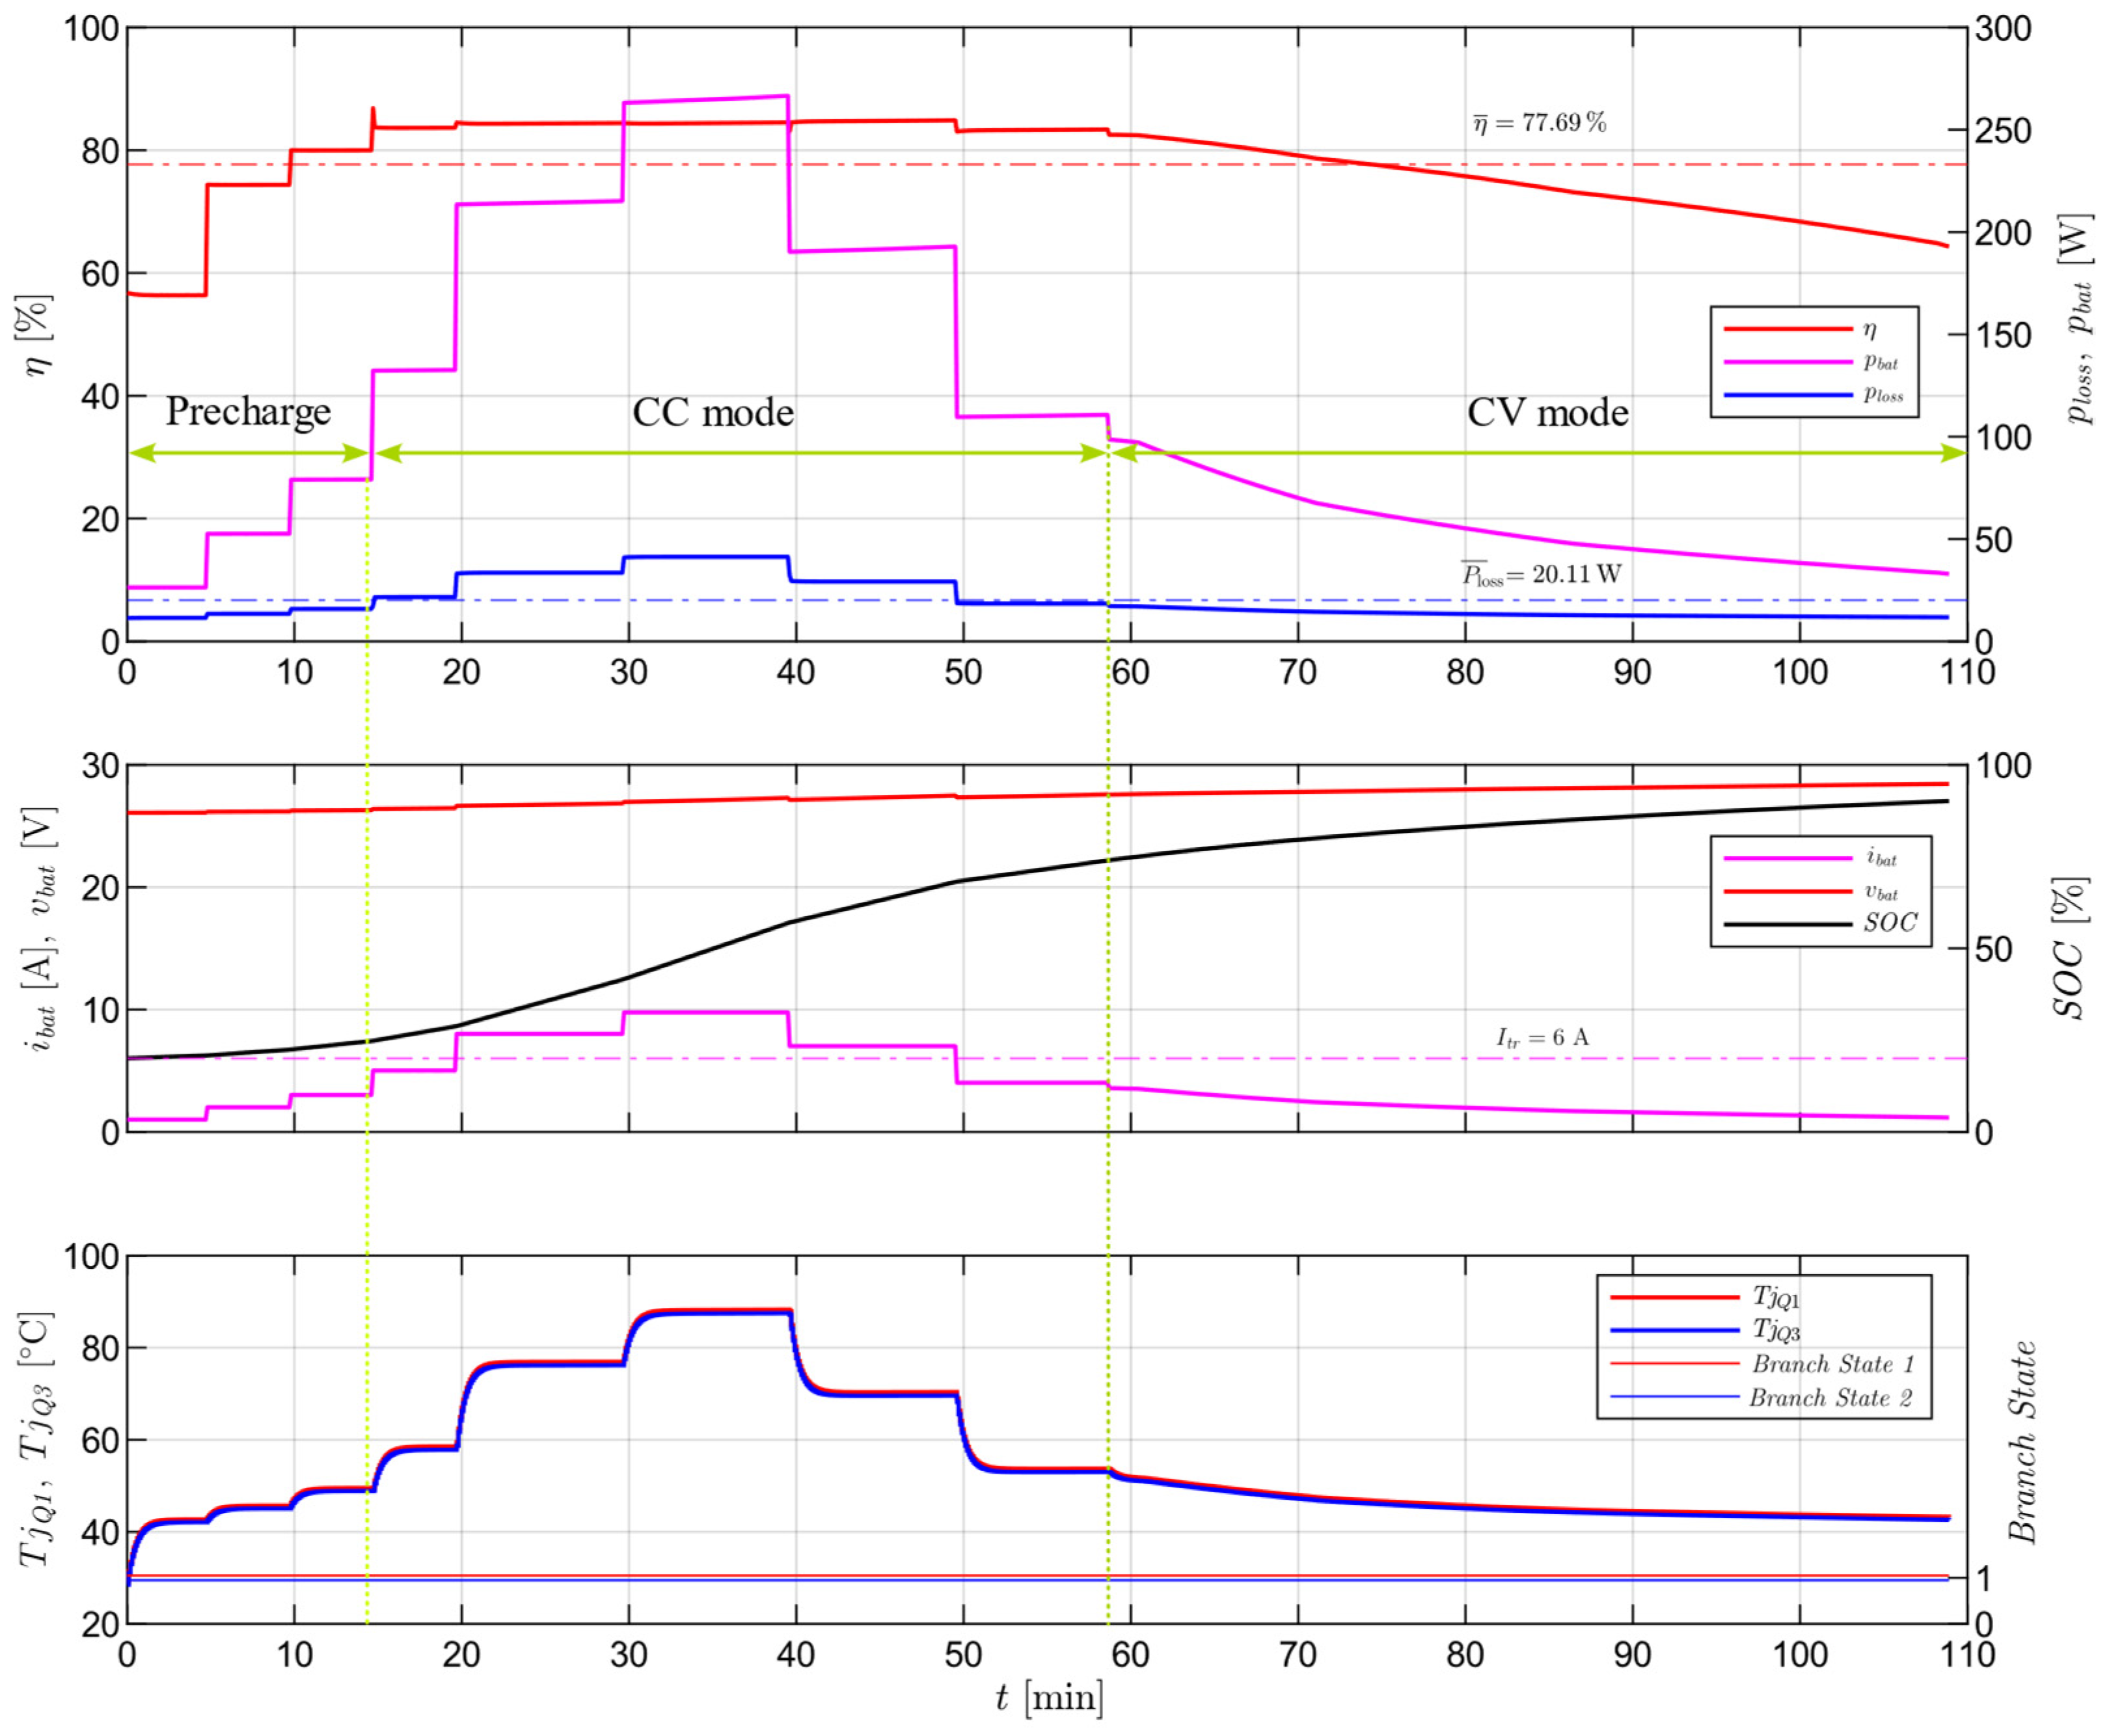
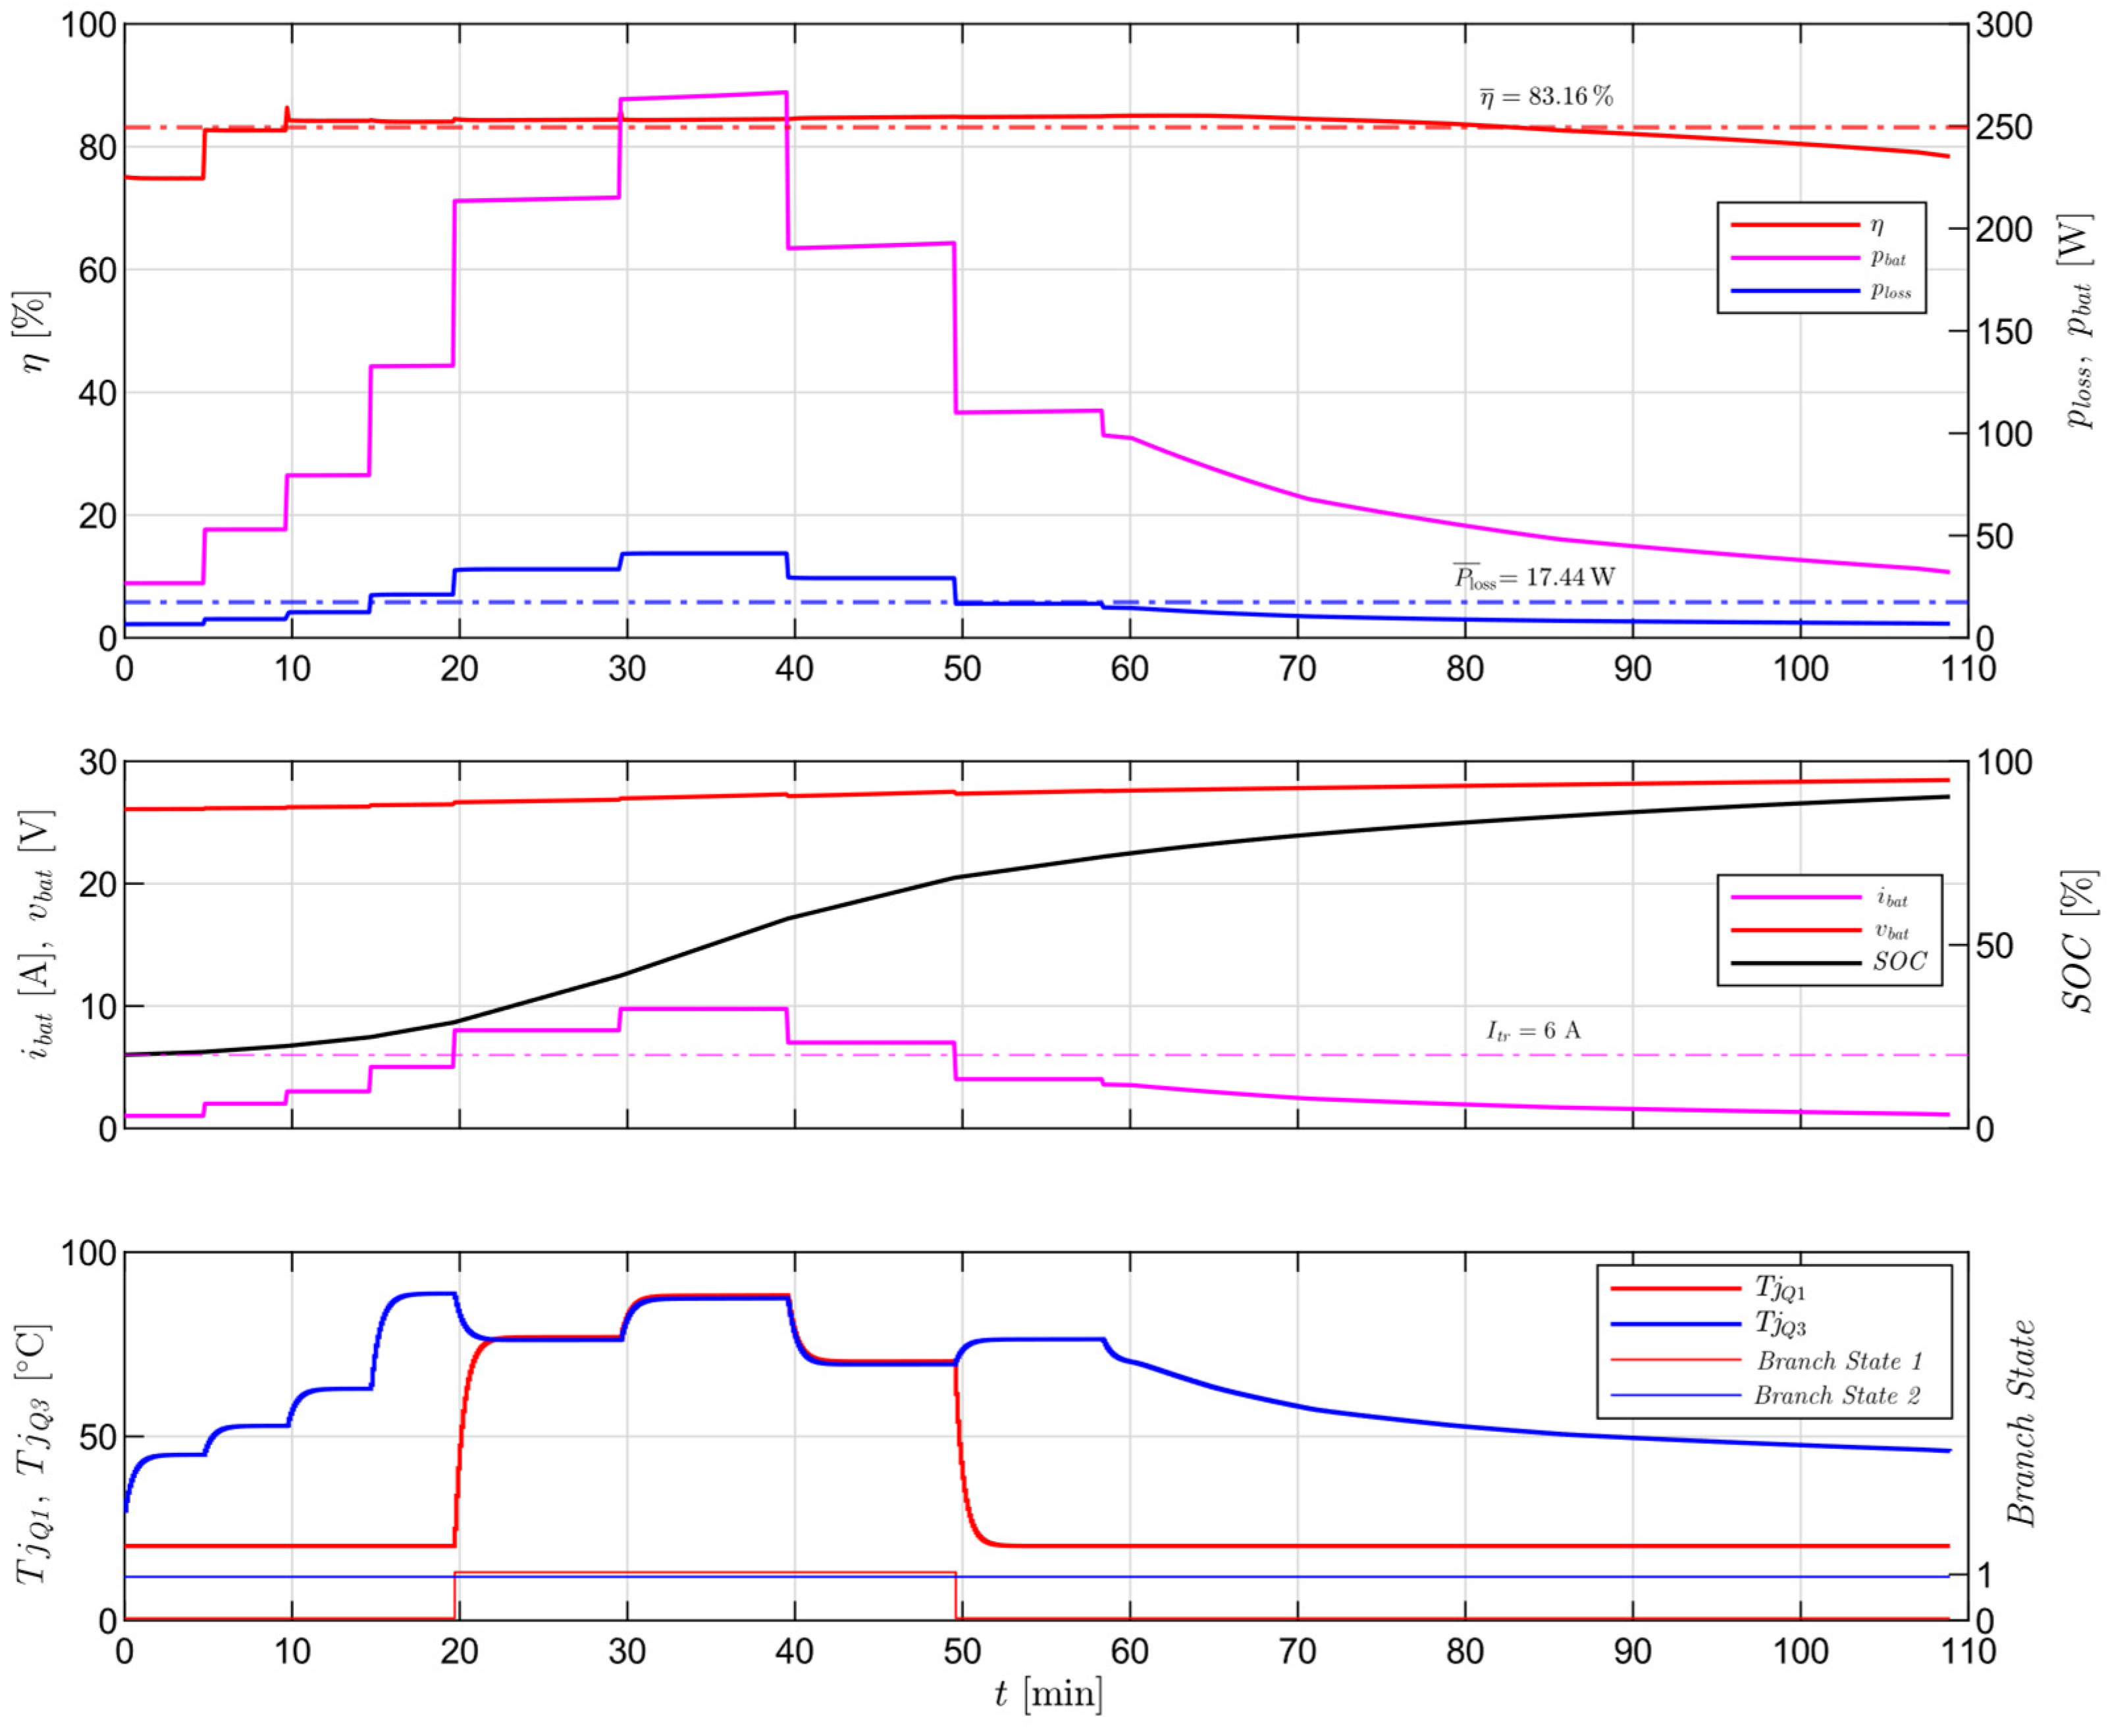
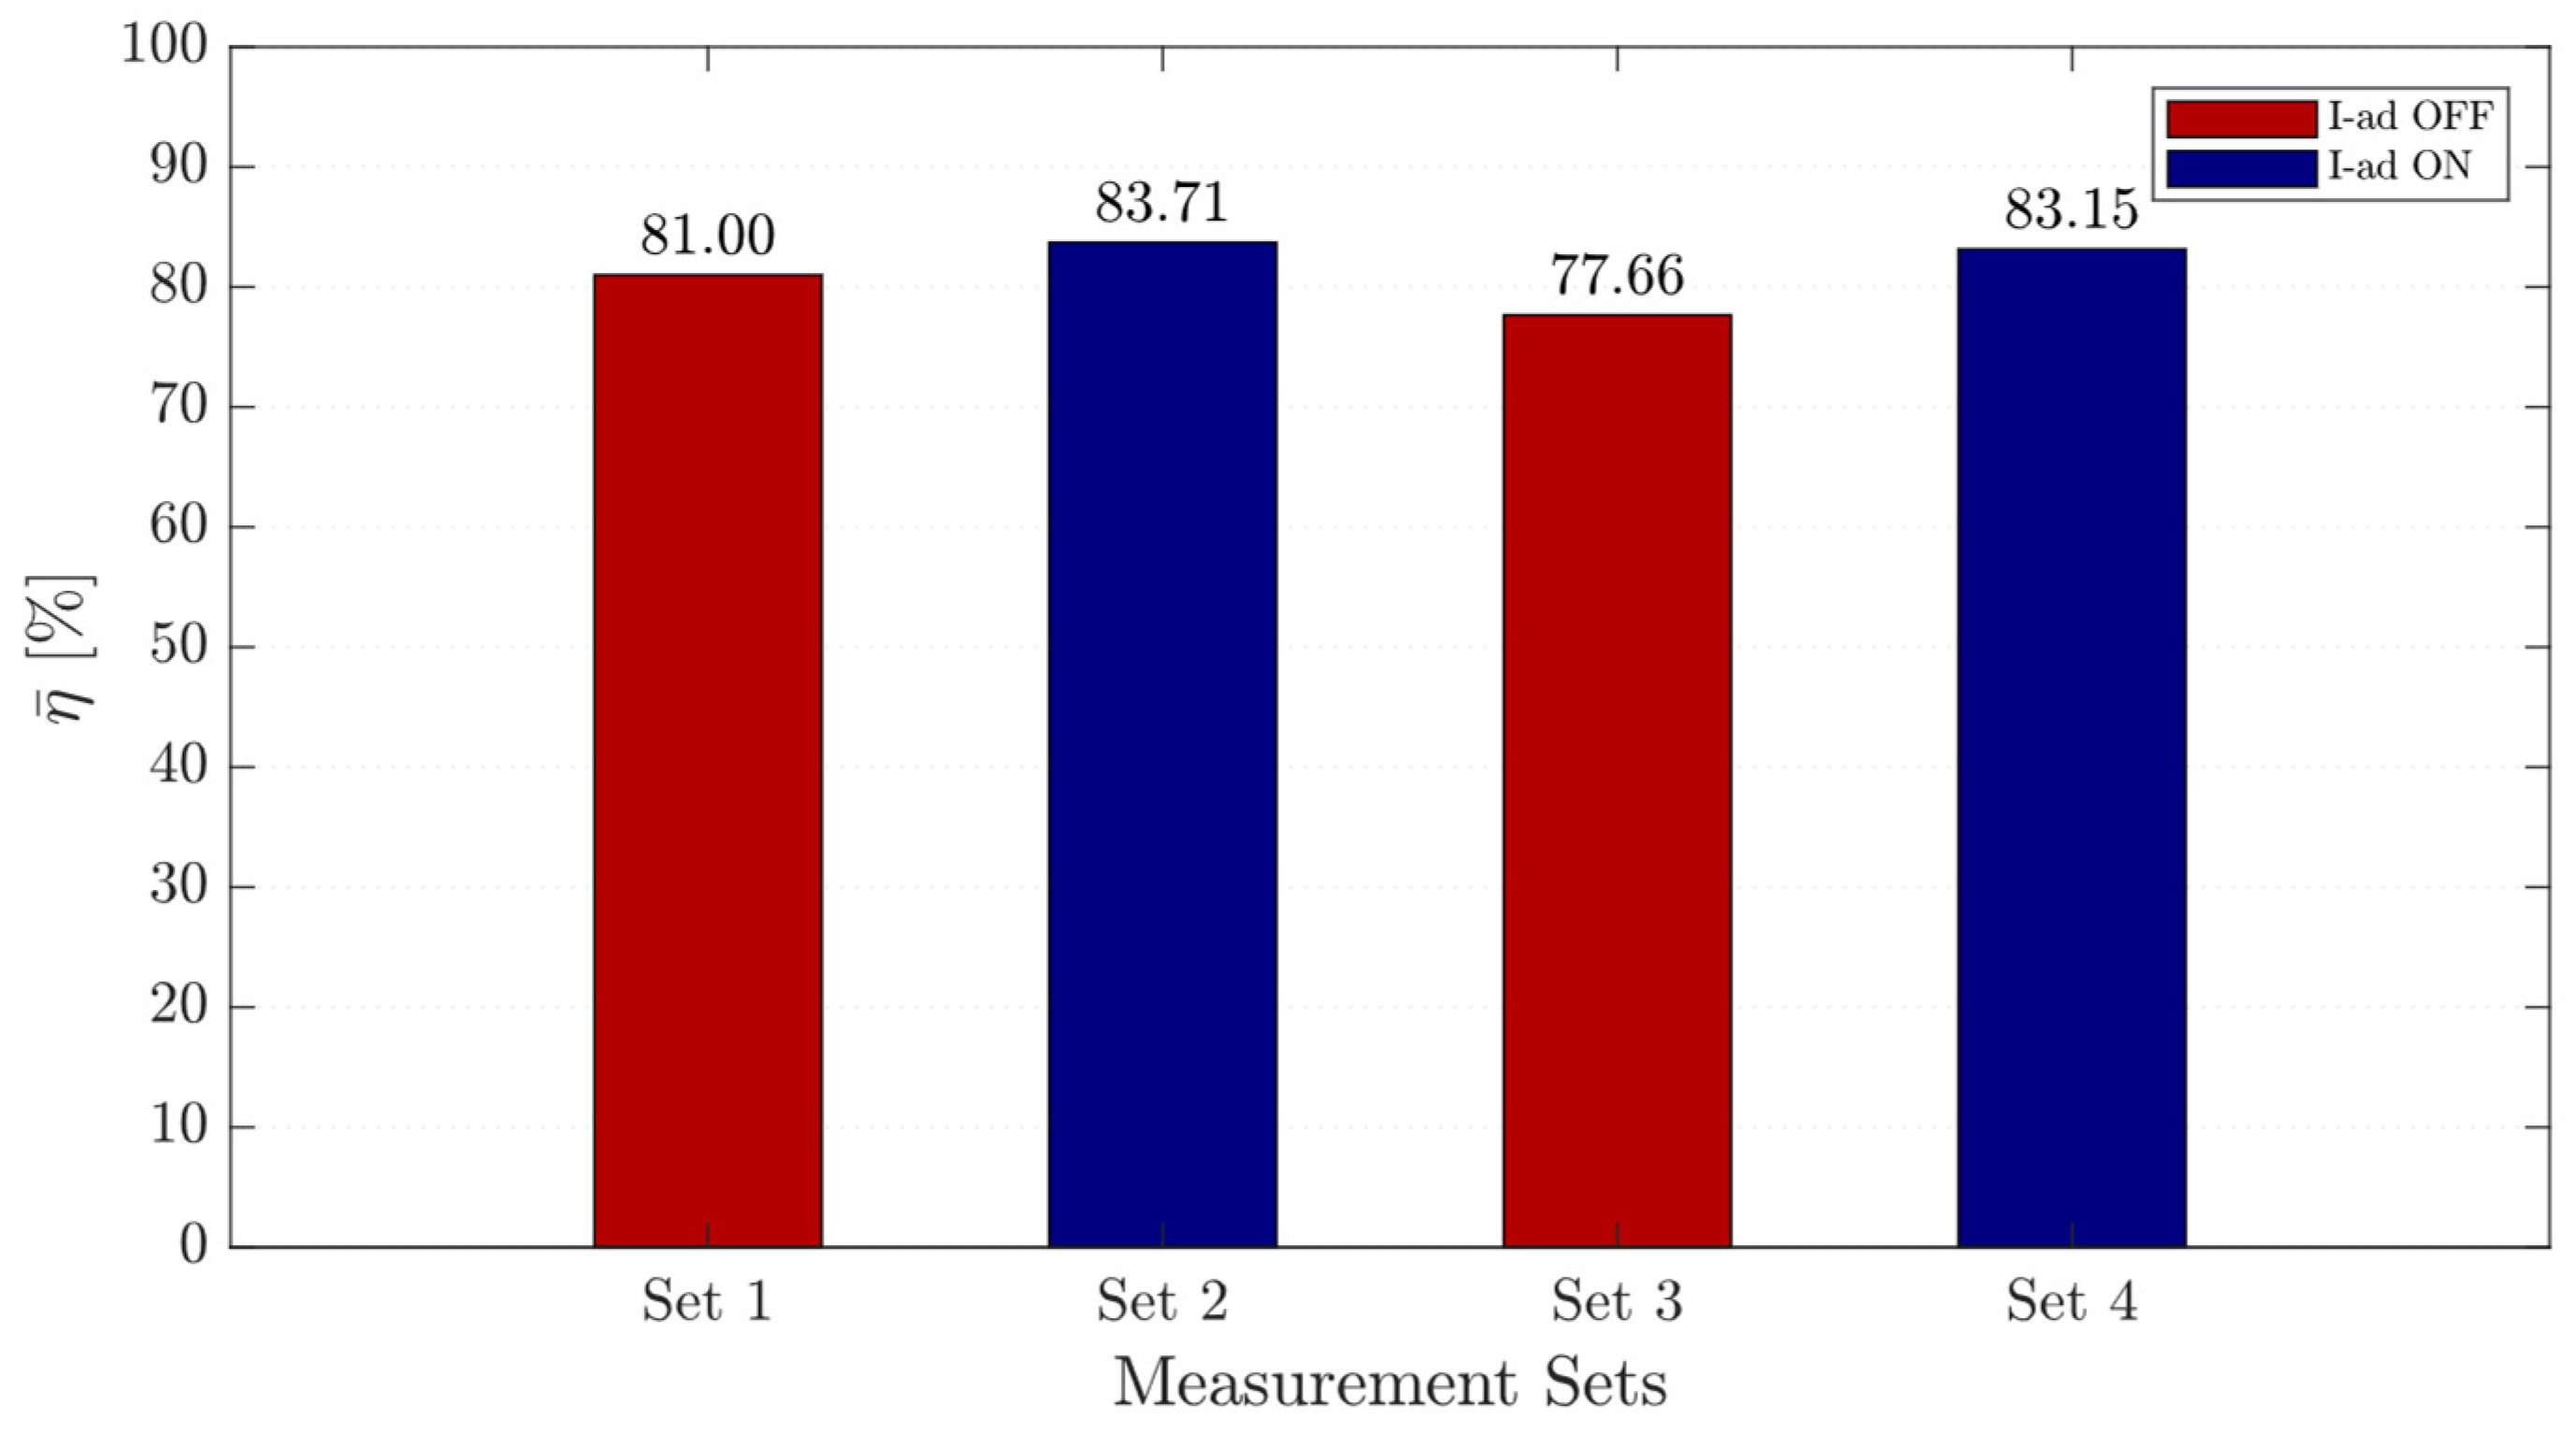
4.2. Current-Adaptive Control Algorithm Validation

The proposed measurement sets for validating the current-adaptive control algorithm are presented in Table 3. The objective is to compare converter operation with and without the current-adaptive algorithm in both charging and discharging modes. These simulation sets are designed to comprehensively evaluate the algorithm’s impact on converter performance, particularly in terms of energy losses and efficiency.
To ensure an unbiased validation of the current-adaptive algorithm, dynamic battery load profiles were designed for both operating modes, charging and discharging, as shown in Figure 14. According to these profiles, the converter will operate approximately 50 % of the total simulation time below the activation threshold of the current-adaptive algorithm and around 50 % above the activation threshold.
The regulation of the converter current is implemented on the battery side, utilizing both the inductance and battery currents. This approach enables the definition of load variations in both operating modes based on selected battery operating mode curves. In the Buck mode, the load is determined by the battery current i b a t , while in the Boost mode, it is defined by the DC-link current i D C   l i n k , as shown in Figure 14. All simulation results are presented in Figure 15, Figure 16, Figure 17 and Figure 18.
During the simulation, measurements are sampled every Δ t = 6   s (10 samples per minute) according to Table 3, including the instantaneous battery power p b a t   W , converter losses p l o s s   W , and converter efficiency η B I C [ % ] . The measurement results for Set 1 (according Table 3) are shown in Figure 15.
For clarity, the simulation results presented in Figure 15 and Figure 16 are divided into two sections. The upper section of the graph contains key data required for evaluating the converter’s efficiency, while the lower section provides information relevant to analyzing the state of the current-adaptive algorithm. Set 1 serves as a reference case, assuming that both branches remain active throughout the entire simulation, as indicated by the states of Branch 1 and Branch 2. This configuration is maintained regardless of the measured battery current i b a t and the threshold current for activating the current-adaptive algorithm I t r b o o s t , as outlined in the flowchart in Figure 11.
The defined load curve, presented in Figure 14, is also reflected in the results on the i D C l i n k graph in Figure 15, demonstrating consistency in both qualitative and quantitative aspects with the obtained results. Given the specified parameters of the load curve, a clear trend is observed in the variation of instantaneous battery power p b a t and instantaneous converter power losses p l o s s . The key indicator for assessing the validity of the algorithm is the average converter efficiency η ¯ , which is derived from the instantaneous converter efficiency η using the following expression:
η ¯ = 1 n i = 1 n η i
where n represents the total number of samples, and η i denotes the instantaneous efficiency at the i -th sample. Similarly, the average converter losses p l o s s are calculated using the same approach. Prior to analyzing the specific data, it is essential to examine the behavior of efficiency and other system parameters when the current-adaptive algorithm is active during the converter’s operation. Figure 16 presents the simulation results for Set 2 (according to Table 3), illustrating the scenario in which the current-adaptive algorithm is enabled. Observing these results provides insight into the impact of adaptive branch activation on system performance.
The simulation results presented in Figure 16 clearly illustrate the impact of the current-adaptive algorithm. At the start of the simulation, only Branch 2 is active, with the reason for this behavior to be explained in subsequent Sets 3 and 4. Around the 40 th min of the simulation, the battery current i b a t surpasses the threshold current for activating the current-adaptive algorithm I t r b o o s t , leading to the activation of Branch 1. Both branches remain active until approximately the 70 th min of the simulation. Between the 70 th and 80 th min, the system reverts to single-branch operation; however, after the 80 th min, the algorithm reactivates both branches and maintains their activation until the end of the simulation.
Since the simulation measurement sets were designed to ensure unbiased validation of the algorithm’s performance—allocating approximately 50 % of the time with a single active branch and 50 % with both branches active—the observed increase in average efficiency η ¯ from 81 % (Set 1) to 83.71 % (Set 2) confirms the effectiveness of the proposed current-adaptive algorithm in the boost operating mode of the converter. It is important to emphasize that this increase in average efficiency η ¯ is not fixed but varies depending on the load conditions, system losses, and the proportion of time during which one or both branches remain active within the observed operating period. The processed simulation results for Set 1 and Set 2 are summarized in the processed results in Table 4.
The validation of the proposed algorithm was also conducted for the buck operating mode, following the same approach as in the Boost mode, as illustrated in Figure 17 and Figure 18. Here, the load variations differ slightly compared to the Boost mode, as proper Li-ion battery charging always follows two primary modes: constant current (CC) and constant voltage (CV) [34]. Consequently, the battery power p b a t fluctuates throughout the charging process, resulting in the automatic activation of the current-adaptive algorithm whenever the battery operates in constant voltage (CV) mode. This occurs because the charging current gradually decreases from the set value to nearly zero as the battery reaches full charge. To ensure the current-adaptive algorithm functions in the constant current (CC) mode, where the charging current varies rather than remaining constant, a dedicated battery charging mode curve was designed (Figure 14b). The stepwise definition of this curve enables the activation and deactivation of the algorithm, demonstrating its applicability in CC mode and ensuring its functionality during this phase of the charging process.
The simulation results for the buck operating mode without the activation of the current-adaptive algorithm (Reference; Set 3, Table 3) are presented in Figure 17.
The simulation results are structured into three main sections. The upper section includes key graphs depicting efficiency η , battery power p b a t , and converter losses p l o s s . The middle section focuses on the battery operating mode curve, providing data on battery voltage u b a t , current i b a t , and state of charge S O C . The lower section of the figure illustrates the activity status of individual branches and the junction temperatures of the relevant transistors, T j Q 1 and T j Q 3 . The total simulation duration is defined by the initial and final battery state of charge, constrained within 20 % < S O C < 90 % , as well as the selected battery charging current I b a t . The battery operating mode curve in the simulation consists of several phases: pre-charging, constant current (CC) charging, and constant voltage (CV) charging, as would also be the case in a real BESS.
In real system, the initial pre-charging phase is particularly important when the battery is at a minimal state of charge ( S O C = 20 % ), as it ensures a controlled and safe charging process. This phase is essential for preventing potential damage that may occur when attempting to charge a deeply discharged battery [35]. During pre-charging, a lower current is applied to gradually increase the SOC to a threshold level where the transition to the constant current charging phase can safely occur. During the second phase of battery charging, algorithms typically regulate charging at a constant current. However, alternative approaches exist for this phase, as demonstrated in the simulation results for Set 3 and Set 4 (Table 3). In this case, a Multistage Constant Current (MCC) charging approach was implemented, enabling more dynamic control of the charging process compared to conventional methods [36].
The final charging phase at constant voltage typically begins when the battery’s S O C reaches between 70 % and 80 % . In the simulation, this threshold was set at S O C = 74 % , based on recorded real-world charging characteristics of the 7S3P battery pack (see Appendix A; Figure A1). The battery power graph p b a t follows the load curve of the battery current i b a t . It is important to emphasize that, from the conventional perspective of energy flow in a bidirectional converter, both of these quantities are inherently negative. However, for clarity in interpretation, their absolute values are presented.
The average system efficiency, based on the defined battery operating mode curve in Set 3, is η ¯ = 77.69 % , while the average losses amount to P ¯ l o s s = 20.11   W . From the branch activity statuses shown in Figure 17, it can be observed that both converter branches remain active throughout the entire charging cycle, confirming that the current-adaptive algorithm is inactive.
The lower section of Figure 17 displays the temperatures of the individual branch transistors, providing insight into the thermal behavior of transistors Q 1 and Q 3 . Before conducting a detailed analysis of the simulation measurement results, an additional simulation was performed with the current-adaptive algorithm activated. The results of this simulation, corresponding to Set 4, are presented in Figure 18.
The processed simulation results for Set 3 and Set 4 are presented in Table 4. The simulation results with the current-adaptive algorithm enabled indicate an increase in average efficiency from η ¯ = 77.69 % to η ¯ = 83.15 % and a reduction in average losses from P ¯ l o s s = 20.11   W to P ¯ l o s s = 7.42   W , as also illustrated in Table 4. The average efficiency η ¯ and average losses P ¯ l o s s are determined using the following expressions:
η ¯ = 1 n i = 1 n η i P ¯ l o s s = 1 n i = 1 n P l o s s , i
where n —the total number of measurements in the set, η i —efficiency measured at the i -th sample, and P l o s s , i —power loss measured at the i -th sample.
The relative percentage change Δ I a d in average efficiency η ¯ and average losses P ¯ l o s s for each operating mode is determined using the following expression:
Δ I a d % = M 2   M 1   M 1   100 % , M 1 S 1 , 3   i   M 2 S 2 , 4
where M 1 ,   M 2 —measurement data from the corresponding sets, and S 1 , 3 ,   S 2 , 4 —sets representing Sets 1 and 3 and Sets 2 and 4, respectively.
In the processed measurement results for the boost operating mode (Figure 15 and Figure 16, Table 4), the application of the current-adaptive algorithm (Set 2) resulted in a relative increase in average efficiency η ¯ of + 3.34 % . The maximum efficiency η max improved by + 1.42 % , while the minimum efficiency η min increased significantly by + 12.54 % , particularly noticeable at lower loads. This improvement is especially relevant, as converters with conventional control—where all branches remain continuously active—often exhibit reduced efficiency in this operating range.
The maximum power losses P l o s s max remained unchanged across both sets, while the minimum power losses P l o s s min decreased by 34.79 % , leading to a reduction in average power losses P ¯ l o s s by 8.67 % . These measurement results confirm the effectiveness of the current-adaptive algorithm in Boost mode, demonstrating a clear improvement in system efficiency for the given load profile.
Similarly, an analysis of the measurement results for the buck operating mode (Figure 17 and Figure 18, Table 4) reveals an increase in average efficiency η ¯ of + 7.06 % when comparing the reference control (Set 3) to the application of the current-adaptive algorithm (Set 4). This improvement is particularly pronounced at lower loads. The maximum efficiency η max remained nearly unchanged, increasing by only +0.23%, whereas the minimum efficienc η min showed a significant improvement of +32.78% under lower load conditions.
Regarding power losses, the maximum losses P l o s s max remained practically unchanged, while the minimum losses P l o s s min decreased significantly by 41.60 % , leading to an overall reduction in average losses P ¯ l o s s by 13.31 % . This reduction in losses directly contributes to the observed increase in efficiency, which was the central premise of this study, thereby confirming the validity of the current-adaptive algorithm for the buck operating mode of the converter.
To summarize the impact of the current-adaptive algorithm, Figure 19 presents a bar chart comparing efficiency in buck and boost operating modes. This figure consolidates the measurement results, providing a clear comparison of efficiency with and without the algorithm. By presenting all findings in a single visualization, it offers an overview of the achieved efficiency improvements.

5. Discussion

The findings of this study confirm the effectiveness of the current-adaptive control strategy in improving the efficiency of bidirectional interleaved converters (BICs) used in battery energy storage systems (BESS). The results demonstrate that dynamically adjusting the number of active branches based on real-time load conditions leads to measurable efficiency improvements. However, further research is necessary to evaluate the impact of long-term operation, temperature cycling effects, and aging of semiconductor components, which were beyond the scope of this study.
One of the key areas for future research is the experimental validation of the current-adaptive algorithm on a physical interleaved converter, designed with the same specifications as the simulation model. This validation will provide direct comparability between simulation results and real-world performance, helping bridge the gap between theoretical modeling and practical implementation. The hardware prototype, currently under development, will serve as a reference for validating the adaptive branch activation strategy in a real operating environment.
This study also highlights the importance of real-time simulation using HIL systems for testing advanced control algorithms in power electronics applications. The Typhoon HIL 402 platform was used for developing and testing the proposed control strategy. HIL-based validation ensures that the control strategy can be implemented in a real system with minimal modifications, reducing development risks. Future research will focus on extending HIL-based real-time testing to investigate the impact of thermal transients and optimize control loop dynamics under variable operating conditions.
An important contribution of this work is the integration of electro-thermal modeling into the current-adaptive algorithm, allowing temperature-based decision making. While temperature monitoring has traditionally been used only for thermal protection, this study demonstrates that incorporating real-time temperature data into branch activation logic can be used. However, a major challenge in electro-thermal modeling remains the lack of standardized thermal data in manufacturer datasheets, which limits the accuracy of real-time simulations. Future research should address this limitation by conducting a comparative analysis between simulated thermal models and real-world transistor temperature measurements in laboratory conditions.
Further research can include machine learning-based optimization, where real-time parameter adjustments are performed through co-simulation with Python. By leveraging advanced optimization techniques, self-adaptive control algorithms could be developed to further enhance system adaptability and performance.
The ongoing development of an integrated electro-thermal control strategy, referred to as the Temperature-Adaptive Control Algorithm, builds upon the current-adaptive algorithm presented in this study. By utilizing the thermal model, this advanced control approach aims to regulate the average transistor temperature, optimizing thermal distribution and improving long-term reliability. This research is currently in progress and will be presented in a forthcoming scientific publication, alongside HIL-based real-time validation findings.

6. Conclusions

Battery Energy Storage Systems (BESS) play an important role in ensuring grid stability, managing peak loads, and facilitating the seamless integration of renewable energy sources. The overall performance and reliability of these systems are significantly influenced by the design and control strategies of power converters. This research examines a two-stage non-isolated bidirectional DC-DC converter topology, which was chosen for its ability to deliver high efficiency and adaptability in both charging and discharging operation modes.
One of the primary challenges with bidirectional interleaved converters (BICs) is to obtain high efficiency through varying load conditions. One of the known techniques for improving efficiency is increasing the number of interleaved branches, as shown in this study. However, if all branches are engaded all the time, energy losses tend to rise under low-load conditions. To address this issue, a current-adaptive control algorithm was developed, enabling real-time activation and deactivation of branches based on the dynamic load curve. The proposed algorithm in this paper incorporates electro-thermal modeling, introducing temperature-based decision-making, rather than methods usually described in this research.
The implementation of the current-adaptive algorithm resulted in improving overall efficiency in both operating modes, with the main indicators as follows:
  • Average efficiency is increased from 77.69 % to 83.15 % in charging (buck) mode and from 81.00 % to 83.71 % in discharging (boost) mode.
  • Minimum power losses were reduced by 34.79 % and 41.60 % in Boost and Buck modes, respectively.
These results demonstrate that the proposed current-adaptive control strategy improved the overall efficiency of BIC under different operating conditions. The real-time Hardware-in-the-Loop (HIL) validation demonstrated that the I-ad control algorithm can be feasible for use in interleaved converters within BESS applications.
The next steps building on this research include the following:
  • Testing the algorithm on a real prototype to compare the simulation results with real-world performance.
  • Developing a temperature-based control system to regulate transistor temperatures in real time.
  • Using machine learning to fine-tune control parameters dynamically during operation.
The findings from this ongoing work will be presented in an upcoming scientific paper.

Supplementary Materials

The following are available online at https://doi.org/10.6084/m9.figshare.c.7768505.v1 accessed on 27 April 2025; Typhoon HIL BIC simulation model: BIC_model_v_18-12.tse; Typhoon HIL BIC subsystem schematics: Schematic_Typhoon_HIL_Simulation_Model_subsystem_name.svg. All schematic and data-related figures from the manuscript are available in SVG format, named identically as in the paper. Screenshots and GUI images are excluded. All SVG files can be freely downloaded and viewed without loss of resolution.

Author Contributions

Conceptualization, A.B. and D.P.; methodology, A.B. and K.K.; software, A.B.; validation, A.B., D.P., and K.K.; formal analysis, A.B.; investigation, A.B.; resources, A.B.; data curation, K.K.; writing—original draft preparation, A.B.; writing—review and editing, A.B. and K.K.; visualization, A.B.; supervision, D.P.; project administration, D.P. All authors have read and agreed to the published version of the manuscript.

Funding

This research received no external funding.

Data Availability Statement

Data are available in a publicly accessible repository. The data presented in this study are openly available in Figshare at https://doi.org/10.6084/m9.figshare.c.7768505.v1, reference number 10.6084/m9.figshare.c.7768505.v1.

Acknowledgments

During the preparation of this manuscript, the authors used Zotero (version 7.0.15) for reference management and Grammarly (free version) for English grammar and language refinement. The authors have reviewed and edited all outputs and take full responsibility for the content and accuracy of this publication.

Conflicts of Interest

The authors declare no conflicts of interest.

Appendix A

The actual charging characteristic of the custom 7S3P battery pack, assembled from Panasonic NCR18650B cells [37], was obtained using the Junsi iCharger 4010 DUO (Junsi, Shenzhen, China) charger/discharger [38] and is presented in Figure A1. The CC (constant current) and CV (constant voltage) charging modes can be identified, with the transition occurring at approximately the 87th min.
Figure A1. Recorded characteristics of the 7S3P battery pack over time, composed of Panasonic NCR18650 battery cells.
Electronics 14 01862 g0a1

Appendix B

Figure A2. Responses of current and voltage PI regulators for boost (a) and buck (b) operating modes. Branch currents are indicated in red and blue, while the instantaneous voltages are shown in orange.
Electronics 14 01862 g0a2
The implemented PI regulator, designed within a dual-loop configuration, prioritizes the elimination of overshoots and minimization of oscillations in both voltage and current control. During the Boost mode response analysis, significant voltage overshoots were observed under sudden load reductions, reaching up to 100   V in extreme cases. To mitigate potential risks, the regulator parameters were optimized through simulation, ensuring that the maximum voltage overshoot does not exceed 5 % of the nominal output voltage under worst-case conditions. The response time of the Boost mode regulator is approximately 60   m s , significantly longer than the 6   m s response time of the Buck mode regulator. This difference arises from the higher capacitance on the battery side in Buck mode, compared to the lower capacitance and resistance of the DC link in Boost mode, resulting in a smaller time constant. While this regulation approach is suitable for the multi-branch converter, practical applications in BESS would require a different strategy, particularly when the converter interfaces with the grid. Despite these response differences, the implemented PI control system provides adequate performance.

References

  1. Vedhanarayanan, B.; Seetha Lakshmi, K.C. Beyond lithium-ion: Emerging frontiers in next-generation battery technologies. Front. Batter. Electrochem. 2024, 3, 1377192. [Google Scholar] [CrossRef]
  2. Padullaparti, H.; Pratt, A.; Mendoza, I.; Tiwari, S.; Baggu, M.; Bilby, C.; Ngo, Y. Peak Demand Management and Voltage Regulation Using Coordinated Virtual Power Plant Controls. IEEE Access 2023, 11, 130674–130687. [Google Scholar] [CrossRef]
  3. Precedence Research Stationary Energy Storage Market Size, Share, and Trends 2025 to 2034. Available online: https://www.precedenceresearch.com/stationary-energy-storage-market (accessed on 2 January 2025).
  4. Kroics, K.; Husev, O.; Tytelmaier, K.; Zakis, J.; Veligorskyi, O. An Overview of Bidirectional AC-DC Grid Connected Converter Topologies for Low Voltage Battery Integration. Int. J. Power Electron. Drive Syst. 2018, 9, 1223. [Google Scholar] [CrossRef]
  5. Panchanathan, S.; Vishnuram, P.; Rajamanickam, N.; Bajaj, M.; Blazek, V.; Prokop, L.; Misak, S. A Comprehensive Review of the Bidirectional Converter Topologies for the Vehicle-to-Grid System. Energies 2023, 16, 2503. [Google Scholar] [CrossRef]
  6. Sutikno, T.; Aprilianto, R.A.; Purnama, H.S. Application of non-isolated bidirectional DC–DC converters for renewable and sustainable energy systems: A review. Clean Energy 2023, 7, 293–311. [Google Scholar] [CrossRef]
  7. Lai, C.-M.; Lin, W.-H.; Liu, H.-E.; Liu, S.; Mishima, T.; Teh, J. A Two-Phase Interleaved Bidirectional DC-DC Converter with Asymmetrical Duty Limit Control for Wide-Range DC-Bus Voltage Applications. IEEE Trans. Ind. Applicat. 2024, 60, 3306–3321. [Google Scholar] [CrossRef]
  8. Ni, L.; Patterson, D.J.; Hudgins, J.L. High Power Current Sensorless Bidirectional 16-Phase Interleaved DC-DC Converter for Hybrid Vehicle Application. IEEE Trans. Power Electron. 2012, 27, 1141–1151. [Google Scholar] [CrossRef]
  9. Qiu, W.; Cheung, C.; Xiao, S.; Miller, G. Power Loss Analyses for Dynamic Phase Number Control in Multiphase Voltage Regulators. In Proceedings of the Twenty-Fourth Annual IEEE Applied Power Electronics Conference and Exposition, Washington, DC, USA, 15–19 February 2009; IEEE: New York, NY, USA, 2009; pp. 102–108. [Google Scholar]
  10. Su, J.-T.; Liu, C.-W. A Novel Phase-Shedding Control Scheme for Improved Light Load Efficiency of Multiphase Interleaved DC–DC Converters. IEEE Trans. Power Electron. 2013, 28, 4742–4752. [Google Scholar] [CrossRef]
  11. Costabeber, A.; Mattavelli, P.; Saggini, S. Digital Time-Optimal Phase Shedding in Multiphase Buck Converters. IEEE Trans. Power Electron. 2010, 25, 2242–2247. [Google Scholar] [CrossRef]
  12. Zumel, P.; Fernández, C.; De Castro, A.; García, O. Efficiency improvement in multiphase converter by changing dynamically the number of phases. In Proceedings of the 37th IEEE Power Electronics Specialists Conference, Jeju, Republic of Korea, 18–22 June 2006; IEEE: New York, NY, USA, 2006; pp. 1–6. [Google Scholar]
  13. Alharbi, M.A.; Dahidah, M.; Ethni, S.; Ali, S.; Kadandani, N.B.; Pickert, V. A Phase Shedding Control Technique for Ripple Minimisation for EV Fast DC Charging Applications. In Proceedings of the 23rd European Conference on Power Electronics and Applications (EPE’21 ECCE Europe), Ghent, Belgium, 6–10 September 2021; IEEE: New York, NY, USA, 2021; pp. 1–10. [Google Scholar]
  14. Lim, H.; Jang, M.; Agelidis, V. A Phase Shedding Technique for PV System Based on Interleaved Boost Converter. In Proceedings of the IEEE 2nd International Future Energy Electronics Conference (IFEEC), Taipei, Taiwan, 1–4 November 2015; IEEE: New York, NY, USA, 2015; pp. 1–5. [Google Scholar]
  15. Lee, J.-S.; Huang, C.-Y.; Liang, T.-J.; Chen, K.-H. Design of control IC for multiphase interleaved buck converter with alternate phase-shedding. In Proceedings of the 9th International Conference on Power Electronics and ECCE Asia (ICPE-ECCE Asia), Seoul, Republic of Korea, 1–5 June 2015; IEEE: New York, NY, USA, 2015; pp. 1025–1032. [Google Scholar]
  16. Lin, J.-T.; Hu, K.; Tsai, C.-H. Digital Multiphase Buck Converter with Current Balance/Phase Shedding Control. In Proceedings of the TENCON 2015—2015 IEEE Region 10 Conference, Macao, China, 1–4 November 2015; IEEE: New York, NY, USA, 2015; pp. 1–5. [Google Scholar]
  17. Alharbi, M.A.; Alcaide, A.M.; Dahidah, M.; Ethni, S.; Pickert, V.; Leon, J.I. Rotating Phase Shedding for Interleaved DC–DC Converter-Based EVs Fast DC Chargers. IEEE Trans. Power Electron. 2023, 38, 1901–1909. [Google Scholar] [CrossRef]
  18. Yedukondalu, G.; Samanta, S. Effective phase utilization and efficiency improvement of high power interleaved DC–DC converter using modified rotating phase shedding control. Comput. Electr. Eng. 2023, 110, 108837. [Google Scholar] [CrossRef]
  19. Typhoon HIL HIL402 Hardware User Guide. Available online: https://www.typhoon-hil.com/documentation/typhoon-hil-hardware-manual/hil402_user_guide/topics/hil402_abstract.html (accessed on 18 February 2025).
  20. EVAL-1ED020I12-BT; Infineon: Munich, Germany, 2013.
  21. Tony, R. Kuphaldt Lessons in Industrial Automation. Available online: https://control.com/textbook/closed-loop-control/analog-electronic-pid-controllers/?utm_source=chatgpt.com (accessed on 15 January 2025).
  22. Ma, D.; Niculescu, S.; Guo, L.; Chen, J. Special issue on PID control in the information age: Theoretical advances and applications. Int. J. Robust. Nonlinear 2022, 32, 9384–9388. [Google Scholar] [CrossRef]
  23. Solsona, J.A.; Gomez Jorge, S.; Busada, C.A. Modeling and Nonlinear Control of DC–DC Converters for Microgrid Applications. Sustainability 2022, 14, 16889. [Google Scholar] [CrossRef]
  24. Etxeberria, A.; Vechiu, I.; Camblong, H.; Vinassa, J.-M. Comparison of Sliding Mode and PI Control of a Hybrid Energy Storage System in a Microgrid Application. Energy Procedia 2011, 12, 966–974. [Google Scholar] [CrossRef]
  25. Laoprom, I.; Tunyasrirut, S. Design of PI Controller for Voltage Controller of Four-Phase Interleaved Boost Converter Using Particle Swarm Optimization. J. Control Sci. Eng. 2020, 2020, 1–13. [Google Scholar] [CrossRef]
  26. Rachmad, R.W.; Abuzairi, T. Efficiency Comparison of Asynchronous and Synchronous Buck Converter with Variation in Duty Cycle and Output Current. Bul. Ilm. Sarj. Tek. Elektro 2023, 5, 41–55. [Google Scholar] [CrossRef]
  27. Setiawan, I.; Facta, M.; Andromeda, T.; Hermawan, H.; Syakur, A. Unified and Separated Buck/Boost Averaged Current Control Strategies of Bidirectional DC-DC Converter for DC Microgrid Systems. IREACO 2022, 15, 204. [Google Scholar] [CrossRef]
  28. Zhang, J.; Lai, J.S.; Yu, W. Bidirectional DC-DC converter modeling and unified controller with digital implementation. In Proceedings of the Twenty-Third Annual IEEE Applied Power Electronics Conference and Exposition, Austin, TX, USA, 24–28 February 2008; IEEE: New York, NY, USA, 2008; pp. 1747–1753. [Google Scholar]
  29. Codecasa, L.; Rencz, M. Thermal and Electro-Thermal System Simulation; MDPI: Basel, Switzerland, 2019; ISBN 978-3-03921-736-6. [Google Scholar]
  30. Typhoon HIL Thermal Modeling of Power Electronic Devices. Available online: https://www.typhoon-hil.com/documentation/typhoon-hil-software-manual/concepts/thermal_modeling_pe.html (accessed on 18 February 2025).
  31. Lagonotte, P.; Soulier, F.; Thomas, A.; Martemianov, S. The Differences Between Equivalent Foster and Cauer Circuits and Factorised Impedance. Adv. Theor. Comput. Phys. 2022, 5, 314–323. [Google Scholar]
  32. VNP10N07 Omnifet; STMicroelectronics: Geneva, Switzerland, 2013.
  33. Tripathi, S.M.; Gonzalez-Longatt, F.M. (Eds.) Real-Time Simulation and Hardware-in-the-Loop Testing Using Typhoon HIL; Transactions on Computer Systems and Networks; Springer Nature: Singapore, 2023; ISBN 978-981-99-0223-1. [Google Scholar]
  34. Chen, G.-J.; Chung, W.-H. Evaluation of Charging Methods for Lithium-Ion Batteries. Electronics 2023, 12, 4095. [Google Scholar] [CrossRef]
  35. Xiaoyan, S.; Leilei, M.; Jiantao, W. Effects of Pre-Charge Temperatures on Gas Production and Electrochemical Performances of Lithium-Ion Batteries. In Proceedings of the 3rd International Conference on Civil Architecture and Energy Science (CAES 2021), Hangzhou, China, 19–21 March 2021; Volume 248, p. 1040. [Google Scholar] [CrossRef]
  36. Bandara, T.G.T.A.; Viera, J.C.; González, M. The next generation of fast charging methods for Lithium-ion batteries: The natural current-absorption methods. Renew. Sustain. Energy Rev. 2022, 162, 112338. [Google Scholar] [CrossRef]
  37. Alldatasheet NCR18650B Datasheet. Available online: https://www.alldatasheet.com/datasheet-pdf/pdf/597043/PANASONICBATTERY/NCR18650B.html (accessed on 6 May 2023).
  38. iCharger 4010 Manual; Shenzhen Junsi Electronic: Shenzhen, China, 2012.
Figure 1. Projection of stationary energy storage (SES) utilization by 2030 (source: Precedence Research) [3].
Electronics 14 01862 g001
Figure 2. Block diagram of (a) single-stage conversion; (b) two-stage (or multi-stage) conversion.
Electronics 14 01862 g002
Figure 3. Representative example of a bidirectional converter in a two-stage topology without galvanic isolation.
Electronics 14 01862 g003
Figure 4. Bidirectional interleaved converter or BIC with N branches.
Electronics 14 01862 g004
Figure 5. Simplified block diagram of a two-branch BIC system simulation model.
Electronics 14 01862 g005
Figure 6. Dual-loop control of a two-branch converter implemented in Typhoon HIL.
Electronics 14 01862 g006
Figure 7. The relationship between (a) asynchronous control and (b) charge/discharge regulators, characteristics of the battery (separated regulators).
Electronics 14 01862 g007
Figure 8. Thermal model parametrization of (a) converter branch with a heat sink parameter input interface; (b) interface for inputting the thermal model parameters of the transistor and diode.
Electronics 14 01862 g008
Figure 9. Representation of a two-dimensional vector (a) and a three-dimensional vector (b) used for calculating conduction and switching losses in the simulation model.
Electronics 14 01862 g009
Figure 10. Simulation results of converter efficiency and losses as a function of the number of active branches in boost (a) and buck (b) operating modes.
Electronics 14 01862 g010
Figure 11. Flowchart of the current-adaptive algorithm.
Electronics 14 01862 g011
Figure 12. Laboratory measurement setup. 1—Typhoon HIL 402 real-time hardware; 2—custom-developed SCADA interface.
Electronics 14 01862 g012
Figure 13. Recorded waveforms of the regulated converter for Boost mode (a) and Buck mode (b).
Electronics 14 01862 g013
Figure 14. Battery load curve for Boost mode (a) and Buck mode (b) for validating the current-adaptive algorithm.
Electronics 14 01862 g014
Figure 15. Simulation results for Set 1—Boost mode, according to Table 3.
Electronics 14 01862 g015
Figure 16. Simulation results for Set 2—Boost mode, according to Table 3.
Electronics 14 01862 g016
Figure 17. Simulation results for Set 3—Buck mode, according to Table 3.
Electronics 14 01862 g017
Figure 18. Simulation results for Set 4—Buck mode, according to Table 3.
Electronics 14 01862 g018
Figure 19. Comparison of average efficiency across all measurement sets with and without the current-adaptive algorithm.
Electronics 14 01862 g019
Table 1. Selected basic parameters of the converter and BESS.
ParameterSymbolValue
Number of converter branches N 2
Maximum system power P ( m a x . ) 240   W
Maximum power per branch P N = 1 ( m a x . ) 120   W
Converter switching frequency f s 40   k H z
Nominal DC-link voltage V D C l i n k 48   V
Nominal battery voltage 1 V b a t 24   V
Maximum battery current I b a t ( m a x . ) 10   A
Maximum current per converter branch I N = 1 ( m a x . ) 5   A
1 Nominal battery voltage is 24   V , while actual battery voltage varies. See Appendix A for details.
Table 2. Simulation sets for validation of the proposed algorithms.
Measurement SetsSet 1Set 2
ParameterBoost ModeBuck Mode
Battery   State   of   Charge   ( S O C ) 50 %
Nominal   battery   voltage   ( V b a t ) 24   V   ( S O C depending)
DC - Link   voltage   ( V D C   l i n k ) 48   V
Reference current (Load) I D C   l i n k r e f = 2.5   A I b a t r e f = 2.5   A
Number   of   active   branches   N 2
Control signals x Q 2 , x Q 4 x Q 1 , x Q 3
Recorded waveforms v b a t , v D C   l i n k
i b a t , i L 1 , i L 2 , i D C   l i n k r e f
v b a t , v D C   l i n k
i b a t ( r e f ) , i L 1 , i L 2 , i D C   l i n k
Table 3. Measurement sets for the validation of the current-adaptive algorithm.
Measurement Set1.2.3.4.
Mode of OperationBoost (Discharging)Buck (Charging)
Current-adaptive (I-ad) modeOFFONOFFON
Number   of   active   branches   N 2 Auto 2 Auto
I-ad algorithm current activation- 4.9 5.1 - 5.7 5.9
Initial   S O C [ % ] 90 % 20 %
Current   i b a t [ A ] / i D C l i n k [ A ] According to the load curve
DC   link   voltage   V D C l i n k 48   V
Battery   voltage   v b a t [ V ] Variable ,   based   on   the   battery   S O C
Sampled quantity 1 p l o s s W ,   η B I C [ % ] ,   i b a t [ A ] ,   v b a t [ V ] ,   S O C   [ % ] ,   i D C   l i n k [ A ] ,   v D C   l i n k [ V ]
1 Sampling interval: 6   s .
Table 4. Processed measurement results for Set 1–Set 4, according to Table 3.
η ¯   [ % ] η max   [ % ] η min   [ % ] P ¯ l o s s   [ W ] P l o s s max   [ W ] P l o s s min   [ W ] P ¯ bat [W]
Set 1 81.00 84.2 72.7 21.96 40.56 12.99 125.08
Set 2 83.71 85.42 82.12 20.05 40.57 8.47
Δ I a d ( b o o s t ) [ % ] + 3.34 + 1.42 + 12.54 8.67 0.01 34.79
Set 3 77.66 84.87 56.35 20.11 41.28 11.35 109.4
Set 4 83.15 85.07 74.83 17.42 41.28 6.63
Δ I a d ( b u c k ) [ % ] + 7.06 + 0.23 + 32.78 13.31 0.00 41.60
Disclaimer/Publisher’s Note: The statements, opinions and data contained in all publications are solely those of the individual author(s) and contributor(s) and not of MDPI and/or the editor(s). MDPI and/or the editor(s) disclaim responsibility for any injury to people or property resulting from any ideas, methods, instructions or products referred to in the content.

