
Estimating Calibrated Risks Using Focal Loss and Gradient-Boosted Trees for Clinical Risk Prediction


Abstract
1. Introduction
2. Related Works
2.1. GBDT in Clinical Risk Prediction
2.2. GBDT and Custom Loss Functions
2.3. Probability Calibration
3. Methods
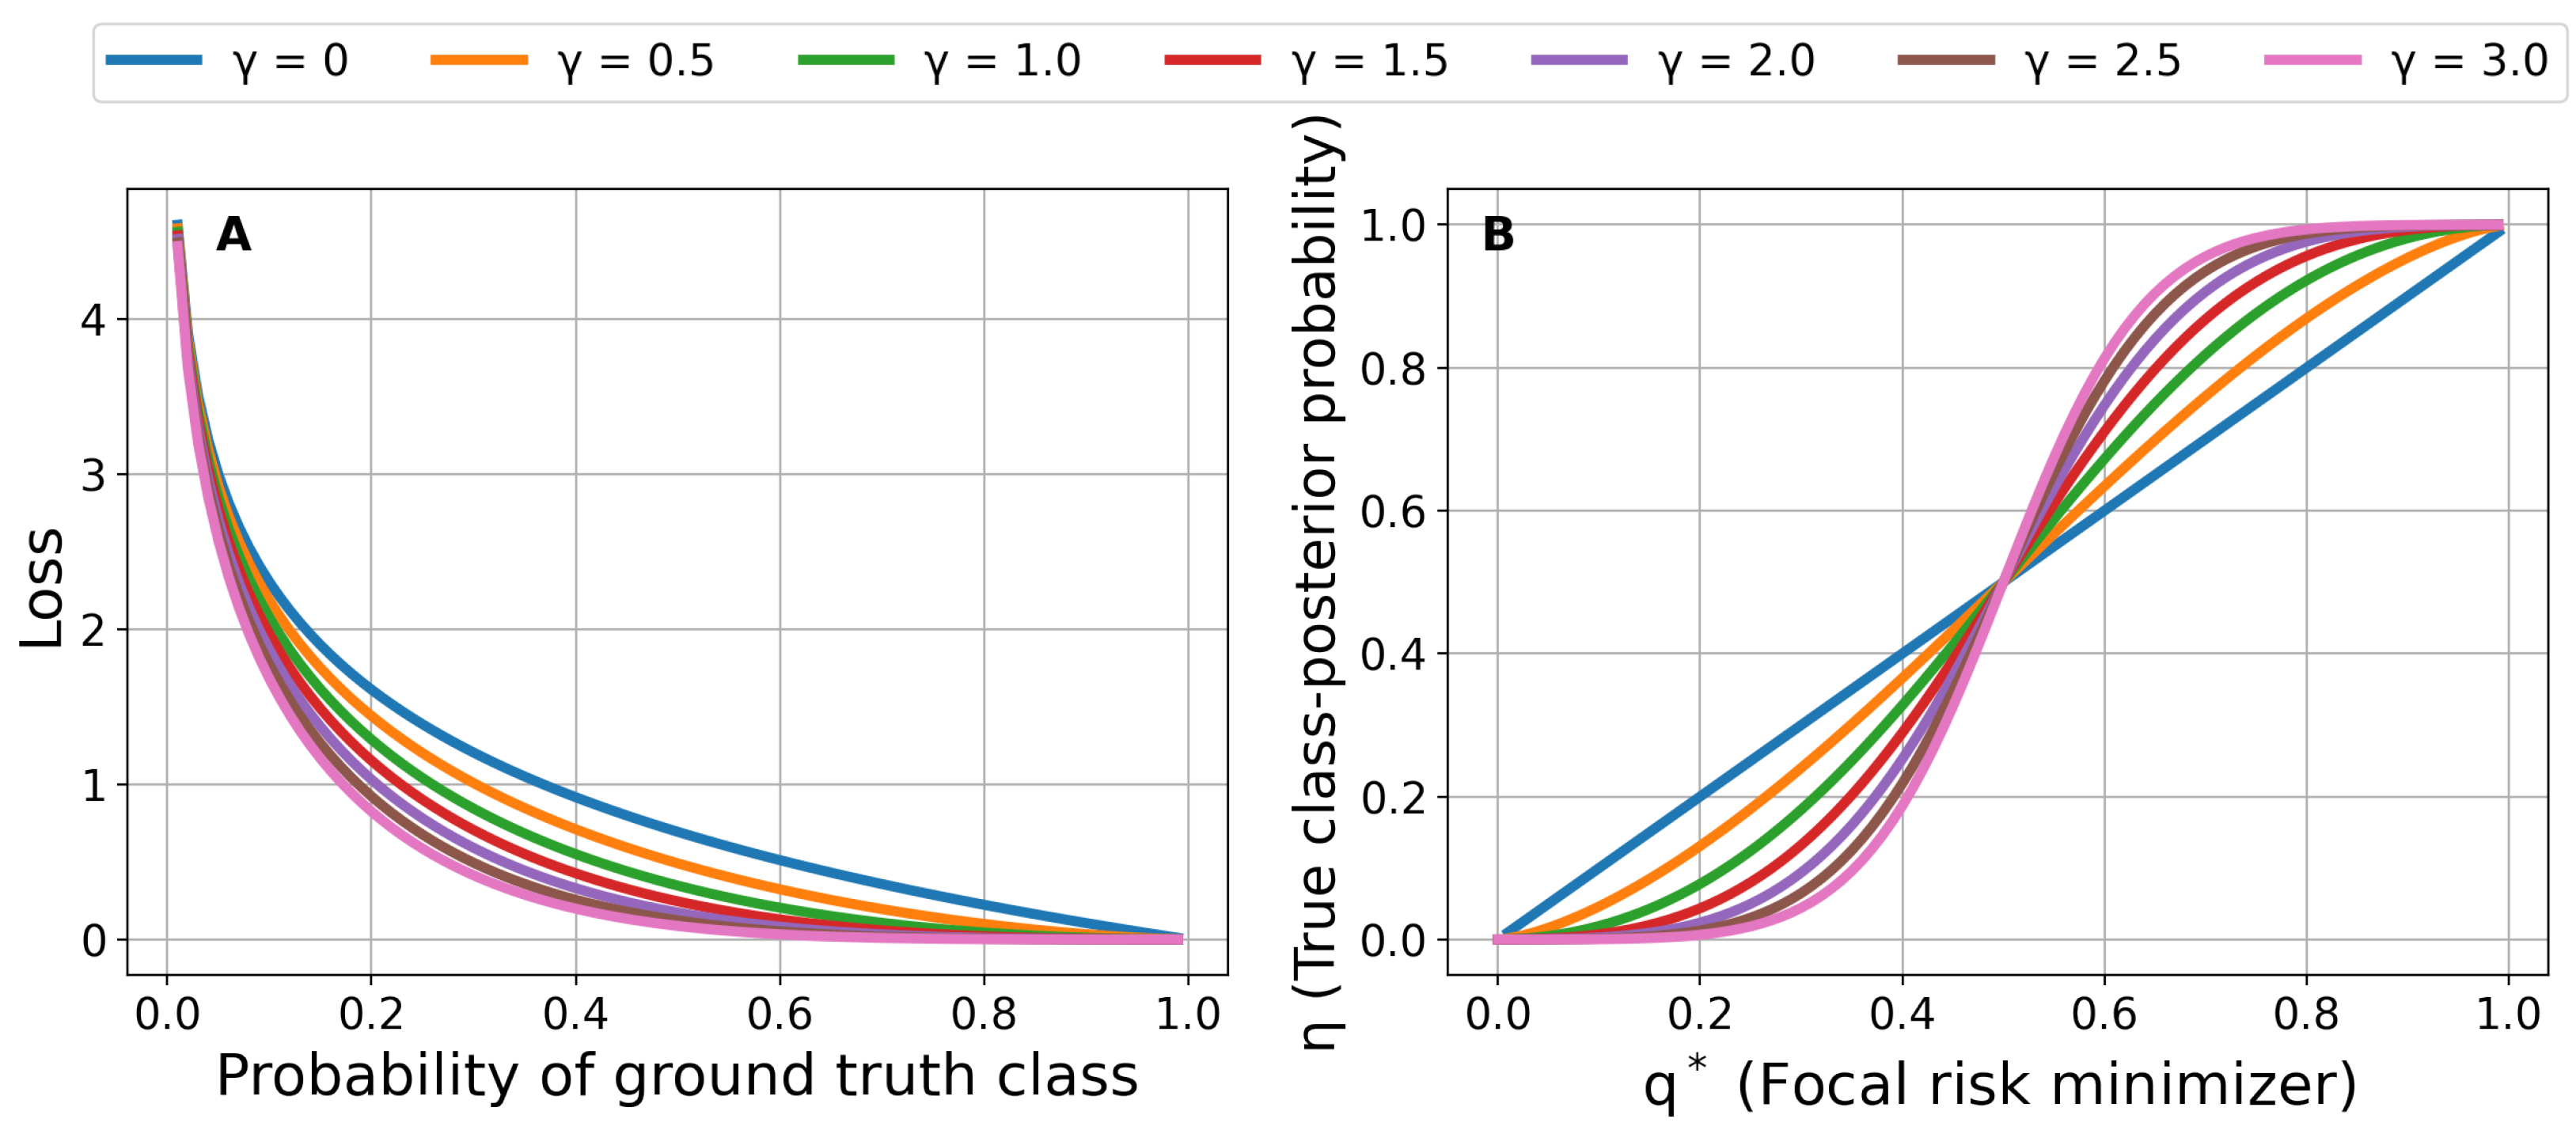
3.1. Focal Loss for Risk Prediction
3.2. Regularized GBDT
3.3. Bayesian Hyperparameter Optimization
| Algorithm 1 SMBOFocalGBDT |
| Input: , T, , focusing parameter , K Output: with minimum
|
| Algorithm 2 Learning and Prediction Stages |
| Input: , T, , focusing parameters , K, test sample Output: Prediction for test sample
|
3.4. Class-Imbalanced Classification Using Calibrated Focal-Aware GBDT
3.5. Evaluation Metrics
4. Experiments
4.1. Datasets
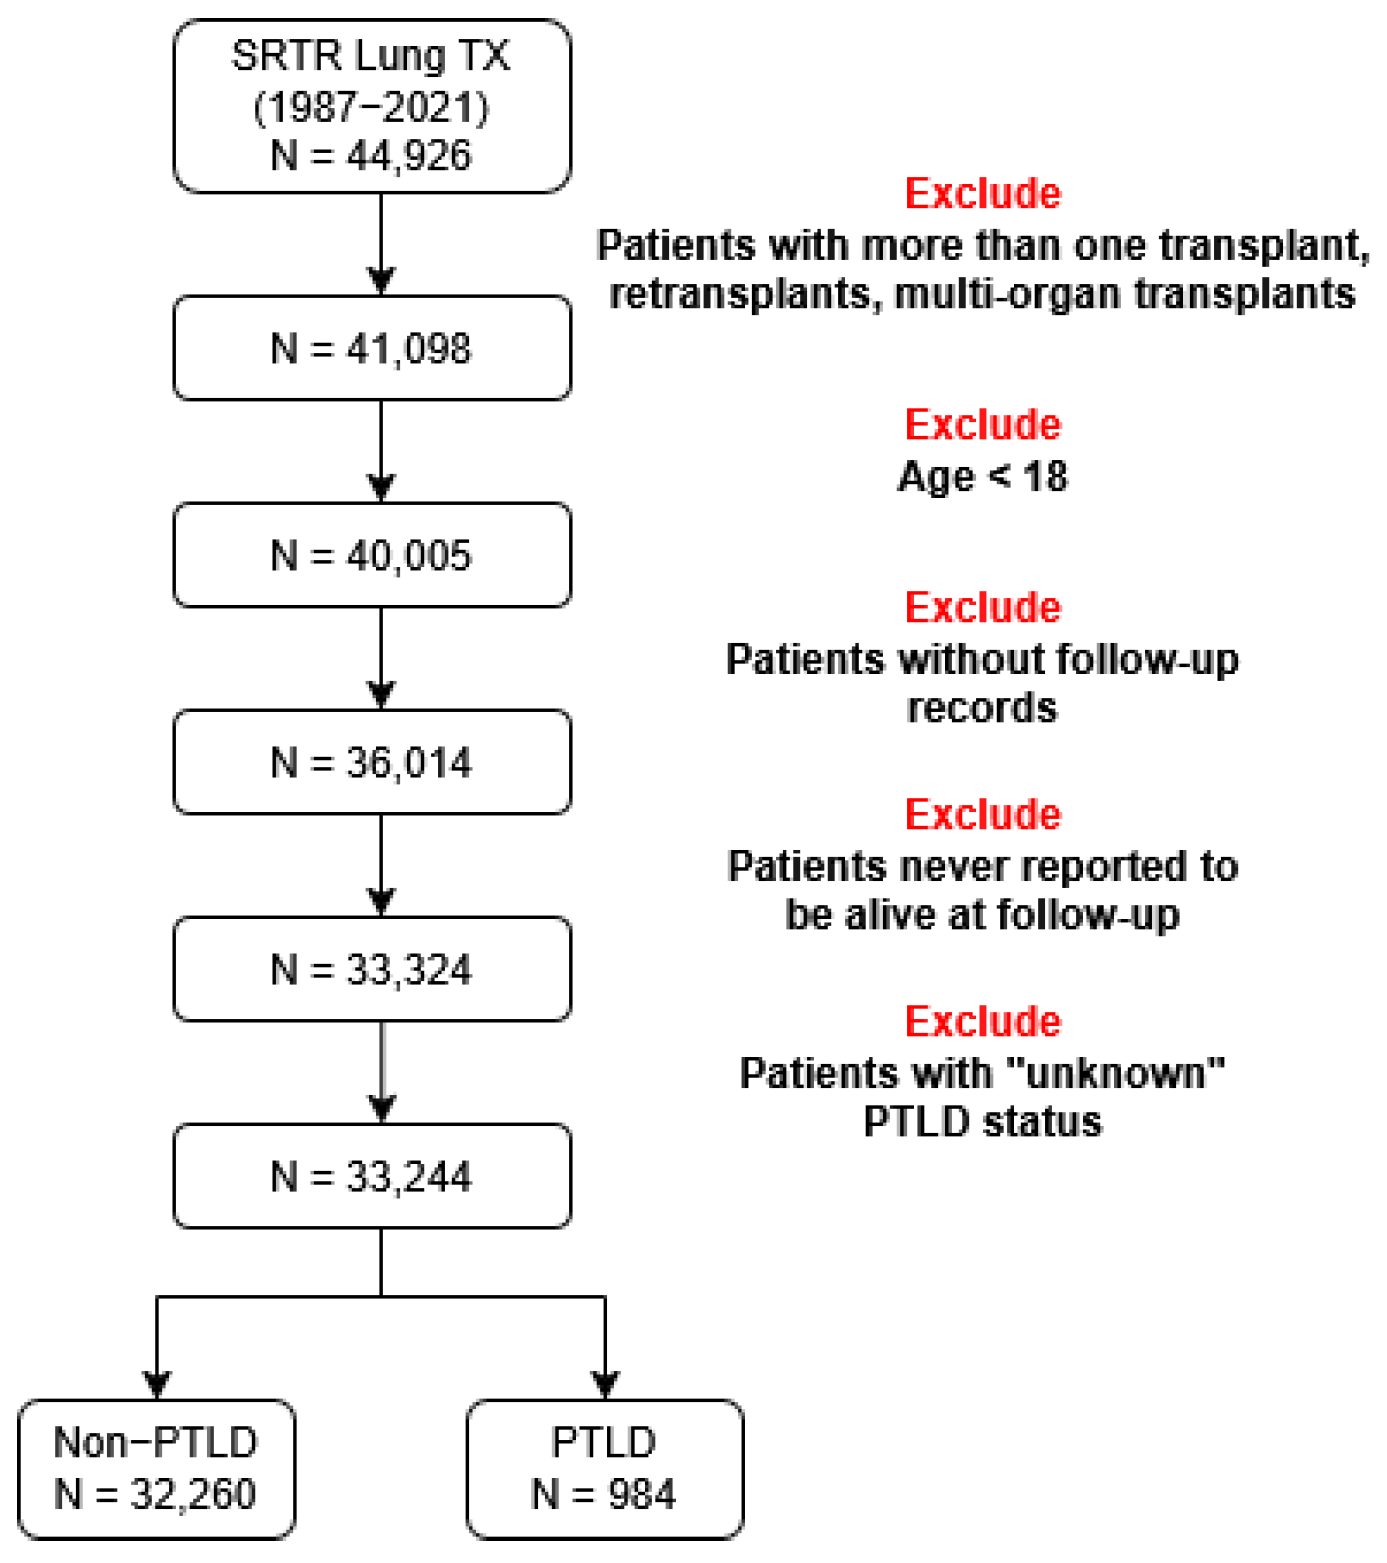
4.1.1. Lung Transplant Data
4.1.2. Diabetes Data
4.2. Design of Experiments
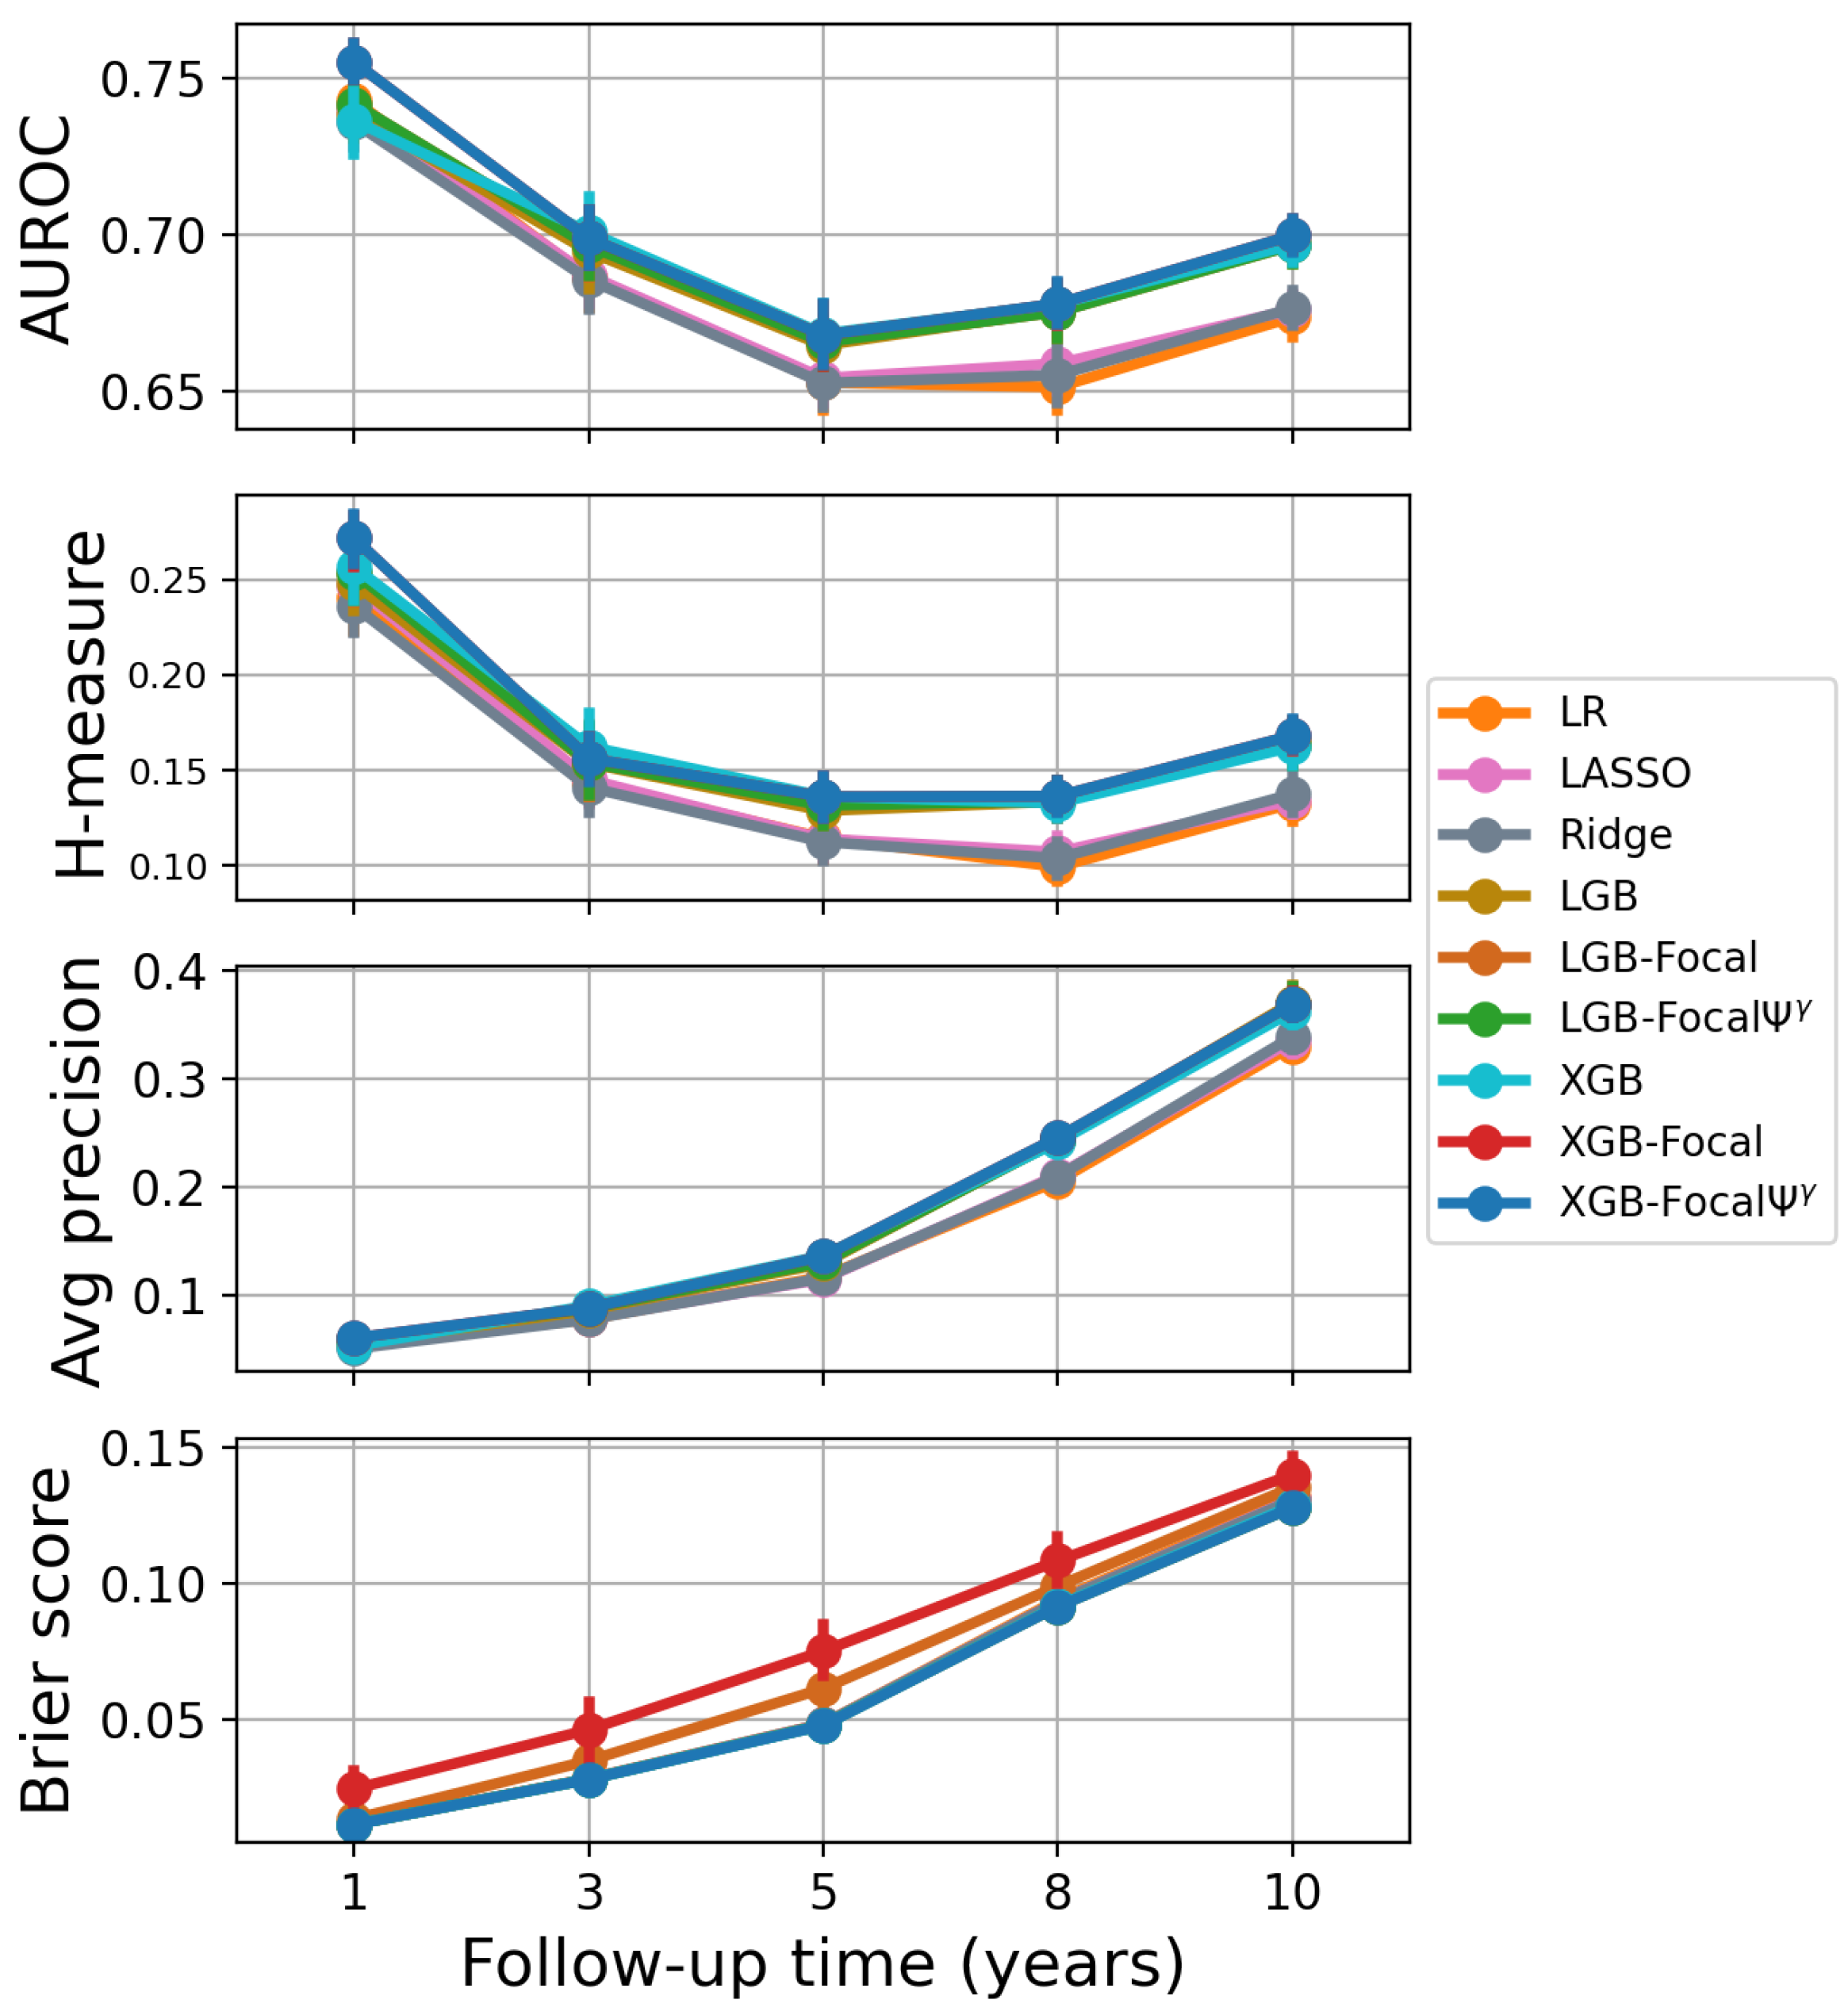
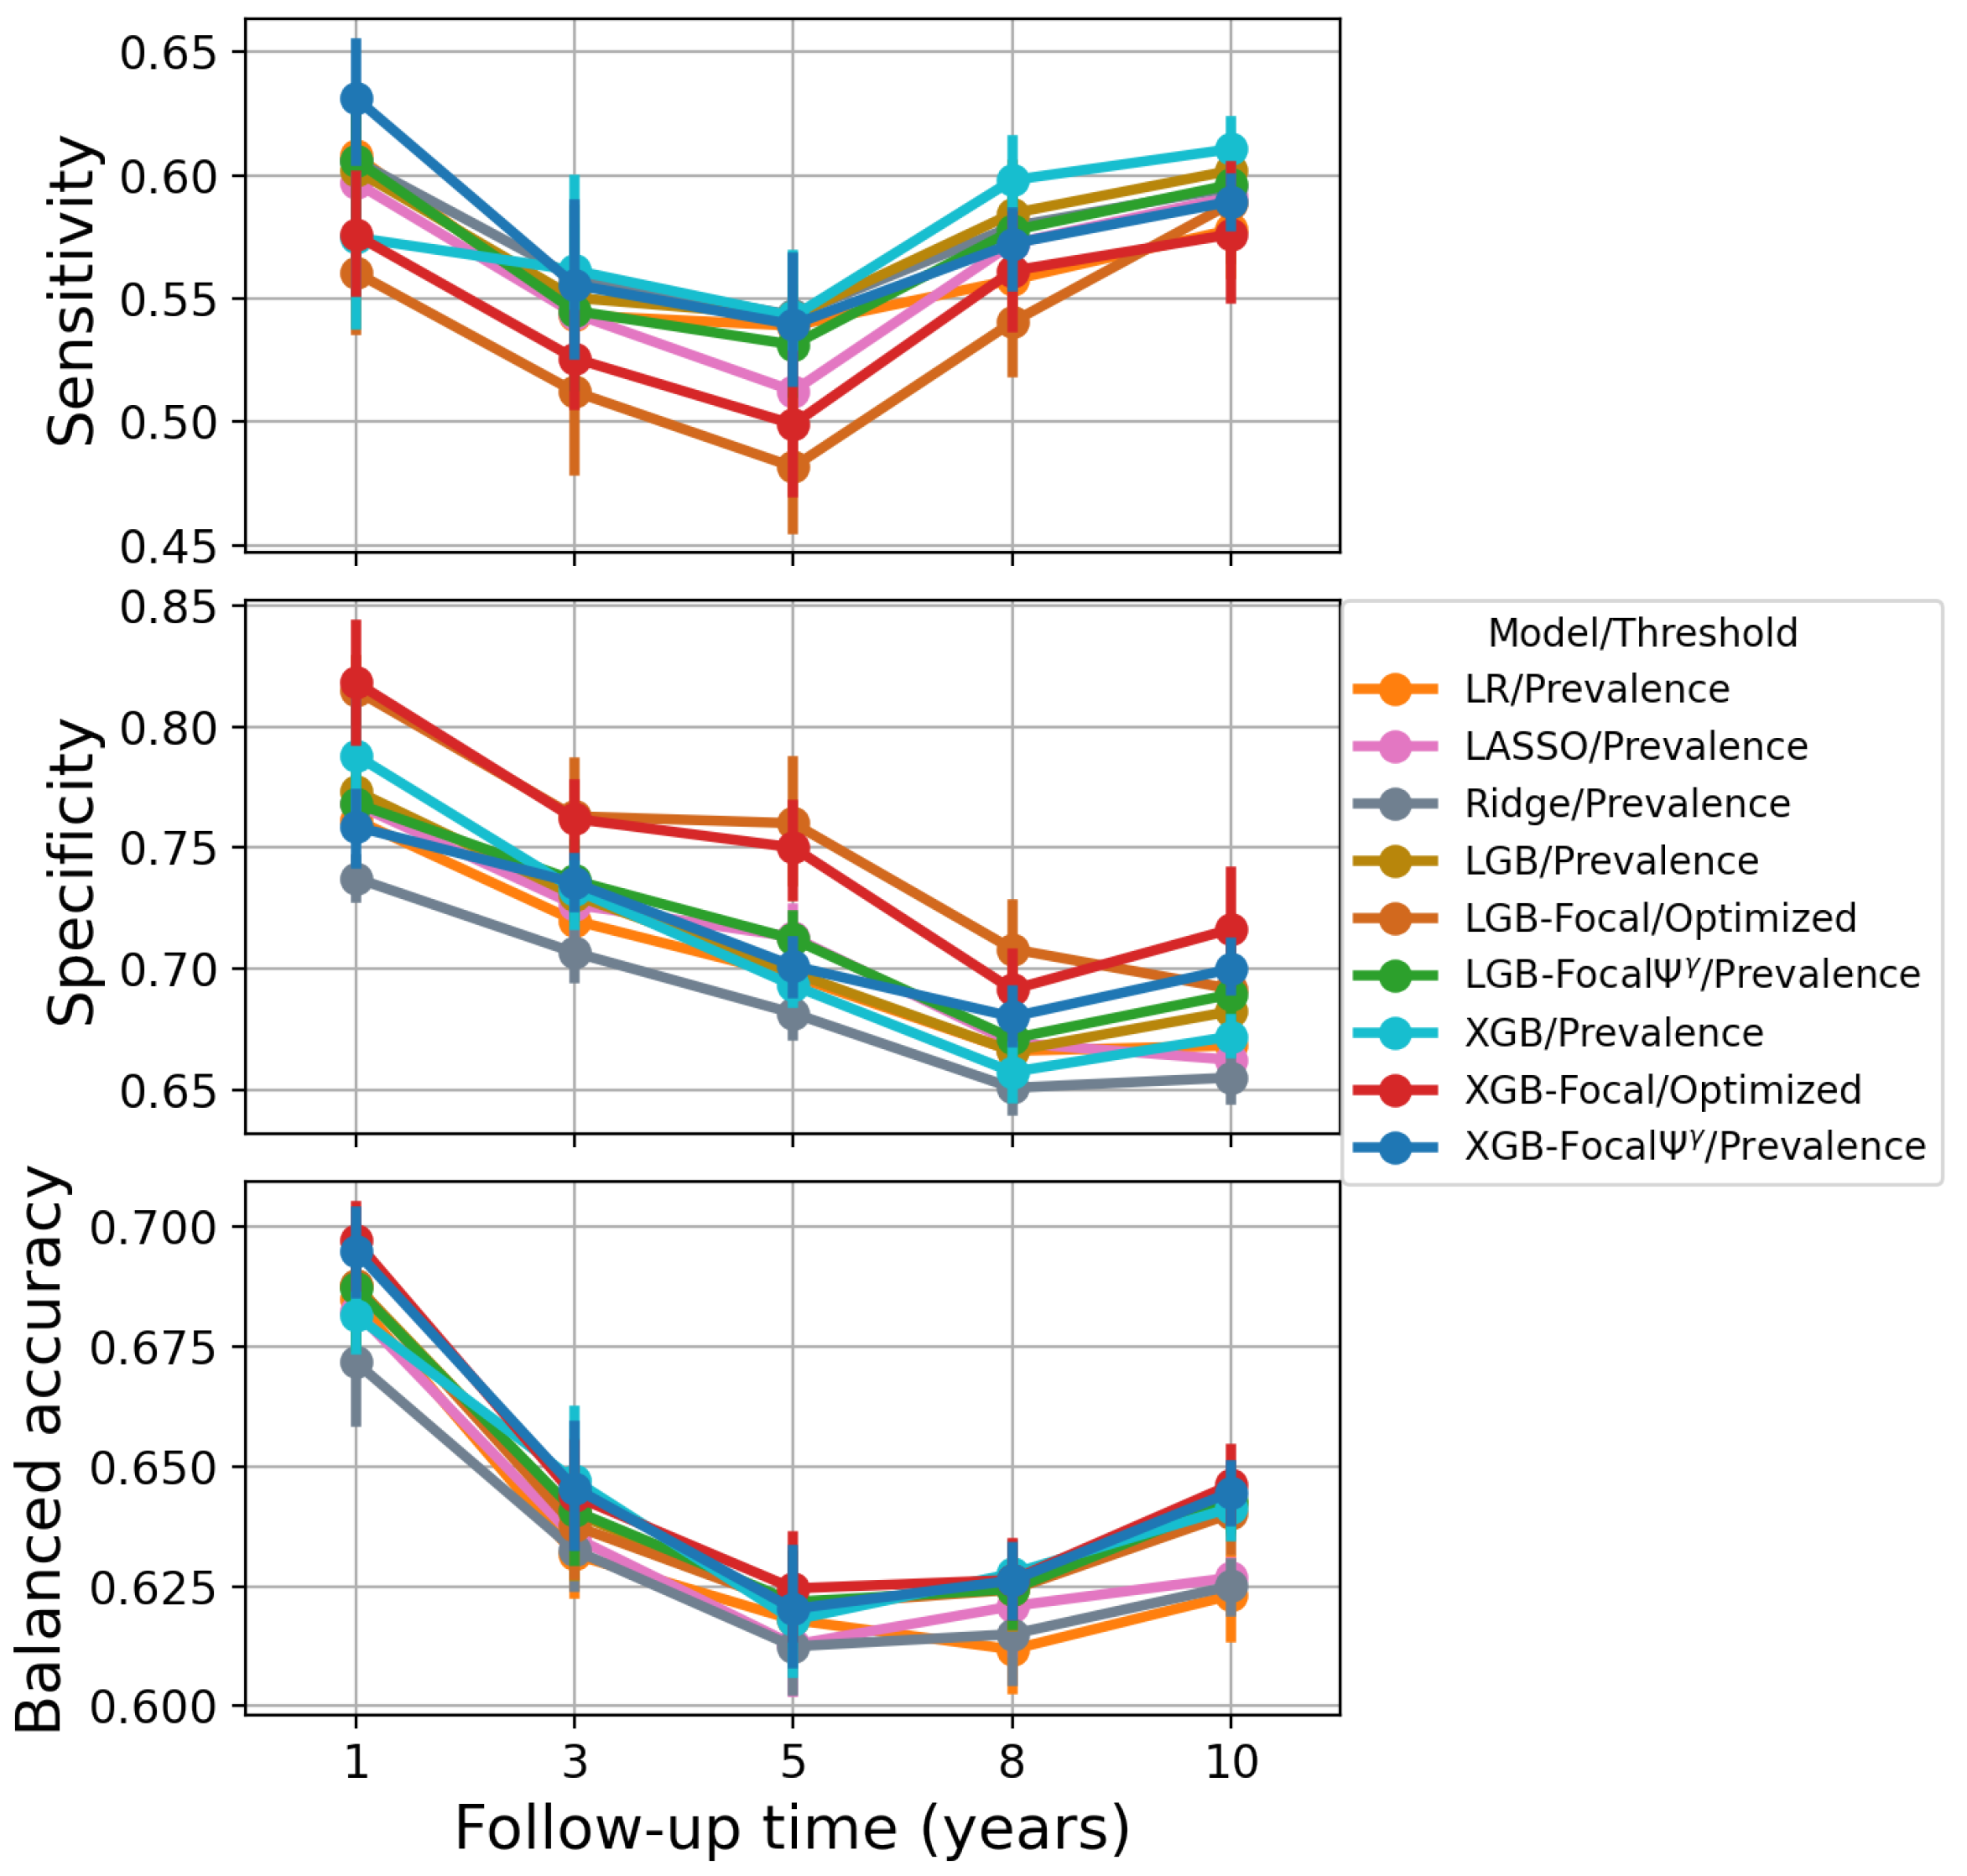
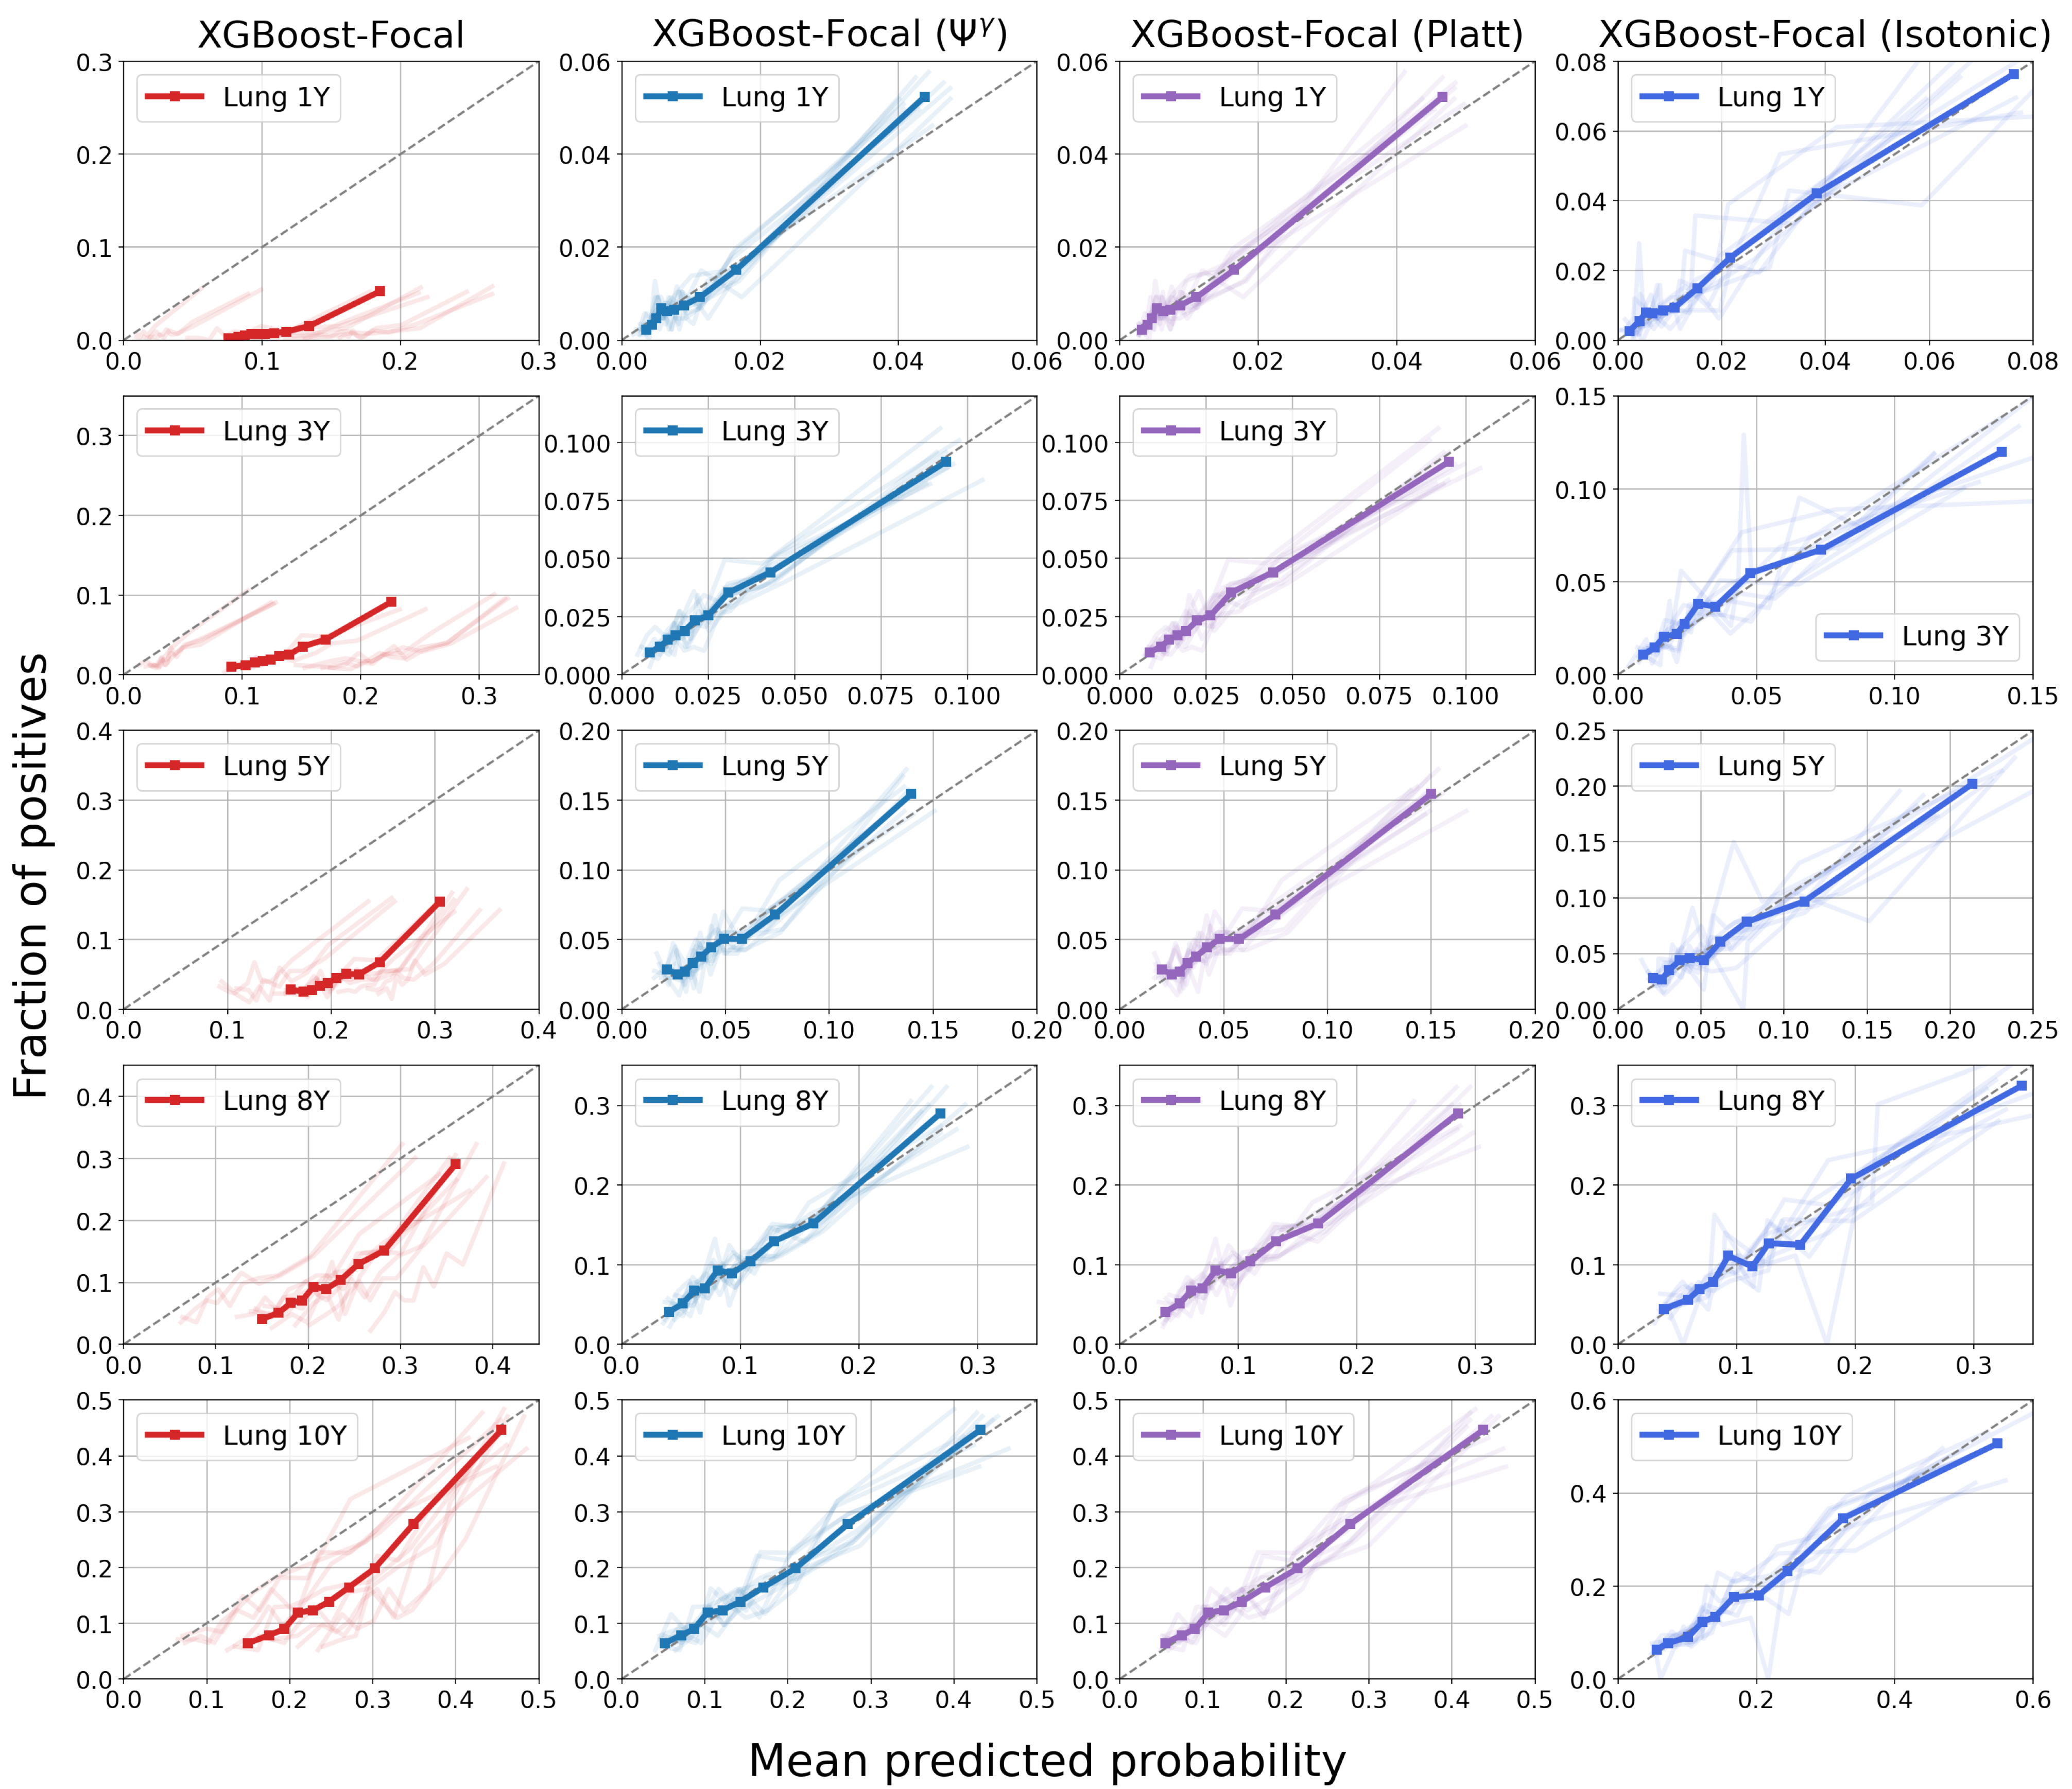
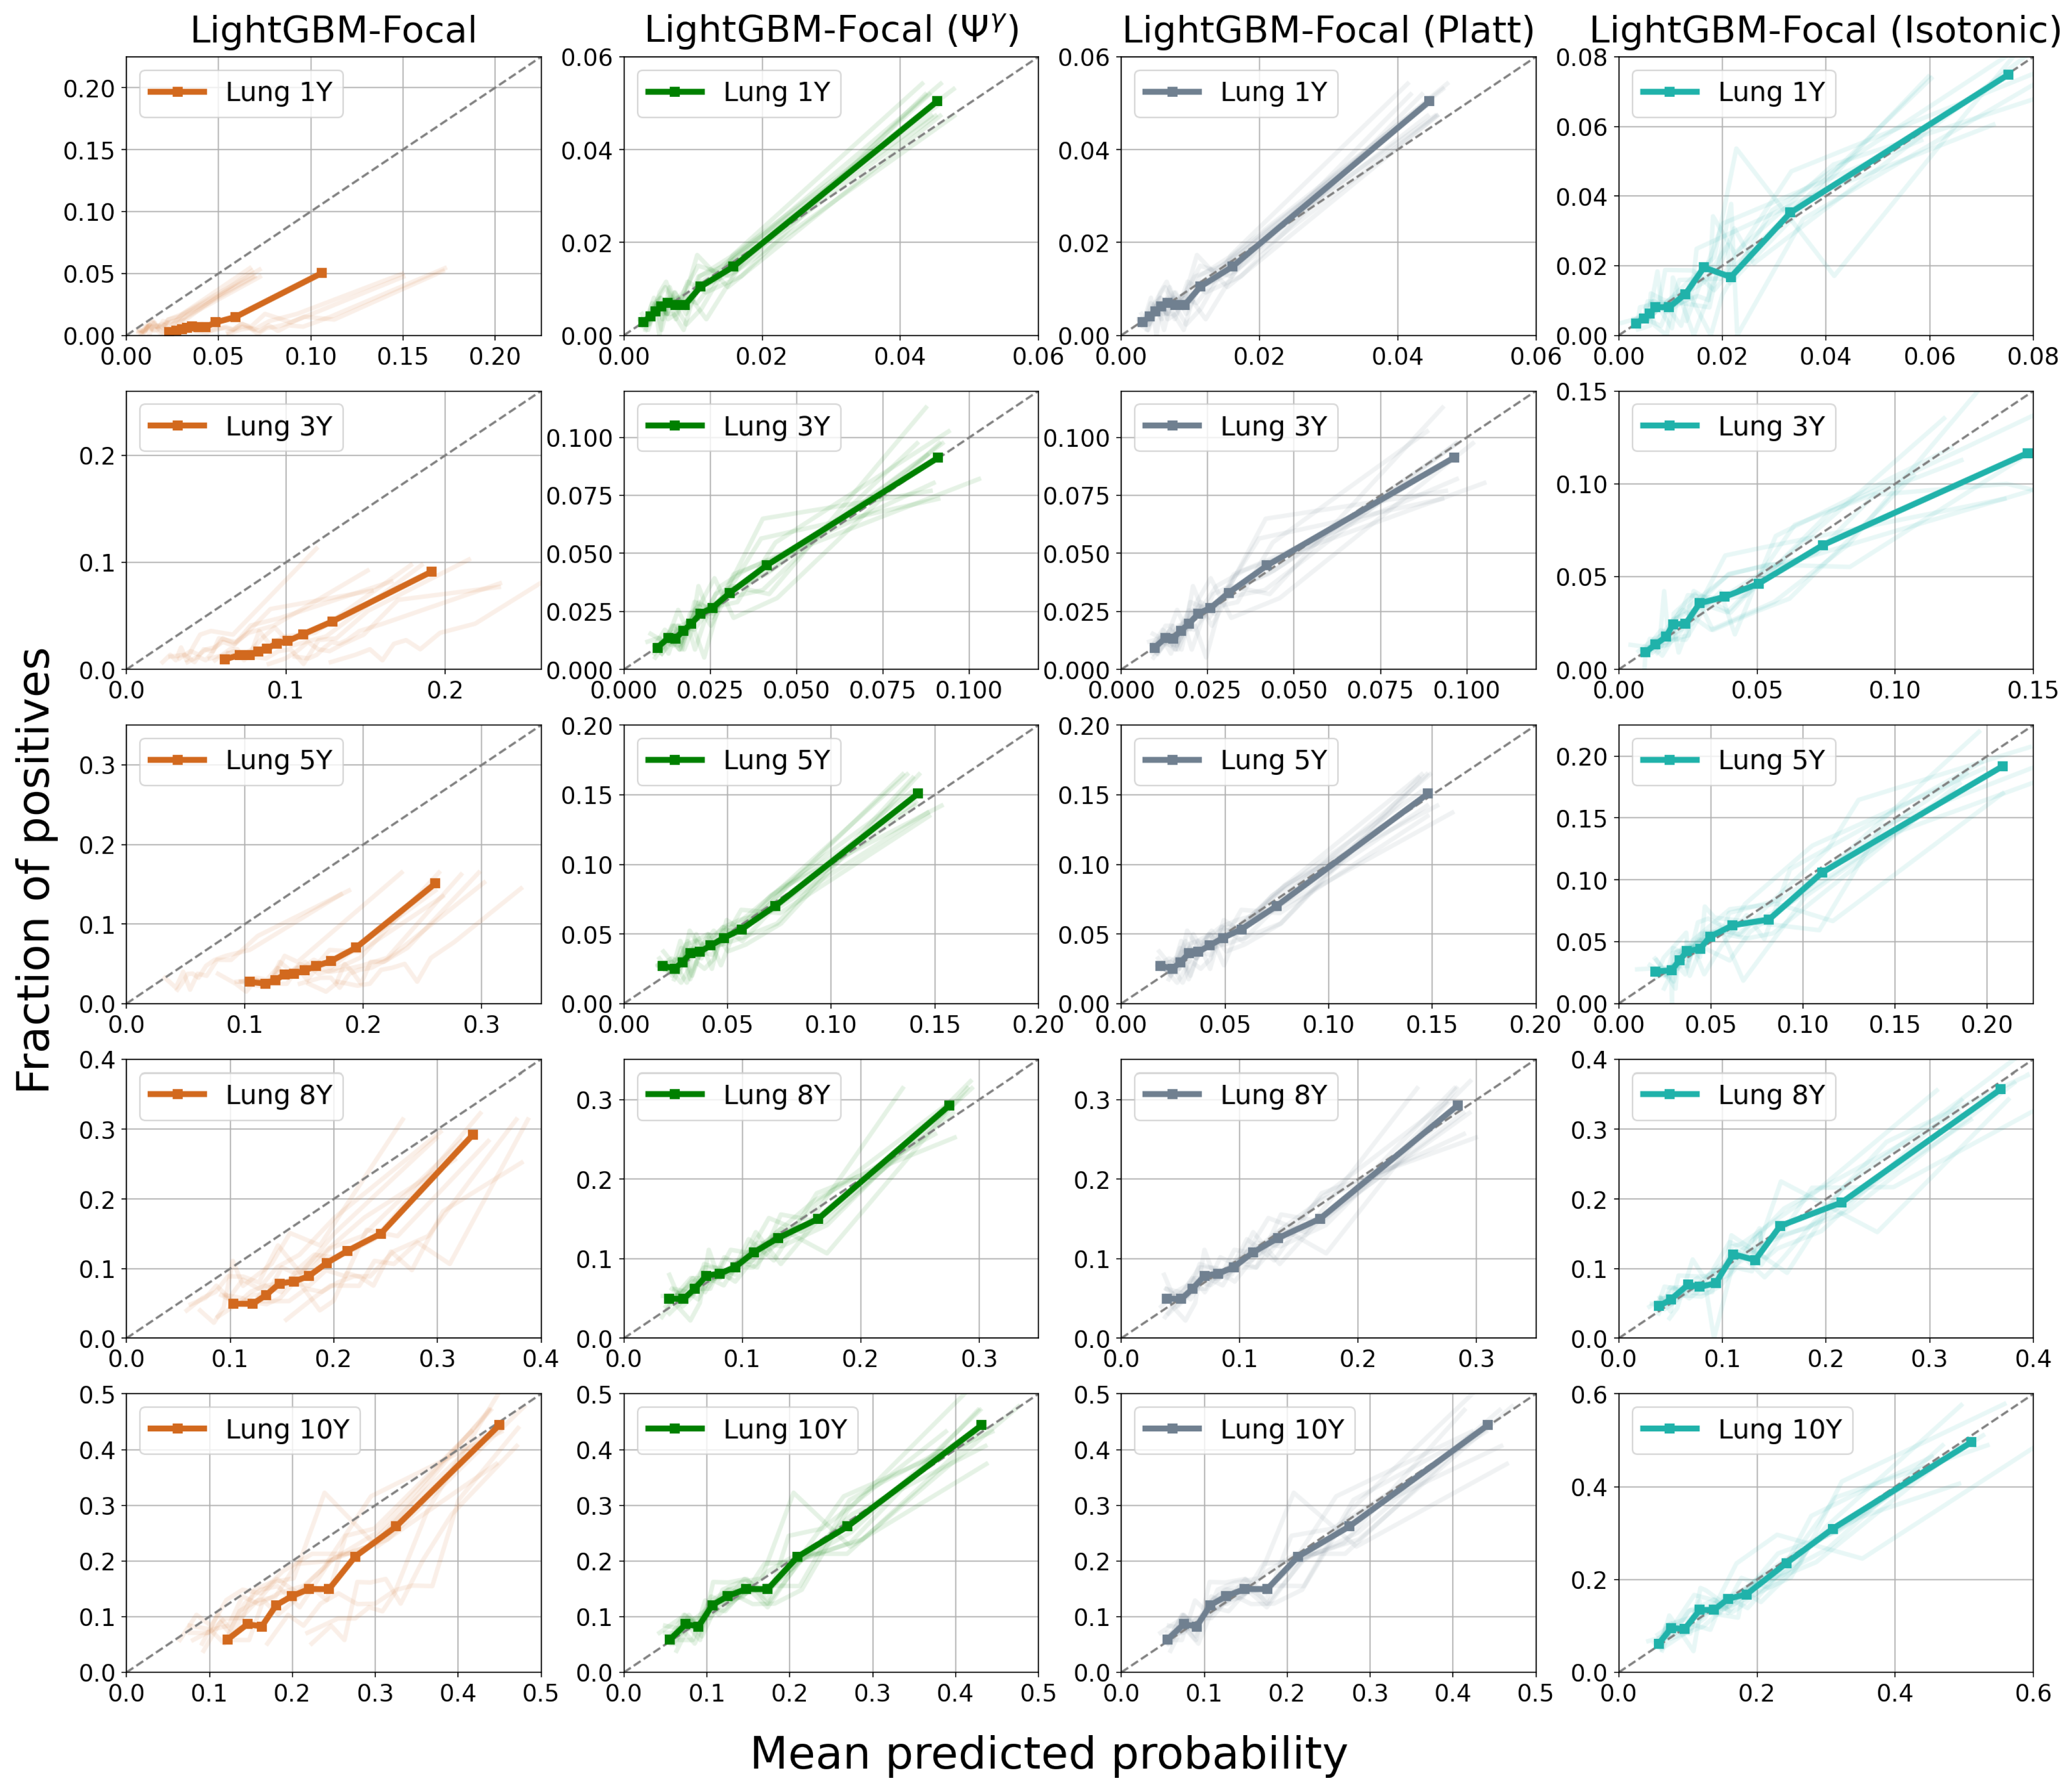
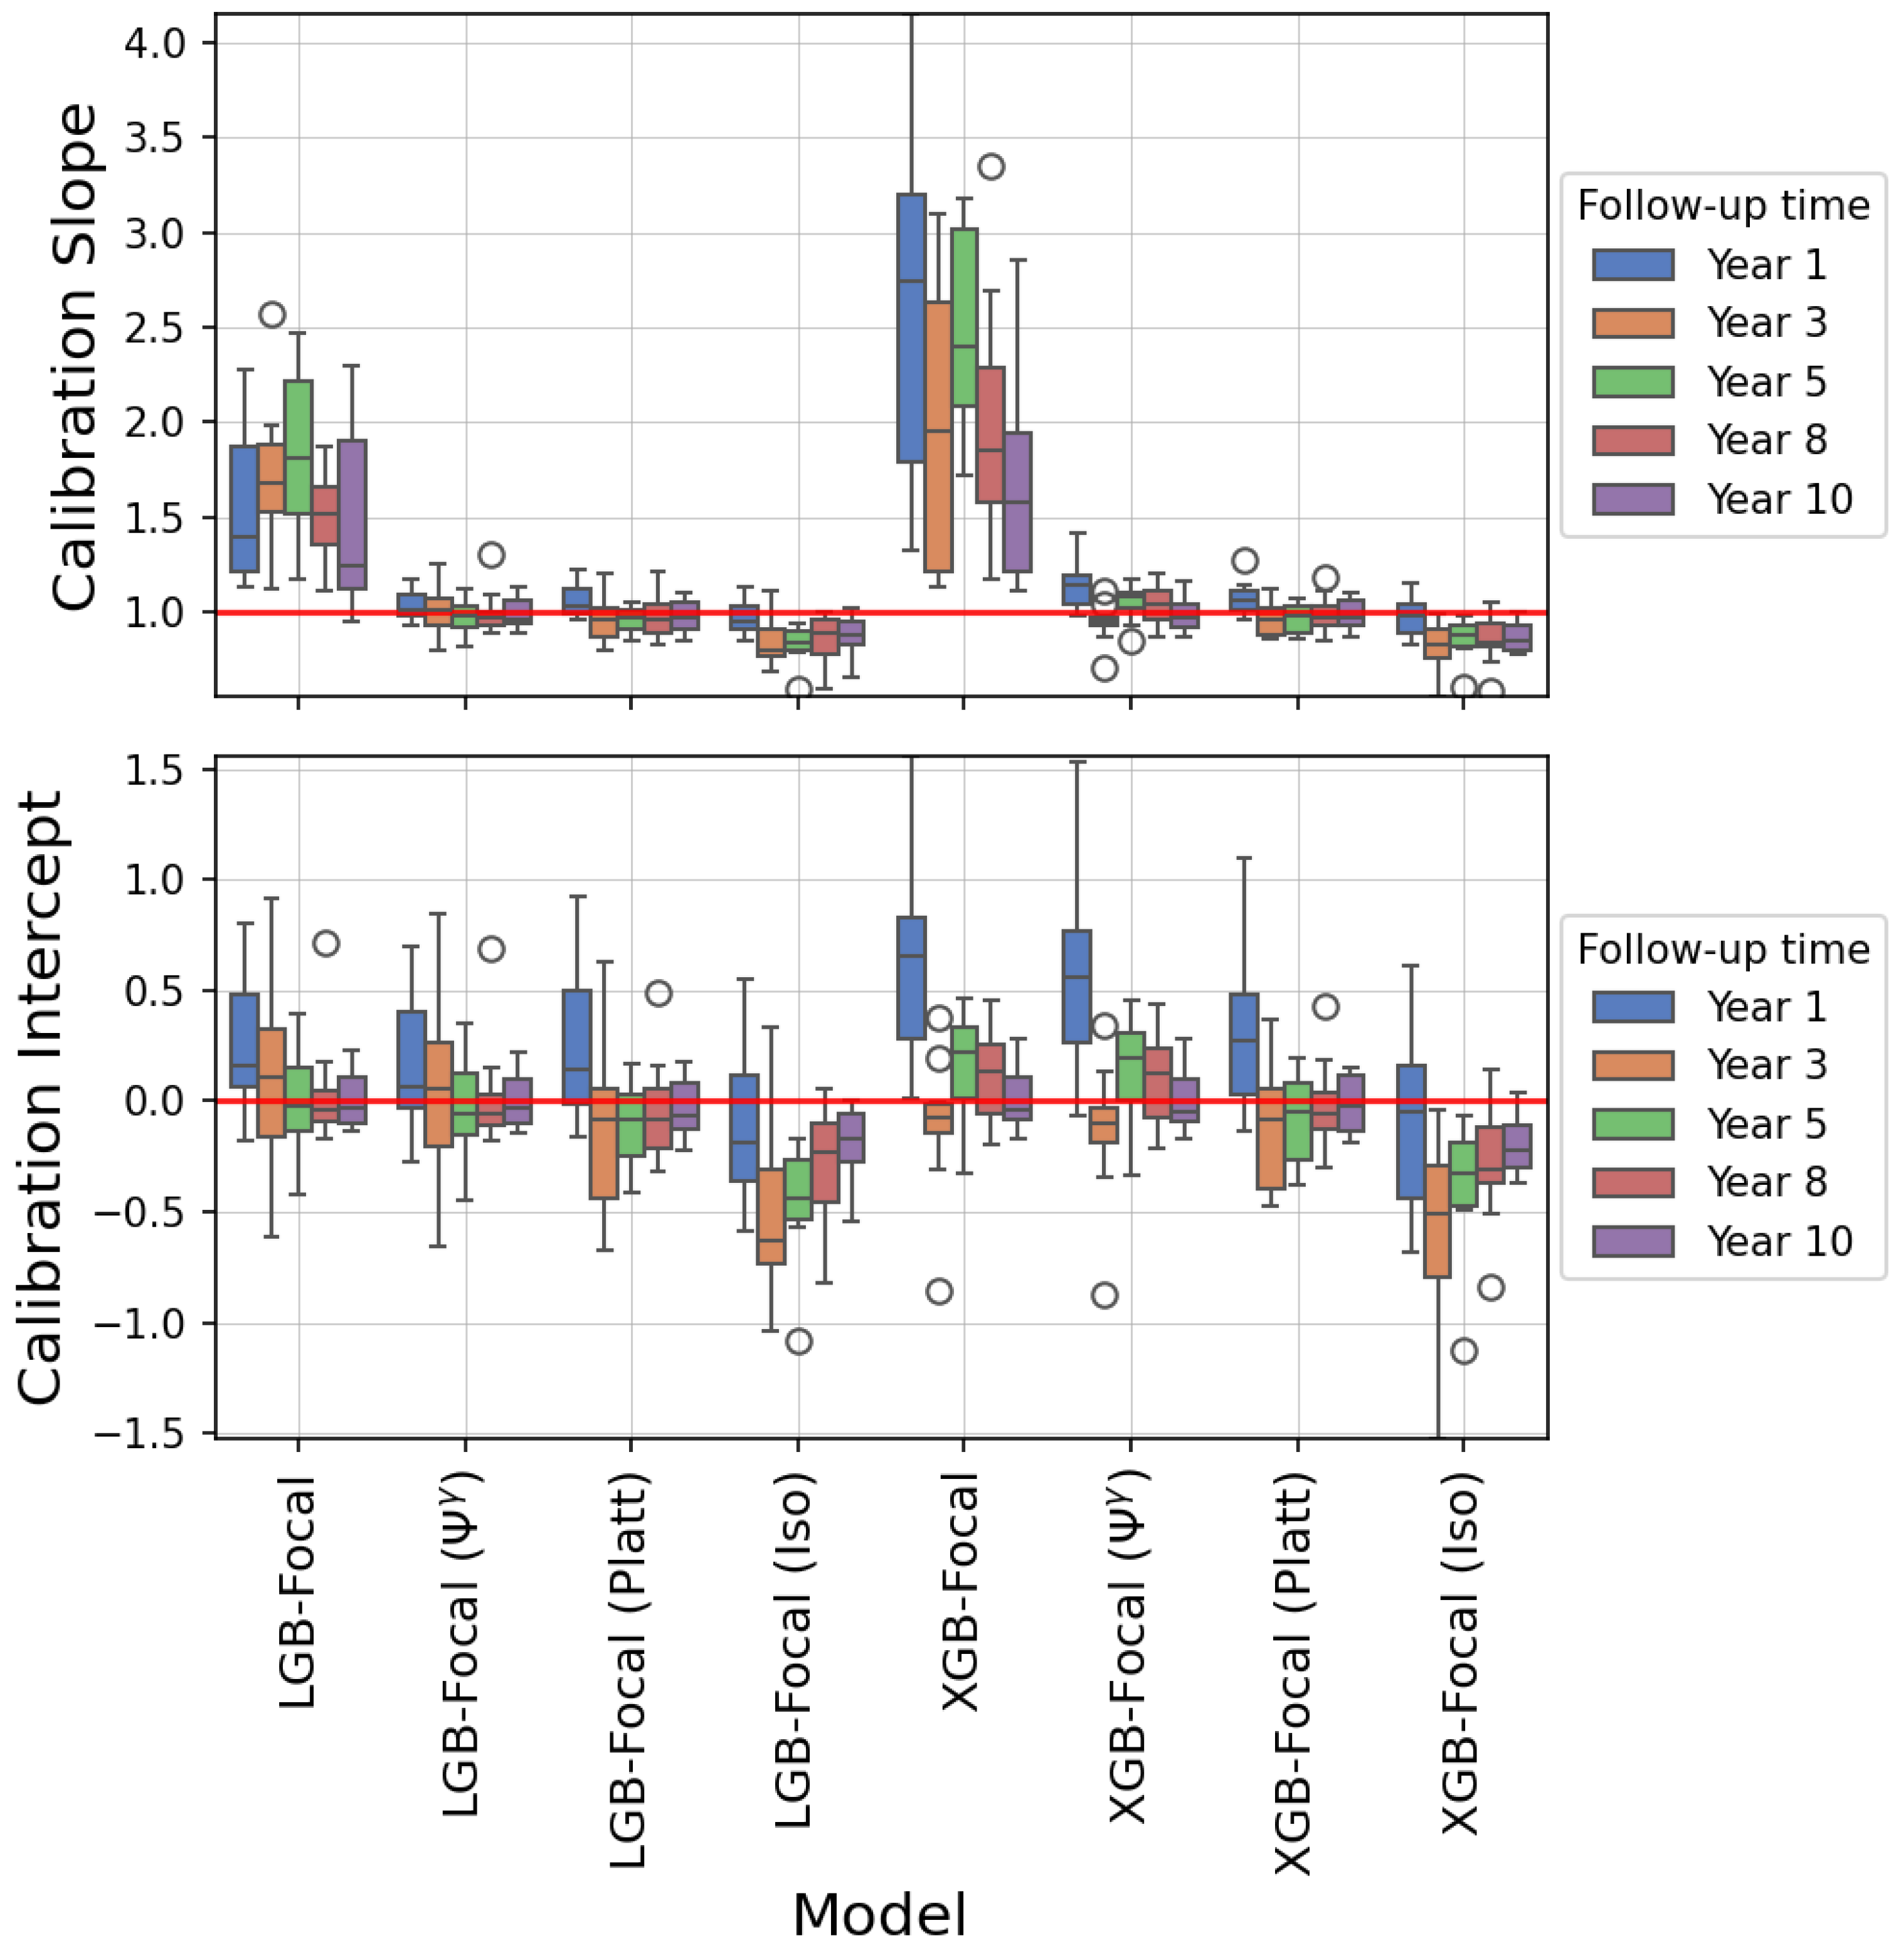
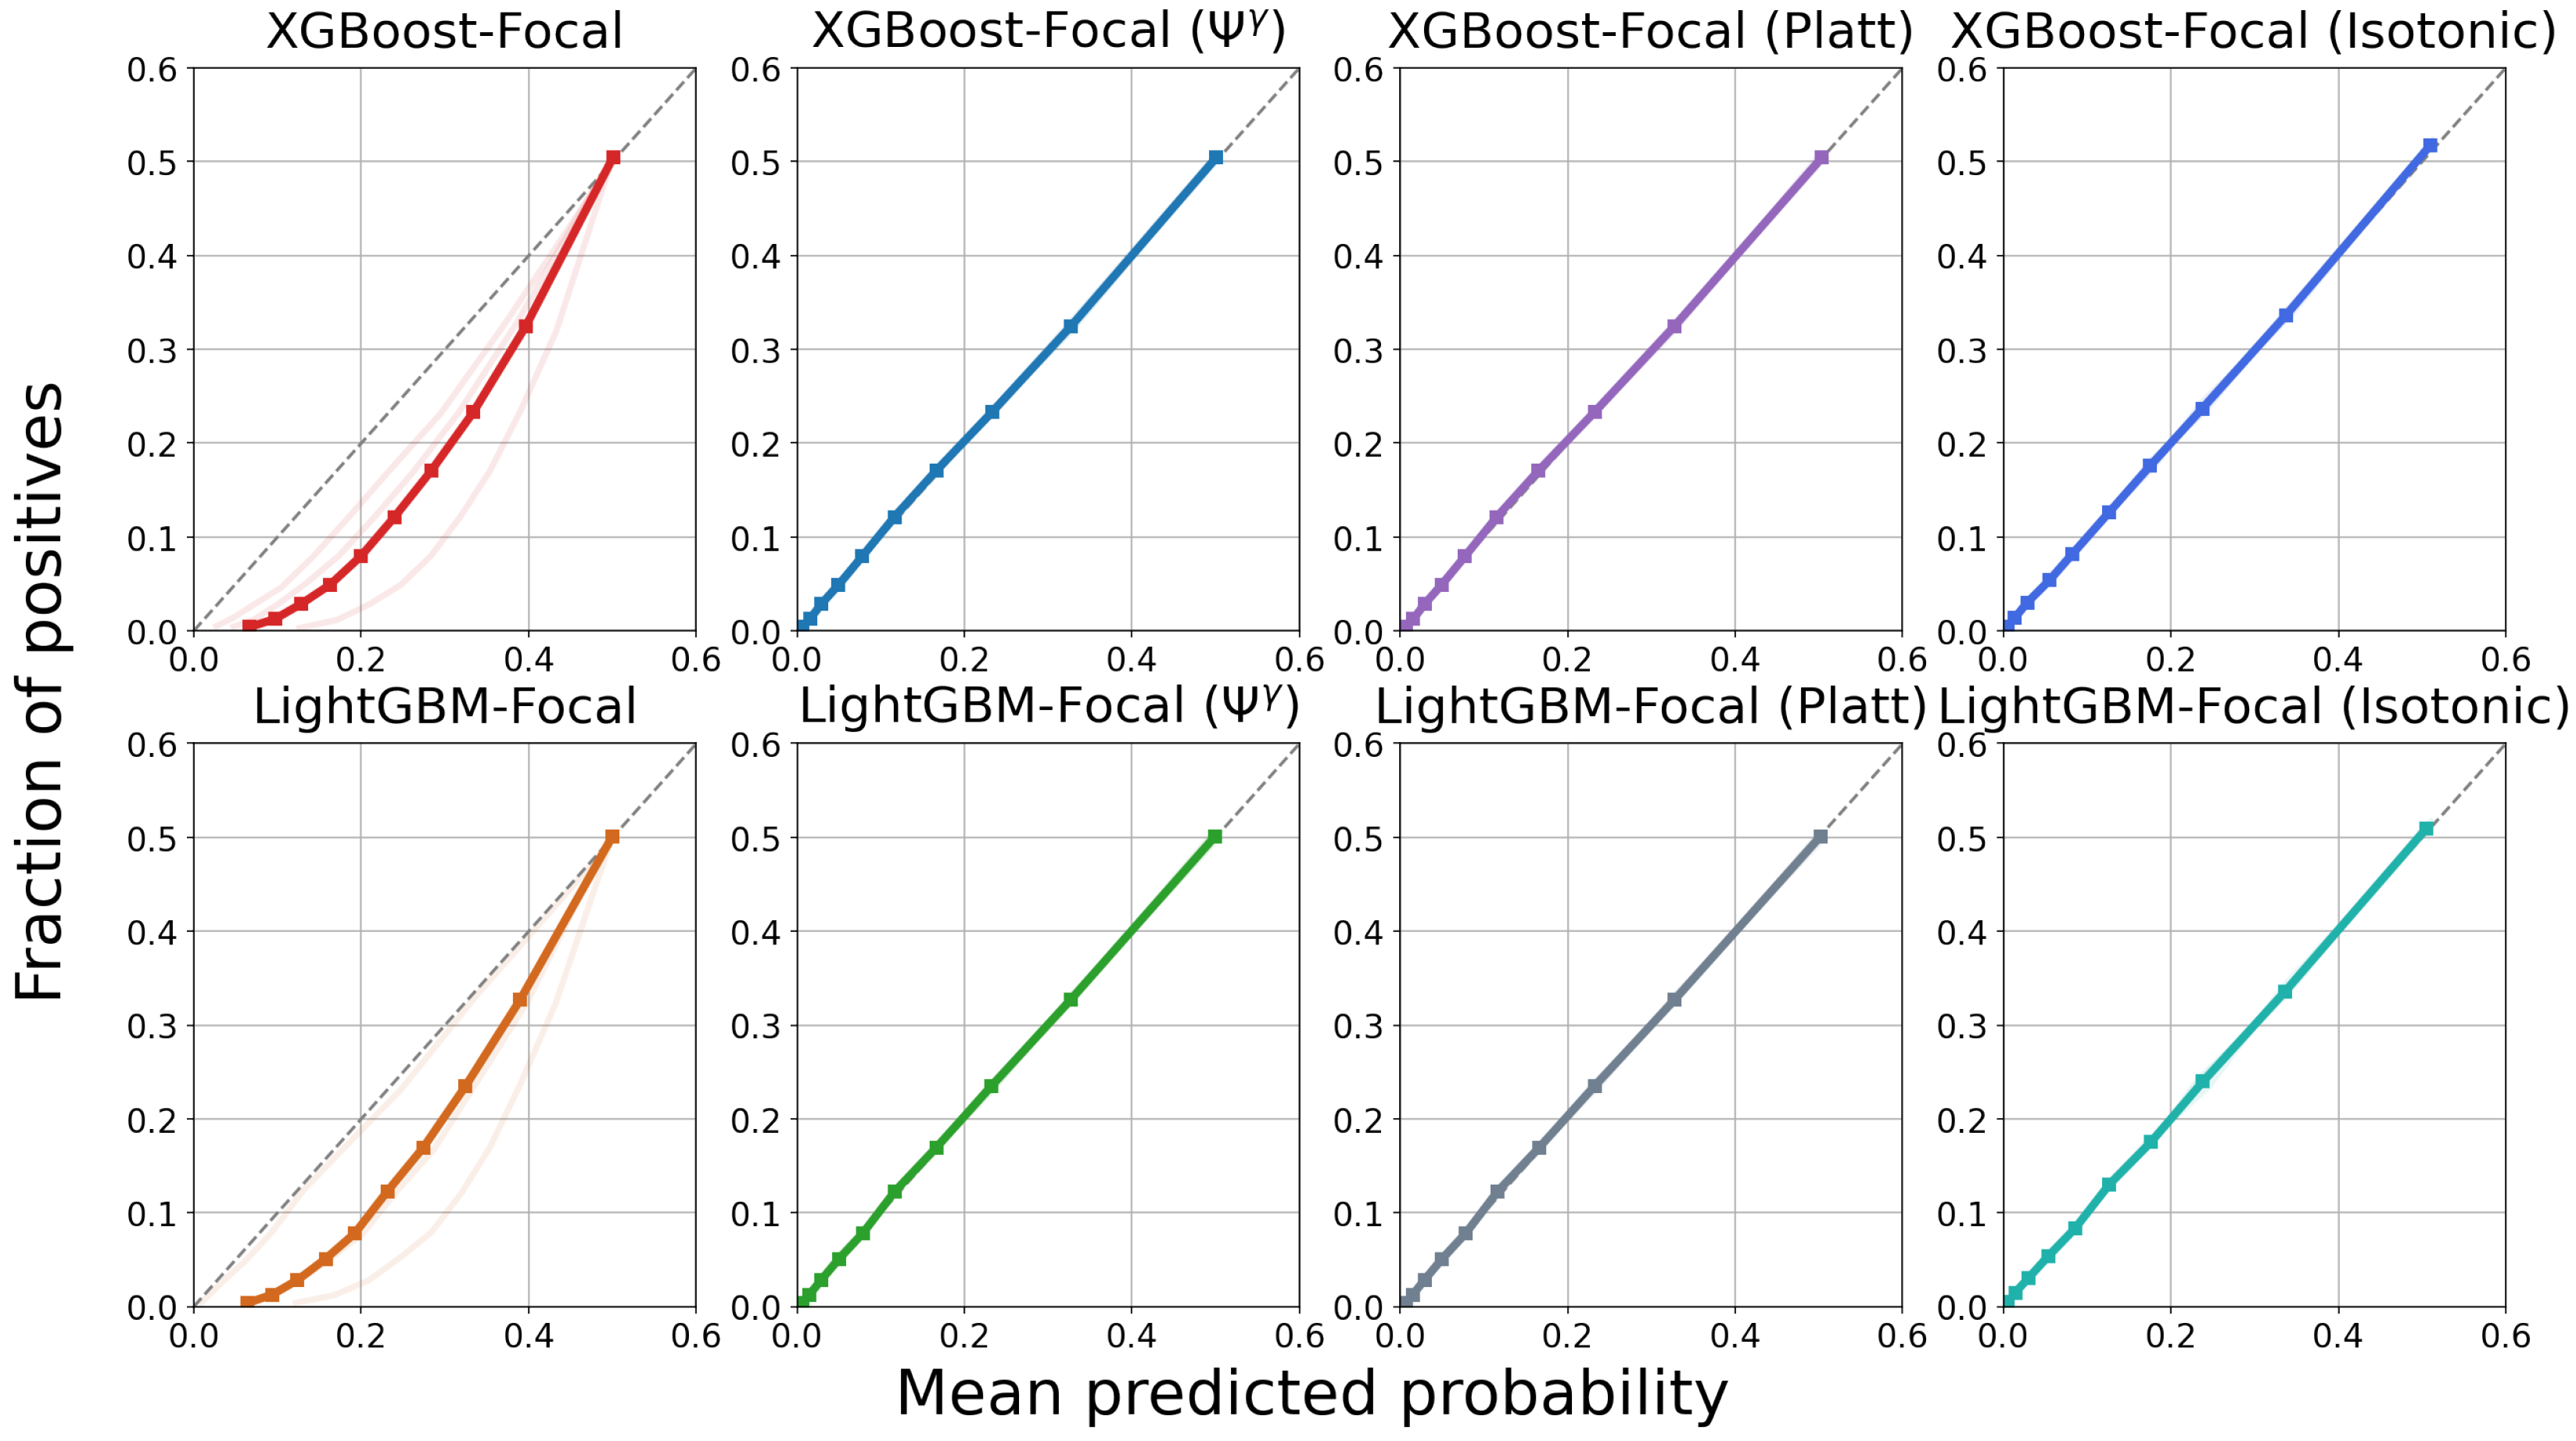
4.3. Results
5. Discussion
6. Conclusions
Author Contributions
Funding
Data Availability Statement
Acknowledgments
Conflicts of Interest
Appendix A. Feature Description

| Variable | Total Mean (SD) | PTLD Negative Mean (SD) | PTLD Positive Mean (SD) | p-Value |
|---|---|---|---|---|
| REC_AGE_AT_TX | 54.81 (12.86) | 54.91 (12.80) | 51.51 (14.20) | 0 |
| DON_AGE | 33.73 (13.89) | 33.79 (13.90) | 31.74 (13.35) | 0 |
| Variable | Category | Total | PTLD Negative | PTLD Positive | p-Value |
|---|---|---|---|---|---|
| REC_BMI_CAT | Normal | 13,470 | 13,068 | 402 | 0.000 |
| REC_BMI_CAT | Obese | 4826 | 4711 | 115 | 0.000 |
| REC_BMI_CAT | Overweight | 11,493 | 11,171 | 322 | 0.000 |
| REC_BMI_CAT | Underweight | 3015 | 2888 | 127 | 0.000 |
| REC_A_MM_EQUIV_TX | 0 | 2240 | 2172 | 68 | 0.605 |
| REC_A_MM_EQUIV_TX | 1 | 12,472 | 12,131 | 341 | 0.605 |
| REC_A_MM_EQUIV_TX | 2 | 14,833 | 14,403 | 430 | 0.605 |
| REC_B_MM_EQUIV_TX | 0 | 621 | 595 | 26 | 0.072 |
| REC_B_MM_EQUIV_TX | 1 | 8085 | 7845 | 240 | 0.072 |
| REC_B_MM_EQUIV_TX | 2 | 20,836 | 20,264 | 572 | 0.072 |
| REC_DR_MM_EQUIV_TX | 0 | 1577 | 1535 | 42 | 0.889 |
| REC_DR_MM_EQUIV_TX | 1 | 12,404 | 12,049 | 355 | 0.889 |
| REC_DR_MM_EQUIV_TX | 2 | 15,476 | 15,042 | 434 | 0.889 |
| REC_LU_SURG | N | 24,044 | 23,526 | 518 | 0.000 |
| REC_LU_SURG | Y | 1966 | 1889 | 77 | 0.000 |
| CAN_ABO | A | 13,310 | 12,889 | 421 | 0.165 |
| CAN_ABO | B | 3720 | 3605 | 115 | 0.165 |
| CAN_ABO | O | 14,814 | 14,410 | 404 | 0.165 |
| CAN_ABO | OTHER | 1400 | 1356 | 44 | 0.165 |
| CAN_DIAB_TY | NO | 26,220 | 25,503 | 717 | 0.218 |
| CAN_DIAB_TY | YES | 5125 | 4969 | 156 | 0.218 |
| ABO_MATCH | False | 9999 | 9673 | 326 | 0.034 |
| ABO_MATCH | True | 23,245 | 22,587 | 658 | 0.034 |
| CAN_GENDER | F | 14,380 | 13,987 | 393 | 0.033 |
| CAN_GENDER | M | 18,864 | 18,273 | 591 | 0.033 |
| CAN_MALIG | N | 28,865 | 28,050 | 815 | 0.020 |
| CAN_MALIG | Y | 2174 | 2131 | 43 | 0.020 |
| CAN_RACE_SRTR | BLACK | 2749 | 2710 | 39 | 0.000 |
| CAN_RACE_SRTR | OTHER | 731 | 717 | 14 | 0.000 |
| CAN_RACE_SRTR | WHITE | 29,760 | 28,830 | 930 | 0.000 |
| CAN_ETHNICITY_SRTR | LATINO | 1993 | 1957 | 36 | 0.002 |
| CAN_ETHNICITY_SRTR | NLATIN | 31,251 | 30,303 | 948 | 0.002 |
| REC_CMV_STAT | N | 12,119 | 11,755 | 364 | 0.000 |
| REC_CMV_STAT | P | 15,977 | 15,643 | 334 | 0.000 |
| REC_EBV_STAT | N | 2824 | 2612 | 212 | 0.000 |
| REC_EBV_STAT | P | 23,900 | 23,461 | 439 | 0.000 |
| CMV_MATCH | False | 13,059 | 12,713 | 346 | 0.081 |
| CMV_MATCH | True | 14,930 | 14,583 | 347 | 0.081 |
| REC_MED_COND | HOSPITALIZED | 2608 | 2540 | 68 | 0.002 |
| REC_MED_COND | INTENSIVE_CARE | 2647 | 2596 | 51 | 0.002 |
| REC_MED_COND | NOT_HOSPITALIZED | 27,966 | 27,102 | 864 | 0.002 |
| REC_LIFE_SUPPORT | N | 30,613 | 29,691 | 922 | 0.053 |
| REC_LIFE_SUPPORT | Y | 2604 | 2543 | 61 | 0.053 |
| REC_CHRONIC_STEROIDS | N | 16,944 | 16,490 | 454 | 0.094 |
| REC_CHRONIC_STEROIDS | Y | 14,188 | 13,763 | 425 | 0.094 |
| DON_GENDER | F | 12,866 | 12,540 | 326 | 0.000 |
| DON_GENDER | M | 20,378 | 19,720 | 658 | 0.000 |
| DON_ABO | A | 4854 | 4715 | 139 | 0.045 |
| DON_ABO | A1 | 6417 | 6192 | 225 | 0.045 |
| DON_ABO | A2 | 872 | 853 | 19 | 0.045 |
| DON_ABO | B | 3594 | 3488 | 106 | 0.045 |
| DON_ABO | O | 16,787 | 16,318 | 469 | 0.045 |
| DON_ABO | OTHER | 720 | 694 | 26 | 0.045 |
| DON_ANTI_CMV | N | 13,101 | 12,665 | 436 | 0.001 |
| DON_ANTI_CMV | P | 19,975 | 19,435 | 540 | 0.001 |
| DON_EBV_IGG | N | 1452 | 1408 | 44 | 0.011 |
| DON_EBV_IGG | P | 20,894 | 20,467 | 427 | 0.011 |
| DON_HIST_DIAB | NO | 29,775 | 28,914 | 861 | 0.063 |
| DON_HIST_DIAB | YES | 1979 | 1936 | 43 | 0.063 |
| DON_RACE_HISPANIC_LATINO | 0 | 28,504 | 27,633 | 871 | 0.010 |
| DON_RACE_HISPANIC_LATINO | 1 | 4729 | 4617 | 112 | 0.010 |
| DON_INFECT_LU | 0 | 17,397 | 16,752 | 645 | 0.000 |
| DON_INFECT_LU | 1 | 15,836 | 15,498 | 338 | 0.000 |
| INDUCTION_AZATHIOPRINE | 0 | 30,235 | 29,437 | 798 | 0.000 |
| INDUCTION_AZATHIOPRINE | 1 | 2699 | 2526 | 173 | 0.000 |
| INDUCTION_ATGAM | 0 | 31,292 | 30,405 | 887 | 0.000 |
| INDUCTION_ATGAM | 1 | 1642 | 1558 | 84 | 0.000 |
| INDUCTION_OKT3 | 0 | 32,691 | 31,741 | 950 | 0.000 |
| INDUCTION_OKT3 | 1 | 243 | 222 | 21 | 0.000 |
| INDUCTION_BASILIXIMAB | 0 | 19,225 | 18,493 | 732 | 0.000 |
| INDUCTION_BASILIXIMAB | 1 | 13,709 | 13,470 | 239 | 0.000 |
| INDUCTION_CYCLOSPORINE | 0 | 30,266 | 29,444 | 822 | 0.000 |
| INDUCTION_CYCLOSPORINE | 1 | 2668 | 2519 | 149 | 0.000 |
| INDUCTION_TACROLIMUS | 0 | 32,650 | 31,702 | 948 | 0.000 |
| INDUCTION_TACROLIMUS | 1 | 284 | 261 | 23 | 0.000 |
| INDUCTION_STEROIDS | 0 | 11,596 | 11,261 | 335 | 0.639 |
| INDUCTION_STEROIDS | 1 | 21,338 | 20,702 | 636 | 0.639 |
| ANTI_REJECTION_STEROIDS | 0 | 29,725 | 28,880 | 845 | 0.001 |
| ANTI_REJECTION_STEROIDS | 1 | 3209 | 3083 | 126 | 0.001 |
| HLA_A2 | 0 | 15,800 | 15,388 | 412 | 0.005 |
| HLA_A2 | 1 | 14,052 | 13,610 | 442 | 0.005 |
| HLA_A28 | 0 | 29,406 | 28,573 | 833 | 0.018 |
| HLA_A28 | 1 | 446 | 425 | 21 | 0.018 |
| HLA_A31 | 0 | 28,194 | 27,374 | 820 | 0.042 |
| HLA_A31 | 1 | 1658 | 1624 | 34 | 0.042 |
| HLA_A32 | 0 | 27,920 | 27,110 | 810 | 0.112 |
| HLA_A32 | 1 | 1932 | 1888 | 44 | 0.112 |
| HLA_B7 | 0 | 22,822 | 22,147 | 675 | 0.062 |
| HLA_B7 | 1 | 7028 | 6850 | 178 | 0.062 |
| HLA_B13 | 0 | 28,549 | 27,737 | 812 | 0.515 |
| HLA_B13 | 1 | 1301 | 1260 | 41 | 0.515 |
| HLA_B14 | 0 | 29,344 | 28,512 | 832 | 0.078 |
| HLA_B14 | 1 | 506 | 485 | 21 | 0.078 |
| HLA_B18 | 0 | 27,501 | 26,727 | 774 | 0.126 |
| HLA_B18 | 1 | 2349 | 2270 | 79 | 0.126 |
| HLA_B27 | 0 | 27,661 | 26,864 | 797 | 0.382 |
| HLA_B27 | 1 | 2189 | 2133 | 56 | 0.382 |
| HLA_B49 | 0 | 28,876 | 28,052 | 824 | 0.820 |
| HLA_B49 | 1 | 974 | 945 | 29 | 0.820 |
| HLA_B51 | 0 | 27,226 | 26,457 | 769 | 0.269 |
| HLA_B51 | 1 | 2624 | 2540 | 84 | 0.269 |
| HLA_B57 | 0 | 27,799 | 27,027 | 772 | 0.002 |
| HLA_B57 | 1 | 2051 | 1970 | 81 | 0.002 |
| HLA_B62 | 0 | 26,680 | 25,935 | 745 | 0.050 |
| HLA_B62 | 1 | 3170 | 3062 | 108 | 0.050 |
| HLA_B65 | 0 | 28,657 | 27,841 | 816 | 0.606 |
| HLA_B65 | 1 | 1193 | 1156 | 37 | 0.606 |
| HLA_DR2 | 0 | 29,371 | 28,547 | 824 | 0.004 |
| HLA_DR2 | 1 | 382 | 362 | 20 | 0.004 |
| HLA_DR3 | 0 | 28,822 | 28,042 | 780 | 0.000 |
| HLA_DR3 | 1 | 931 | 867 | 64 | 0.000 |
| HLA_DR7 | 0 | 22,751 | 22,112 | 639 | 0.600 |
| HLA_DR7 | 1 | 7002 | 6797 | 205 | 0.600 |
| HLA_DR14 | 0 | 27,909 | 27,104 | 805 | 0.054 |
| HLA_DR14 | 1 | 1844 | 1805 | 39 | 0.054 |
| HLA_DR17 | 0 | 24,279 | 23,583 | 696 | 0.512 |
| HLA_DR17 | 1 | 5474 | 5326 | 148 | 0.512 |
| Variable (SAS Variable Name) | Total Mean (SD) | No Diabetes Mean (SD) | Diabetes Mean (SD) | p-Value |
|---|---|---|---|---|
| BMI (_BMI5) | 28.69 (6.79) | 28.10 (6.50) | 31.96 (7.38) | 0 |
| MentHlth (MENTHLTH) | 3.51 (7.72) | 3.33 (7.46) | 4.49 (8.97) | 0 |
| PhysHlth (PHYSHLTH) | 4.68 (9.05) | 4.08 (8.44) | 8.01 (11.32) | 0 |
| Variable (SAS Variable Name) | Category | Total | No Diabetes | Diabetes | p-Value |
|---|---|---|---|---|---|
| HighBP (_RFHYPE5) | 0 | 125,214 | 116,522 | 8692 | 0 |
| HighBP (_RFHYPE5) | 1 | 104,260 | 77,855 | 26,405 | 0 |
| HighChol (TOLDHI2) | 0 | 128,129 | 116,528 | 11,601 | 0 |
| HighChol (TOLDHI2) | 1 | 101,345 | 77,849 | 23,496 | 0 |
| CholCheck (_CHOLCHK) | 0 | 9298 | 9057 | 241 | 0 |
| CholCheck (_CHOLCHK) | 1 | 220,176 | 185,320 | 34,856 | 0 |
| Smoker (SMOKE100) | 0 | 122,585 | 105,711 | 16,874 | 0 |
| Smoker (SMOKE100) | 1 | 106,889 | 88,666 | 18,223 | 0 |
| Stroke (CVDSTRK3) | 0 | 219,190 | 187,361 | 31,829 | 0 |
| Stroke (CVDSTRK3) | 1 | 10,284 | 7016 | 3268 | 0 |
| HeartDiseaseorAttack (_MICHD) | 0 | 205,761 | 178,520 | 27,241 | 0 |
| HeartDiseaseorAttack (_MICHD) | 1 | 23,713 | 15,857 | 7856 | 0 |
| PhysActivity (_TOTINDA) | 0 | 61,260 | 48,222 | 13,038 | 0 |
| PhysActivity (_TOTINDA) | 1 | 168,214 | 146,155 | 22,059 | 0 |
| Fruits (_FRTLT1) | 0 | 88,881 | 74,289 | 14,592 | 0 |
| Fruits (_FRTLT1) | 1 | 140,593 | 120,088 | 20,505 | 0 |
| Veggies (_VEGLT1) | 0 | 47,137 | 38,535 | 8602 | 0 |
| Veggies (_VEGLT1) | 1 | 182,337 | 155,842 | 26,495 | 0 |
| HvyAlcoholConsump (_RFDRHV5) | 0 | 215,524 | 181,259 | 34,265 | 0 |
| HvyAlcoholConsump (_RFDRHV5) | 1 | 13,950 | 13,118 | 832 | 0 |
| AnyHealthcare (HLTHPLN1) | 0 | 12,389 | 10,967 | 1422 | 0 |
| AnyHealthcare (HLTHPLN1) | 1 | 217,085 | 183,410 | 33,675 | 0 |
| NoDocbcCost (MEDCOST) | 0 | 208,151 | 176,796 | 31,355 | 0 |
| NoDocbcCost (MEDCOST) | 1 | 21,323 | 17,581 | 3742 | 0 |
| GenHlth (GENHLTH) | 1 | 34,854 | 33,719 | 1135 | 0 |
| GenHlth (GENHLTH) | 2 | 77,365 | 71,085 | 6280 | 0 |
| GenHlth (GENHLTH) | 3 | 73,632 | 60,308 | 13,324 | 0 |
| GenHlth (GENHLTH) | 4 | 31,545 | 21,764 | 9781 | 0 |
| GenHlth (GENHLTH) | 5 | 12,078 | 7501 | 4577 | 0 |
| DiffWalk (DIFFWALK) | 0 | 186,849 | 164,866 | 21,983 | 0 |
| DiffWalk (DIFFWALK) | 1 | 42,625 | 29,511 | 13,114 | 0 |
| Sex (SEX) | 0 | 128,715 | 110,370 | 18,345 | 0 |
| Sex (SEX) | 1 | 100,759 | 84,007 | 16,752 | 0 |
| Age (_AGEG5YR) | 1 | 5511 | 5433 | 78 | 0 |
| Age (_AGEG5YR) | 2 | 7064 | 6924 | 140 | 0 |
| Age (_AGEG5YR) | 3 | 10,023 | 9709 | 314 | 0 |
| Age (_AGEG5YR) | 4 | 12,229 | 11,604 | 625 | 0 |
| Age (_AGEG5YR) | 5 | 14,040 | 12,991 | 1049 | 0 |
| Age (_AGEG5YR) | 6 | 17,280 | 15,539 | 1741 | 0 |
| Age (_AGEG5YR) | 7 | 23,121 | 20,049 | 3072 | 0 |
| Age (_AGEG5YR) | 8 | 27,272 | 23,031 | 4241 | 0 |
| Age (_AGEG5YR) | 9 | 29,678 | 23,997 | 5681 | 0 |
| Age (_AGEG5YR) | 10 | 29,093 | 22,610 | 6483 | 0 |
| Age (_AGEG5YR) | 11 | 21,993 | 16,903 | 5090 | 0 |
| Age (_AGEG5YR) | 12 | 15,379 | 11,996 | 3383 | 0 |
| Age (_AGEG5YR) | 13 | 16,791 | 13,591 | 3200 | 0 |
| Education (EDUCA) | 1 | 174 | 127 | 47 | 0 |
| Education (EDUCA) | 2 | 4040 | 2857 | 1183 | 0 |
| Education (EDUCA) | 3 | 9467 | 7171 | 2296 | 0 |
| Education (EDUCA) | 4 | 61,124 | 50,092 | 11,032 | 0 |
| Education (EDUCA) | 5 | 66,444 | 56,133 | 10,311 | 0 |
| Education (EDUCA) | 6 | 88,225 | 77,997 | 10,228 | 0 |
| Income (INCOME2) | 1 | 9791 | 7408 | 2383 | 0 |
| Income (INCOME2) | 2 | 11,756 | 8670 | 3086 | 0 |
| Income (INCOME2) | 3 | 15,920 | 12,356 | 3564 | 0 |
| Income (INCOME2) | 4 | 19,953 | 15,906 | 4047 | 0 |
| Income (INCOME2) | 5 | 25,326 | 20,837 | 4489 | 0 |
| Income (INCOME2) | 6 | 34,957 | 29,697 | 5260 | 0 |
| Income (INCOME2) | 7 | 40,131 | 34,905 | 5226 | 0 |
| Income (INCOME2) | 8 | 71,640 | 64,598 | 7042 | 0 |
Appendix B. Hyperparameters
- learning rate: Log-uniform distribution []
- max depth: Discrete uniform distribution
- n estimators: Discrete uniform distribution
- subsample: Uniform distribution
- colsample by tree: Uniform distribution
- colsample by level: Uniform distribution
- reg alpha: Log-uniform distribution []
- reg lambda: Log-uniform distribution []
- min child weight: Log-uniform distribution []
- learning rate: Log-uniform distribution []
- max depth: Discrete uniform distribution
- n estimators: Discrete uniform distribution
- feature fraction: Uniform distribution
- subsample: Uniform distribution
- lambda l1: Log-uniform distribution []
- lambda l2: Log-uniform distribution []
- min gain to split: Log-uniform distribution []
- path smooth: Log-uniform distribution []
- C: Log-uniform distribution []
- Solver: liblinear
- C: Log-uniform distribution []
- Solver: liblinear
- scikit-learn (1.1.2)
- scikit-optimize (0.10.1)
- hmeasure (0.1.6)
- xgboost (2.0.3)
- lightgbm (3.3.5)
- statsmodels (0.14.1)
Appendix C. Additional Tables for Results Section
| Model | Threshold | Sensitivity | Specificity | Balanced Accuracy |
|---|---|---|---|---|
| LR | Prevalence | 0.767 | 0.704 | 0.735 |
| LASSO LR | Prevalence | 0.767 | 0.704 | 0.736 |
| Ridge LR | Prevalence | 0.767 | 0.704 | 0.736 |
| LightGBM | Prevalence | 0.777 | 0.701 | 0.739 |
| LightGBM-Focal | Optimized | 0.784 | 0.695 | 0.739 |
| LightGBM-Focal () | Prevalence | 0.778 | 0.700 | 0.739 |
| LightGBM-Focal (Platt) | Prevalence | 0.778 | 0.701 | 0.739 |
| LightGBM-Focal (Isotonic) | Prevalence | 0.776 | 0.702 | 0.739 |
| XGBoost | Prevalence | 0.780 | 0.700 | 0.740 |
| XGBoost-Focal | Optimized | 0.786 | 0.695 | 0.740 |
| XGBoost-Focal () | Prevalence | 0.778 | 0.702 | 0.740 |
| XGBoost-Focal (Platt) | Prevalence | 0.776 | 0.704 | 0.740 |
| XGBoost-Focal (Isotonic) | Prevalence | 0.784 | 0.696 | 0.740 |
References
- Choquet, S.; Varnous, S.; Deback, C.; Golmard, J.; Leblond, V. Adapted treatment of Epstein–Barr virus infection to prevent posttransplant lymphoproliferative disorder after heart transplantation. Am. J. Transplant. 2014, 14, 857–866. [Google Scholar] [CrossRef] [PubMed]
- Owers, D.S.; Webster, A.C.; Strippoli, G.F.; Kable, K.; Hodson, E.M. Pre-emptive treatment for cytomegalovirus viraemia to prevent cytomegalovirus disease in solid organ transplant recipients. Cochrane Database Syst. Rev. 2013, 2013, CD005133. [Google Scholar] [CrossRef] [PubMed]
- Zafar, F.; Hossain, M.M.; Zhang, Y.; Dani, A.; Schecter, M.; Hayes, D., Jr.; Macaluso, M.; Towe, C.; Morales, D.L. Lung transplantation advanced prediction tool: Determining recipient’s outcome for a certain donor. Transplantation 2022, 106, 2019–2030. [Google Scholar] [CrossRef] [PubMed]
- Sinha, A.; Gupta, D.K.; Yancy, C.W.; Shah, S.J.; Rasmussen-Torvik, L.J.; McNally, E.M.; Greenland, P.; Lloyd-Jones, D.M.; Khan, S.S. Risk-based approach for the prediction and prevention of heart failure. Circ. Heart Fail. 2021, 14, e007761. [Google Scholar] [CrossRef]
- Hammond, M.M.; Everitt, I.K.; Khan, S.S. New strategies and therapies for the prevention of heart failure in high-risk patients. Clin. Cardiol. 2022, 45, S13–S25. [Google Scholar] [CrossRef]
- Ponikowski, P.; Anker, S.D.; AlHabib, K.F.; Cowie, M.R.; Force, T.L.; Hu, S.; Jaarsma, T.; Krum, H.; Rastogi, V.; Rohde, L.E.; et al. Heart failure: Preventing disease and death worldwide. ESC Heart Fail. 2014, 1, 4–25. [Google Scholar] [CrossRef]
- Hand, D.J. Measuring classifier performance: A coherent alternative to the area under the ROC curve. Mach. Learn. 2009, 77, 103–123. [Google Scholar] [CrossRef]
- Collins, G.S.; Dhiman, P.; Ma, J.; Schlussel, M.M.; Archer, L.; Van Calster, B.; Harrell, F.E.; Martin, G.P.; Moons, K.G.; Van Smeden, M.; et al. Evaluation of clinical prediction models (part 1): From development to external validation. BMJ 2024, 384, e074819. [Google Scholar] [CrossRef] [PubMed]
- Walsh, C.G.; Sharman, K.; Hripcsak, G. Beyond discrimination: A comparison of calibration methods and clinical usefulness of predictive models of readmission risk. J. Biomed. Inform. 2017, 76, 9–18. [Google Scholar] [CrossRef]
- Van Calster, B.; McLernon, D.; Van Smeden, M.; Wynants, L.; Steyerberg, E.; on behalf of Topic Group. ‘Evaluating diagnostic tests and prediction models’ of the STRATOS initiative. Calibration: The Achilles heel of predictive analytics. BMC Med. 2019, 17, 230. [Google Scholar]
- Friedman, J.H. Greedy function approximation: A gradient boosting machine. Ann. Stat. 2001, 29, 1189–1232. [Google Scholar] [CrossRef]
- Park, Y.; Ho, J.C. Tackling overfitting in boosting for noisy healthcare data. IEEE Trans. Knowl. Data Eng. 2019, 33, 2995–3006. [Google Scholar] [CrossRef]
- Chen, T.; Guestrin, C. Xgboost: A scalable tree boosting system. In Proceedings of the 22nd ACM Sigkdd International Conference on Knowledge Discovery and Data Mining, San Francisco, CA, USA, 13–17 August 2016; pp. 785–794. [Google Scholar]
- Ke, G.; Meng, Q.; Finley, T.; Wang, T.; Chen, W.; Ma, W.; Ye, Q.; Liu, T.Y. Lightgbm: A highly efficient gradient boosting decision tree. Adv. Neural Inf. Process. Syst. 2017, 30, 3146–3154. [Google Scholar]
- Prokhorenkova, L.; Gusev, G.; Vorobev, A.; Dorogush, A.V.; Gulin, A. CatBoost: Unbiased boosting with categorical features. Adv. Neural Inf. Process. Syst. 2018, 31, 6638–6648. [Google Scholar]
- Wang, C.; Deng, C.; Wang, S. Imbalance-XGBoost: Leveraging weighted and focal losses for binary label-imbalanced classification with XGBoost. Pattern Recognit. Lett. 2020, 136, 190–197. [Google Scholar] [CrossRef]
- Boldini, D.; Friedrich, L.; Kuhn, D.; Sieber, S.A. Tuning gradient boosting for imbalanced bioassay modelling with custom loss functions. J. Cheminformatics 2022, 14, 80. [Google Scholar] [CrossRef]
- Liu, W.; Fan, H.; Xia, M.; Xia, M. A focal-aware cost-sensitive boosted tree for imbalanced credit scoring. Expert Syst. Appl. 2022, 208, 118158. [Google Scholar] [CrossRef]
- Mushava, J.; Murray, M. A novel XGBoost extension for credit scoring class-imbalanced data combining a generalized extreme value link and a modified focal loss function. Expert Syst. Appl. 2022, 202, 117233. [Google Scholar] [CrossRef]
- Mushava, J.; Murray, M. Flexible loss functions for binary classification in gradient-boosted decision trees: An application to credit scoring. Expert Syst. Appl. 2024, 238, 121876. [Google Scholar] [CrossRef]
- Shankar, V.; Yang, X.; Krishna, V.; Tan, B.; Silva, O.; Rojansky, R.; Ng, A.; Valvert, F.; Briercheck, E.; Weinstock, D.; et al. LymphoML: An interpretable artificial intelligence-based method identifies morphologic features that correlate with lymphoma subtype. In Proceedings of the Machine Learning for Health (ML4H), New Orleans, LA, USA, 10 December 2023; PMLR: Cambridge, MA, USA, 2023; pp. 528–558. [Google Scholar]
- Rao, C.; Xu, Y.; Xiao, X.; Hu, F.; Goh, M. Imbalanced customer churn classification using a new multi-strategy collaborative processing method. Expert Syst. Appl. 2024, 247, 123251. [Google Scholar] [CrossRef]
- Luo, J.; Yuan, Y.; Xu, S. Improving GBDT performance on imbalanced datasets: An empirical study of class-balanced loss functions. Neurocomputing 2025, 634, 129896. [Google Scholar] [CrossRef]
- Lin, T.Y.; Goyal, P.; Girshick, R.; He, K.; Dollár, P. Focal loss for dense object detection. In Proceedings of the IEEE International Conference on Computer Vision, New Orleans, LA, USA, 10 December 2017; pp. 2980–2988. [Google Scholar]
- Le, P.B.; Nguyen, Z.T. ROC curves, loss functions, and distorted probabilities in binary classification. Mathematics 2022, 10, 1410. [Google Scholar] [CrossRef]
- Zhang, Y.; Kang, B.; Hooi, B.; Yan, S.; Feng, J. Deep long-tailed learning: A survey. IEEE Trans. Pattern Anal. Mach. Intell. 2023, 45, 10795–10816. [Google Scholar] [CrossRef]
- Charoenphakdee, N.; Vongkulbhisal, J.; Chairatanakul, N.; Sugiyama, M. On focal loss for class-posterior probability estimation: A theoretical perspective. In Proceedings of the IEEE/CVF Conference on Computer Vision and Pattern Recognition, Nashville, TN, USA, 20–25 June 2021; pp. 5202–5211. [Google Scholar]
- Gneiting, T.; Raftery, A.E. Strictly proper scoring rules, prediction, and estimation. J. Am. Stat. Assoc. 2007, 102, 359–378. [Google Scholar] [CrossRef]
- Seto, H.; Oyama, A.; Kitora, S.; Toki, H.; Yamamoto, R.; Kotoku, J.; Haga, A.; Shinzawa, M.; Yamakawa, M.; Fukui, S.; et al. Gradient boosting decision tree becomes more reliable than logistic regression in predicting probability for diabetes with big data. Sci. Rep. 2022, 12, 15889. [Google Scholar] [CrossRef]
- Ma, H.; Dong, Z.; Chen, M.; Sheng, W.; Li, Y.; Zhang, W.; Zhang, S.; Yu, Y. A gradient boosting tree model for multi-department venous thromboembolism risk assessment with imbalanced data. J. Biomed. Inform. 2022, 134, 104210. [Google Scholar] [CrossRef]
- Badrouchi, S.; Ahmed, A.; Bacha, M.M.; Abderrahim, E.; Abdallah, T.B. A machine learning framework for predicting long-term graft survival after kidney transplantation. Expert Syst. Appl. 2021, 182, 115235. [Google Scholar] [CrossRef]
- Christodoulou, E.; Ma, J.; Collins, G.S.; Steyerberg, E.W.; Verbakel, J.Y.; Van Calster, B. A systematic review shows no performance benefit of machine learning over logistic regression for clinical prediction models. J. Clin. Epidemiol. 2019, 110, 12–22. [Google Scholar] [CrossRef]
- Nusinovici, S.; Tham, Y.C.; Yan, M.Y.C.; Ting, D.S.W.; Li, J.; Sabanayagam, C.; Wong, T.Y.; Cheng, C.Y. Logistic regression was as good as machine learning for predicting major chronic diseases. J. Clin. Epidemiol. 2020, 122, 56–69. [Google Scholar] [CrossRef]
- Bae, S.; Massie, A.B.; Caffo, B.S.; Jackson, K.R.; Segev, D.L. Machine learning to predict transplant outcomes: Helpful or hype? A national cohort study. Transpl. Int. 2020, 33, 1472–1480. [Google Scholar] [CrossRef]
- Austin, P.C.; Harrell, F.E., Jr.; Steyerberg, E.W. Predictive performance of machine and statistical learning methods: Impact of data-generating processes on external validity in the “large N, small p” setting. Stat. Methods Med. Res. 2021, 30, 1465–1483. [Google Scholar] [CrossRef] [PubMed]
- Miller, R.J.; Sabovčik, F.; Cauwenberghs, N.; Vens, C.; Khush, K.K.; Heidenreich, P.A.; Haddad, F.; Kuznetsova, T. Temporal shift and predictive performance of machine learning for heart transplant outcomes. J. Heart Lung Transplant. 2022, 41, 928–936. [Google Scholar] [CrossRef] [PubMed]
- Cao, K.; Wei, C.; Gaidon, A.; Arechiga, N.; Ma, T. Learning imbalanced datasets with label-distribution-aware margin loss. Adv. Neural Inf. Process. Syst. 2019, 32, 1567–1578. [Google Scholar]
- Menon, A.K.; Jayasumana, S.; Rawat, A.S.; Jain, H.; Veit, A.; Kumar, S. Long-tail learning via logit adjustment. In Proceedings of the International Conference on Learning Representations, Virtual, 4 May 2021. [Google Scholar]
- Fan, C.; Li, C.; Peng, Y.; Shen, Y.; Cao, G.; Li, S. Fault Diagnosis of Vibration Sensors Based on Triage Loss Function-Improved XGBoost. Electronics 2023, 12, 4442. [Google Scholar] [CrossRef]
- Guo, C.; Pleiss, G.; Sun, Y.; Weinberger, K.Q. On calibration of modern neural networks. In Proceedings of the International Conference on Machine Learning, Sydney, Australia, 6–11 August 2017; PMLR: Cambridge, MA, USA, 2017; pp. 1321–1330. [Google Scholar]
- Shuford, E.H., Jr.; Albert, A.; Edward Massengill, H. Admissible probability measurement procedures. Psychometrika 1966, 31, 125–145. [Google Scholar] [CrossRef] [PubMed]
- Buja, A.; Stuetzle, W.; Shen, Y. Loss functions for binary class probability estimation and classification: Structure and applications. Work. Draft. Novemb. 2005, 3, 13. [Google Scholar]
- Masnadi-Shirazi, H.; Vasconcelos, N. A view of margin losses as regularizers of probability estimates. J. Mach. Learn. Res. 2015, 16, 2751–2795. [Google Scholar]
- Błasiok, J.; Gopalan, P.; Hu, L.; Nakkiran, P. When does optimizing a proper loss yield calibration? In Proceedings of the 37th International Conference on Neural Information Processing Systems, New Orleans, LA, USA, 10–16 December 2023; pp. 72071–72095. [Google Scholar]
- Platt, J. Probabilistic outputs for support vector machines and comparisons to regularized likelihood methods. Adv. Large Margin Classif. 1999, 10, 61–74. [Google Scholar]
- Hinton, G.; Vinyals, O.; Dean, J. Distilling the knowledge in a neural network. arXiv 2015, arXiv:1503.02531. [Google Scholar]
- Zadrozny, B.; Elkan, C. Transforming classifier scores into accurate multiclass probability estimates. In Proceedings of the eighth ACM SIGKDD International Conference on Knowledge Discovery and Data Mining, Edmonton, AB, Canada, 23–26 July 2002; pp. 694–699. [Google Scholar]
- Kull, M.; Silva Filho, T.; Flach, P. Beta calibration: A well-founded and easily implemented improvement on logistic calibration for binary classifiers. In Proceedings of the Artificial Intelligence and Statistics, Fort Lauderdale, FL, USA, 20–22 April 2017; PMLR: Cambridge, MA, USA, 2017; pp. 623–631. [Google Scholar]
- Hickey, G.L.; Grant, S.W.; Caiado, C.; Kendall, S.; Dunning, J.; Poullis, M.; Buchan, I.; Bridgewater, B. Dynamic prediction modeling approaches for cardiac surgery. Circ. Cardiovasc. Qual. Outcomes 2013, 6, 649–658. [Google Scholar] [CrossRef] [PubMed]
- Ferri, C.; Hernández-Orallo, J.; Flach, P.A. Brier curves: A new cost-based visualisation of classifier performance. In Proceedings of the 28th International Conference on Machine Learning (ICML-11), Bellevue, WA, USA, 28 June–2 July 2011; pp. 585–592. [Google Scholar]
- Dimitriadis, T.; Gneiting, T.; Jordan, A.I. Stable reliability diagrams for probabilistic classifiers. Proc. Natl. Acad. Sci. USA 2021, 118, e2016191118. [Google Scholar] [CrossRef] [PubMed]
- Cheng, J.; Vasconcelos, N. Towards Calibrated Multi-label Deep Neural Networks. In Proceedings of the IEEE/CVF Conference on Computer Vision and Pattern Recognition, Seattle, WA, USA, 17–21 June 2024; pp. 27589–27599. [Google Scholar]
- Xia, Y.; Liu, C.; Li, Y.; Liu, N. A boosted decision tree approach using Bayesian hyper-parameter optimization for credit scoring. Expert Syst. Appl. 2017, 78, 225–241. [Google Scholar] [CrossRef]
- Hutter, F.; Hoos, H.H.; Leyton-Brown, K. Sequential model-based optimization for general algorithm configuration. In Proceedings of the Learning and Intelligent Optimization: 5th International Conference, LION 5, Rome, Italy, 17–21 January 2011; Selected Papers 5. Springer: Berlin/Heidelberg, Germany, 2011; pp. 507–523. [Google Scholar]
- Bergstra, J.; Bardenet, R.; Bengio, Y.; Kégl, B. Algorithms for hyper-parameter optimization. Adv. Neural Inf. Process. Syst. 2011, 24, 2546–2554. [Google Scholar]
- Jones, D.R.; Schonlau, M.; Welch, W.J. Efficient global optimization of expensive black-box functions. J. Glob. Optim. 1998, 13, 455–492. [Google Scholar] [CrossRef]
- Snoek, J.; Larochelle, H.; Adams, R.P. Practical bayesian optimization of machine learning algorithms. Adv. Neural Inf. Process. Syst. 2012, 25, 2951–2959. [Google Scholar]
- Friedman, J.H. Stochastic gradient boosting. Comput. Stat. Data Anal. 2002, 38, 367–378. [Google Scholar] [CrossRef]
- Chawla, N.V.; Bowyer, K.W.; Hall, L.O.; Kegelmeyer, W.P. SMOTE: Synthetic minority over-sampling technique. J. Artif. Intell. Res. 2002, 16, 321–357. [Google Scholar] [CrossRef]
- Collell, G.; Prelec, D.; Patil, K.R. A simple plug-in bagging ensemble based on threshold-moving for classifying binary and multiclass imbalanced data. Neurocomputing 2018, 275, 330–340. [Google Scholar] [CrossRef]
- Tarawneh, A.S.; Hassanat, A.B.; Altarawneh, G.A.; Almuhaimeed, A. Stop oversampling for class imbalance learning: A review. IEEE Access 2022, 10, 47643–47660. [Google Scholar] [CrossRef]
- Provost, F. Machine learning from imbalanced data sets 101. In Proceedings of the AAAI’2000 Workshop on Imbalanced Data Sets, Austin, TX, USA, 31 July 2000; AAAI Press: Washington, DC, USA, 2000; Volume 68, pp. 1–3. [Google Scholar]
- O’Brien, R.; Ishwaran, H. A random forests quantile classifier for class imbalanced data. Pattern Recognit. 2019, 90, 232–249. [Google Scholar] [CrossRef] [PubMed]
- Menon, A.; Narasimhan, H.; Agarwal, S.; Chawla, S. On the statistical consistency of algorithms for binary classification under class imbalance. In Proceedings of the International Conference on Machine Learning, Atlanta, GA, USA, 16–21 June 2013; PMLR: Cambridge, MA, USA, 2013; pp. 603–611. [Google Scholar]
- Mease, D.; Wyner, A.J.; Buja, A. Boosted classification trees and class probability/quantile estimation. J. Mach. Learn. Res. 2007, 8, 409–439. [Google Scholar]
- Lipton, Z.C.; Elkan, C.; Naryanaswamy, B. Optimal thresholding of classifiers to maximize F1 measure. In Proceedings of the Machine Learning and Knowledge Discovery in Databases: European Conference, ECML PKDD 2014, Nancy, France, 15–19 September 2014; Proceedings, Part II 14. Springer: Berlin/Heidelberg, Germany, 2014; pp. 225–239. [Google Scholar]
- Hand, D.J.; Anagnostopoulos, C. A better Beta for the H measure of classification performance. Pattern Recognit. Lett. 2014, 40, 41–46. [Google Scholar] [CrossRef]
- Merdan, S.; Barnett, C.L.; Denton, B.T.; Montie, J.E.; Miller, D.C. OR practice–Data analytics for optimal detection of metastatic prostate cancer. Oper. Res. 2021, 69, 774–794. [Google Scholar] [CrossRef]
- Leppke, S.; Leighton, T.; Zaun, D.; Chen, S.C.; Skeans, M.; Israni, A.K.; Snyder, J.J.; Kasiske, B.L. Scientific Registry of Transplant Recipients: Collecting, analyzing, and reporting data on transplantation in the United States. Transplant. Rev. 2013, 27, 50–56. [Google Scholar] [CrossRef]
- Shtraichman, O.; Ahya, V.N. Malignancy after lung transplantation. Ann. Transl. Med. 2020, 8, 416. [Google Scholar] [CrossRef]
- Cheng, J.; Moore, C.A.; Iasella, C.J.; Glanville, A.R.; Morrell, M.R.; Smith, R.B.; McDyer, J.F.; Ensor, C.R. Systematic review and meta-analysis of post-transplant lymphoproliferative disorder in lung transplant recipients. Clin. Transplant. 2018, 32, e13235. [Google Scholar] [CrossRef]
- Behavioral Risk Factor Surveillance System Survey Data. Atlanta, Georgia: U.S. Department of Health and Human Services, Centers for Disease Control and Prevention. Available online: https://www.cdc.gov/brfss/annual_data/annual_data.htm (accessed on 24 July 2024).
- Teboul, A. Diabetes Health Indicators Dataset. Version 1. Available online: https://www.kaggle.com/datasets/alexteboul/diabetes-health-indicators-dataset/data (accessed on 24 July 2024).
- Centers for Disease Control and Prevention, and Sohier Dane. Behavioral Risk Factor Surveillance System. Available online: https://www.kaggle.com/datasets/cdc/behavioral-risk-factor-surveillance-system (accessed on 24 July 2024).
- Pedregosa, F.; Varoquaux, G.; Gramfort, A.; Michel, V.; Thirion, B.; Grisel, O.; Blondel, M.; Prettenhofer, P.; Weiss, R.; Dubourg, V.; et al. Scikit-learn: Machine Learning in Python. J. Mach. Learn. Res. 2011, 12, 2825–2830. [Google Scholar]
- Mukhoti, J.; Kulharia, V.; Sanyal, A.; Golodetz, S.; Torr, P.; Dokania, P. Calibrating deep neural networks using focal loss. Adv. Neural Inf. Process. Syst. 2020, 33, 15288–15299. [Google Scholar]
- Reid, M.D.; Williamson, R.C. Composite binary losses. J. Mach. Learn. Res. 2010, 11, 2387–2422. [Google Scholar]
- Lu, Y.; Yu, X.; Hu, Z.; Wang, X. Convolutional neural network combined with reinforcement learning-based dual-mode grey wolf optimizer to identify crop diseases and pests. Swarm Evol. Comput. 2025, 94, 101874. [Google Scholar] [CrossRef]


| Model | 1-Year PTLD | 3-Year PTLD | 5-Year PTLD | 8-Year PTLD | 10-Year PTLD |
|---|---|---|---|---|---|
| AUROC | |||||
| LR | 0.743 ± 0.013 | 0.686 ± 0.017 | 0.653 ± 0.014 | 0.651 ± 0.013 | 0.674 ± 0.011 |
| LASSO LR | 0.739 ± 0.009 | 0.687 ± 0.016 | 0.654 ± 0.014 | 0.659 ± 0.015 | 0.676 ± 0.008 |
| Ridge LR | 0.736 ± 0.012 | 0.686 ± 0.016 | 0.653 ± 0.013 | 0.655 ± 0.014 | 0.677 ± 0.010 |
| LightGBM | 0.738 ± 0.014 | 0.695 ± 0.022 | 0.665 ± 0.011 | 0.676 ± 0.014 | 0.697 ± 0.010 |
| LightGBM-Focal | 0.742 ± 0.014 | 0.696 ± 0.018 | 0.666 ± 0.013 | 0.675 ± 0.014 | 0.697 ± 0.009 |
| LightGBM-Focal () | 0.742 ± 0.014 | 0.696 ± 0.018 | 0.666 ± 0.013 | 0.675 ± 0.014 | 0.697 ± 0.009 |
| LightGBM-Focal (Platt) | 0.742 ± 0.014 | 0.696 ± 0.018 | 0.666 ± 0.013 | 0.675 ± 0.014 | 0.697 ± 0.009 |
| LightGBM-Focal (Isotonic) | 0.739 ± 0.017 | 0.693 ± 0.020 | 0.664 ± 0.013 | 0.674 ± 0.014 | 0.695 ± 0.011 |
| XGBoost | 0.736 ± 0.017 | 0.701 ± 0.019 | 0.668 ± 0.017 | 0.678 ± 0.012 | 0.697 ± 0.009 |
| XGBoost-Focal | 0.755 ± 0.010 | 0.699 ± 0.015 | 0.668 ± 0.017 | 0.678 ± 0.012 | 0.700 ± 0.009 |
| XGBoost-Focal () | 0.755 ± 0.010 | 0.699 ± 0.015 | 0.668 ± 0.017 | 0.678 ± 0.012 | 0.700 ± 0.009 |
| XGBoost-Focal (Platt) | 0.755 ± 0.010 | 0.699 ± 0.015 | 0.668 ± 0.017 | 0.678 ± 0.012 | 0.700 ± 0.009 |
| XGBoost-Focal (Isotonic) | 0.752 ± 0.011 | 0.694 ± 0.014 | 0.662 ± 0.017 | 0.675 ± 0.011 | 0.698 ± 0.009 |
| H-measure | |||||
| LR | 0.241 ± 0.030 | 0.144 ± 0.020 | 0.114 ± 0.019 | 0.099 ± 0.014 | 0.133 ± 0.016 |
| LASSO LR | 0.247 ± 0.025 | 0.145 ± 0.025 | 0.114 ± 0.019 | 0.107 ± 0.014 | 0.134 ± 0.013 |
| Ridge LR | 0.236 ± 0.024 | 0.141 ± 0.025 | 0.112 ± 0.017 | 0.104 ± 0.014 | 0.137 ± 0.017 |
| LightGBM | 0.248 ± 0.023 | 0.154 ± 0.032 | 0.129 ± 0.012 | 0.134 ± 0.017 | 0.165 ± 0.019 |
| LightGBM-Focal | 0.254 ± 0.025 | 0.154 ± 0.029 | 0.132 ± 0.018 | 0.134 ± 0.017 | 0.163 ± 0.019 |
| LightGBM-Focal () | 0.254 ± 0.025 | 0.154 ± 0.029 | 0.132 ± 0.018 | 0.134 ± 0.017 | 0.163 ± 0.019 |
| LightGBM-Focal (Platt) | 0.254 ± 0.025 | 0.154 ± 0.029 | 0.132 ± 0.018 | 0.134 ± 0.017 | 0.163 ± 0.019 |
| LightGBM-Focal (Isotonic) | 0.241 ± 0.026 | 0.140 ± 0.031 | 0.120 ± 0.017 | 0.124 ± 0.015 | 0.153 ± 0.019 |
| XGBoost | 0.257 ± 0.029 | 0.162 ± 0.028 | 0.136 ± 0.017 | 0.133 ± 0.014 | 0.162 ± 0.017 |
| XGBoost-Focal | 0.271 ± 0.023 | 0.156 ± 0.021 | 0.136 ± 0.019 | 0.136 ± 0.014 | 0.168 ± 0.014 |
| XGBoost-Focal () | 0.271 ± 0.023 | 0.156 ± 0.021 | 0.136 ± 0.019 | 0.136 ± 0.014 | 0.168 ± 0.014 |
| XGBoost-Focal (Platt) | 0.271 ± 0.023 | 0.156 ± 0.021 | 0.136 ± 0.019 | 0.136 ± 0.014 | 0.168 ± 0.014 |
| XGBoost-Focal (Isotonic) | 0.257 ± 0.026 | 0.145 ± 0.021 | 0.123 ± 0.019 | 0.125 ± 0.013 | 0.156 ± 0.014 |
| Average precision | |||||
| LR | 0.054 ± 0.012 | 0.078 ± 0.010 | 0.117 ± 0.013 | 0.206 ± 0.008 | 0.331 ± 0.022 |
| LASSO LR | 0.054 ± 0.008 | 0.079 ± 0.011 | 0.115 ± 0.011 | 0.211 ± 0.008 | 0.335 ± 0.023 |
| Ridge LR | 0.051 ± 0.007 | 0.078 ± 0.010 | 0.116 ± 0.011 | 0.210 ± 0.010 | 0.339 ± 0.023 |
| LightGBM | 0.055 ± 0.012 | 0.086 ± 0.012 | 0.129 ± 0.010 | 0.244 ± 0.015 | 0.371 ± 0.028 |
| LightGBM-Focal | 0.059 ± 0.011 | 0.088 ± 0.015 | 0.131 ± 0.011 | 0.243 ± 0.014 | 0.369 ± 0.028 |
| LightGBM-Focal () | 0.059 ± 0.011 | 0.088 ± 0.015 | 0.131 ± 0.011 | 0.243 ± 0.014 | 0.369 ± 0.028 |
| LightGBM-Focal (Platt) | 0.059 ± 0.011 | 0.088 ± 0.015 | 0.131 ± 0.011 | 0.243 ± 0.014 | 0.369 ± 0.028 |
| LightGBM-Focal (Isotonic) | 0.049 ± 0.007 | 0.077 ± 0.012 | 0.119 ± 0.010 | 0.225 ± 0.013 | 0.348 ± 0.026 |
| XGBoost | 0.053 ± 0.008 | 0.090 ± 0.012 | 0.137 ± 0.013 | 0.242 ± 0.015 | 0.362 ± 0.023 |
| XGBoost-Focal | 0.060 ± 0.012 | 0.088 ± 0.011 | 0.136 ± 0.016 | 0.246 ± 0.015 | 0.369 ± 0.020 |
| XGBoost-Focal () | 0.060 ± 0.012 | 0.088 ± 0.011 | 0.136 ± 0.016 | 0.246 ± 0.015 | 0.369 ± 0.020 |
| XGBoost-Focal (Platt) | 0.060 ± 0.012 | 0.088 ± 0.011 | 0.136 ± 0.016 | 0.246 ± 0.015 | 0.369 ± 0.020 |
| XGBoost-Focal (Isotonic) | 0.051 ± 0.006 | 0.079 ± 0.009 | 0.123 ± 0.014 | 0.227 ± 0.011 | 0.346 ± 0.015 |
| Model | 1-Year PTLD | 3-Year PTLD | 5-Year PTLD | 8-Year PTLD | 10-Year PTLD |
|---|---|---|---|---|---|
| Brier score | |||||
| LR | 0.0111 ± 0.0001 | 0.0279 ± 0.0002 | 0.0482 ± 0.0004 | 0.0939 ± 0.0007 | 0.1317 ± 0.0020 |
| LASSO LR | 0.0111 ± 0.0001 | 0.0278 ± 0.0002 | 0.0481 ± 0.0003 | 0.0932 ± 0.0005 | 0.1309 ± 0.0017 |
| Ridge LR | 0.0111 ± 0.0000 | 0.0279 ± 0.0002 | 0.0481 ± 0.0003 | 0.0932 ± 0.0006 | 0.1306 ± 0.0017 |
| LightGBM | 0.0111 ± 0.0000 | 0.0277 ± 0.0002 | 0.0477 ± 0.0002 | 0.0915 ± 0.0008 | 0.1279 ± 0.0022 |
| LightGBM-Focal | 0.0131 ± 0.0026 | 0.0346 ± 0.0071 | 0.0611 ± 0.0107 | 0.0989 ± 0.0073 | 0.1353 ± 0.0105 |
| LightGBM-Focal () | 0.0111 ± 0.0000 | 0.0277 ± 0.0002 | 0.0477 ± 0.0003 | 0.0915 ± 0.0008 | 0.1279 ± 0.0022 |
| LightGBM-Focal (Platt) | 0.0111 ± 0.0000 | 0.0277 ± 0.0003 | 0.0477 ± 0.0003 | 0.0915 ± 0.0008 | 0.1280 ± 0.0023 |
| LightGBM-Focal (Isotonic) | 0.0111 ± 0.0000 | 0.0279 ± 0.0003 | 0.0478 ± 0.0004 | 0.0917 ± 0.0011 | 0.1282 ± 0.0028 |
| XGBoost | 0.0111 ± 0.0000 | 0.0277 ± 0.0002 | 0.0476 ± 0.0002 | 0.0916 ± 0.0007 | 0.1285 ± 0.0017 |
| XGBoost-Focal | 0.0242 ± 0.0113 | 0.0460 ± 0.0182 | 0.0749 ± 0.0155 | 0.1082 ± 0.0141 | 0.1400 ± 0.0117 |
| XGBoost-Focal () | 0.0110 ± 0.0001 | 0.0277 ± 0.0001 | 0.0476 ± 0.0003 | 0.0914 ± 0.0007 | 0.1278 ± 0.0015 |
| XGBoost-Focal (Platt) | 0.0110 ± 0.0001 | 0.0277 ± 0.0001 | 0.0476 ± 0.0004 | 0.0913 ± 0.0008 | 0.1278 ± 0.0016 |
| XGBoost-Focal (Isotonic) | 0.0111 ± 0.0000 | 0.0278 ± 0.0002 | 0.0477 ± 0.0005 | 0.0917 ± 0.0009 | 0.1282 ± 0.0018 |
| Model | Threshold | 1-Year PTLD | 3-Year PTLD | 5-Year PTLD | 8-Year PTLD | 10-Year PTLD |
|---|---|---|---|---|---|---|
| Sensitivity | ||||||
| LR | Prevalence | 0.608 ± 0.034 | 0.543 ± 0.038 | 0.539 ± 0.034 | 0.558 ± 0.035 | 0.578 ± 0.029 |
| LASSO LR | Prevalence | 0.597 ± 0.033 | 0.544 ± 0.036 | 0.512 ± 0.040 | 0.572 ± 0.035 | 0.591 ± 0.013 |
| Ridge LR | Prevalence | 0.606 ± 0.042 | 0.558 ± 0.034 | 0.543 ± 0.038 | 0.579 ± 0.034 | 0.595 ± 0.026 |
| LightGBM | Prevalence | 0.602 ± 0.033 | 0.550 ± 0.058 | 0.543 ± 0.021 | 0.584 ± 0.033 | 0.602 ± 0.021 |
| LightGBM-Focal | Optimized | 0.561 ± 0.039 | 0.512 ± 0.058 | 0.482 ± 0.047 | 0.540 ± 0.037 | 0.589 ± 0.038 |
| LightGBM-Focal () | Prevalence | 0.606 ± 0.039 | 0.545 ± 0.055 | 0.531 ± 0.035 | 0.578 ± 0.032 | 0.596 ± 0.021 |
| LightGBM-Focal (Platt) | Prevalence | 0.618 ± 0.041 | 0.554 ± 0.068 | 0.544 ± 0.032 | 0.586 ± 0.032 | 0.602 ± 0.022 |
| LightGBM-Focal (Isotonic) | Prevalence | 0.568 ± 0.037 | 0.531 ± 0.050 | 0.523 ± 0.042 | 0.531 ± 0.078 | 0.586 ± 0.059 |
| XGBoost | Prevalence | 0.575 ± 0.051 | 0.561 ± 0.059 | 0.543 ± 0.042 | 0.598 ± 0.029 | 0.611 ± 0.021 |
| XGBoost-Focal | Optimized | 0.576 ± 0.040 | 0.526 ± 0.031 | 0.499 ± 0.049 | 0.561 ± 0.039 | 0.576 ± 0.044 |
| XGBoost-Focal () | Prevalence | 0.631 ± 0.039 | 0.556 ± 0.054 | 0.539 ± 0.042 | 0.572 ± 0.027 | 0.589 ± 0.017 |
| XGBoost-Focal (Platt) | Prevalence | 0.629 ± 0.042 | 0.573 ± 0.058 | 0.532 ± 0.056 | 0.580 ± 0.029 | 0.602 ± 0.023 |
| XGBoost-Focal (Isotonic) | Prevalence | 0.608 ± 0.047 | 0.516 ± 0.055 | 0.516 ± 0.055 | 0.584 ± 0.047 | 0.573 ± 0.067 |
| Specificity | ||||||
| LR | Prevalence | 0.762 ± 0.005 | 0.720 ± 0.013 | 0.697 ± 0.012 | 0.666 ± 0.015 | 0.668 ± 0.012 |
| LASSO LR | Prevalence | 0.768 ± 0.010 | 0.726 ± 0.019 | 0.713 ± 0.018 | 0.669 ± 0.012 | 0.662 ± 0.012 |
| Ridge LR | Prevalence | 0.737 ± 0.014 | 0.707 ± 0.017 | 0.682 ± 0.016 | 0.651 ± 0.015 | 0.655 ± 0.015 |
| LightGBM | Prevalence | 0.774 ± 0.015 | 0.730 ± 0.020 | 0.698 ± 0.009 | 0.666 ± 0.021 | 0.682 ± 0.018 |
| LightGBM-Focal | Optimized | 0.815 ± 0.021 | 0.763 ± 0.042 | 0.760 ± 0.041 | 0.708 ± 0.034 | 0.692 ± 0.038 |
| LightGBM-Focal () | Prevalence | 0.768 ± 0.016 | 0.736 ± 0.024 | 0.712 ± 0.017 | 0.671 ± 0.016 | 0.689 ± 0.017 |
| LightGBM-Focal (Platt) | Prevalence | 0.757 ± 0.018 | 0.729 ± 0.031 | 0.700 ± 0.014 | 0.662 ± 0.017 | 0.681 ± 0.019 |
| LightGBM-Focal (Isotonic) | Prevalence | 0.799 ± 0.047 | 0.748 ± 0.033 | 0.716 ± 0.038 | 0.714 ± 0.065 | 0.694 ± 0.063 |
| XGBoost | Prevalence | 0.788 ± 0.043 | 0.733 ± 0.024 | 0.693 ± 0.013 | 0.657 ± 0.019 | 0.672 ± 0.013 |
| XGBoost-Focal | Optimized | 0.818 ± 0.040 | 0.762 ± 0.024 | 0.750 ± 0.035 | 0.691 ± 0.027 | 0.716 ± 0.038 |
| XGBoost-Focal () | Prevalence | 0.759 ± 0.025 | 0.735 ± 0.017 | 0.701 ± 0.018 | 0.680 ± 0.018 | 0.700 ± 0.017 |
| XGBoost-Focal (Platt) | Prevalence | 0.767 ± 0.031 | 0.717 ± 0.034 | 0.711 ± 0.033 | 0.671 ± 0.015 | 0.685 ± 0.024 |
| XGBoost-Focal (Isotonic) | Prevalence | 0.791 ± 0.026 | 0.769 ± 0.056 | 0.724 ± 0.050 | 0.662 ± 0.048 | 0.710 ± 0.069 |
| Balanced accuracy | ||||||
| LR | Prevalence | 0.685 ± 0.017 | 0.632 ± 0.015 | 0.618 ± 0.016 | 0.612 ± 0.015 | 0.623 ± 0.013 |
| LASSO LR | Prevalence | 0.682 ± 0.017 | 0.635 ± 0.013 | 0.613 ± 0.017 | 0.621 ± 0.016 | 0.627 ± 0.006 |
| Ridge LR | Prevalence | 0.672 ± 0.021 | 0.633 ± 0.013 | 0.612 ± 0.016 | 0.615 ± 0.016 | 0.625 ± 0.009 |
| LightGBM | Prevalence | 0.688 ± 0.017 | 0.640 ± 0.024 | 0.621 ± 0.012 | 0.625 ± 0.013 | 0.642 ± 0.009 |
| LightGBM-Focal | Optimized | 0.688 ± 0.018 | 0.638 ± 0.019 | 0.621 ± 0.016 | 0.624 ± 0.012 | 0.640 ± 0.012 |
| LightGBM-Focal () | Prevalence | 0.687 ± 0.020 | 0.641 ± 0.019 | 0.622 ± 0.016 | 0.624 ± 0.013 | 0.643 ± 0.010 |
| LightGBM-Focal (Platt) | Prevalence | 0.688 ± 0.021 | 0.642 ± 0.021 | 0.622 ± 0.017 | 0.624 ± 0.013 | 0.641 ± 0.010 |
| LightGBM-Focal (Isotonic) | Prevalence | 0.683 ± 0.022 | 0.639 ± 0.018 | 0.619 ± 0.014 | 0.623 ± 0.012 | 0.640 ± 0.012 |
| XGBoost | Prevalence | 0.681 ± 0.012 | 0.647 ± 0.024 | 0.618 ± 0.020 | 0.628 ± 0.011 | 0.641 ± 0.010 |
| XGBoost-Focal | Optimized | 0.697 ± 0.014 | 0.644 ± 0.018 | 0.625 ± 0.017 | 0.626 ± 0.013 | 0.646 ± 0.013 |
| XGBoost-Focal () | Prevalence | 0.695 ± 0.014 | 0.645 ± 0.021 | 0.620 ± 0.020 | 0.626 ± 0.012 | 0.645 ± 0.010 |
| XGBoost-Focal (Platt) | Prevalence | 0.698 ± 0.014 | 0.645 ± 0.020 | 0.622 ± 0.019 | 0.625 ± 0.012 | 0.643 ± 0.013 |
| XGBoost-Focal (Isotonic) | Prevalence | 0.699 ± 0.015 | 0.642 ± 0.018 | 0.620 ± 0.019 | 0.623 ± 0.011 | 0.642 ± 0.011 |
| Model | AUROC | H-Measure | Average Precision | Brier Score |
|---|---|---|---|---|
| LR | 0.811 | 0.291 | 0.420 | 0.1069 |
| LASSO LR | 0.811 | 0.291 | 0.420 | 0.1069 |
| Ridge LR | 0.811 | 0.291 | 0.420 | 0.1069 |
| LightGBM | 0.817 | 0.303 | 0.441 | 0.1052 |
| LightGBM-Focal | 0.817 | 0.303 | 0.440 | 0.1172 |
| LightGBM-Focal () | 0.817 | 0.303 | 0.440 | 0.1053 |
| LightGBM-Focal (Platt) | 0.817 | 0.303 | 0.440 | 0.1053 |
| LightGBM-Focal (Isotonic) | 0.817 | 0.301 | 0.434 | 0.1053 |
| XGBoost | 0.817 | 0.304 | 0.441 | 0.1052 |
| XGBoost-Focal | 0.818 | 0.304 | 0.442 | 0.1168 |
| XGBoost-Focal () | 0.818 | 0.304 | 0.442 | 0.1052 |
| XGBoost-Focal (Platt) | 0.818 | 0.304 | 0.442 | 0.1052 |
| XGBoost-Focal (Isotonic) | 0.817 | 0.303 | 0.435 | 0.1052 |
Disclaimer/Publisher’s Note: The statements, opinions and data contained in all publications are solely those of the individual author(s) and contributor(s) and not of MDPI and/or the editor(s). MDPI and/or the editor(s) disclaim responsibility for any injury to people or property resulting from any ideas, methods, instructions or products referred to in the content. |
© 2025 by the authors. Licensee MDPI, Basel, Switzerland. This article is an open access article distributed under the terms and conditions of the Creative Commons Attribution (CC BY) license (https://creativecommons.org/licenses/by/4.0/).
Share and Cite
Johnston, H.; Nair, N.; Du, D. Estimating Calibrated Risks Using Focal Loss and Gradient-Boosted Trees for Clinical Risk Prediction. Electronics 2025, 14, 1838. https://doi.org/10.3390/electronics14091838
Johnston H, Nair N, Du D. Estimating Calibrated Risks Using Focal Loss and Gradient-Boosted Trees for Clinical Risk Prediction. Electronics. 2025; 14(9):1838. https://doi.org/10.3390/electronics14091838
Chicago/Turabian StyleJohnston, Henry, Nandini Nair, and Dongping Du. 2025. "Estimating Calibrated Risks Using Focal Loss and Gradient-Boosted Trees for Clinical Risk Prediction" Electronics 14, no. 9: 1838. https://doi.org/10.3390/electronics14091838
APA StyleJohnston, H., Nair, N., & Du, D. (2025). Estimating Calibrated Risks Using Focal Loss and Gradient-Boosted Trees for Clinical Risk Prediction. Electronics, 14(9), 1838. https://doi.org/10.3390/electronics14091838