
A High-Accuracy Advanced Persistent Threat Detection Model: Integrating Convolutional Neural Networks with Kepler-Optimized Bidirectional Gated Recurrent Units


Abstract
1. Introduction
- We introduce a novel model, CNN-KOA-BiGRU, specifically designed for APT attack detection, integrating CNN, the Kepler Optimization Algorithm, and BiGRU. To the best of our knowledge, this is the first attempt in the APT detection scenario.
- Considering the training bias caused by the imbalance of the APT attack sample dataset, we addressed the data imbalance issue using a combined sampling method that integrates SMOTE and Tomek Links. SMOTE synthesizes new samples for the minority class, while Tomek Links remove overlapping data points between classes. This approach, which may include techniques such as SMOTE and Tomek Links, enhances class separation and results in a more balanced dataset.
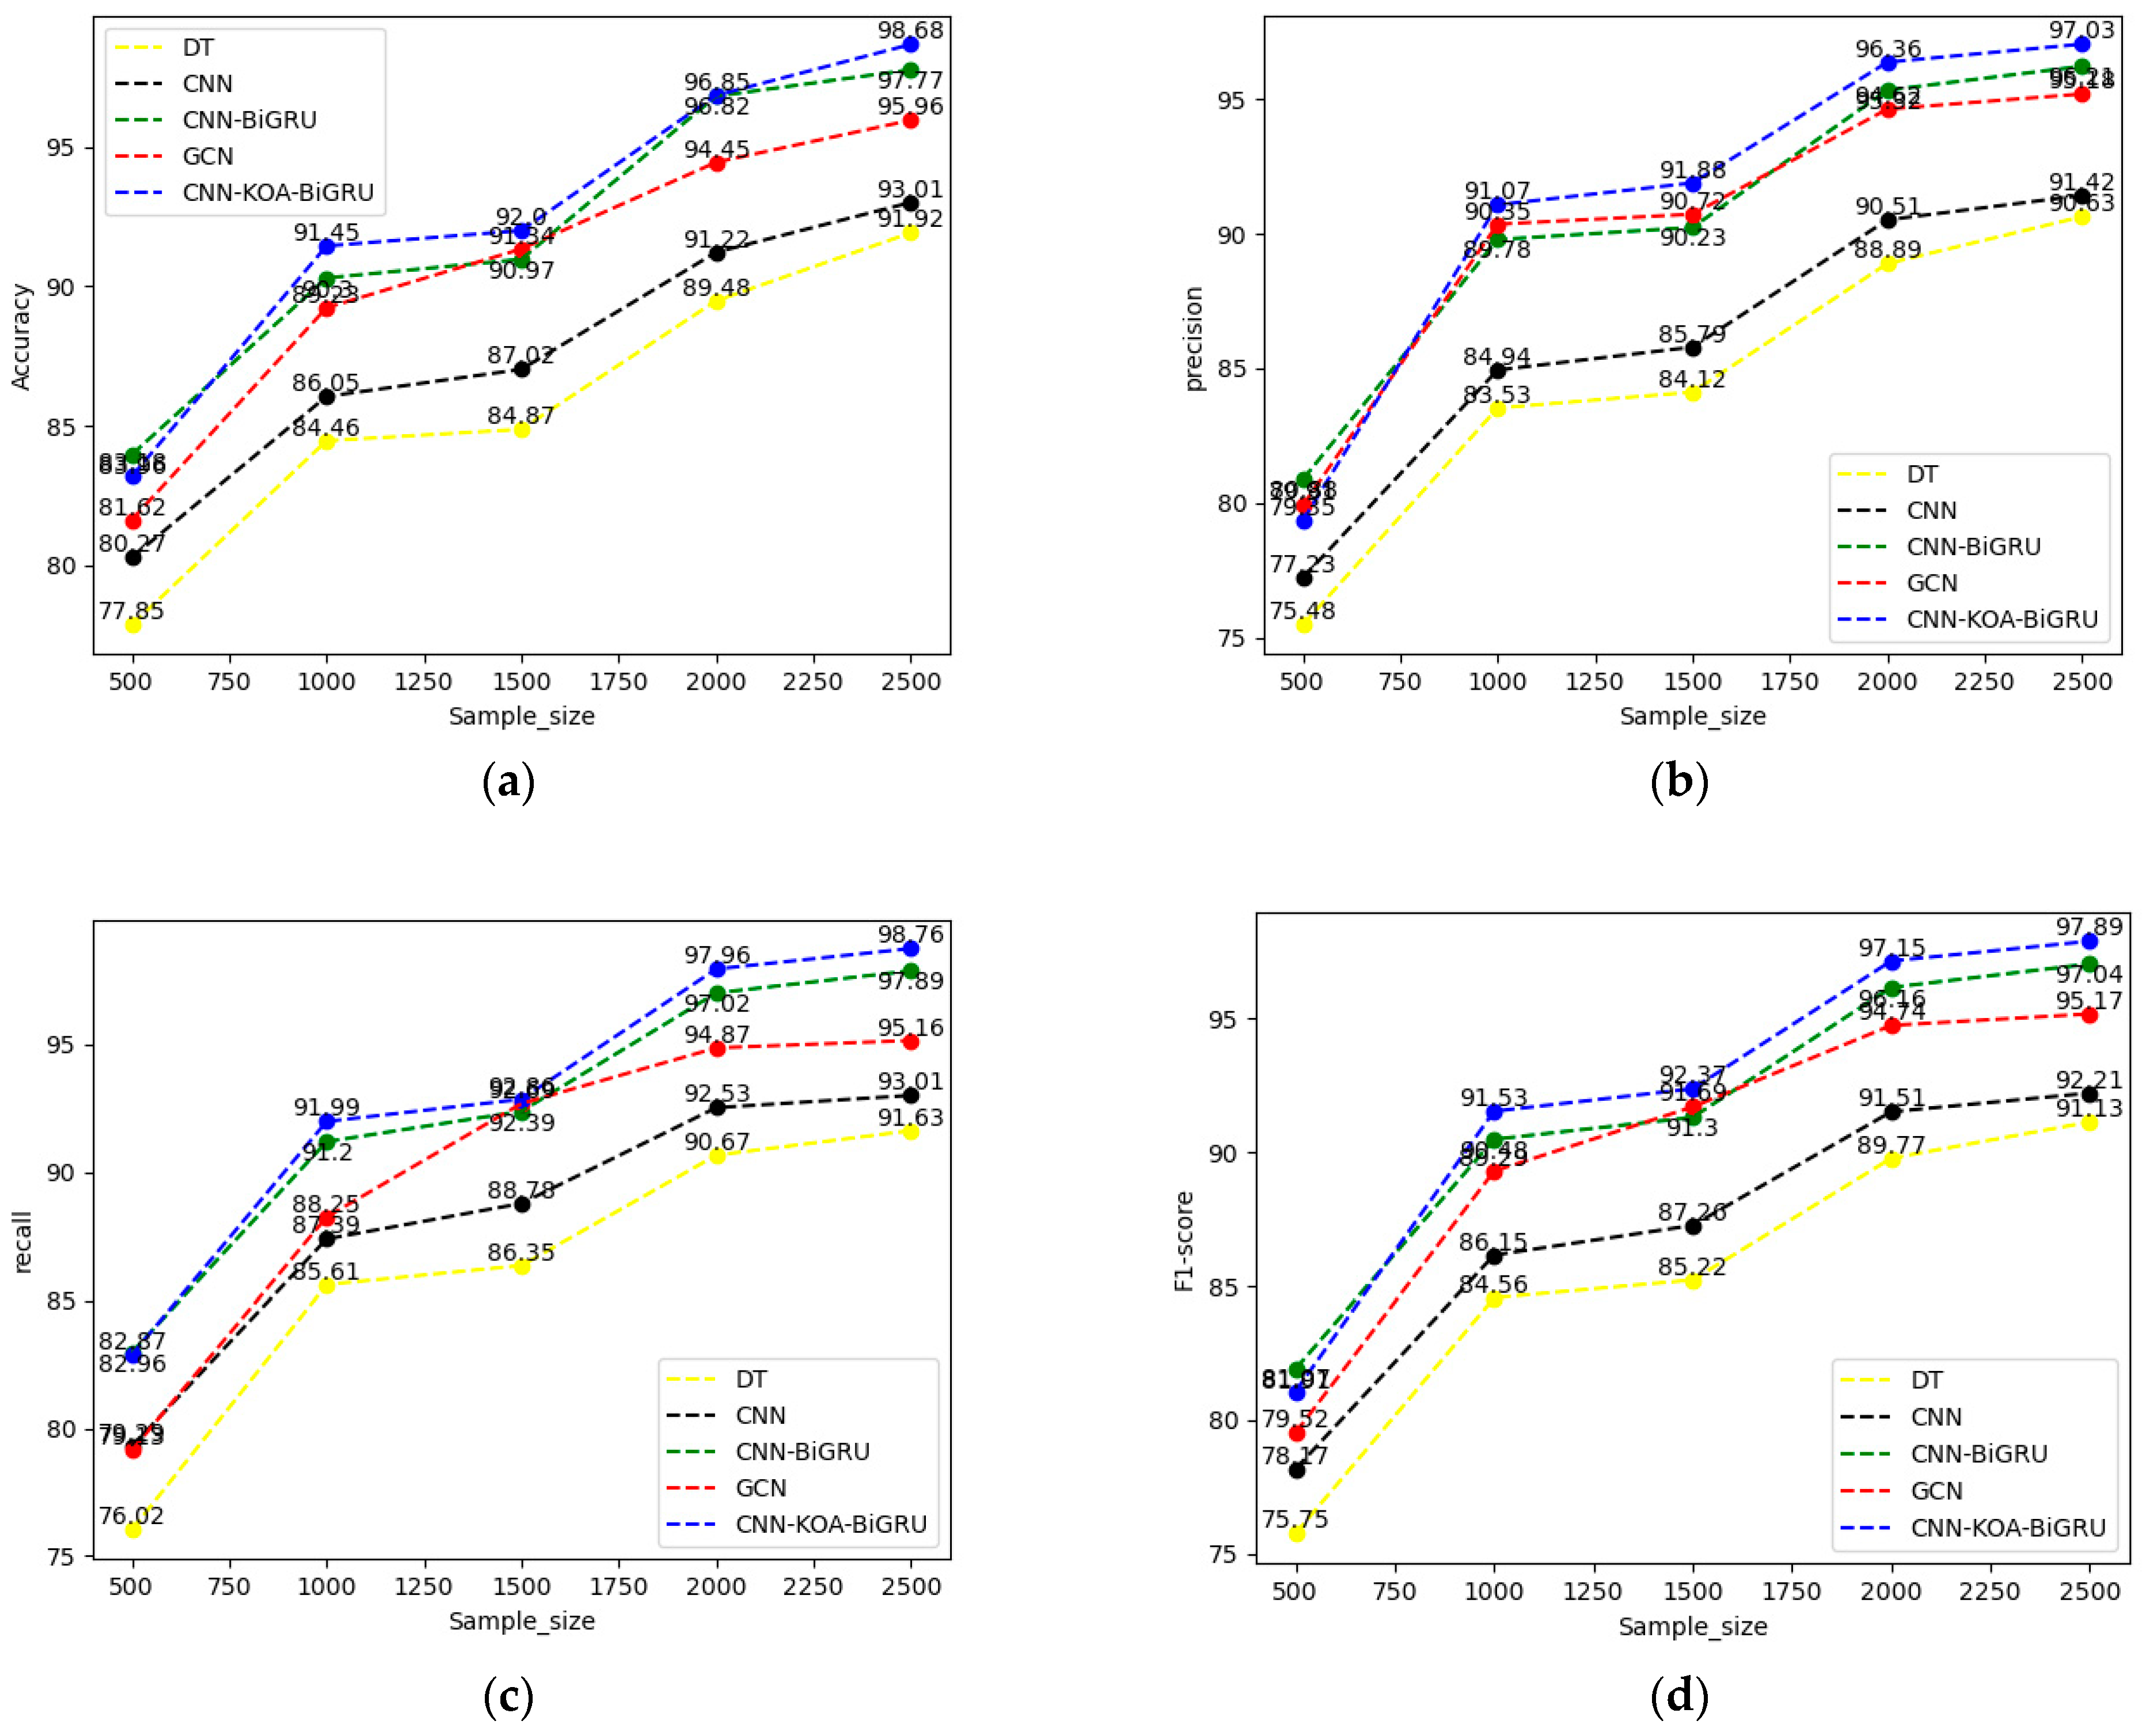
- We evaluate our model in CSE-CIC-IDS2018 datasets and compare it with the state-of-the-art solutions. Experimental data shows that the proposed scheme achieves an average accuracy of 98.68%. This performance surpasses all existing methods, achieving an accuracy improvement of 5.67% compared to CNN, 0.91% compared to CNN-BiGRU, and 2.72% compared to GCN.
2. Related Work
2.1. Rule-Based Detection Methods
2.2. Machine Learning-Based Detection Methods
2.3. Deep Learning-Based Detection Methods
3. Methodology
3.1. Model Overview
- Data preparation and preprocessing stage: The raw network traffic data undergoes the data preparation and pre-processing stage using SMOTE-Tomek technology to address class imbalance. SMOTE-Tomek technology is used to balance the number of normal traffic samples and APT attack samples in the training data, ensuring that the model can learn different types of data in a balanced manner during the training process. The balanced network traffic data are then input into the feature extraction stage.
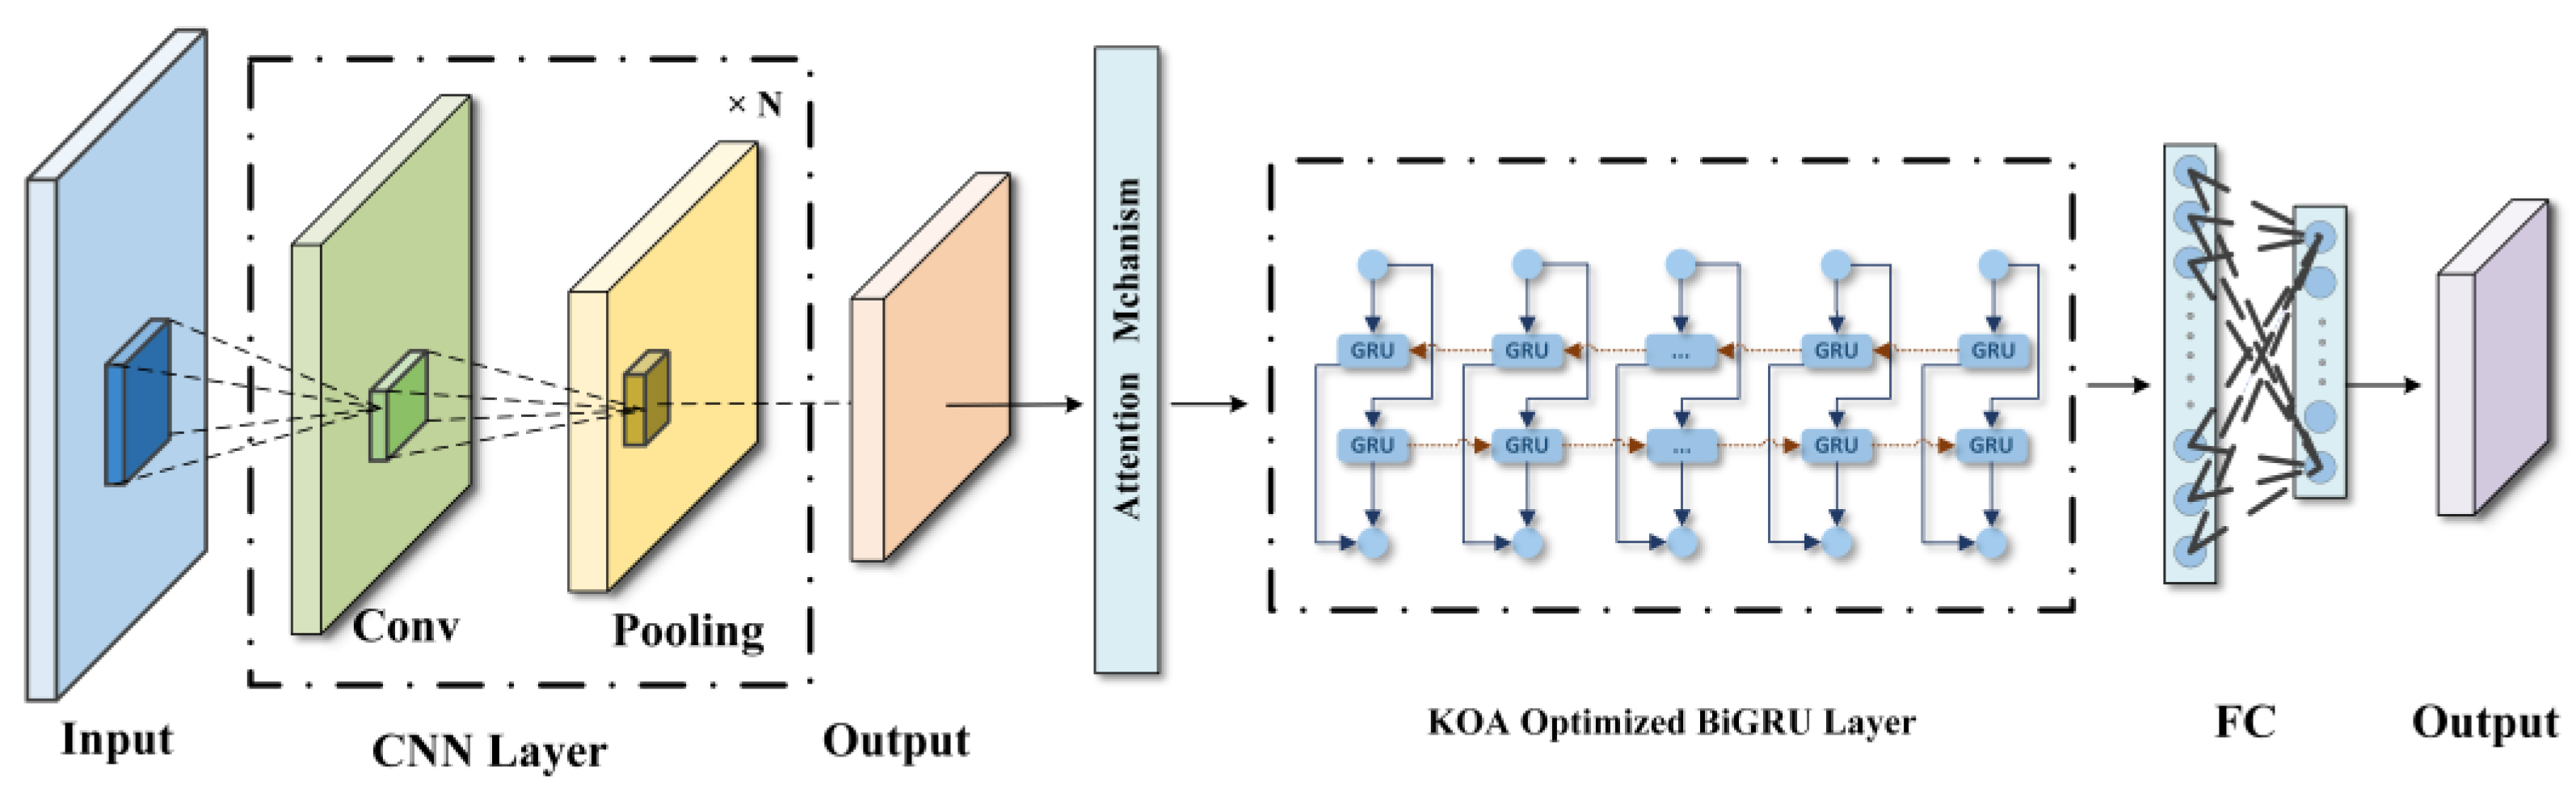
- Feature extraction stage: The balanced network traffic data are used as input and features are extracted using the CNN-KOA-BiGRU model. First, the data passes through the CNN layer, which extracts local features in the network traffic data through convolutional and pooling layers. Then, the extracted feature vectors are fed into BiGRU, which is used for contextual modeling of the features extracted by CNN and for capturing temporal dependencies and long-term memory in the data. Finally, the KOA intelligent optimization algorithm is employed to optimize the weights of the BiGRU layer, it adjusts the fitness of the weights via computation and iterative updates, aiming to identify the global optimum, thereby enhancing the model’s recognition accuracy.
- Attack classification stage: The optimized feature vectors are used as input, compared with labeled APT attack feature vectors, and iteratively trained until the model converges. The feature vectors are input to the fully connected layer, using appropriate activation functions for output prediction, accurately classifying the input network traffic data as normal traffic or APT attacks.
3.2. Data Preprocessing
3.3. Feature Extraction
3.3.1. CNN Layer
3.3.2. Attention Layer
3.3.3. KOA-Optimized BiGRU Layer
- (a)
- BiGRU
- (b)
- KOA intelligent optimization algorithm
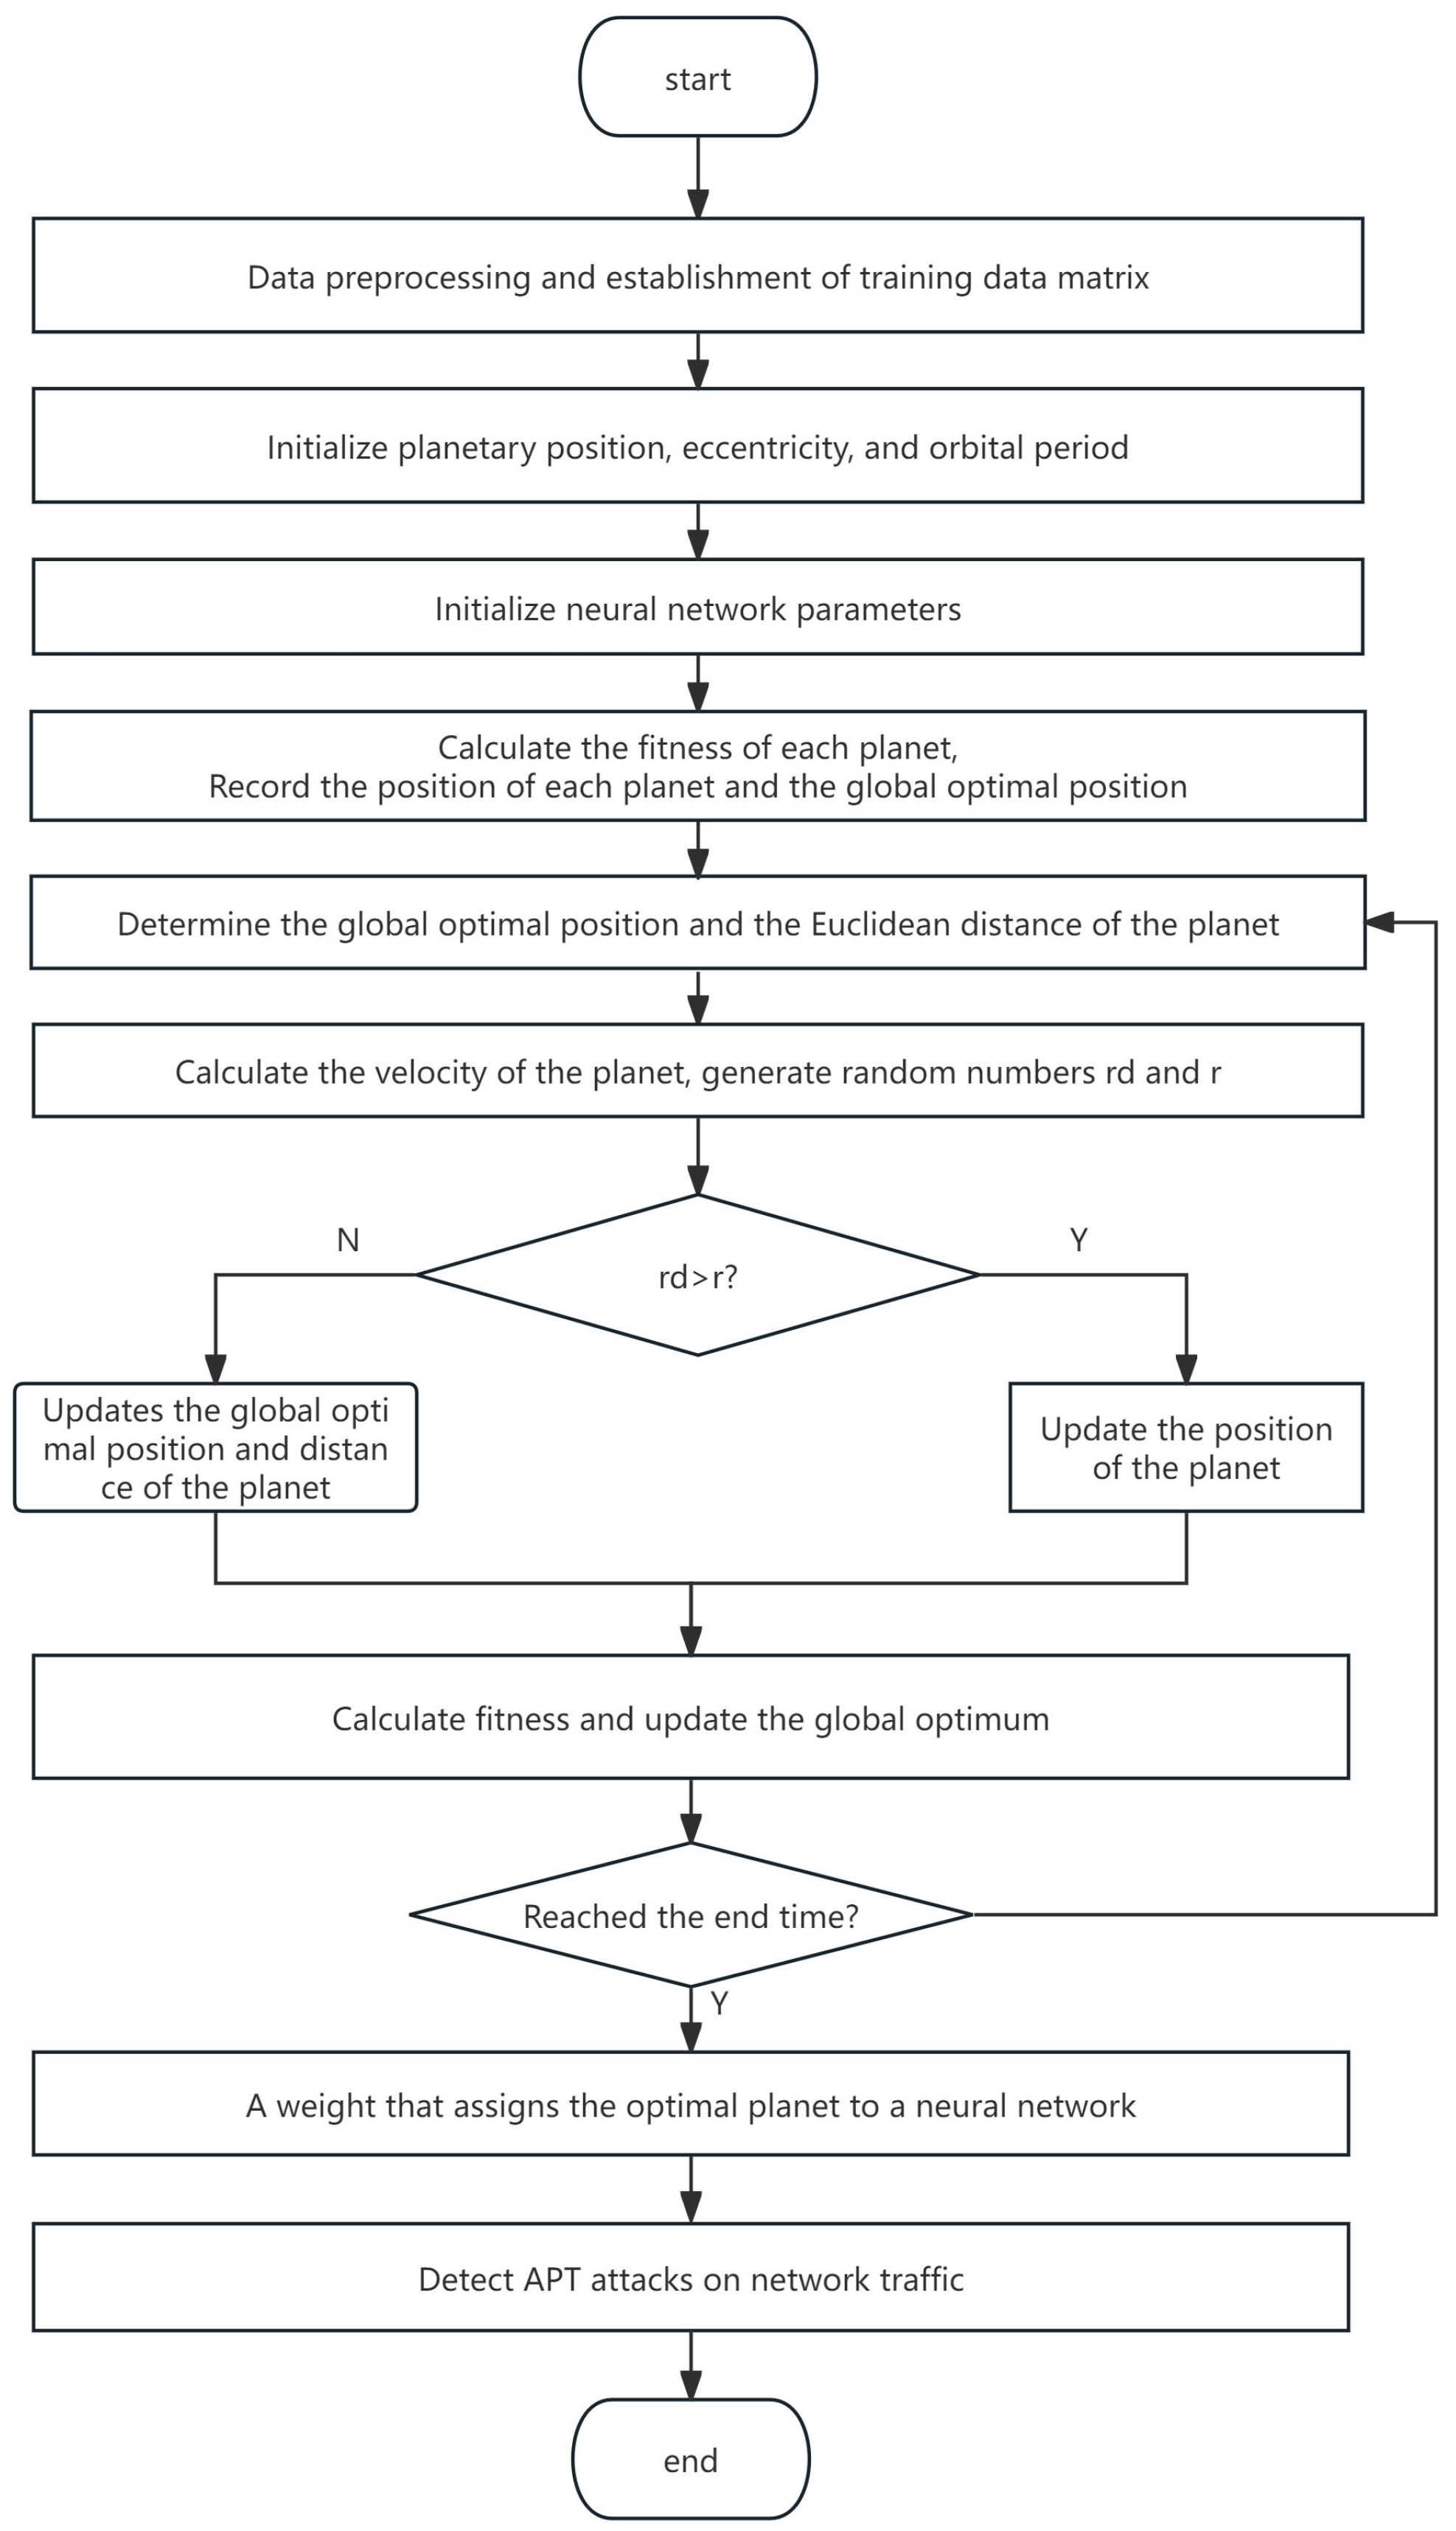
- 1.
- Initialize the planet population: First, construct a vector of size 1 × n, where n represents the number of planet populations, that is, the dimension of the network traffic data. For a network traffic data dimension of 70, a vector of size 1 × 70 can be constructed. Then, combine multiple vectors into a vector matrix P to complete the initialization.
- 2.
- Calculate the fitness value of the planet: We calculate the fitness value f(pi) for each planet and record each planet and its global optimal position. The fitness function f(p) can be defined as the loss function of the BiGRU model. Then, determine the Euclidean distance r between the global optimal position Pbest and the planet.
- 3.
- Iterative Update: The iteration terminates when most planets have updated their positions and their fitness criteria have met the termination condition. At this juncture, the obtained weight constitutes the optimal solution sought.
3.4. Classification
4. Evaluation
4.1. Datasets
4.2. Metrics
4.3. Parameter Experiments
4.4. Comparative Experiments
5. Conclusions
Author Contributions
Funding
Data Availability Statement
Conflicts of Interest
References
- Alshamrani, A.; Myneni, S.; Chowdhary, A.; Huang, D. A Survey on Advanced Persistent Threats: Techniques, Solutions, Challenges, and Research Opportunities. IEEE Commun. Surv. Tutor. 2019, 21, 1851–1877. [Google Scholar] [CrossRef]
- Megherbi, W.; Kiouche, A.E.; Haddad, M.; Seba, H. Detection of advanced persistent threats using hashing and graph-based learning on streaming data. Appl. Intell. 2024, 54, 5879–5890. [Google Scholar] [CrossRef]
- Gharehchopogh, F.S. An Improved Harris Hawks Optimization Algorithm with Multi-Strategy for Community Detection in Social Network. J. Bionic Eng. 2023, 20, 1175–1197. [Google Scholar] [CrossRef]
- CGTN. NSA-Affiliated Staff Behind Chinese University Cyberattack Identified: New Evidence. Available online: https://news.cgtn.com/news/2023-09-14/NSA-affiliated-staff-behind-Chinese-university-cyberattack-identified-1n5Et3TjCzS/index.html (accessed on 24 April 2025).
- Qi’anxin Group. APT Threat in Mid-Term of 2023. Available online: https://www.qianxin.com/threat/reportdetail?report_id=295 (accessed on 24 April 2025).
- Li, L.; Chen, W. ConGraph: Advanced Persistent Threat Detection Method Based on Provenance Graph Combined with Process Context in Cyber-Physical System Environment. Electronics 2024, 13, 945. [Google Scholar] [CrossRef]
- Yang, L.-X.; Li, P.; Yang, X.; Tang, Y.Y. A Risk Management Approach to Defending Against the Advanced Persistent Threat. IEEE Trans. Dependable Secur. Comput. 2020, 17, 1163–1172. [Google Scholar] [CrossRef]
- Zimba, A.; Chen, H.; Wang, Z. Bayesian network based weighted APT attack paths modeling in cloud computing. Future Gener. Comput. Syst. 2019, 96, 525–537. [Google Scholar] [CrossRef]
- Khoury, J.; Klisura, Đ.; Zanddizari, H.; De La Torre Parra, G.; Najafirad, P.; Bou-Harb, E. Jbeil: Temporal Graph-Based Inductive Learning to Infer Lateral Movement in Evolving Enterprise Networks. In Proceedings of the 2024 IEEE Symposium on Security and Privacy (SP), San Francisco, CA, USA, 19–23 May 2024; pp. 3644–3660. [Google Scholar] [CrossRef]
- Eke, H.N.; Petrovski, A. Advanced Persistent Threats Detection based on Deep Learning Approach. In Proceedings of the 2023 IEEE 6th International Conference on Industrial Cyber-Physical Systems (ICPS), Wuhan, China, 8–11 May 2023; pp. 1–10. [Google Scholar] [CrossRef]
- Abdel-Basset, M.; Mohamed, R.; Azeem, S.A.A.; Jameel, M.; Abouhawwash, M. Kepler optimization algorithm: A new metaheuristic algorithm inspired by Kepler’s laws of planetary motion. Knowl.-Based Syst. 2023, 268, 110454. [Google Scholar] [CrossRef]
- Liu, Y.; Zhang, M.; Li, D.; Jee, K.; Li, Z.; Wu, Z.; Rhee, J.; Mittal, P. Towards a Timely Causality Analysis for Enterprise Security. In Proceedings of the 25th Annual Network and Distributed System Security Symposium, NDSS 2018. The Internet Society, San Diego, CA, USA, 18–21 February 2018. [Google Scholar] [CrossRef]
- Hossain, M.N.; Milajerdi, S.M.; Wang, J.; Eshete, B.; Gjomemo, R.; Sekar, R.; Stoller, S.; Venkatakrishnan, V.N. SLEUTH: Real-time Attack Scenario Reconstruction from COTS Audit Data. arXiv 2018, arXiv:1801.02062. [Google Scholar]
- Milajerdi, S.M.; Gjomemo, R.; Eshete, B.; Sekar, R.; Venkatakrishnan, V.N. HOLMES: Real-Time APT Detection through Correlation of Suspicious Information Flows. In Proceedings of the 2019 IEEE Symposium on Security and Privacy (SP), San Francisco, CA, USA, 19–23 May 2019; pp. 1137–1152. [Google Scholar] [CrossRef]
- Xuan, S.; Liu, G.; Li, Z.; Zheng, L.; Wang, S.; Jiang, C. Random forest for credit card fraud detection. In Proceedings of the 2018 IEEE 15th International Conference on Networking, Sensing and Control (ICNSC), Zhuhai, China, 27–29 March 2018; pp. 1–6. [Google Scholar] [CrossRef]
- Do Xuan, C.; Cuong, N.H. A novel approach for APT attack detection based on feature intelligent extraction and representation learning. PLoS ONE 2024, 19, e0305618. [Google Scholar] [CrossRef] [PubMed]
- Abdallah, E.E.; Eleisah, W.; Otoom, A.F. Intrusion Detection Systems using Supervised Machine Learning Techniques: A survey. Procedia Comput. Sci. 2022, 201, 205–212. [Google Scholar] [CrossRef]
- Azizjon, M.; Jumabek, A.; Kim, W. 1D CNN based network intrusion detection with normalization on imbalanced data. In Proceedings of the 2020 International Conference on Artificial Intelligence in Information and Communication (ICAIIC), Fukuoka, Japan, 19–21 February 2020; pp. 218–224. [Google Scholar] [CrossRef]
- Mutalib, N.H.A.; Sabri, A.Q.M.; Wahab, A.W.A.; Abdullah, E.R.M.F.; AlDahoul, N. Explainable deep learning approach for advanced persistent threats (APTs) detection in cybersecurity: A review. Artif. Intell. Rev. 2024, 57, 297. [Google Scholar] [CrossRef]
- Gamage, S.; Samarabandu, J. Deep learning methods in network intrusion detection: A survey and an objective comparison. J. Netw. Comput. Appl. 2020, 169, 102767. [Google Scholar] [CrossRef]
- Zhao, R.; Mu, Y.; Zou, L.; Wen, X. A Hybrid Intrusion Detection System Based on Feature Selection and Weighted Stacking Classifier. IEEE Access 2022, 10, 71414–71426. [Google Scholar] [CrossRef]
- Do Xuan, C.; Dao, M.H. A novel approach for APT attack detection based on combined deep learning model. Neural Comput. Appl. 2021, 33, 13251–13264. [Google Scholar] [CrossRef]
- Canadian Institute for Cybersecurity (CIC). CSE-CIC-IDS2018 on AWS. Available online: https://www.unb.ca/cic/datasets/ids-2018.html (accessed on 24 April 2025).
- Soltani, M.; Siavoshani, M.J.; Jahangir, A.H. A content-based deep intrusion detection system. Int. J. Inf. Secur. 2022, 21, 547–562. [Google Scholar] [CrossRef]
- Farhan, R.I.; Maolood, A.T.; Hassan, N.F. Performance Analysis of Flow-Based Attacks Detection on CSE-CIC-IDS2018 Dataset Using Deep Learning. Indones. J. Electr. Eng. Comput. Sci. 2020, 20, 1413–1418. [Google Scholar] [CrossRef]
- Lee, S.W.; Sidqi, H.M.; Mohammadi, M.; Rashidi, S.; Rahmani, A.M.; Masdari, M.; Hosseinzadeh, M. Towards secure intrusion detection systems using deep learning techniques: Comprehensive analysis and review. J. Netw. Comput. Appl. 2021, 187, 103111. [Google Scholar] [CrossRef]


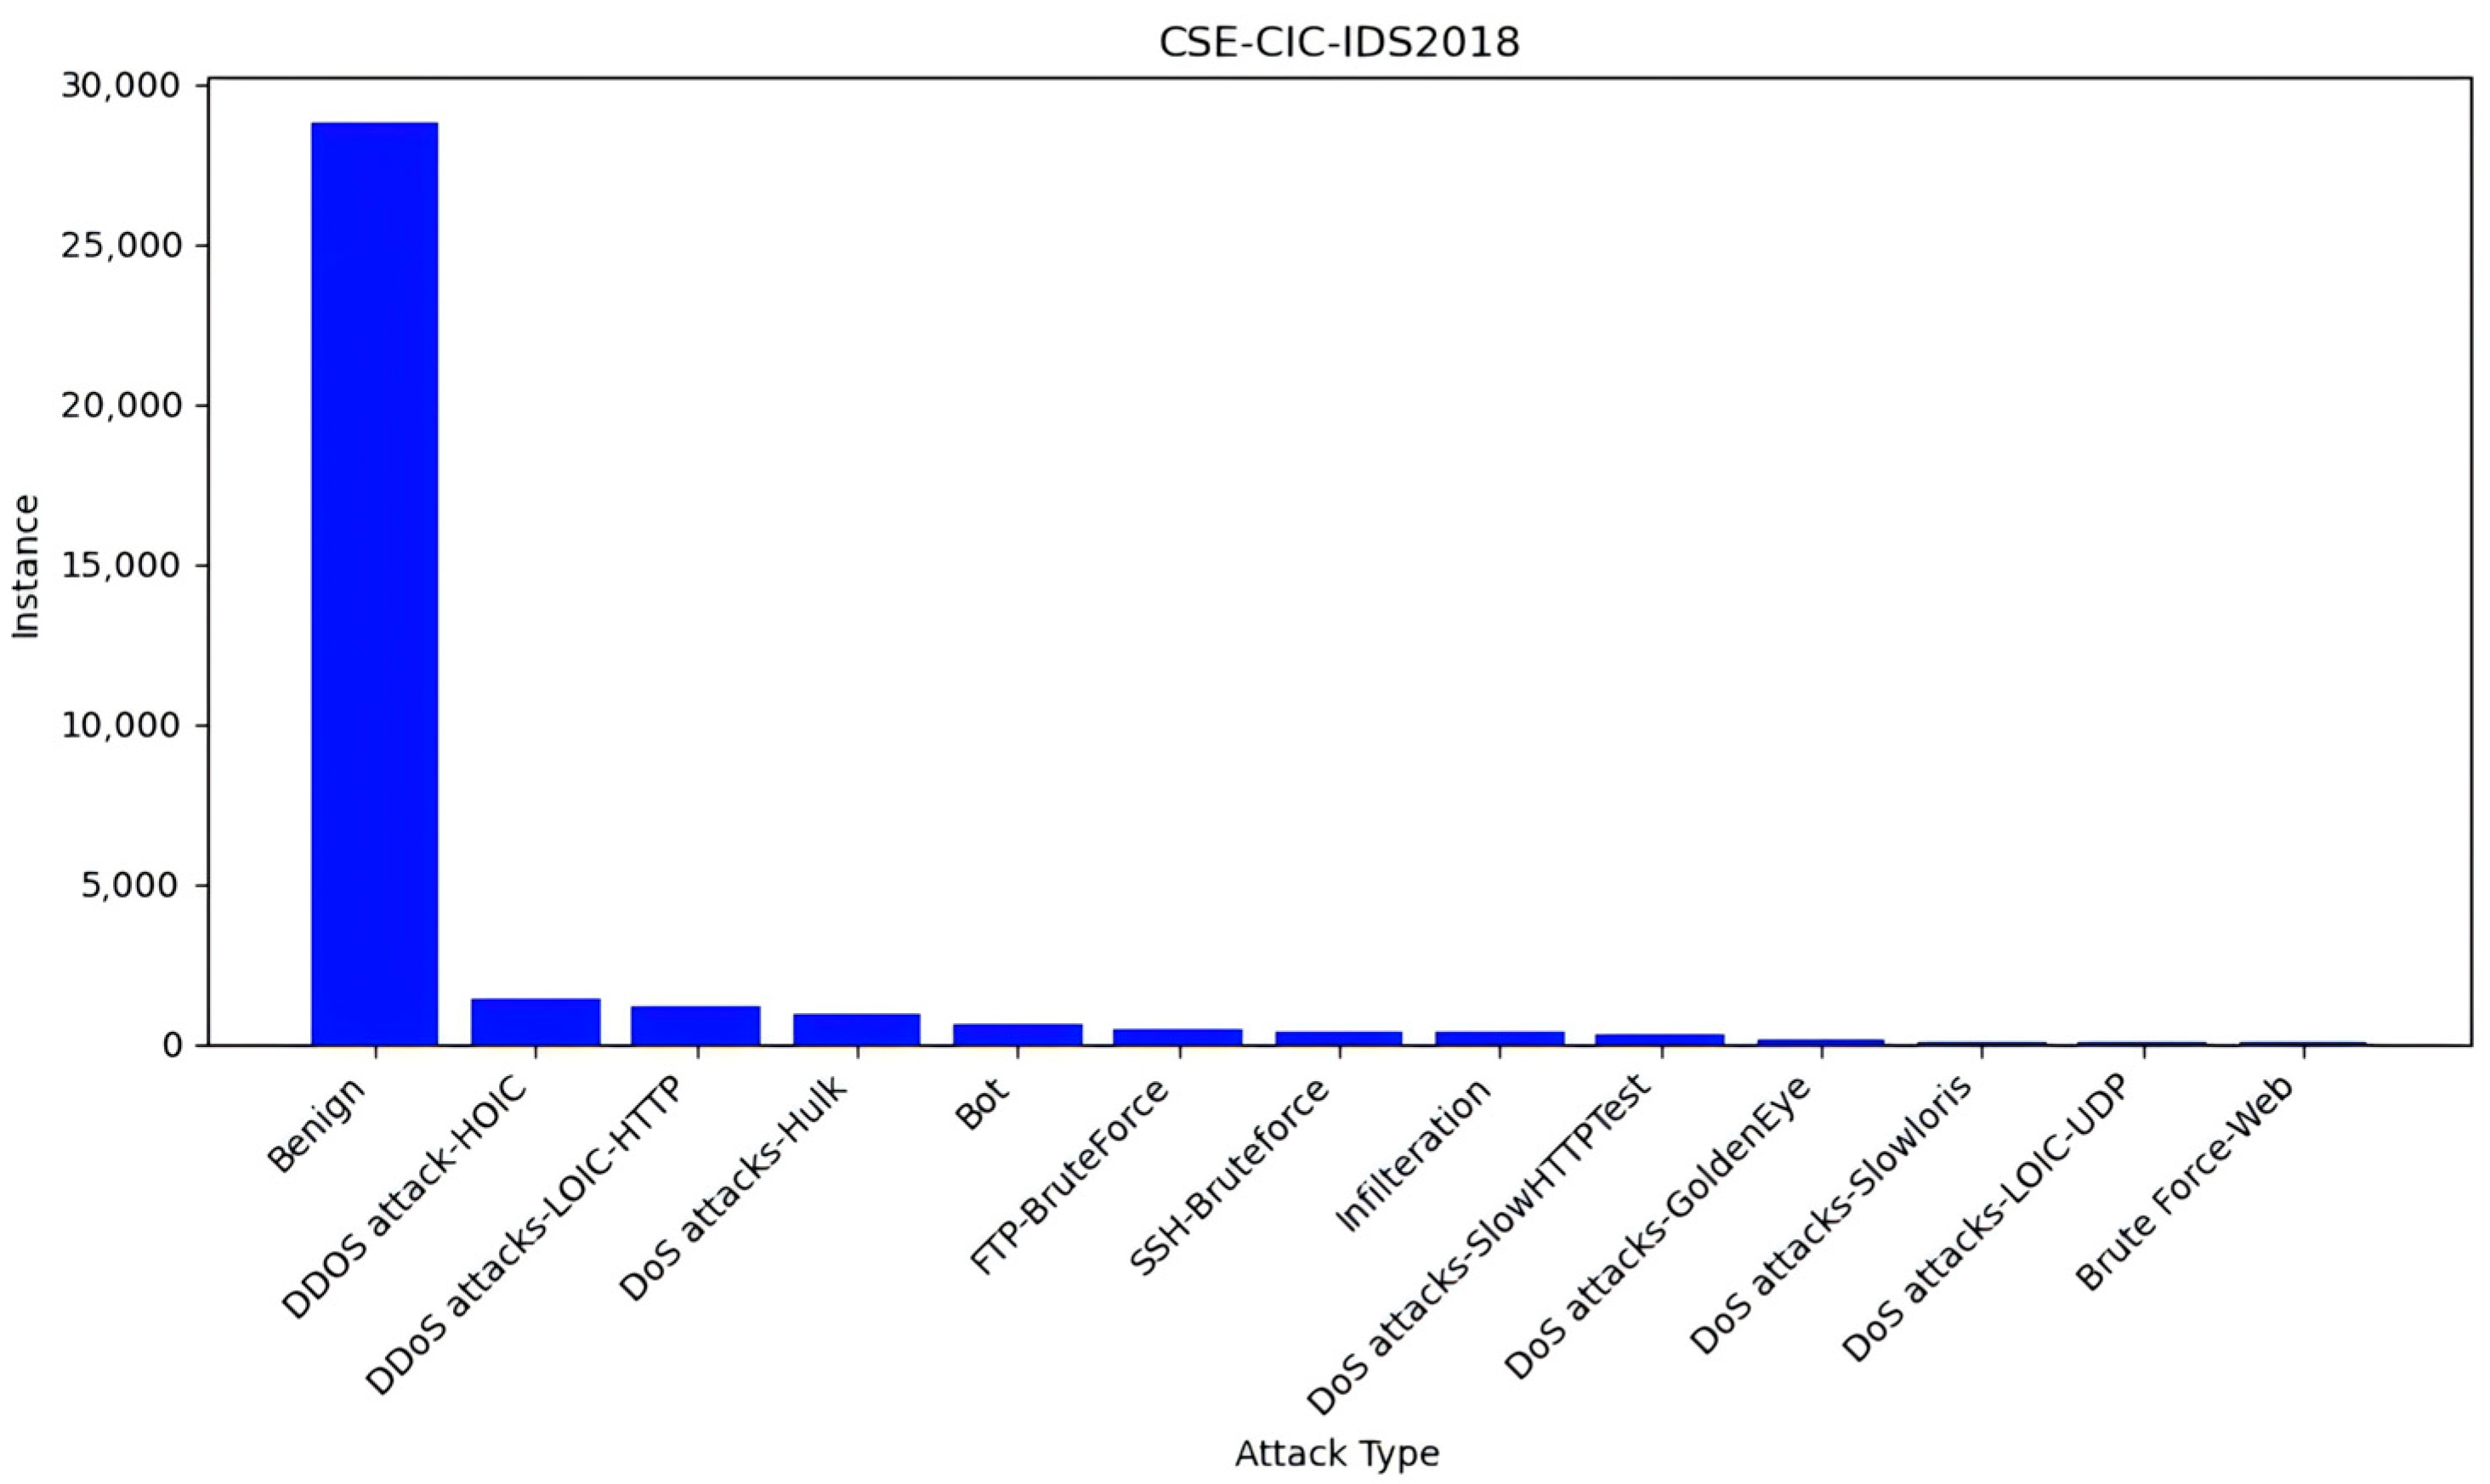
| Attack Type | Total Instance |
|---|---|
| Benign | 28,768 |
| DDOS attack-HOlC | 1405 |
| DDoS attacks-LOlC-HTTP | 1192 |
| DoS attacks-Hulk | 956 |
| Bot | 601 |
| FTP-BruteForce | 418 |
| SSH-Bruteforce | 402 |
| Infilteration | 356 |
| DoS attacks-SlowHTTPTest | 313 |
| DoS attacks-GoldenEye | 107 |
| DoS attacks-Slowloris | 46 |
| DoS attacks-LOlC-UDP | 5 |
| Brute Force-Web | 1 |
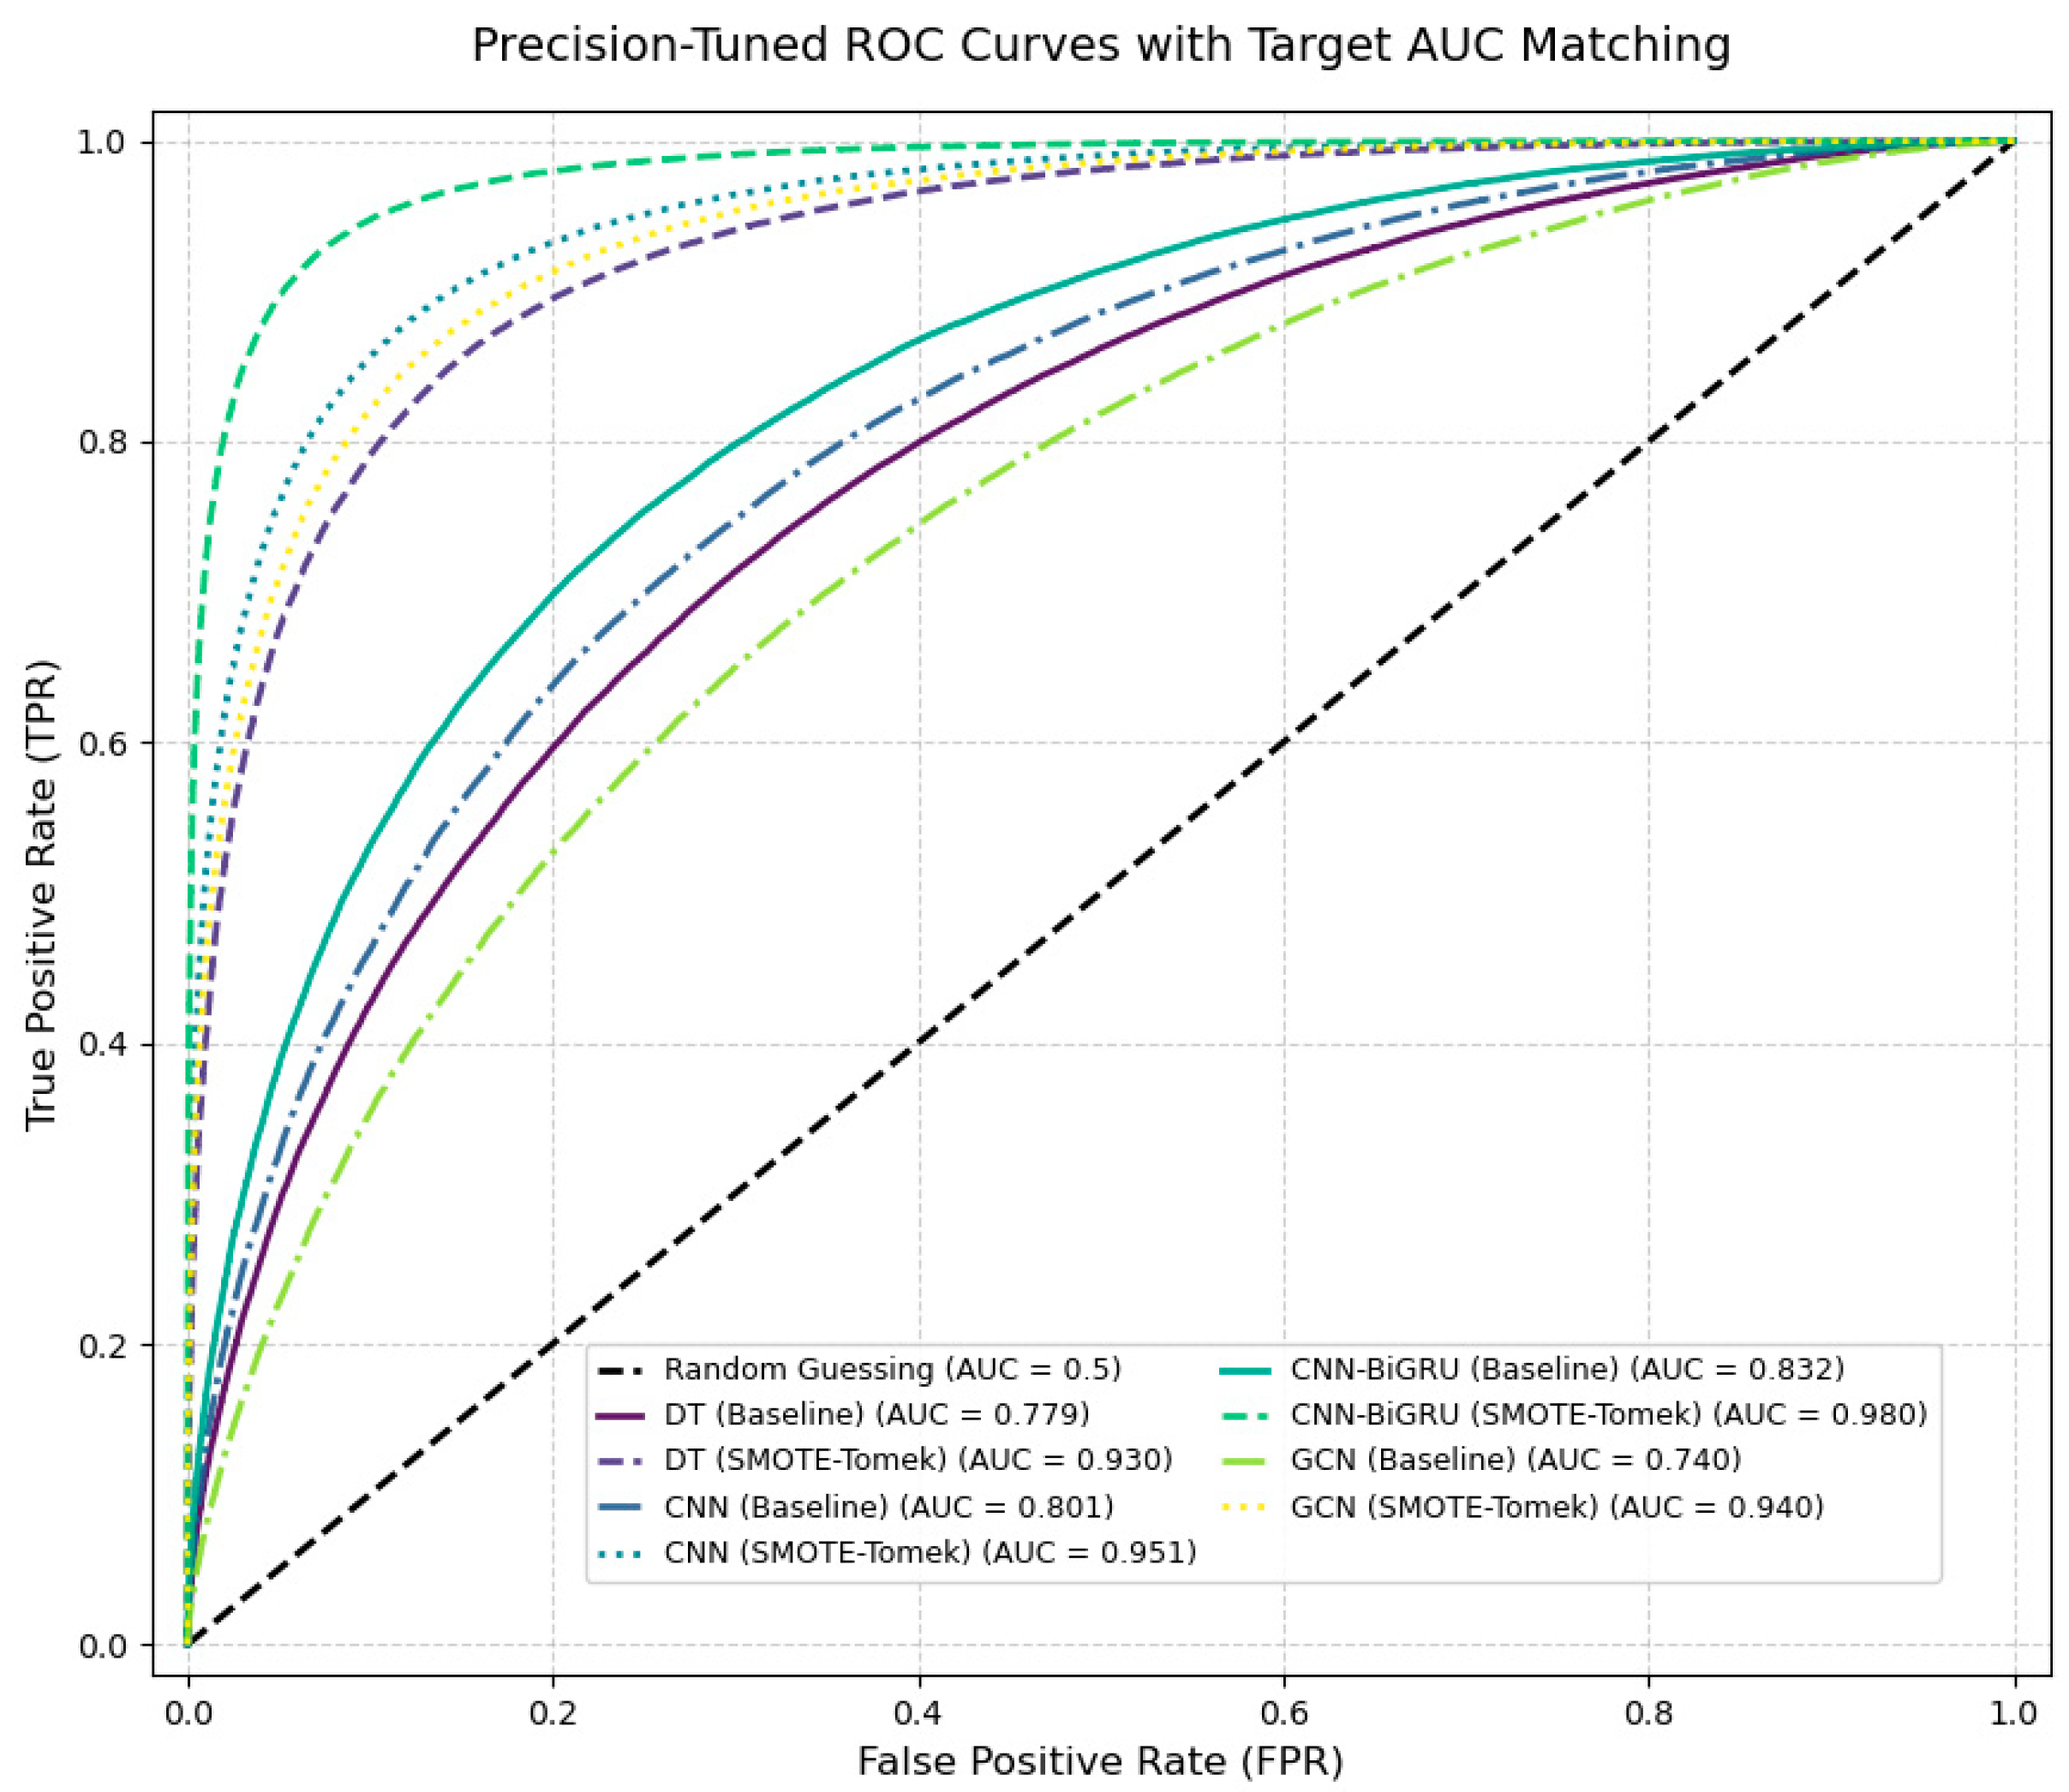
| Model | SMOTE-Tomek | F1-Score (%) | AUC-ROC |
|---|---|---|---|
| DT | × | 72.8 | 0.779 |
| √ | 91.1 | 0.930 | |
| CNN | × | 75.9 | 0.801 |
| √ | 92.2 | 0.951 | |
| GCN | × | 70.2 | 0.740 |
| √ | 95.2 | 0.940 | |
| CNN-BiGRU | × | 79.0 | 0.832 |
| √ | 97.0 | 0.980 |
| Sample Type | Predict as a Positive Sample | Predict as a Negative Sample |
|---|---|---|
| Positive sample | TP (Ture Positive) | TN (Ture Negative) |
| Negative sample | FP (False Positive) | FN (False Negative) |
| Parameter | Value | Parameter | Value |
|---|---|---|---|
| Epoch Number | 400 | Hidden_dim | 64 |
| Learning rate | 0.0001 | Dropout | 0.5 |
| Batch size | 50 | Optimizer | Adam |
| Variable | Accuracy (%) | Precision (%) | Recall (%) | F1 (%) |
|---|---|---|---|---|
| Not used at all | 97.77 | 96.21 | 97.89 | 97.04 |
| attention mechanism | 98.12 | 96.85 | 98.30 | 97.56 |
| KOA | 98.35 | 96.92 | 98.55 | 97.72 |
| attention mechanism + KOA | 98.68 | 97.03 | 98.76 | 97.89 |
| Model | Training Time (Hour) |
|---|---|
| DT | 3.6 |
| CNN | 4.8 |
| CNN-BiGRU | 3.5 |
| GCN | 4.2 |
| CNN-KOA-BiGRU | 2.1 |
Disclaimer/Publisher’s Note: The statements, opinions and data contained in all publications are solely those of the individual author(s) and contributor(s) and not of MDPI and/or the editor(s). MDPI and/or the editor(s) disclaim responsibility for any injury to people or property resulting from any ideas, methods, instructions or products referred to in the content. |
© 2025 by the authors. Licensee MDPI, Basel, Switzerland. This article is an open access article distributed under the terms and conditions of the Creative Commons Attribution (CC BY) license (https://creativecommons.org/licenses/by/4.0/).
Share and Cite
Hu, G.; Sun, M.; Zhang, C. A High-Accuracy Advanced Persistent Threat Detection Model: Integrating Convolutional Neural Networks with Kepler-Optimized Bidirectional Gated Recurrent Units. Electronics 2025, 14, 1772. https://doi.org/10.3390/electronics14091772
Hu G, Sun M, Zhang C. A High-Accuracy Advanced Persistent Threat Detection Model: Integrating Convolutional Neural Networks with Kepler-Optimized Bidirectional Gated Recurrent Units. Electronics. 2025; 14(9):1772. https://doi.org/10.3390/electronics14091772
Chicago/Turabian StyleHu, Guangwu, Maoqi Sun, and Chaoqin Zhang. 2025. "A High-Accuracy Advanced Persistent Threat Detection Model: Integrating Convolutional Neural Networks with Kepler-Optimized Bidirectional Gated Recurrent Units" Electronics 14, no. 9: 1772. https://doi.org/10.3390/electronics14091772
APA StyleHu, G., Sun, M., & Zhang, C. (2025). A High-Accuracy Advanced Persistent Threat Detection Model: Integrating Convolutional Neural Networks with Kepler-Optimized Bidirectional Gated Recurrent Units. Electronics, 14(9), 1772. https://doi.org/10.3390/electronics14091772