Abstract
Ultra-wide-band (UWB) radar technology is a contactless signal detection technology. The UWB technology can be used for the clinical medical monitoring of the human heartbeat and respiration. In this paper, a novel algorithm is proposed to estimate heart rate (HR) and respiratory rate (RR) depending on the received UWB radar signal. The proposed algorithm initially applies Singular Spectrum Analysis (SSA) to remove noise from the received UWB radar signal, and then applies Variational Mode Decomposition (VMD) to effectively separate the respiratory and heartbeat components. To address the issue of heartbeat components being susceptible to harmonic and inter-modulation components interference, a double fuzzy logic estimation is implemented to achieve robust real-time extraction of heart rate. In this paper, extensive experiments are conducted at various distances and angles. The experimental results of the SSA-VMD-Double-Fuzzy-Logic (SVDF) method have been compared with other methods, demonstrating its effectiveness and the advantages of the SVDF proposed in this paper.
1. Introduction
Heartbeat and respiration are the basic vital signs of the human body, and their monitoring is crucial for health assessment, disease prevention, and emergency rescue [1,2]. Traditional monitoring methods, such as respiratory belts [3], electrocardiograms [4], and impedance monitoring [5], require the patient to wear the devices closely, which is not suitable for long-term or mobile monitoring. Radar technology provides a non-contact monitoring method. Ultra-wide-band (UWB) radar technology, compared to traditional radar technology, has unique advantages such as a simple structure, low transmission power, strong penetration capability, high resolution, and fast transmission speed, showing significant potential for life information detection [6]. UWB radar can penetrate nonmagnetic obstacles, including clothing or blankets, for non-contact target detection and information extraction. It operates independently of ambient light, ensuring reliable performance in darkness or night conditions. This technology is widely used not only in health care but also in mine rescue [7], earthquake rescue [8], security [9], and antiterrorism [10].
In recent years, there has been a lot of research on the detection of vital signs using a UWB radar. Lande et al. proposed the application of IR-UWB radar technology in the biomedical field [11]. Methods such as time-frequency analysis, mode decomposition, and harmonic-based analysis are employed to extract heartbeat and respiration from UWB signals. The heartbeat component is approximately an order of magnitude weaker than the respiratory component in the received UWB signal. The frequency components of the heartbeat signal are merged with spectral leakage components or higher harmonics of the respiratory signal. Time-frequency analysis methods may not provide high accuracy in extracting heartbeat components. Mode decomposition is a proven effective method for separating the mixture of heartbeat components with spectral leakage components or higher-order harmonics of the respiratory signal. The Variational Mode Decomposition (VMD) [12] algorithm optimizes the variational model using the alternating direction method of multipliers (ADMM), is insensitive to noise, and offers higher resolution in separating the low-frequency components of blind signals.
Duan et al. used coherent background noise removal and moving target display filtering to reduce noise and clutter in non-contact detection, then applied the VMD algorithm for numerical simulation, successfully extracting relatively clean human respiratory and heart rate signals [13]. Zhang et al. used Improved Morphological Component Analysis (IMCA) and Adaptive Parameter Optimization VMD (APVMD) algorithms to extract vital sign signals, thereby reducing interference between radar signals [14]. Pan et al. proposed a method that combines Time Domain Coherent Accumulation (TDCA) with VMD, achieving a heart rate detection accuracy of 93% in low signal-to-noise ratios [15]. To reduce the impact of noise, Yu et al. used Singular Spectrum Analysis (SSA) to denoise the original signals, then combined VMD to extract heartbeat signals, which was more accurate than using VMD alone [16]. Li et al. presented a Symplectic Geometric Variational Mode Decomposition (SG-VMD) method, which improved the average detection accuracy of weak heartbeat signals under colored noise backgrounds [17].
Due to the high computational complexity of modal decomposition methods, much attention has been focused on the study of harmonic-based analysis, such as the Harmonic Path Algorithm (HAPA) [18], the Spectral Average Harmonic Path Detection Algorithm (SHAPA) [19], the Harmonic Multi-loop Detection (HMLD) algorithm [20], and the Harmonics and intermodulation products-based fuzzy logic (HIPBFL) algorithm [21].The HIPBFL algorithm excels in improving the precision of heart rate estimation, as well as in its noise resilience and real-time performance.
The concept of fuzzy sets was put forward by L.A. Zadeh in 1965 [22]. Then, the concept of fuzzy logic was introduced in [23,24]. When dealing with ambiguous boundaries and imprecise data, fuzzy mathematics can be used to reduce the inherent imprecision.The studies [21,25,26] applied fuzzy logic rules to extract respiration and heartbeat.
In this paper, a novel algorithm named SSA-VMD-Double-Fuzzy-Logic (SVDF) for the extraction of heartbeat and respiration from the received UWB signal is proposed. Incorporating the advantages of VMD analysis and fuzzy logic reasoning, the algorithm is possible to achieve exceptionally high accuracy in heart rate estimation and real-time capability. The working principle of the technology and signal processing methods were elaborated, and its effectiveness is demonstrated.
2. Modeling for UWB Radar Signal
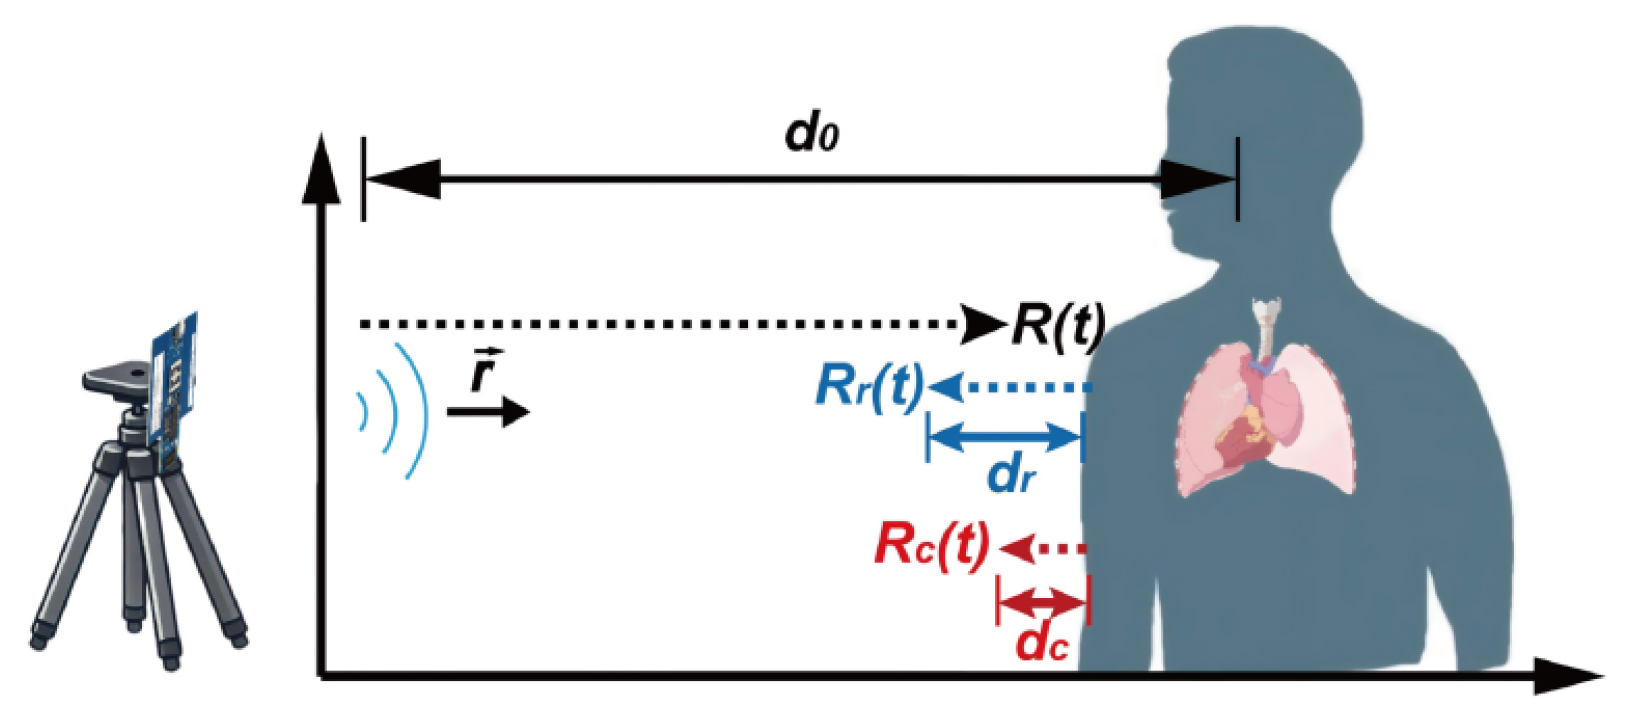
HR and RR can be obtained through the acquisition of vibration data caused by the respiration and heartbeat of the human body in the chest cavity. The chest cavity vibration is assumed as sinusoidal functions of time. As shown in Figure 1, the distance between the UWB radar and the human chest can be expressed as:
where denotes the distance between the UWB radar and the human chest when there is no vibration; and represent the variations caused by respiration and heartbeat, respectively; and are the amplitude of and , respectively; the frequency of respiration is represented by , and the frequency of heartbeat is represented by .

Figure 1.
Schematic of human vital signs detection with UWB radar.
The time-varying channel impulse response is expressed as:
where t, are the slow time and fast time, respectively, is the channel response amplitude of an echo from a living body and is the corresponding time delay, is the channel response amplitude of the background clutter and is the corresponding time delay, and c is the light velocity in air. Designating the transmit radar signal as s, the received signal is expressed as:
where ∗ represents the convolution operation and n is the random noise of the environment. After analog-to-digital conversion, the final signal can be expressed as:
The ideal received signal when only human targets are present in the measured area can be expressed as:
where , and . The two-dimensional (2D) Fourier transform (FT) X of x can be expressed as:
where is the FT in the fast time direction of x, is the Bessel function, and l is the order of the Bessel function. The spectrum of the slow-time signal in the received signal can be expressed as:
According to Formula (7), it can be seen that the spectrum of the slow-time signal includes the RR, the HR, and other inter-modulation components. Due to the weak energy of the heartbeat component, it is often obscured by the inter-modulation components or the harmonics of respiration.
3. Vital Sign Frequency Estimation Using SVDF
In this study, a method named SVDF is proposed to extract respiratory and heartbeat components from the received UWB radar signals. As shown in Figure 2, Singular Spectrum Analysis (SSA) is initially employed for denoising, and then Variational Mode Decomposition (VMD) is applied to further segregate the respiratory and heartbeat information. Finally, a double fuzzy logic system (DFLS) is utilized to effectively extract the Heart Rate (HR).
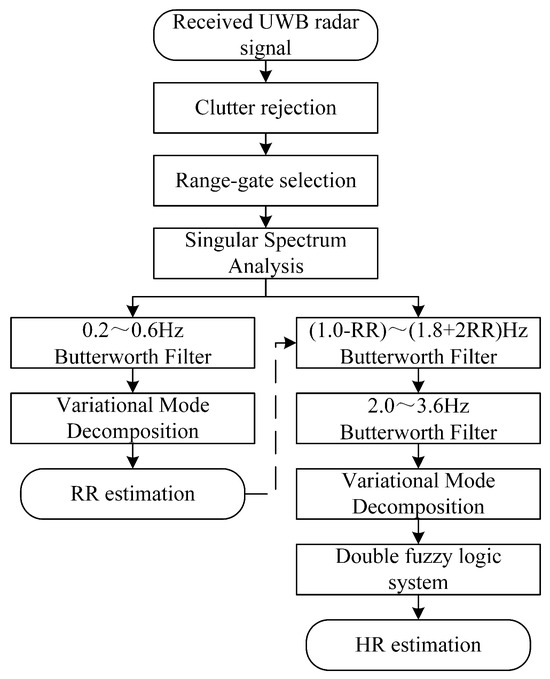
Figure 2.
Algorithm flow of SVDF.
3.1. Preprocessing
3.1.1. Clutter Rejection
The received UWB radar signals contain reflection signals from both the target and the background. The background reflection signals are referred to as background clutter, which typically have a large amplitude compared to respiration and heartbeat. The background clutter remains stable in the slow-time dimension. The interference from background clutter can be effectively reduced by subtracting the average of all received pulses within the slow time from each pulse, as shown in Formula (8):
where the is received UWB radar signal.
3.1.2. Range-Gate Selection
Range-gate selection is an important step to ensure accurate monitoring of the human target. The received signal is transformed into the frequency domain with the Fast Fourier Transform (FFT), and the spatial position of the human target is denoted by the peak in the frequency spectrum. The received signal corresponding to the selected range gate is used to extract the micro-movement information of the chest wall through phase demodulation. A mutation compensation method is employed. When the displacement change between two consecutive frames exceeds 1.5 times the radar resolution, it is considered a mutation in the displacement change. Signals with mutations are corrected towards the position of the measured target by an amount equal to twice the amplitude of the chest micro-movement.
3.1.3. Singular Spectrum Analysis (SSA)
SSA effectively enhances the signal-to-noise ratio (SNR) of the signals, thereby improving the situation where the heartbeat and respiratory signals are overwhelmed by noise.The signal after range-gate selection is firstly arranged into a trajectory matrix H:
where L is the window length and . H is an trajectory matrix. The window length L is typically chosen as half of the signal frame length to ensure decomposition accuracy. The singular value decomposition of H is
where is the singular value, are arranged in descending order, and are the left and right singular vectors of H, and m is the rank of H. is intrinsic mode function (IMF) of H. By performing diagonal averaging on each and projecting it into a new sequence of length N, can be expressed as:
The singular value spectrum of the collected vital sign data is analyzed. With reference to the component selection presented in this article [16], the singular value located at the position is selected as the threshold for noise removal, which allows a smooth decline of singular values from large to near-zero.
3.2. Variational Mode Decomposition
VMD involves the decomposition of the input signal into several narrowband IMFs and the minimization of the bandwidth of each IMF. VMD is a constrained variational problem expressed as:
where is the k-th IMF and is the corresponding center frequency, is the Dirac function, and f is the input function. Introducing a Lagrange multiplier and a penalty factor , Formula (12) becomes an unconstrained Lagrange optimization problem as:
where denotes the inner product operation, and is repeatedly updated with the gradient descent method until the convergence criteria are satisfied.
In the VMD algorithm, the number of modes K and the penalty factor are key parameters which are closely related to the decomposition results. Based on extensive experimentation and a review of parameter selections in relevant literature [13,16,27], the optimal parameter configuration was determined as for respiration signals (capturing fundamental frequency and residual noise) and for heartbeat signals (capturing fundamental frequency, respiration harmonics, inter-modulation components and residual noise). The penalty factors were optimized as for respiration and for heartbeat signals. The lower preserves temporal features after SSA-based noise reduction, while the higher suppresses high-frequency noise and resolves spectral overlaps through narrower modal bandwidths, thus, improving decomposition accuracy.
3.3. Double Fuzzy Logic System
The IMFs obtained through VMD contain various signal components. Accurately identifying the respiration’s IMF and the heartbeat’s IMF can effectively estimate RR and HR. The estimation of respiration can be obtained by performing a Fourier transform on the VMD components and selecting the component with the highest frequency amplitude as the respiration component. The estimation of heartbeats cannot be accurately identified solely based on the highest frequency amplitude, because the frequency amplitudes of the respiration’s harmonics and the inter-modulation components between respiration and heartbeat are close to that of the heartbeat. A double fuzzy logic system (DFLS) based on the frequency relationships of harmonics and inter-modulation waves, as well as real-time velocity relationships, is presented to extract HR. The HR extraction with DFLS effectively resolves estimation errors caused by interference and ensures the smoothness and precision of the target heart rate over a short period.
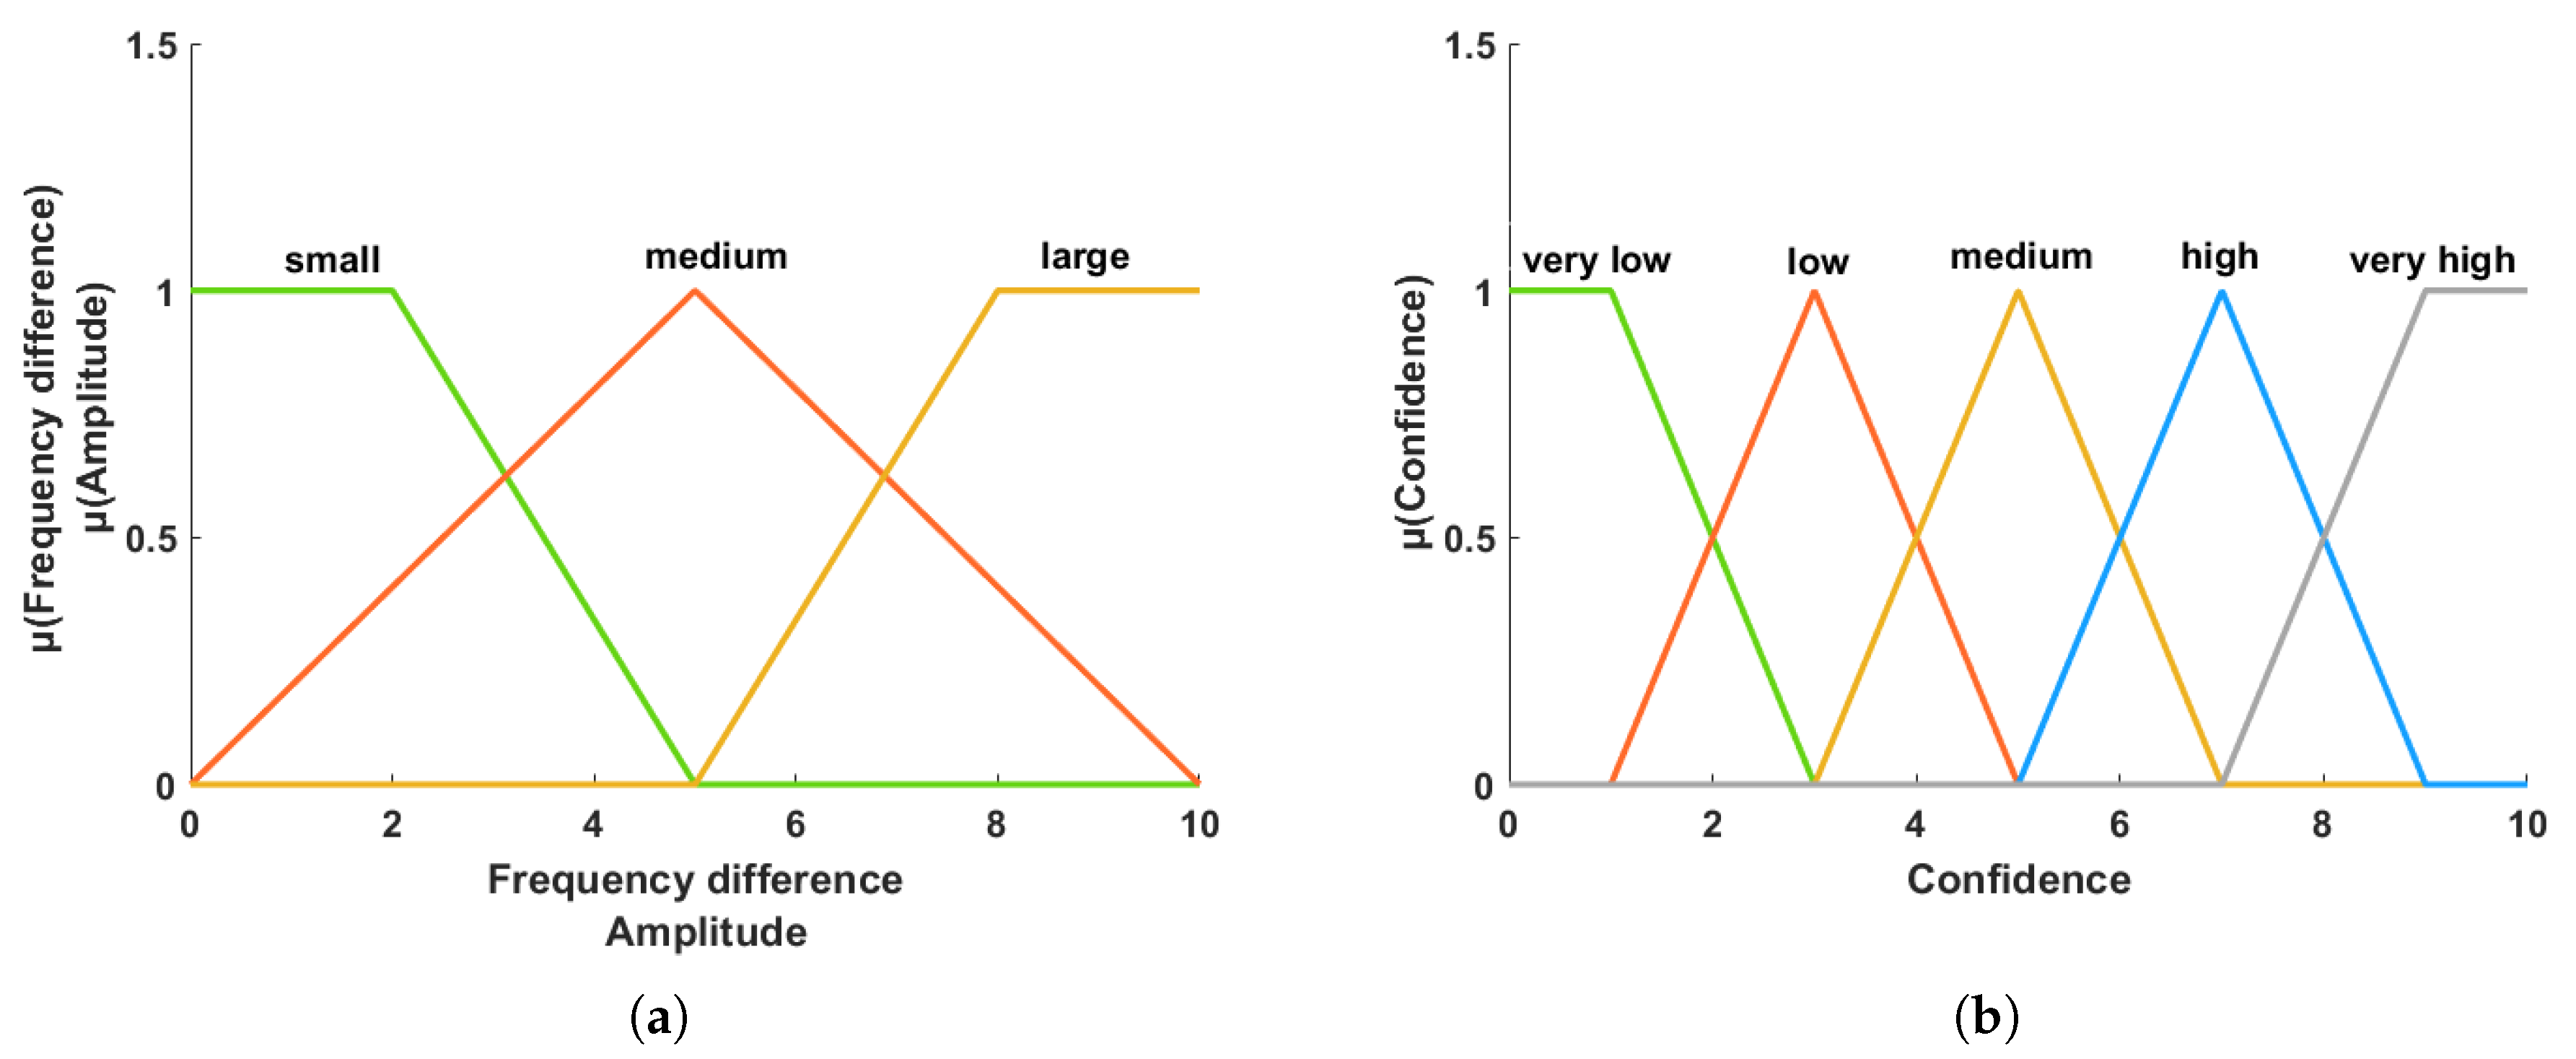
Firstly, the IMFs close to the heart rate frequency are selected as the pre-selected IMFs corresponding to HR. The frequencies of these pre-selected IMFs have a relationship with the theoretical inter-modulation components. The frequency difference between the pre-selected IMFs and their corresponding theoretical intermodulation components, as well as the frequency amplitude of these intermodulation components, are then calculated. These values are used as inputs to the fuzzy logic reasoning system. The calculated results are served as inputs to the first FLS [21,26]. In the first FLS, the frequency difference and frequency amplitude are divided into three fuzzy sets (large, medium, small). The membership functions for the frequency difference and frequency amplitude are shown in Figure 3a. An “if-then” rule is designed to determine the confidence level of each candidate IMF based on these fuzzy sets of frequency difference and amplitude. Completed defuzzification of each candidate IMF is achieved through the Centroid Method, a confidence value is calculated, whose membership function is illustrated in Figure 3b. All FLS rules are shown in Table 1. The sum of the confidence values for all pre-selected IMFs is calculated finally.
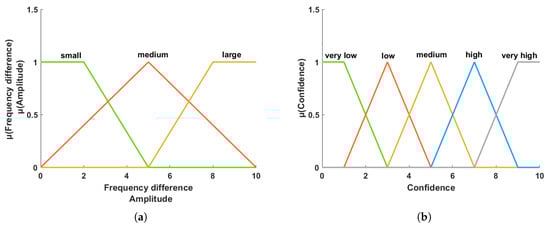
Figure 3.
Membership functions for the fuzzy logic system (FLS). (a) Frequency difference and frequency amplitude membership function (input to FLS). (b) Confidence values membership function (output of FLS).

Table 1.
The Rules of FLS.
The second FLS aims to achieve robust real-time extraction of the target HR by combining real-time speed with historical information. When the real-time speed of possible heart rates is fuzzified, precise estimation of the true target HR is enabled. Based on the total confidence values from the first FLS, the top three heart rate frequencies with the highest confidence values are selected. These are processed in combination with the confidence values and their corresponding heart rate frequencies obtained from L sliding windows (where in this study). Each sliding window has an interval of frame. A histogram estimation is then performed using degrees of freedom. Based on the histogram estimation results, the top three heart rate frequencies for the current i-th phase frame are determined, denoted as , and . Subsequently, the real-time velocity changes between adjacent phase frames are calculated and used as inputs to the second fuzzy logic system. The real-time velocity is calculated as:
The fuzzy set is characterized by the membership function , which assigns each real-time speed value x to the corresponding fuzzy variable, such as “slow”, “fast”. The is expressed as:
where and represent the upper limit of the fuzzy variable “slow” and the lower limit of “fast”, respectively. In the second FLS, there are four rules used for reasoning the target HR :
- (1)
- IF , THEN .
- (2)
- IF , , THEN .
- (3)
- IF , , , THEN .
- (4)
- IF , , , THEN .
4. Results and Discussions
4.1. Experimental Environment and Criteria
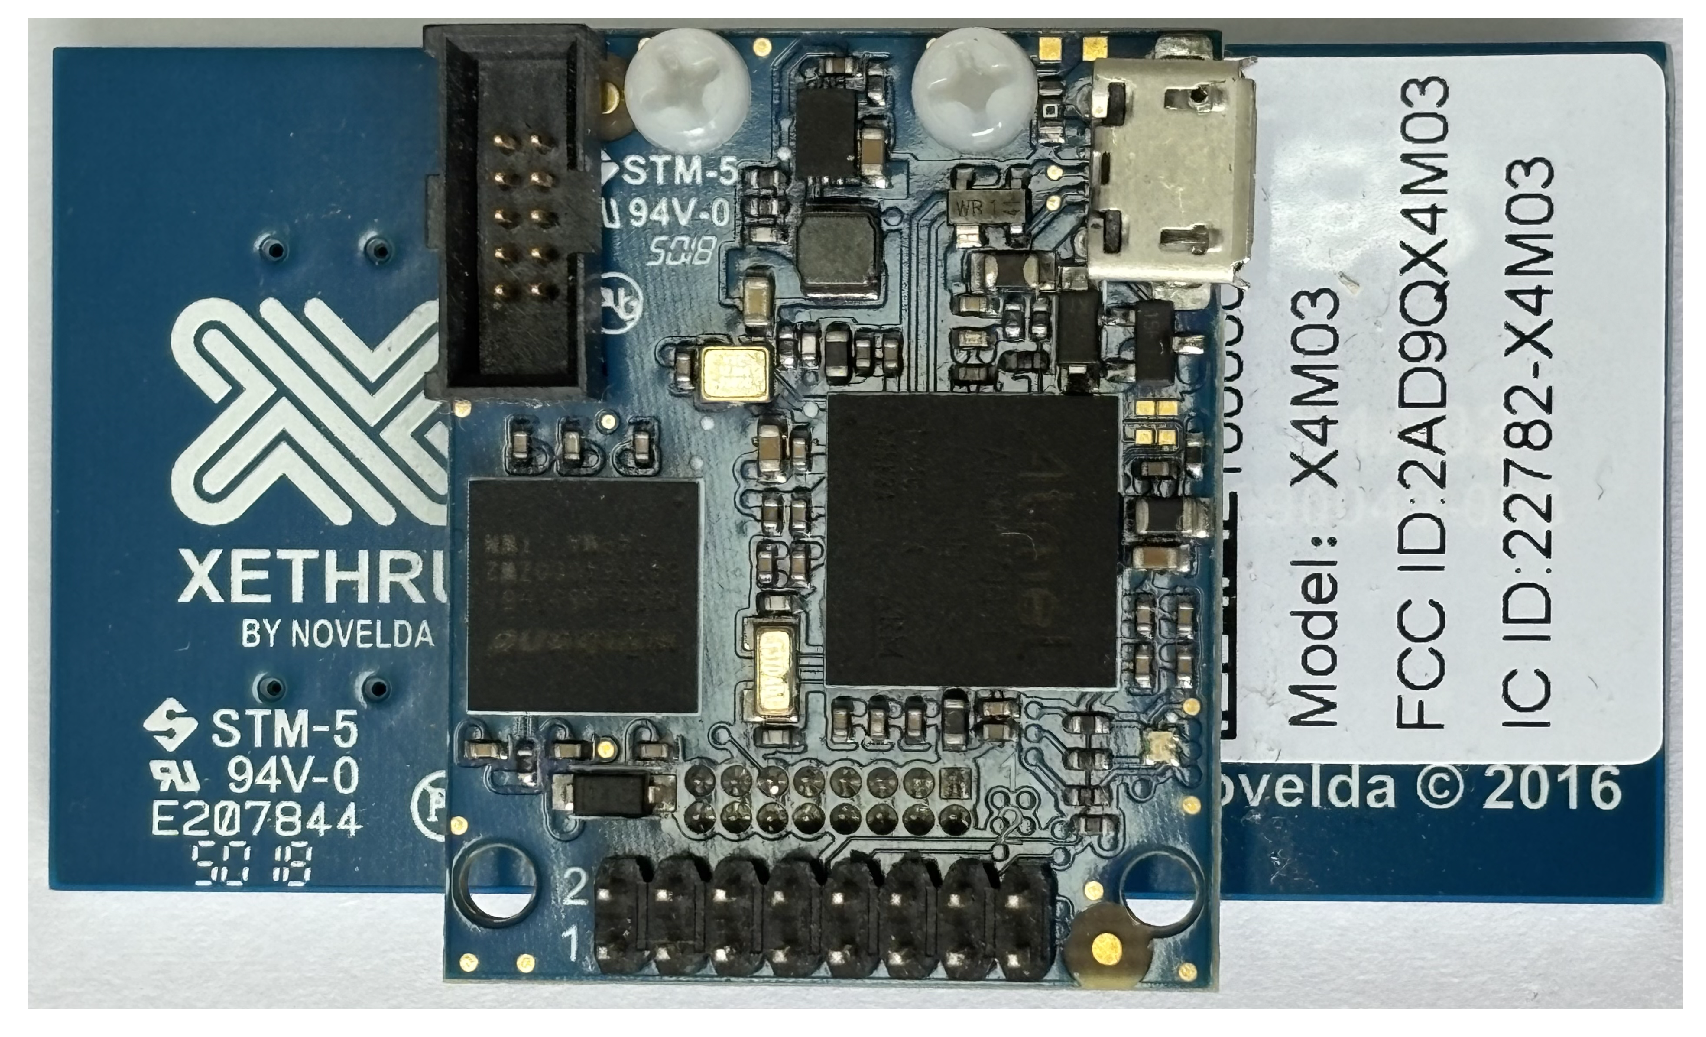
In the experiments, the Xethru X4M03 ultra-wide-band (UWB) radar module (Figure 4) provided by Novelda (Oslo, Norway) is used. This module has a center frequency of 7.29 GHz and a bandwidth of 1.5 GHz, offering a spatial resolution of 0.535 cm within a distance range of 0.2 m to 5 m, and is suitable for acquiring human vital sign signals such as heartbeat and respiration. In this experiment, the radar’s sampling rate is 20 frames per second, with 2 min of data collected each time, resulting in a total of 2400 frames of data. The detailed specifications of the radar are summarized in Table 2.
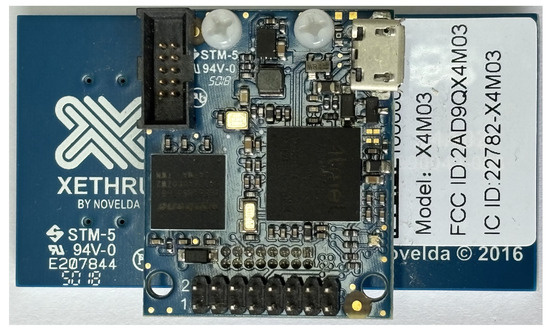
Figure 4.
The Xethru X4M03 UWB radar module.
Table 2.
The X4M03 radar parameter summary.
A total of eight people with varying genders, ages, and body sizes participated in the data collection, which ensured the diversity and representativeness of the experimental data. Detailed participant characteristics are provided in Table 3. This study was approved by the ethics committee, and all participants provided written informed consent. All participants were healthy, with no restrictions on clothing thickness or material to simulate the variability of everyday attire and ensure real-world applicability. During data collection, participants remained physically stationary to maintain a consistent resting state.
Table 3.
Basic information of volunteers.
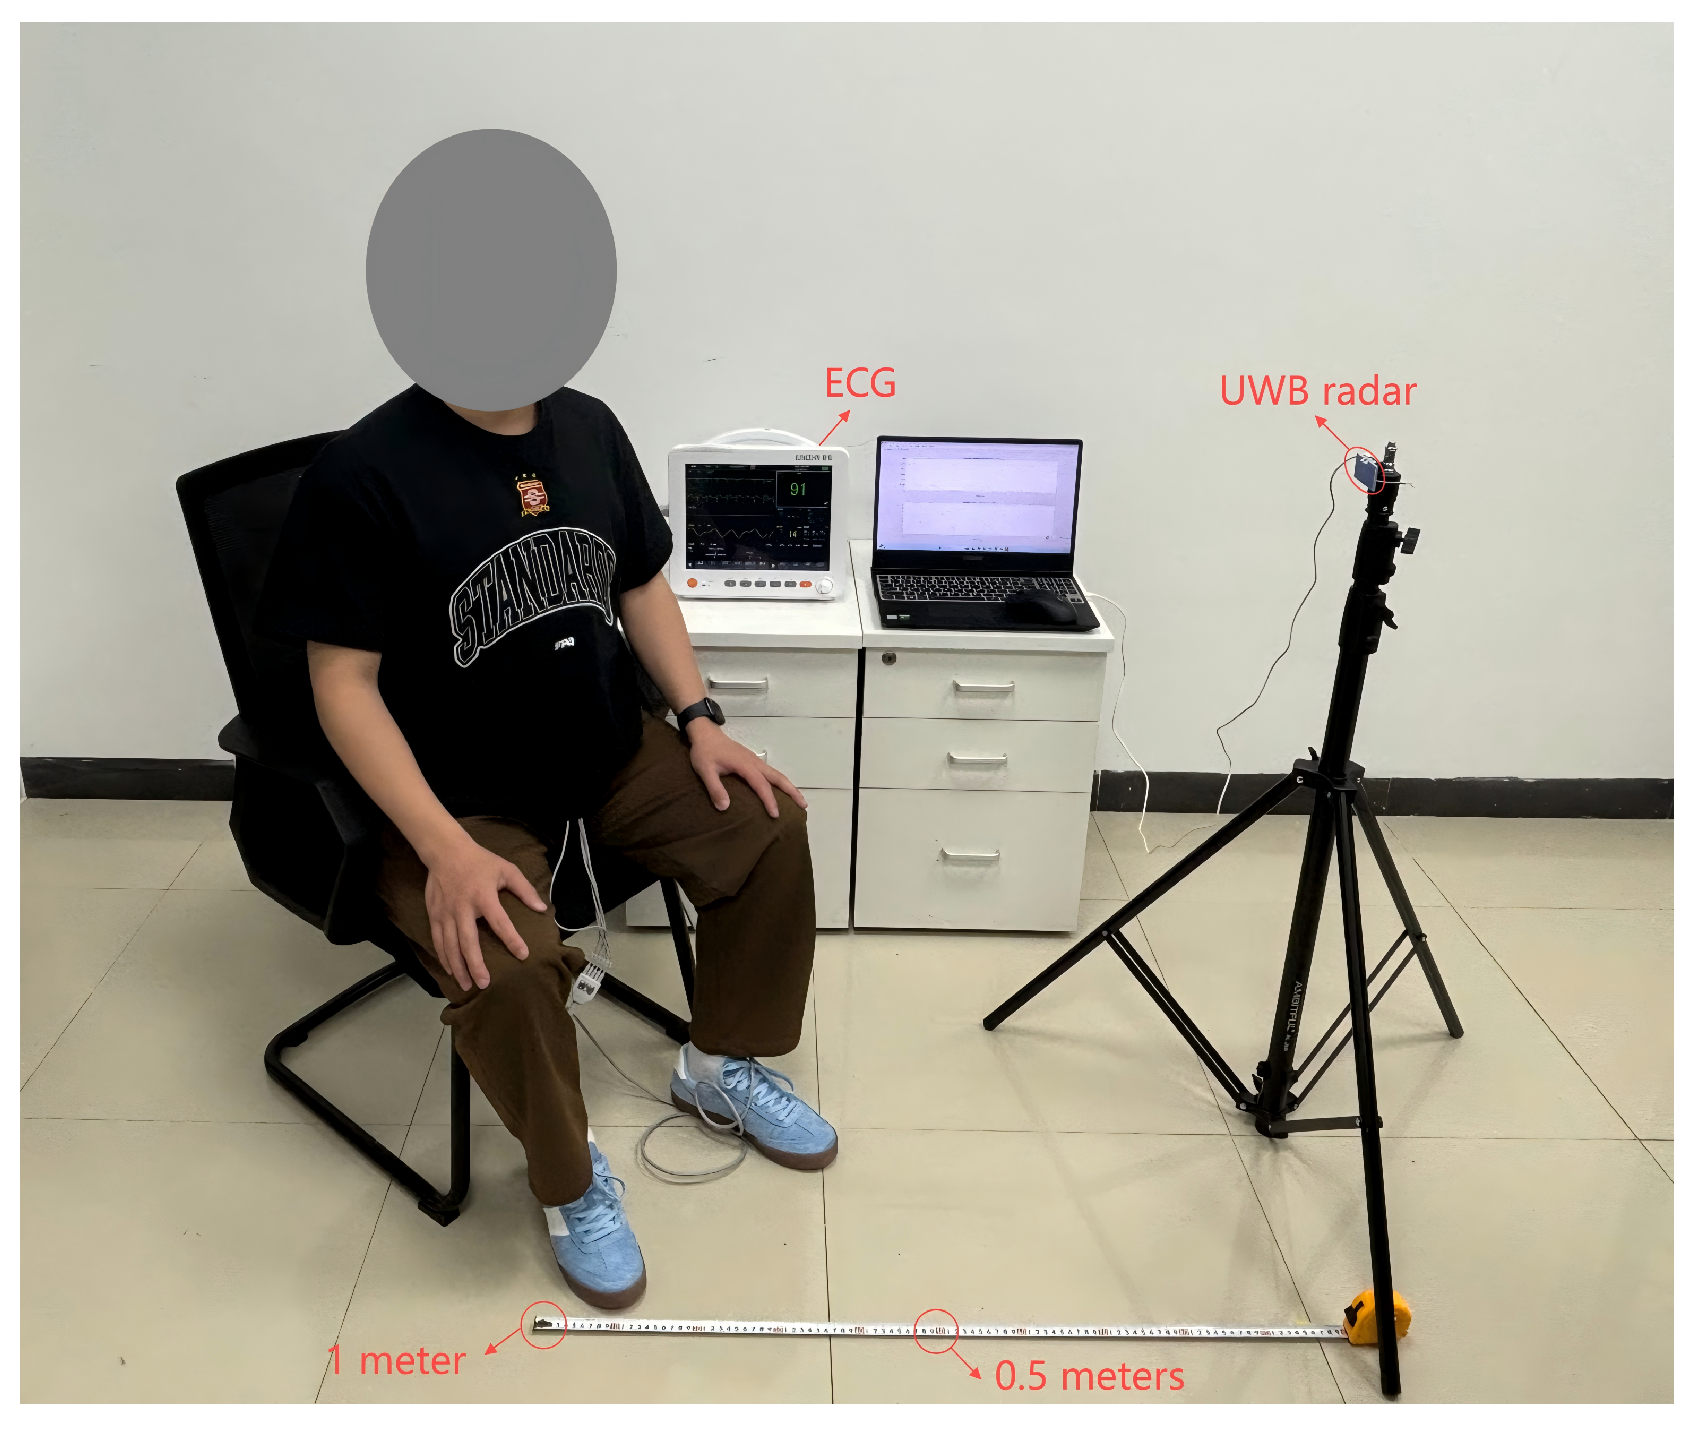
The experiments were conducted at two typical monitoring distances (0.5 m and 1 m) and two different angles (0° and 45°). The 0.5-meter distance simulates a common near-field monitoring scenario in clinical settings (e.g., bedside monitoring), while the 1-meter distance corresponds to medium-range monitoring needs in daily home environments (e.g., monitoring beside a sofa or chair). The angle variations (0° and 45°) were set to evaluate the system’s robustness under different positional conditions that may be encountered in real-world applications.
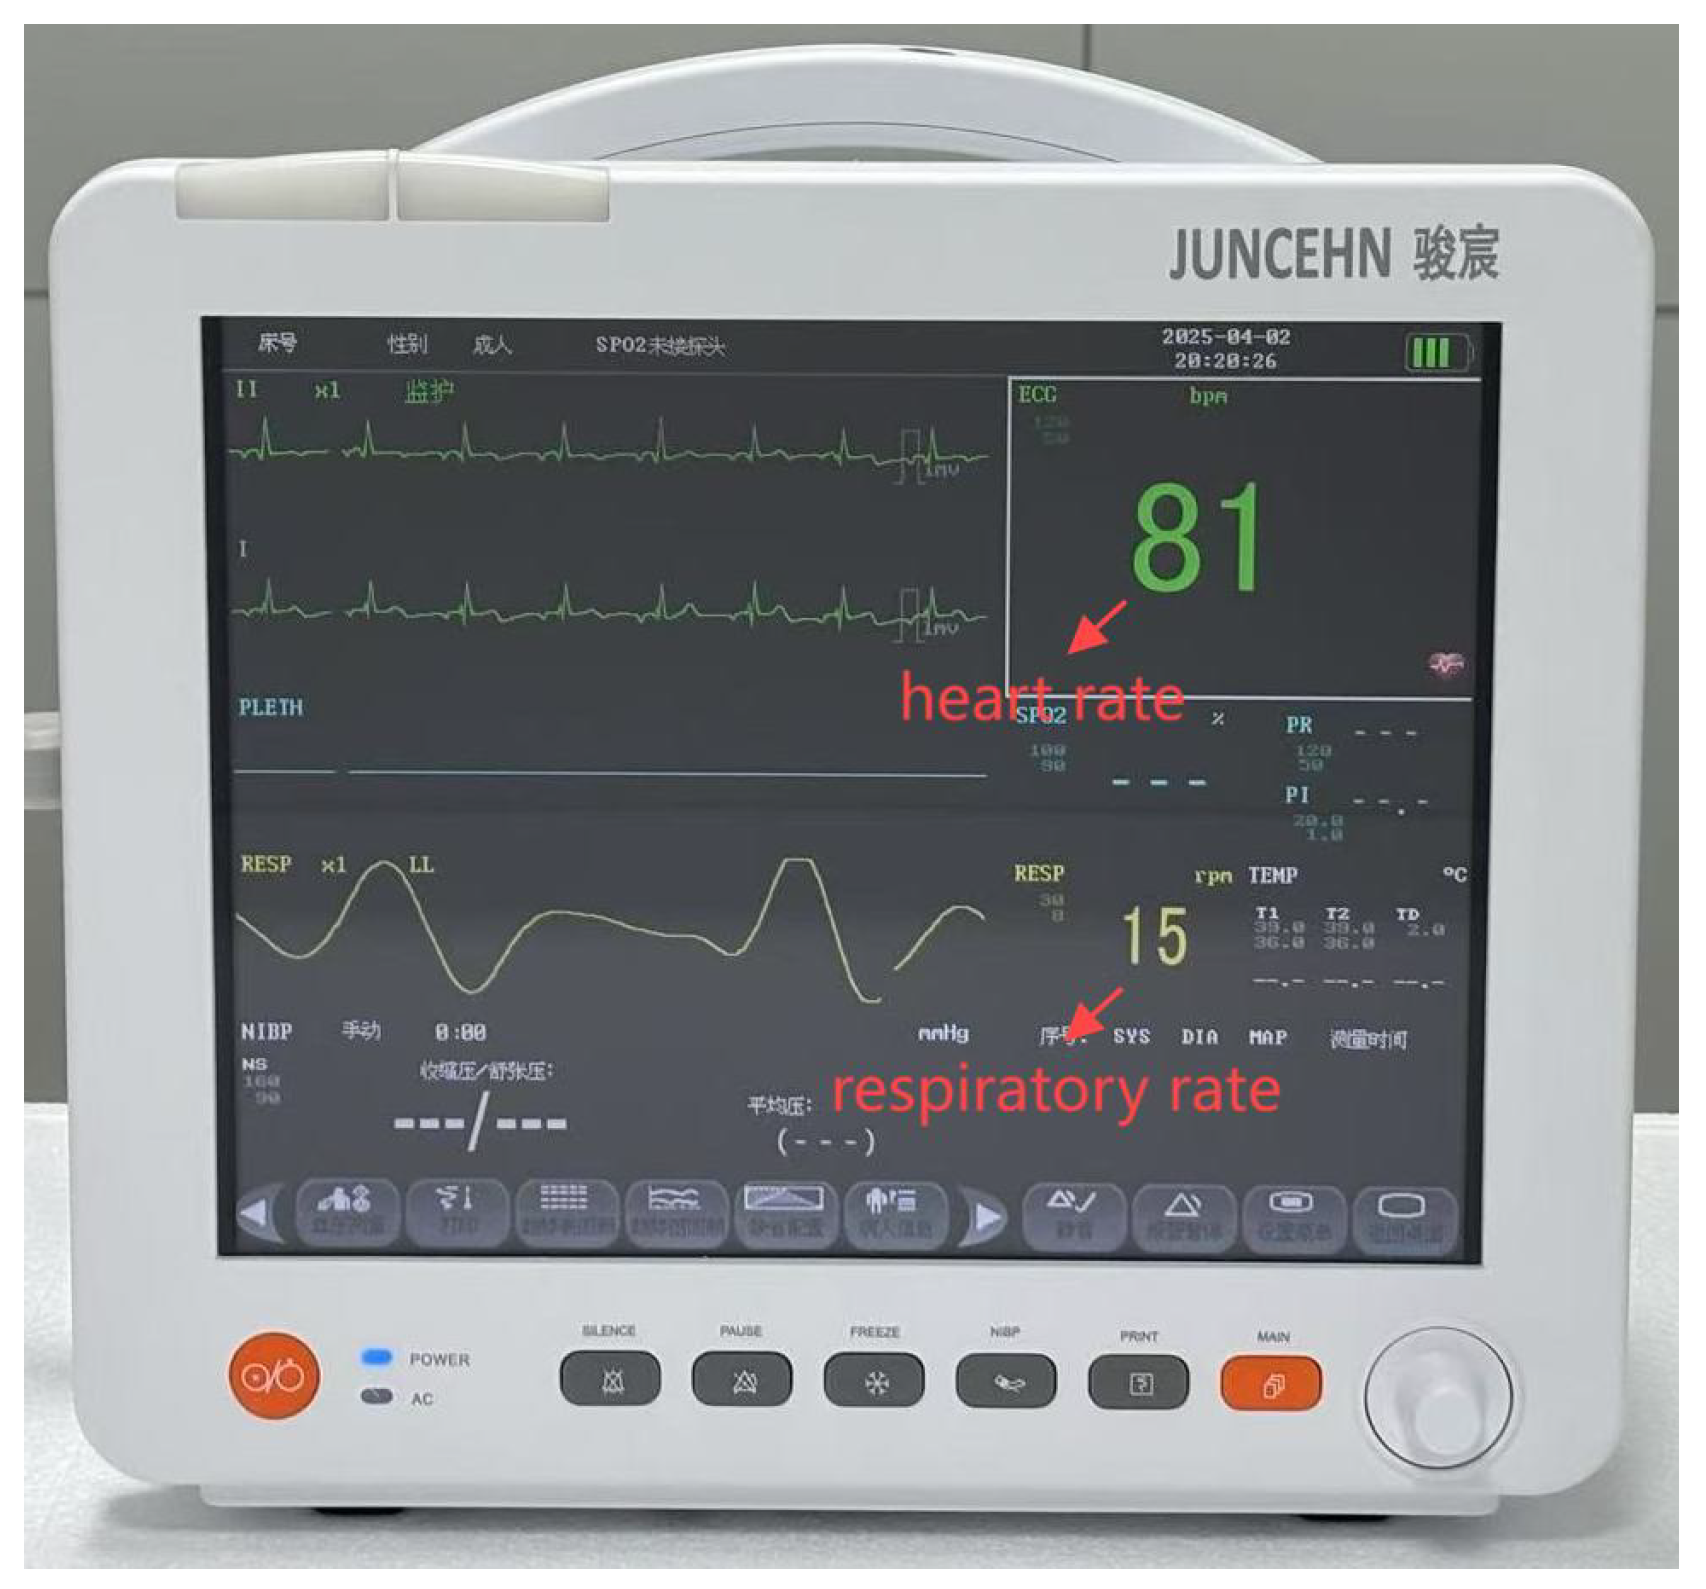
To verify the accuracy of the radar measurement results, a clinical-grade electrocardiograph (ECG) was employed as the reference standard for synchronous recording of both respiratory rate (RR) and heart rate (HR) (Figure 5). By comparing the reference data with the data obtained from the UWB radar, the performance of the radar and the accuracy of the algorithm are evaluated.
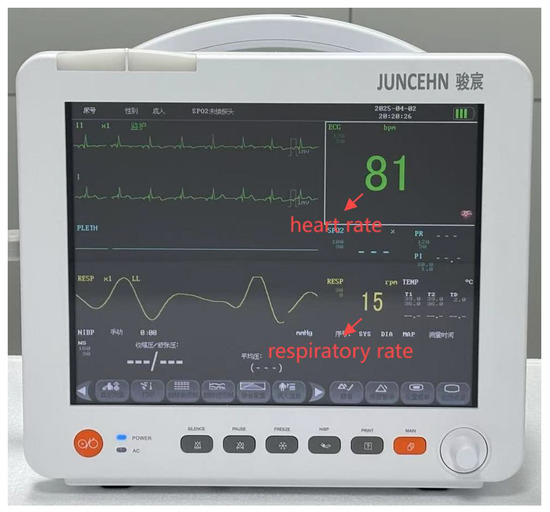
Figure 5.
The medical device-certified ECG monitor.
The SSA-VMD-HIPBFL algorithm and the SSA-VMD algorithm are introduced to validate the effectiveness of the algorithm presented in this paper. The SSA-VMD-HIPBFL incorporates a post-processing method based on fuzzy logic to enhance the signal separation performance, whereas the SSA-VMD employs the conventional VMD approach for signal processing without the inclusion of post-processing strategies.
The HR estimation error and RR estimation error were employed to evaluated the robustness and accuracy of the algorithms used in this experiment. The calculation formula for the HR error is as follows:
where is the true HR measured using the ECG, is the HR estimated using the UWB radar, and N is the number of samples. The calculation formula for the RR error is as follows:
where is the true RR measured using the ECG, is the RR estimated using the UWB radar, and N is the number of samples.
4.2. Frontal Detection at Various Distances
In this experiment, the performance of the SVDF algorithm was investigated by extracting the heart rate (HR) and respiratory rate (RR) from the radar signals received at distances of 0.5 m and 1.0 m, respectively. As shown in Figure 6, the radar is positioned directly in front of the participant’s chest during the experiment.
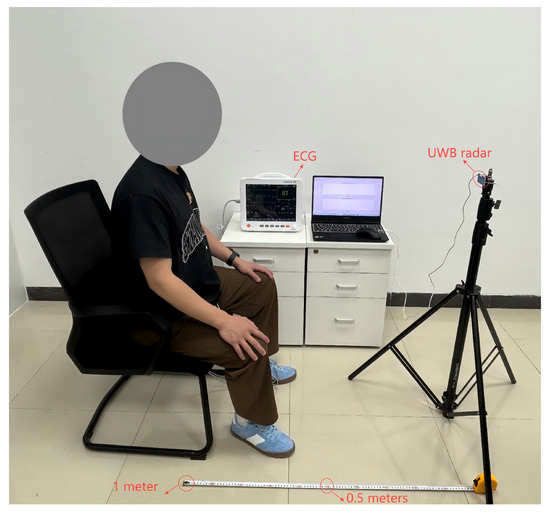
Figure 6.
The experimental scenario.
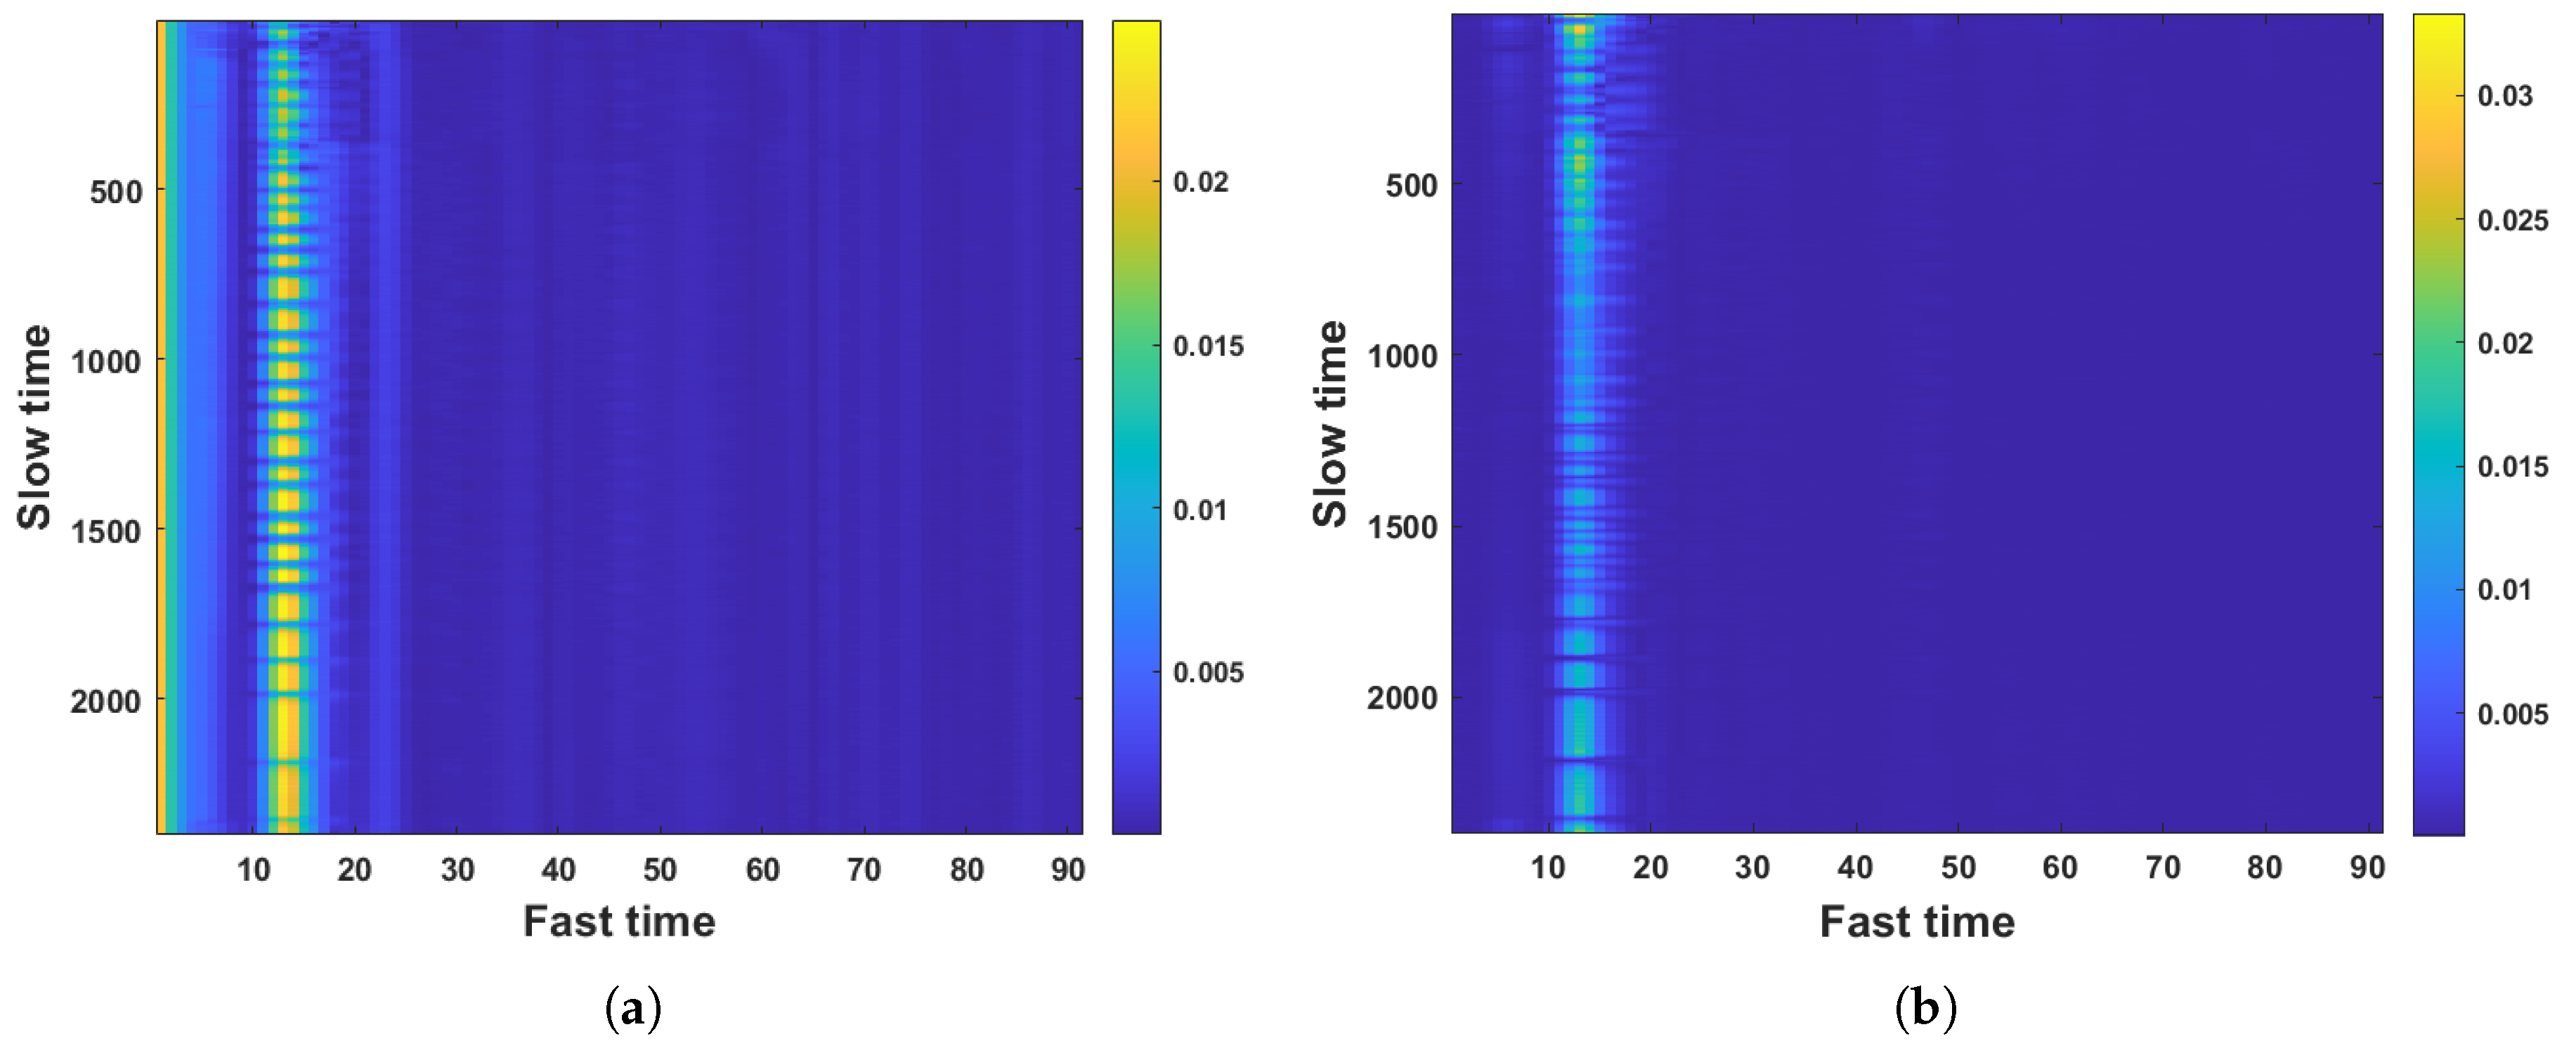
Figure 7 presents the comparison of the received UWB signal before and after clutter suppression from a particular experiment. As shown in Figure 7, before clutter suppression, the signal appears quite chaotic, containing a large number of noise points and interference. The accuracy and reliability of target detection are hardly ensured. After clutter suppression, the signal becomes clear, and it is easy to read the target’s range information from the signal.
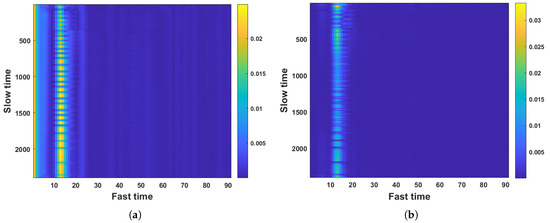
Figure 7.
The comparison of the received UWB signal before and after clutter suppression. (a) Signal before clutter suppression. (b) Signal after clutter suppression.
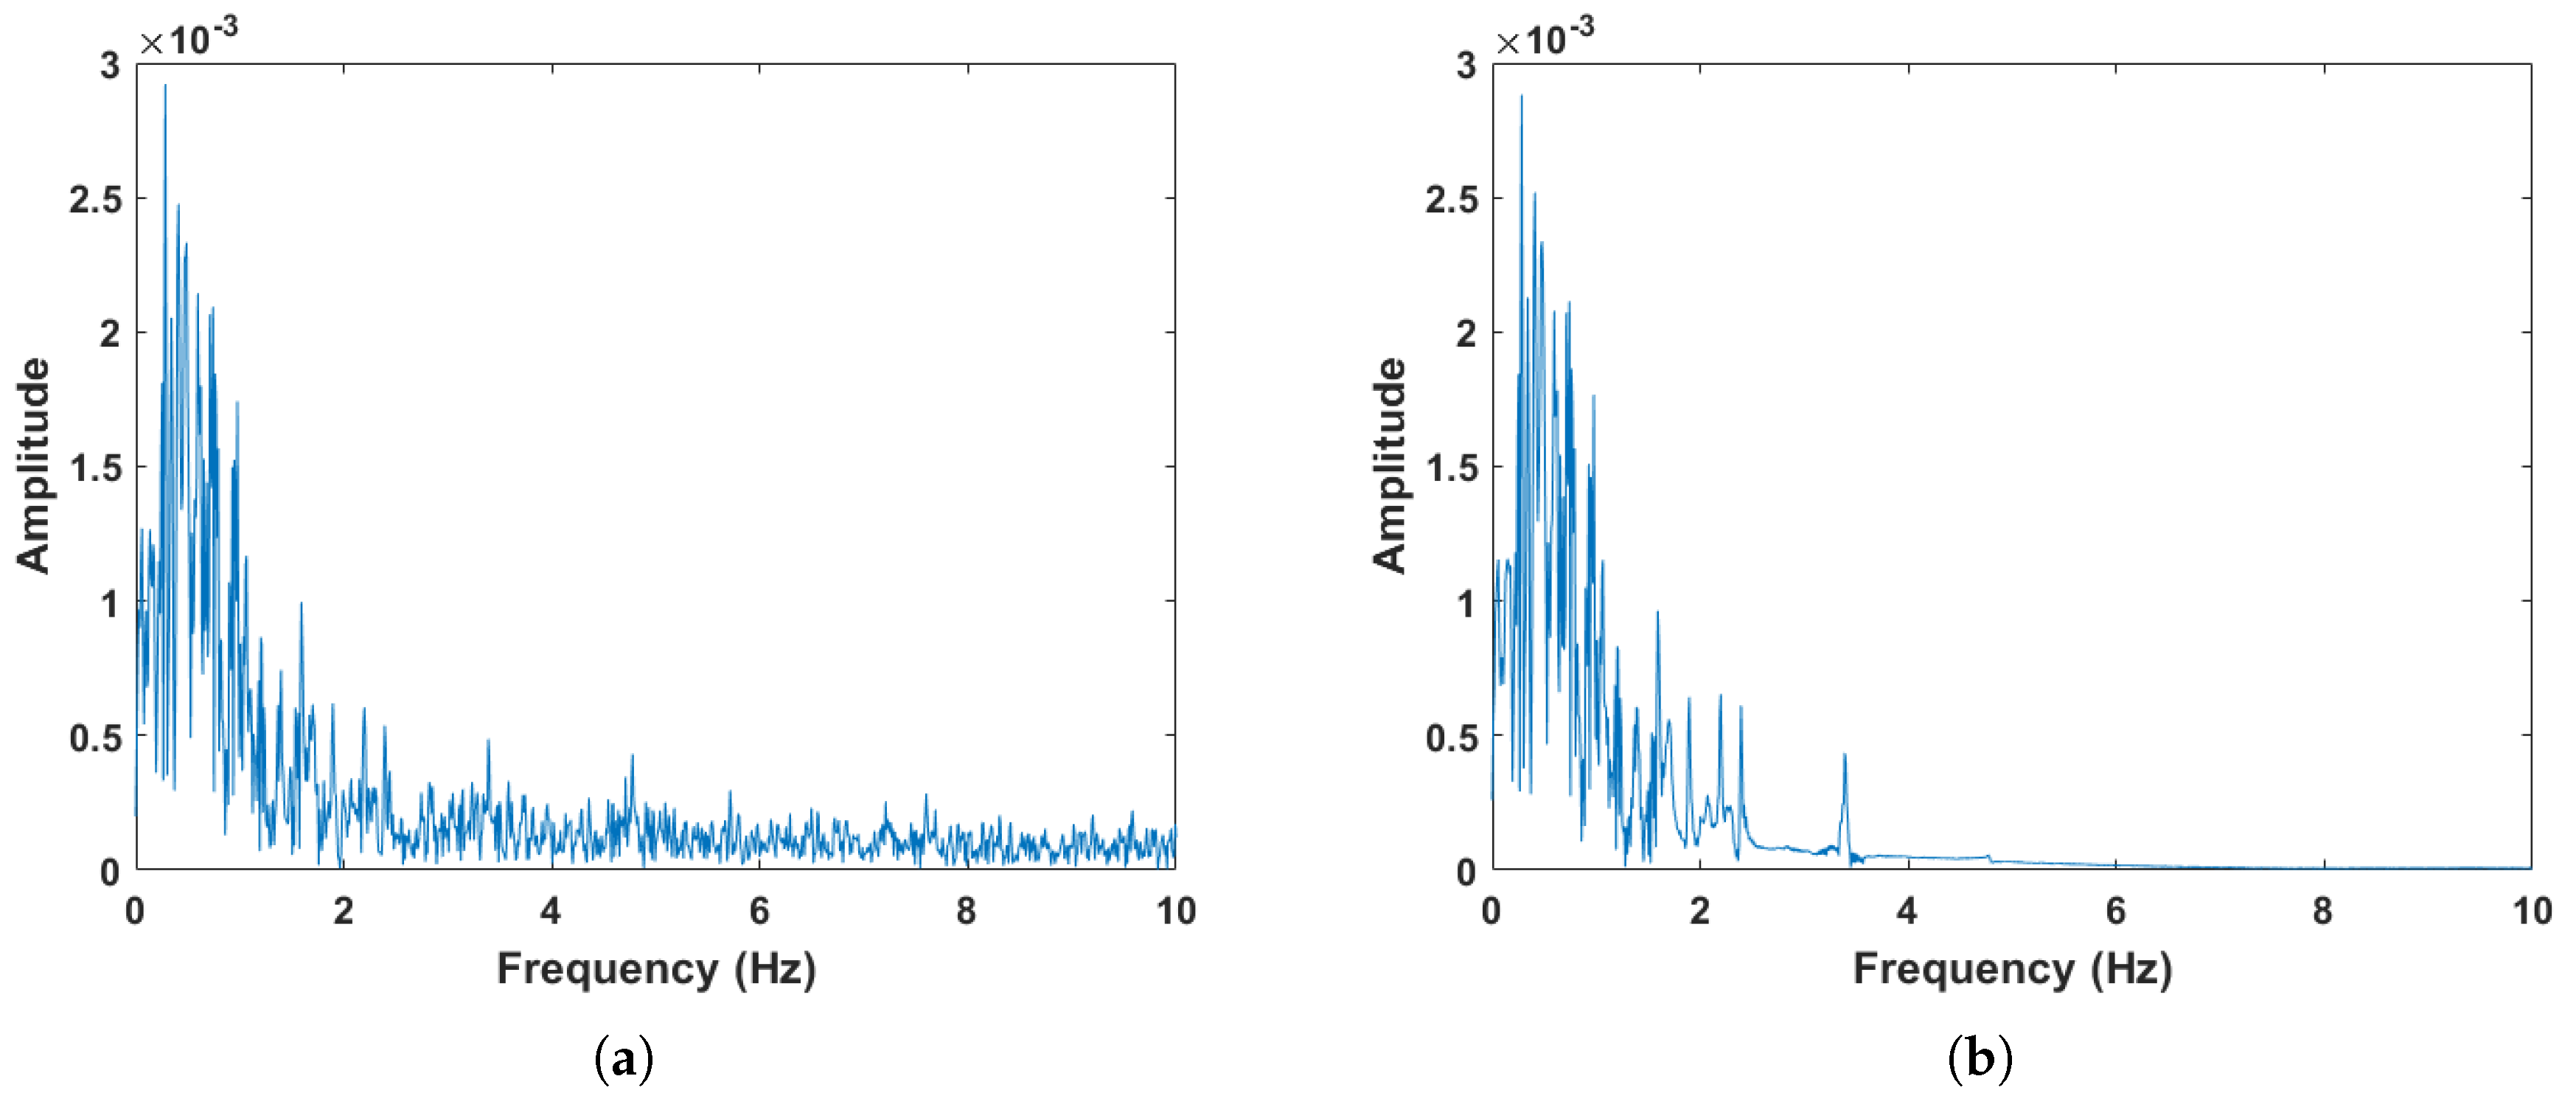
After range-gate selection, the signal is analyzed using SSA. Figure 8 presents the spectral comparison of the signal before and after the SSA process. As can be seen in Figure 8, the signal reconstructed via SSA shows a significant reduction in noise, and the spectral components of the useful signal become more prominent.
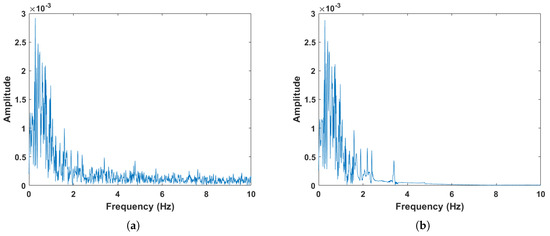
Figure 8.
A comparison of the signal before and after the SSA process. (a) Signal before SSA. (b) Signal after SSA.
After the SSA reconstructed signal passes through a Butterworth filter with a frequency range of 0.2 to 0.6 Hz, the respiratory component can be obtained using VMD. As shown in Figure 9, two IMFs are obtained after VMD decomposition. The RR is determined as the frequency corresponding to the highest peak value among the spectral maxima of the two IMFs, which is 0.28 Hz.
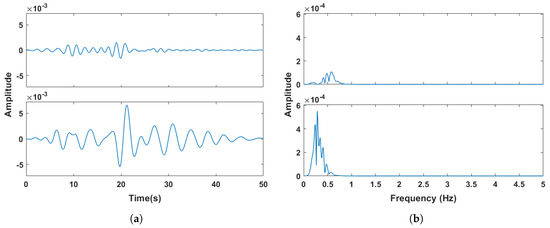
Figure 9.
Candidate respiratory IMFs after VMD. (a) Time-domain spectrum. (b) Frequency-domain spectrum.
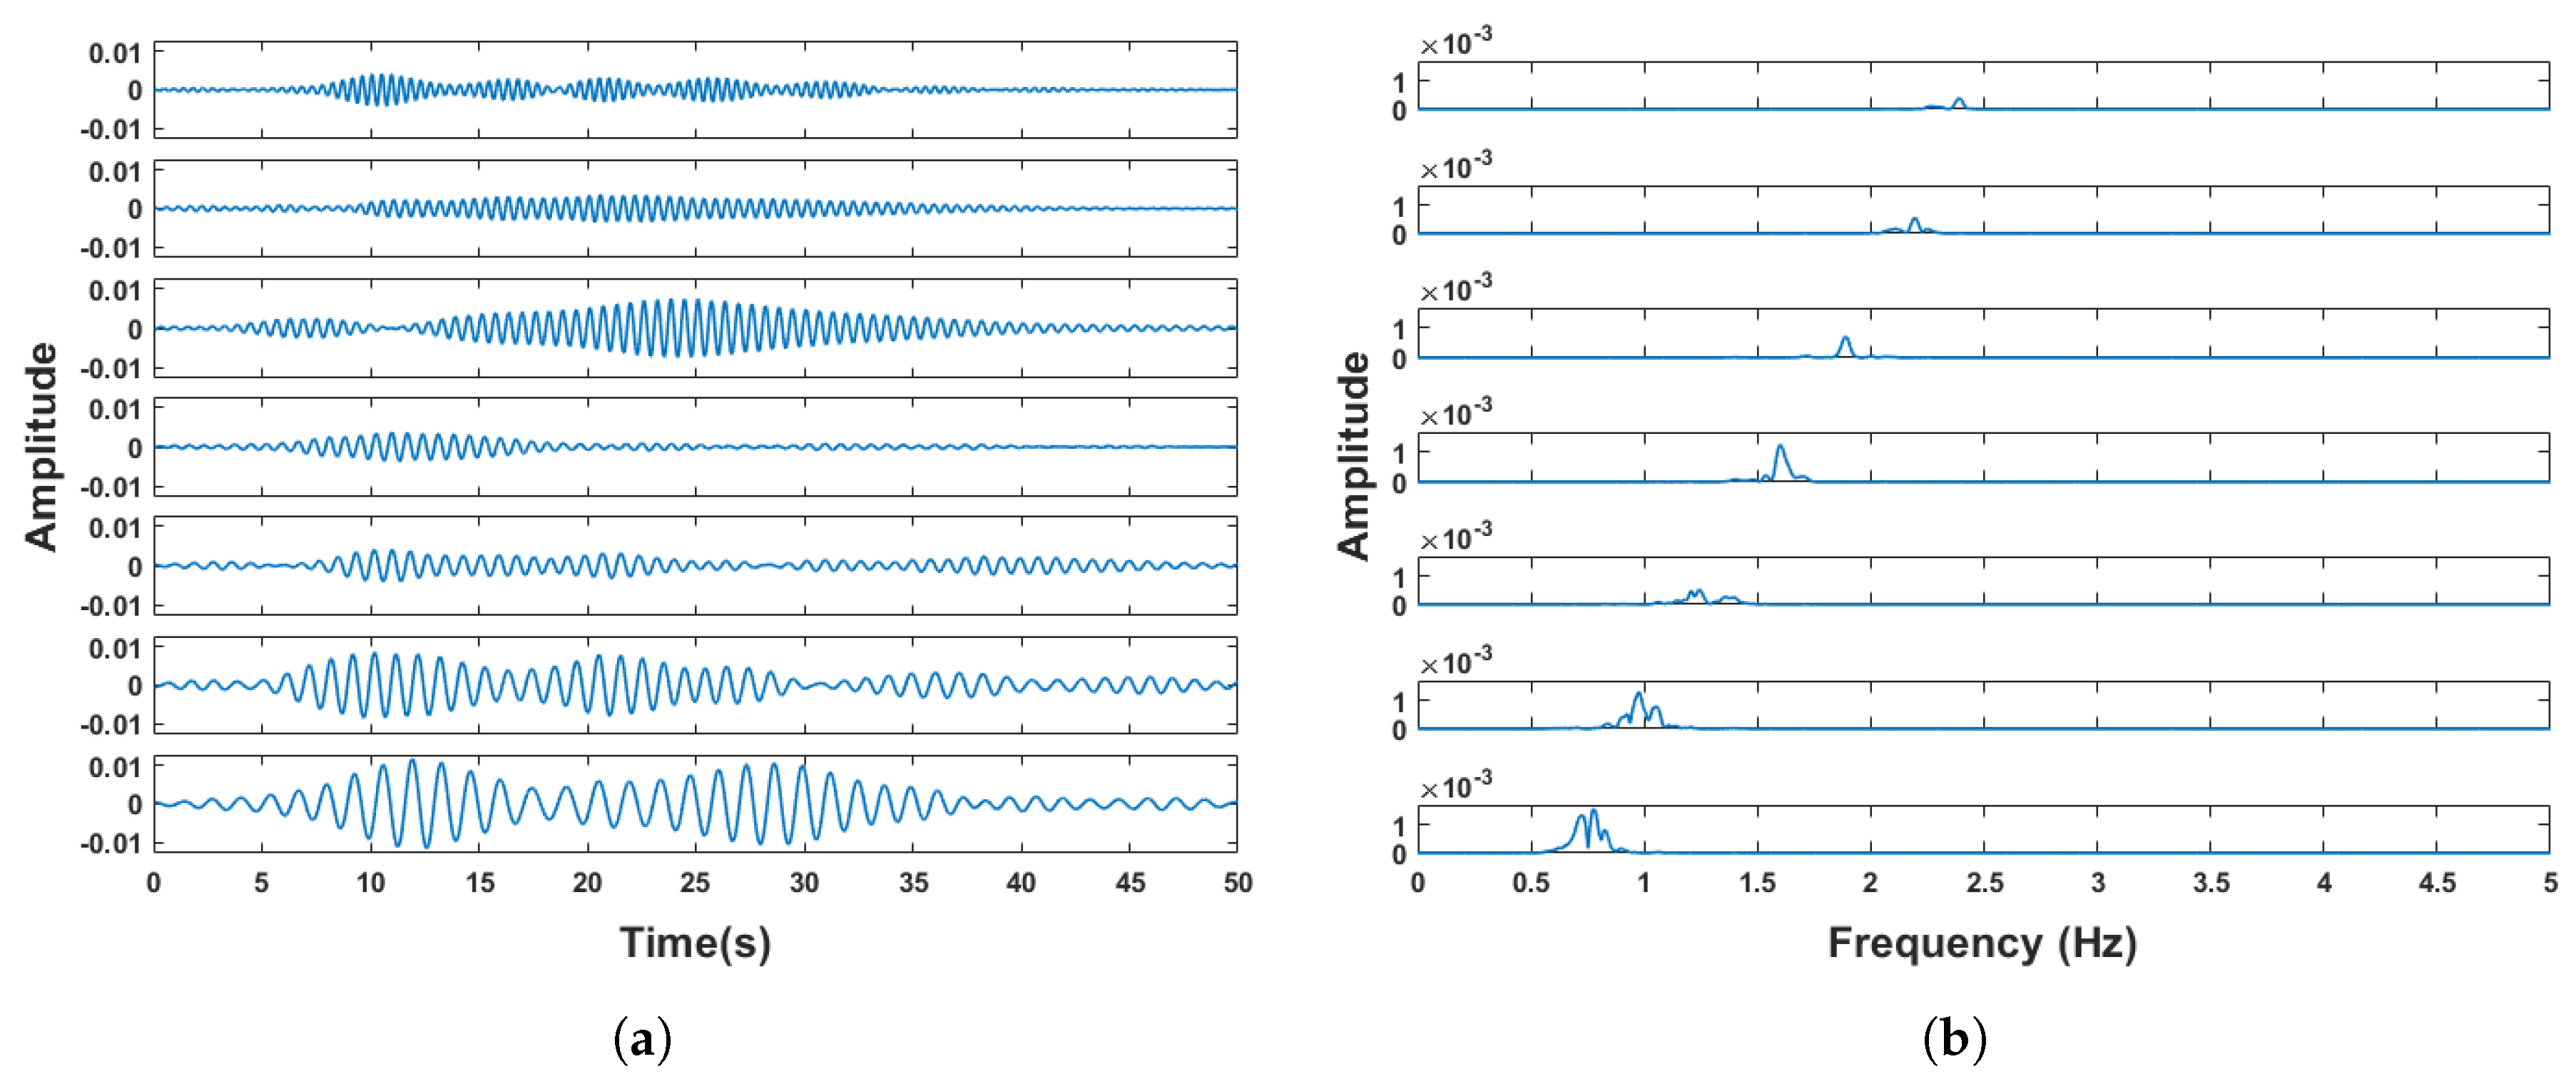
After obtaining the RR, the SSA reconstructed signal is passed through two Butterworth filters of (1.0−RR) to (1.8+2RR) Hz and 2.0 to 3.6 Hz. Then the heartbeats IMFs are obtained using VMD decomposition (Figure 10). The heartbeats IMFs are input into the DFLS and the HR is acquired.
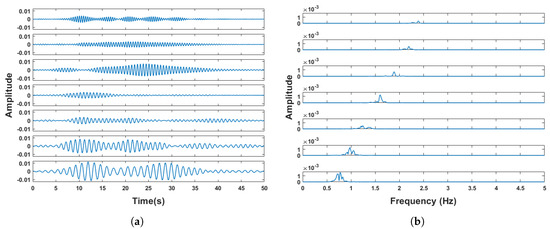
Figure 10.
Candidate heartbeats IMFs after VMD. (a) Time-domain spectrum. (b) Frequency-domain spectrum.
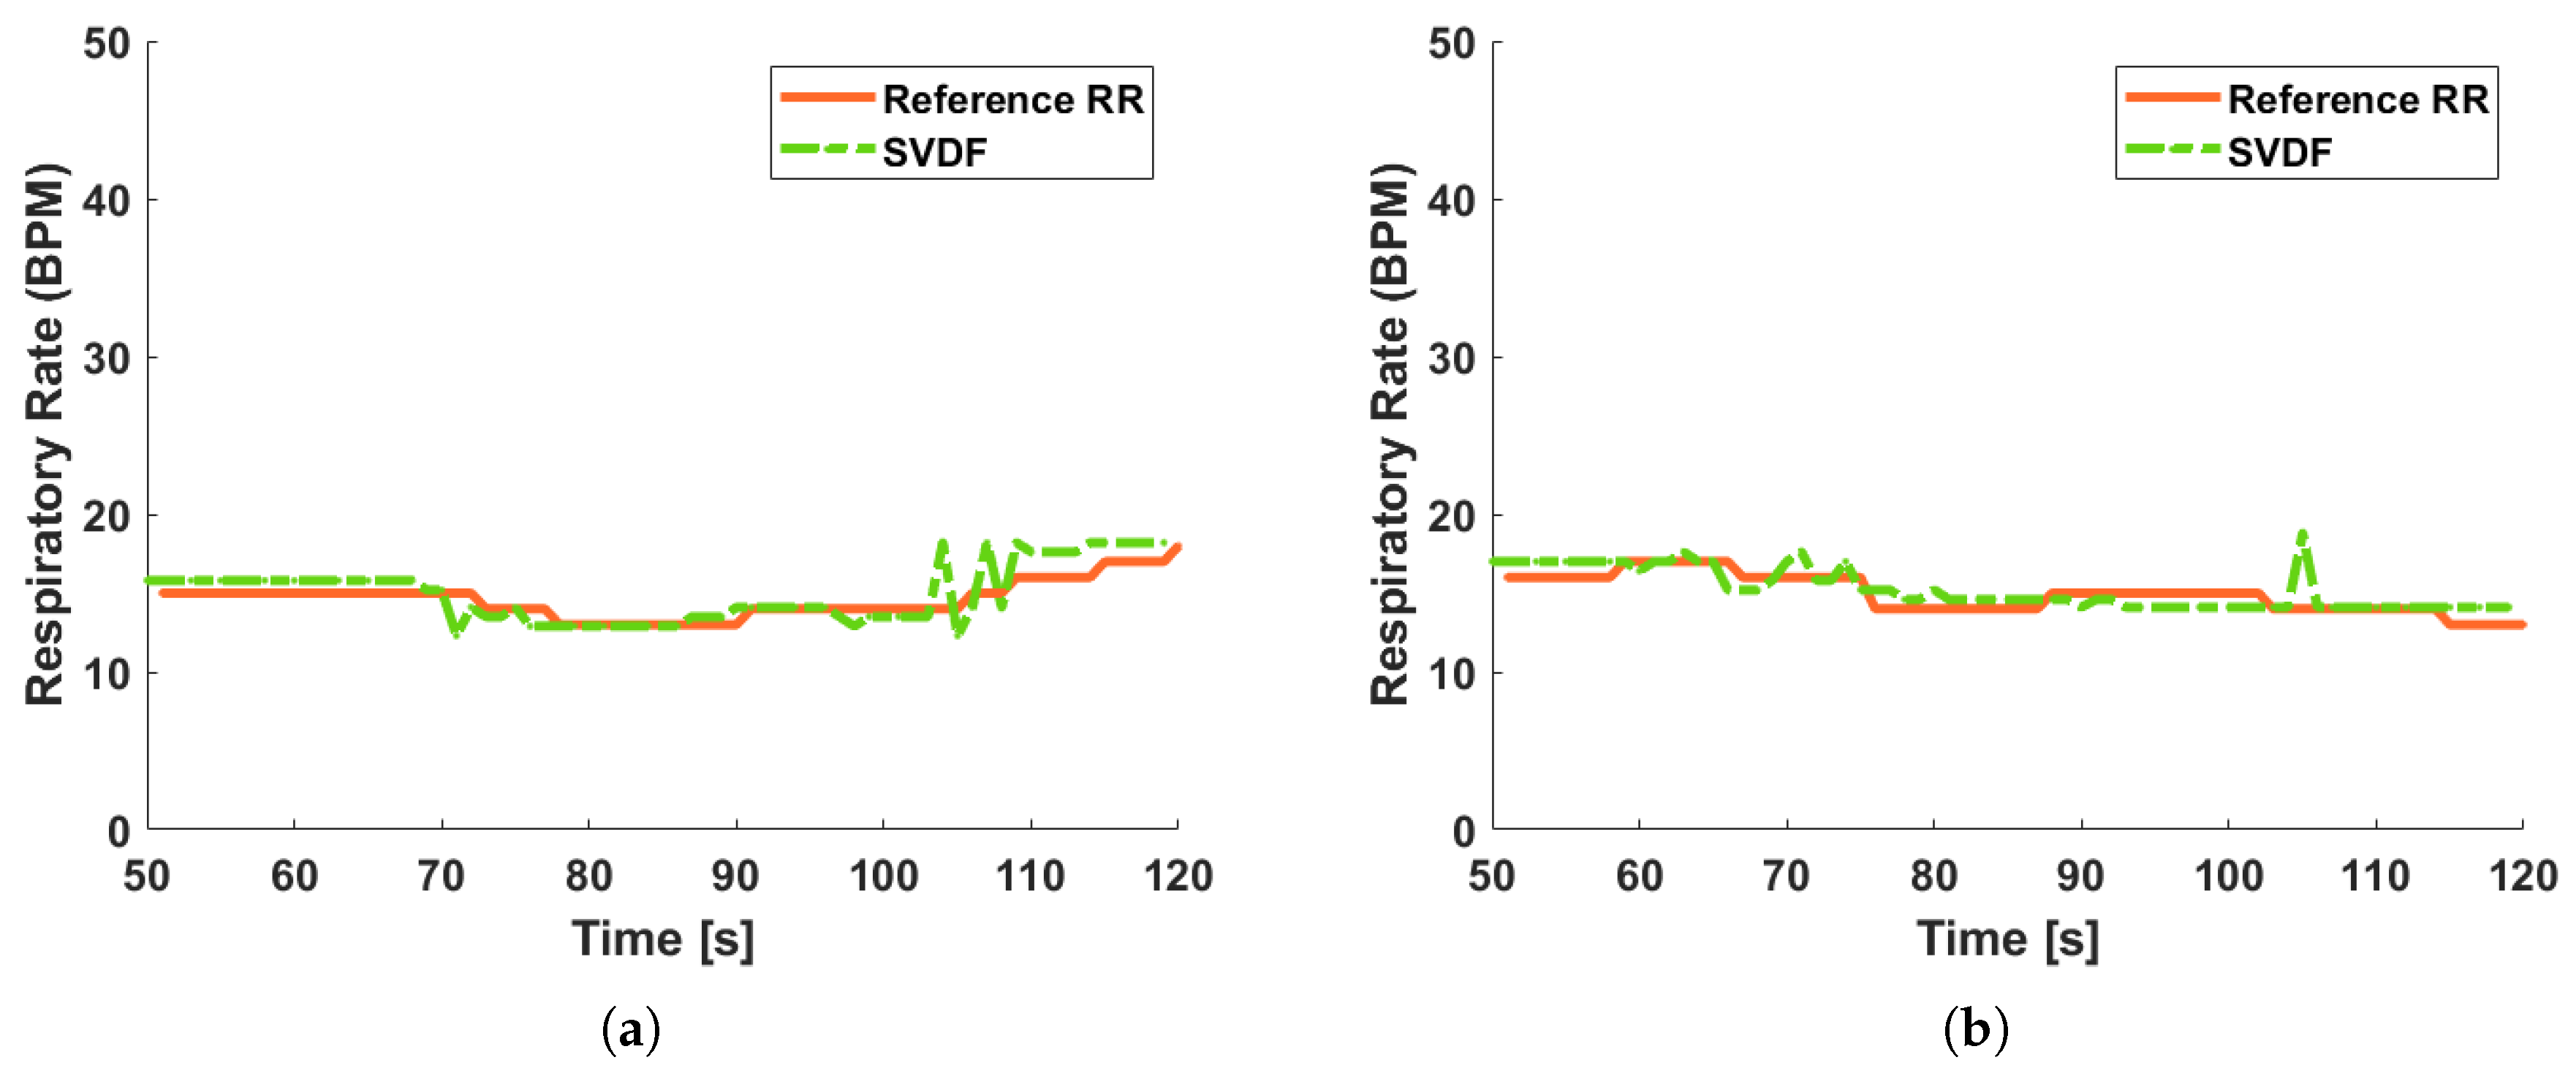
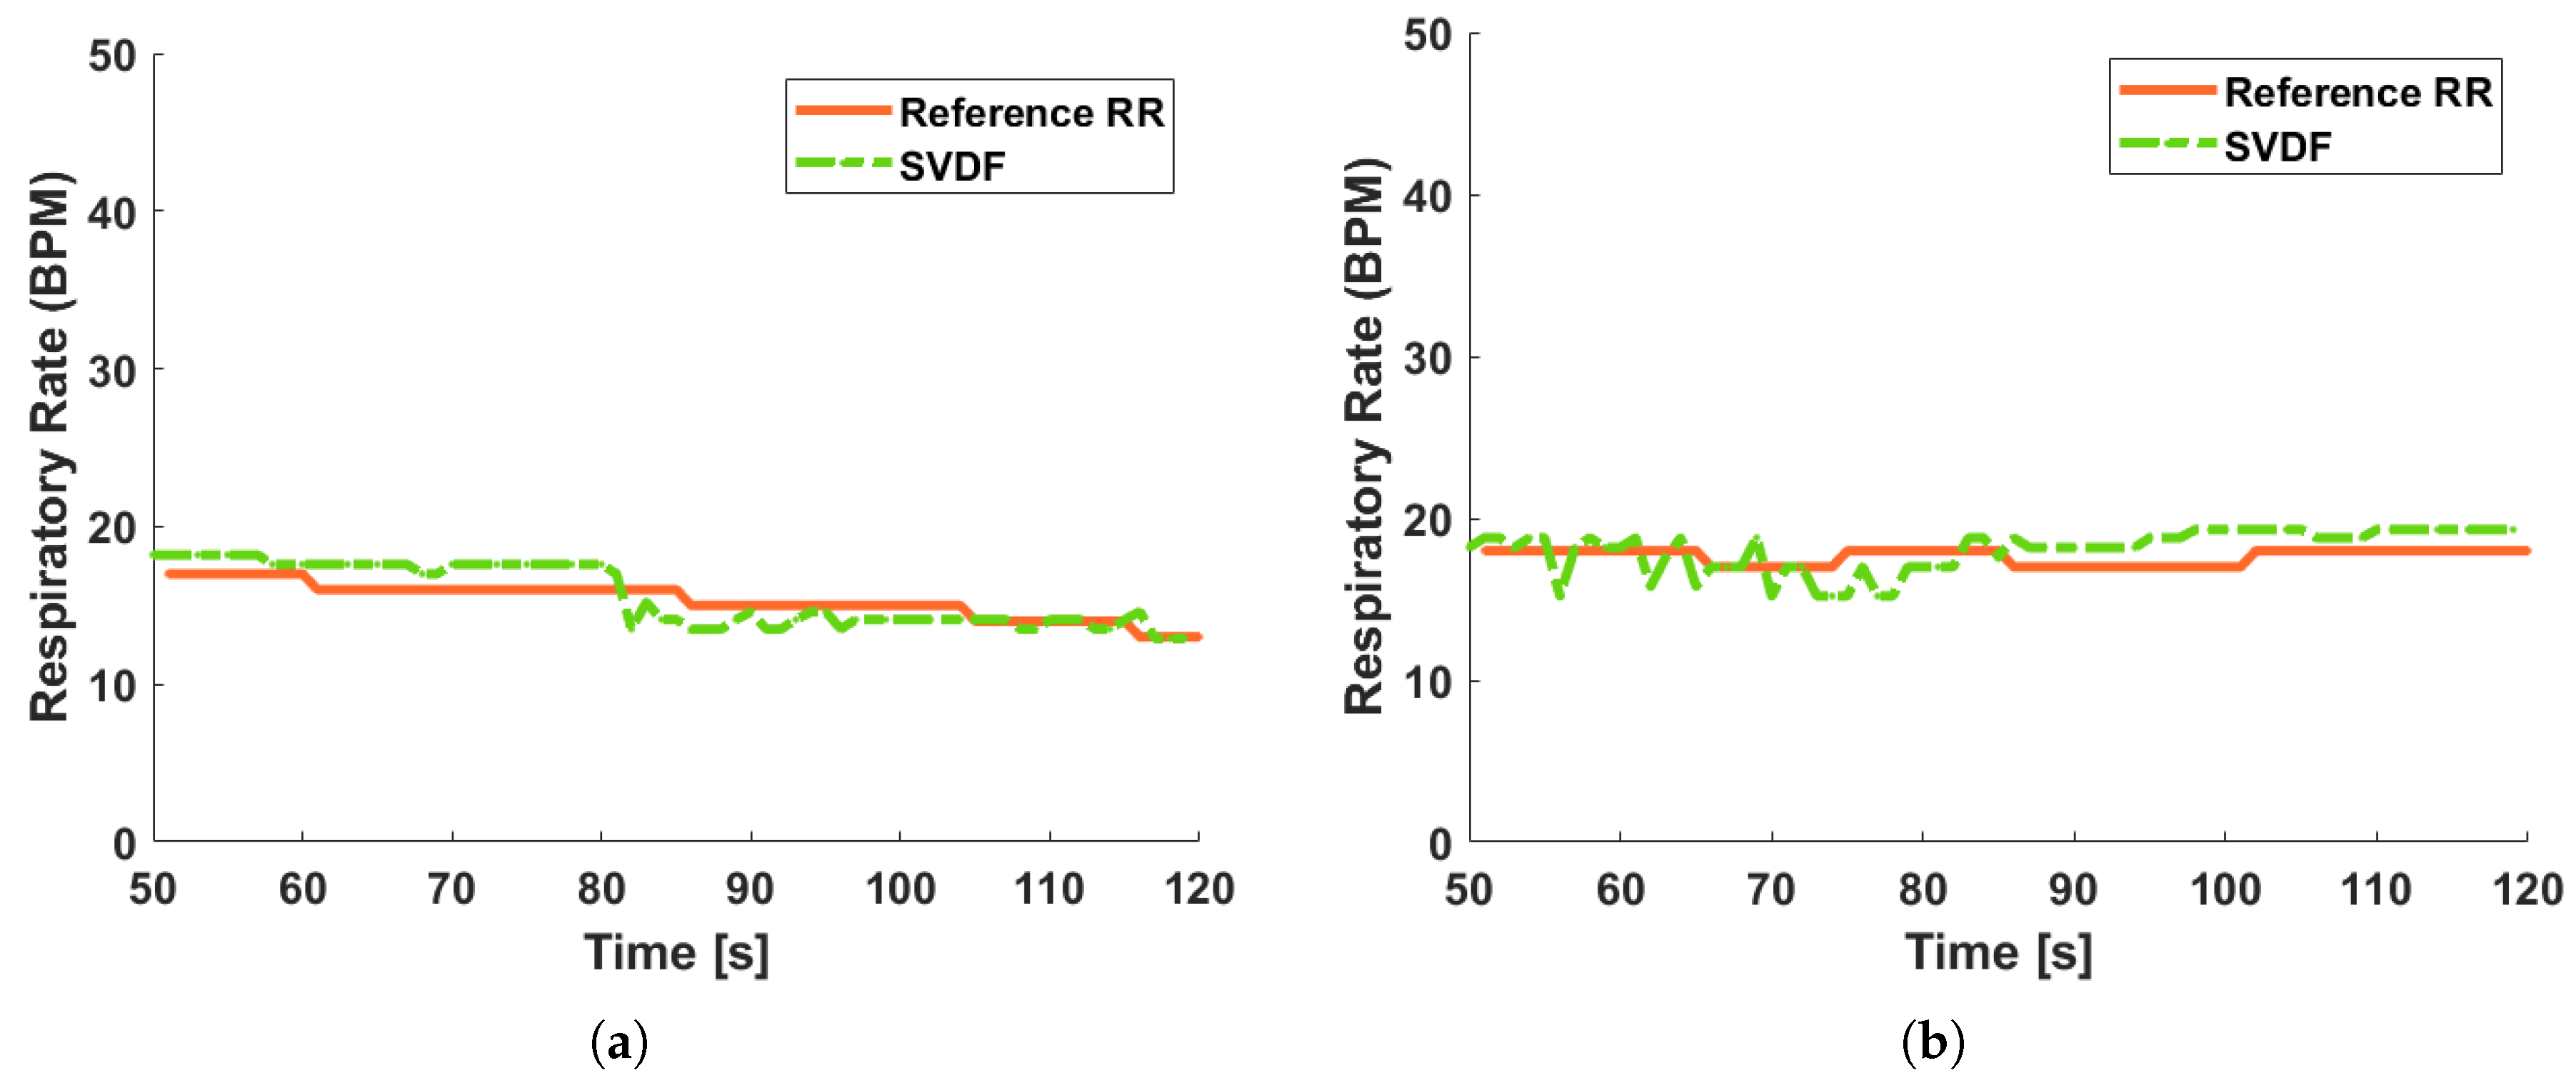
The results of the RR estimation are shown in Figure 11. The accuracy of estimation are shown Table 4. Depending on Table 4, the accuracy of the RR estimation is above 94%.

Figure 11.
The results of RR estimation. (a) At distance of 0.5 m. (b) At distance of 1.0 m.
Table 4.
The Results of RR Estimation.
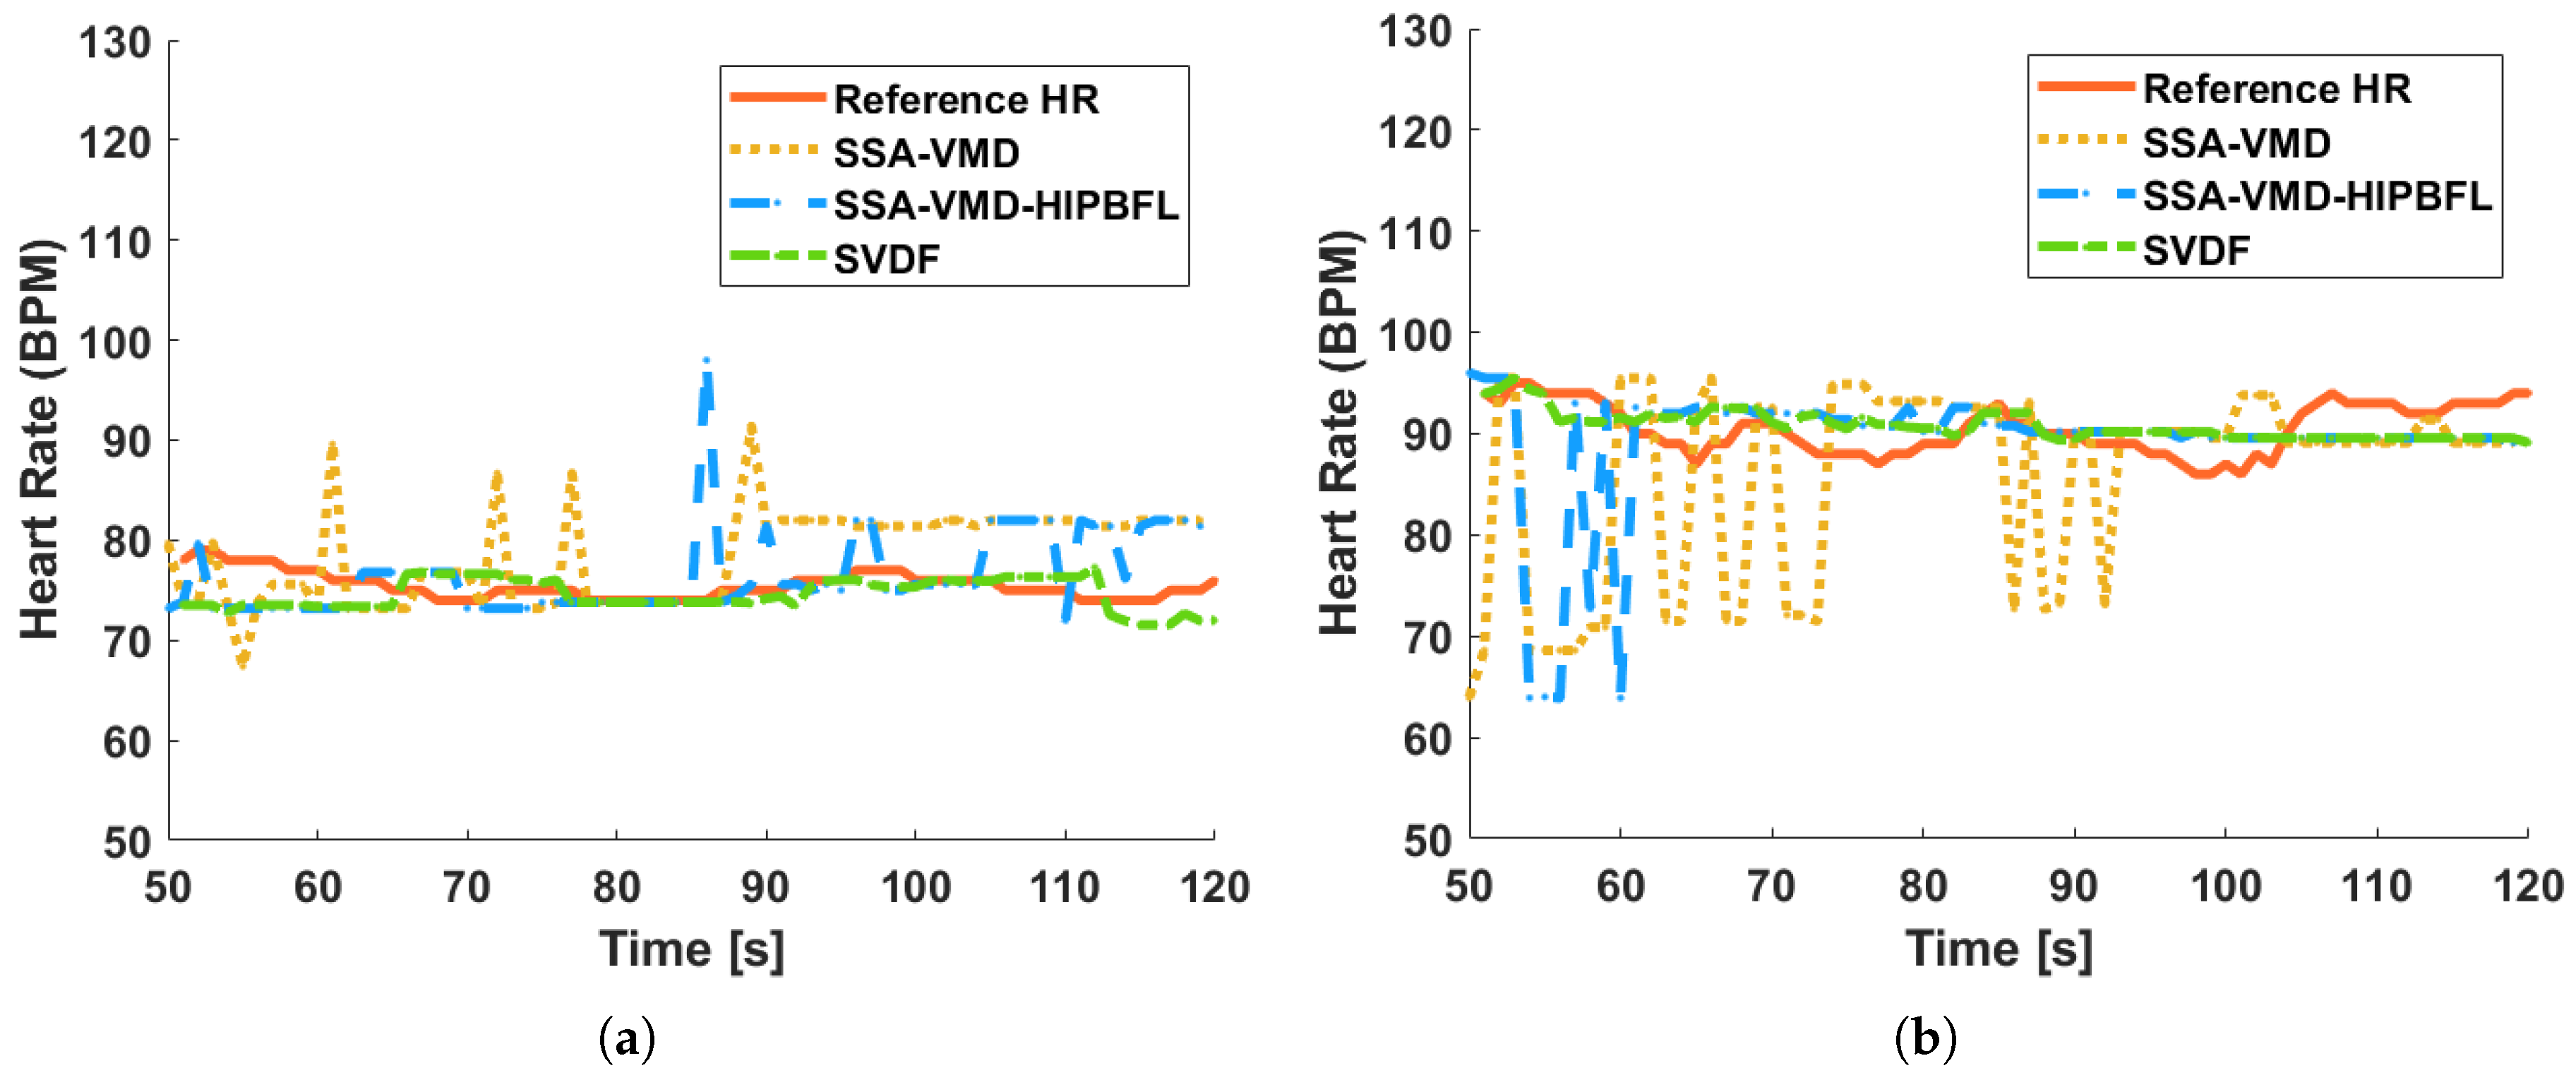
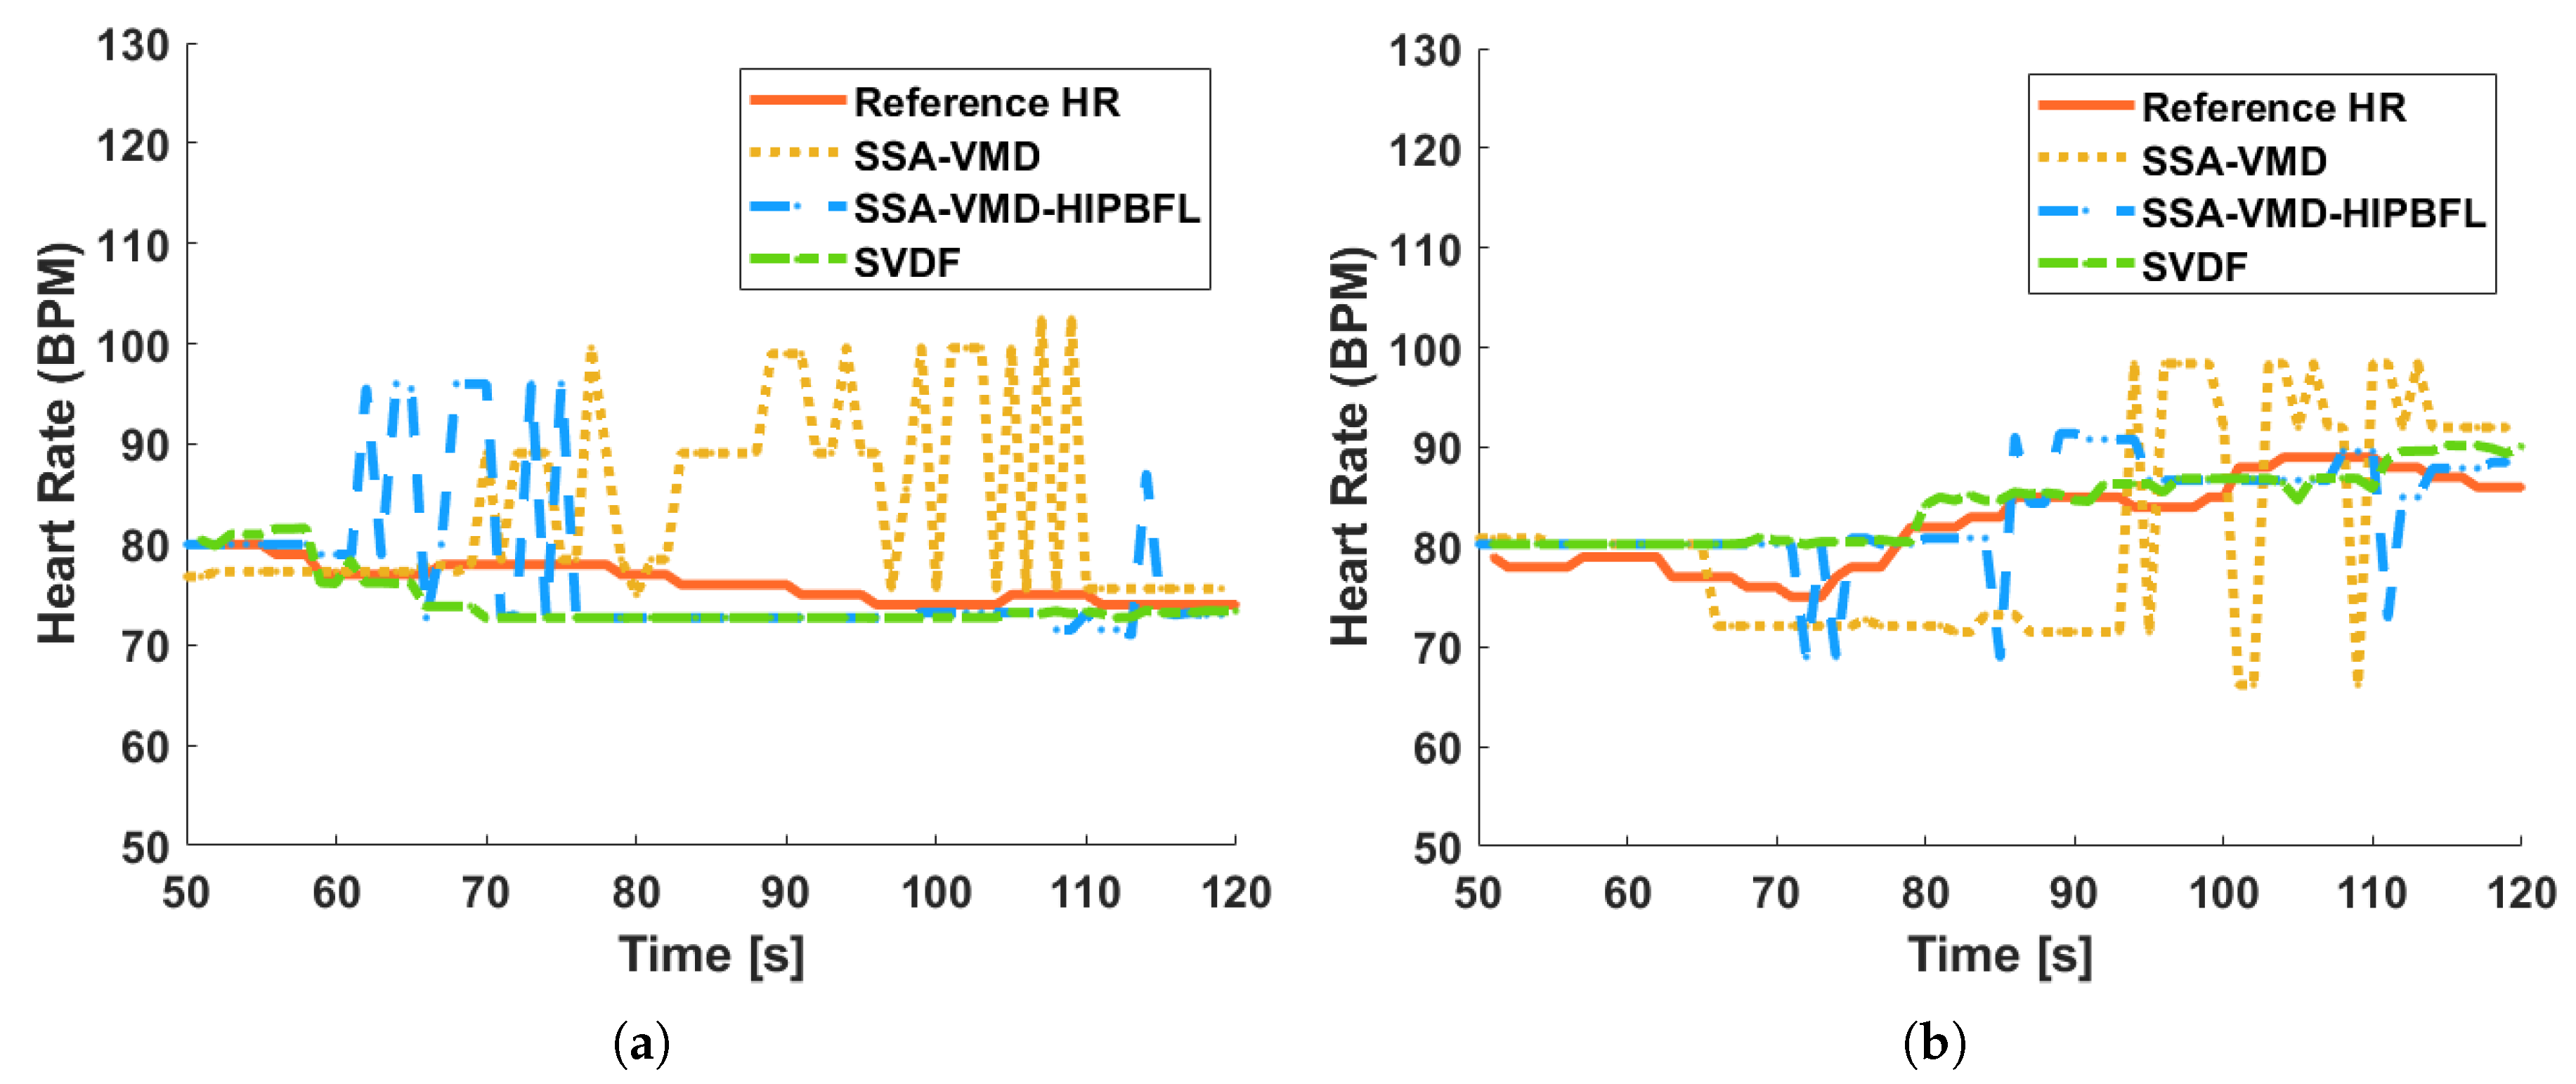
This article employs the SSA-VMD and SSA-VMD-HIPBFL (SVF) algorithms for comparison with the SVDF algorithm, with the aim of contrasting the effect of single or double-layer fuzzy logic processing on the processing results. Figure 12 presents a comparison of the HR estimation results for algorithms SVDF, SVF, and SSA-VMD. The accuracy comparison of estimation for algorithms SVDF, SVF, and SSA-VMD are shown in Table 5.
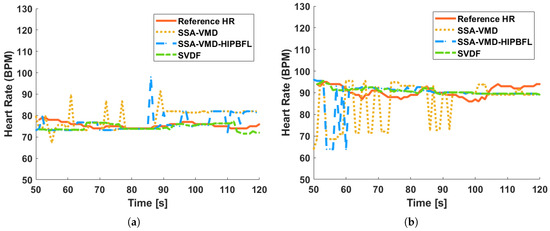
Figure 12.
The results of HR estimation. (a) At distance of 0.5 m. (b) At distance of 1.0 m.
Table 5.
The Results of HR Estimation.
According to Table 5, the performance of the SSA-VMD algorithm is the worst among the three, as it does not employ post-processing strategies. The HR error estimated via the SSA-VMD algorithm is approximately 11%. However, the SSA-VMD-HIPBFL employs a single layer of fuzzy logic in post-processing, which does not achieve the same level of refinement in signal modal decomposition as the double fuzzy method. The estimated HR error using the SVF algorithm is between 4 and 10%. By integrating a double fuzzy processing method, the SVDF algorithm can better handle nonlinearities and noise components in heart rate and respiratory frequency signals, thereby improving the precision of signal separation. The advantage of the SVDF algorithm over the SVF algorithm is that it can correct larger HR estimation errors from SVF by combining real-time velocity with historical information, thereby achieving higher accuracy. The accuracy of HR estimation with SVDF is over 96%. When the distance between the participant and the radar is 0.5 m, the HR estimation accuracy is higher than when the distance between the participant and the radar is 1 m. Although the accuracy of the estimation decreases with increasing distance, the results still retain a high level of accuracy. Compared with the SSA-VMD and SVF algorithms, the SVDF algorithm produces results with higher accuracy and better robustness.
4.3. 45° Orientation Detection at Different Distances
As shown in Figure 13, the UWB radar is positioned at a 45-degree angle to the participant’s chest during the experiment. Processing the received UWB radar signal in the same way as described in the previous chapter, the estimations for HR and RR are acquired.

Figure 13.
The experimental scenario.
The results of RR estimation and HR estimation are shown in Figure 14 and Figure 15, respectively. The accuracy of RR estimation and HR estimation are shown in Table 6 and Table 7, respectively. As can be seen from Figure 14 and Table 6, though there is a deviation between the radar radiation direction and the orientation of the participator, the SVDF still maintains an accuracy of nearly 93% in RR estimation.

Figure 14.
The results of RR estimation. (a) At distance of 0.5 m. (b) At distance of 1.0 m.
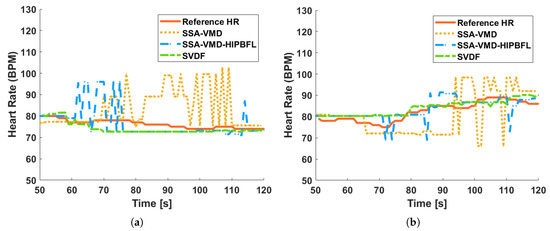
Figure 15.
The results of HR estimation. (a) At distance of 0.5 m. (b) At distance of 1.0 m.
Table 6.
The Results of RR Estimation.
Table 7.
The Results of HR Estimation.
According to the presentation in Figure 15 and Table 7, the accuracy of HR estimation with SVDF remains above 95% even under weak signal conditions at 45°. Compared with algorithms SVF and SSA-VMD, the algorithm SVDF still has the advantages in HR estimation under this challenging environment.
As demonstrated in Figure 15b, the SVDF algorithm exhibits superior tracking capability for heart rate variations. During the initial data collection period from 50 to 80 s, the participant maintained relatively stable heart rates. Subsequently, during the interval between 80 and 120 s, the proposed algorithm accurately captured a significant sustained increase in heart rate. These findings provide compelling evidence for the robust dynamic heart rate monitoring performance of the SVDF algorithm.
The experimental results and theoretical analysis demonstrate that the UWB radar-based vital sign monitoring system incorporating the SVDF algorithm achieves robust heart rate and respiratory rate detection across varying measurement distances and angles, with the angle coverage of the system reaching up to 90° ([−45°, 45°]). Meanwhile, the system exhibits strong resistance to interference from individual differences (including gender, age, and body type) and environmental factors (such as the material and thickness of the clothing). Compared to traditional SVF and SSA-VMD approaches, the SVDF algorithm’s distinctive dual-layer fuzzy logic architecture provides superior measurement accuracy by implementing a secondary error correction mechanism that refines the first-layer output. This innovative design overcomes the limitations of conventional methods like SSA-VMD, which relies on direct spectral peak estimation without post-processing, resulting in significantly enhanced anti-interference capabilities and detection precision. These technical advantages establish the SVDF algorithm as an exceptionally reliable solution for non-contact vital sign monitoring in real-world scenarios.
5. Conclusions
In this paper, a novel algorithm called SVDF is proposed to estimate HR and RR depending on the received UWB radar signal. The SVDF algorithm not only has the ability to effectively extract HR and RR from numerous interferences, but also provides highly smooth and accurate HR estimation in a short period of time. The SVDF algorithm, when applied to data obtained from tests with the radar directly toward the participant, achieves an average RR extraction accuracy exceeding 94% within a range of 1 m and an average HR extraction accuracy exceeding 96% within a range of 1 m. Furthermore, when the UWB radar is positioned at a 45-degree angle to the participant within 1 m, RR estimation with SVDF still maintains an accuracy of nearly 93% and HR estimation accuracy with SVDF still above 95% which means the angle coverage of the UWB radar HR and RR monitoring system with the SVDF algorithm can reach 90°. The SSA-VMD and SVF algorithms are compared with the SVDF algorithm, with the aim of contrasting the effect of single or double-layer fuzzy logic processing on the processing results. Compared with algorithms SVF and SSA-VMD, the SVDF algorithm delivers results with higher accuracy and better robustness.
However, the current study has certain limitations, as the proposed SVDF algorithm performs excellently primarily in stationary conditions with no obstacles between the radar and the participant. Future research will focus on expanding the algorithm’s applicability to more complex environments, such as non-stationary states like walking or exercising, and will explore through-wall detection scenarios. Additionally, efforts will be made to integrate this technology into home monitoring systems, enhancing its practicality for continuous health tracking in real-world settings. UWB radar-based vital sign monitoring also holds broader application potential, including remote patient monitoring in hospitals, elderly care, sleep studies, and driver fatigue detection.
Author Contributions
Conceptualization, J.L., W.Z., Z.X. and Y.W.; methodology, J.L., W.Z., Z.X. and Y.W.; software, Z.D.; validation, W.Z., C.Y. and C.T.; formal analysis, W.Z.; investigation, J.L. and C.T.; resources, J.L. and C.T.; data curation, W.Z. and C.Y.; writing—original draft preparation, W.Z. and C.Y.; writing—review and editing, W.Z., C.Y., C.T. and J.L.; visualization, Z.D.; supervision, J.L. and C.T.; project administration, J.L. and C.T.; funding acquisition, J.L. and C.T. All authors have read and agreed to the published version of the manuscript.
Funding
This research was funded by the Guangxi Major Science and Technology Project (AA22068059) and General Program of Guangdong Natural Science Foundation (2024A1515012140).
Institutional Review Board Statement
The study was conducted in accordance with the Declaration of Helsinki, and the protocol was approved by the Ethics Committee of Guilin University of Electronic Technology on 26 September 2024.
Informed Consent Statement
Informed consent for participation was obtained from all subjects involved in the study.
Data Availability Statement
Data available on request due to restrictions.
Conflicts of Interest
The authors declare no conflict of interest.
References
- Kebe, M.; Gadhafi, R.; Mohammad, B.; Sanduleanu, M.; Saleh, H.; Al-Qutayri, M. Human vital signs detection methods and potential using radars: A review. Sensors 2020, 20, 1454. [Google Scholar] [CrossRef] [PubMed]
- Fang, K.; Wang, W.; Woźniak, M.; Zhang, Q.; Yu, K.; Chen, J.; Tolba, A.; Zhang, L. Guest Editorial AI-Empowered Internet of Things for Data-Driven Psychophysiological Computing and Patient Monitoring. IEEE J. Biomed. Health Inform. 2024, 28, 2496–2499. [Google Scholar] [CrossRef]
- Wilding, M.; Ischebeck, A.; Zaretskaya, N. Respiration recording for fMRI: Breathing belt versus spine coil sensor. Imaging Neurosci. 2024, 2, 1–11. [Google Scholar] [CrossRef]
- Sun, H.; Ganglberger, W.; Panneerselvam, E.; Leone, M.J.; Quadri, S.A.; Goparaju, B.; Tesh, R.A.; Akeju, O.; Thomas, R.J.; Westover, M.B. Sleep staging from electrocardiography and respiration with deep learning. Sleep 2020, 43, zsz306. [Google Scholar] [CrossRef] [PubMed]
- Sel, K.; Brown, A.; Jang, H.; Krumholz, H.M.; Lu, N.; Jafari, R. A wrist-worn respiration monitoring device using bio-impedance. In Proceedings of the 2020 42nd Annual International Conference of the IEEE Engineering in Medicine & Biology Society (EMBC), Montreal, QC, Canada, 20–24 July 2020; pp. 3989–3993. [Google Scholar]
- Li, L.; Tan, A.E.C.; Jhamb, K.; Rambabu, K. Buried object characterization using ultra-wideband ground penetrating radar. IEEE Trans. Microw. Theory Tech. 2012, 60, 2654–2664. [Google Scholar] [CrossRef]
- Liu, J. Research on Application of UWB Wireless Communication System Based on Multi-antenna Array in Mine Emergency Rescue. In Proceedings of the 2019 Cross Strait Quad-Regional Radio Science and Wireless Technology Conference (CSQRWC), Taiyuan, China, 18–21 July 2019; pp. 1–3. [Google Scholar]
- Tian, B.; Liu, W.; Mo, H.; Li, W.; Wang, Y.; Adhikari, B.R. Detecting the unseen: Understanding the mechanisms and working principles of earthquake sensors. Sensors 2023, 23, 5335. [Google Scholar] [CrossRef] [PubMed]
- Džunda, M.; Dzurovčin, P.; Kal’avskỳ, P.; Korba, P.; Cséfalvay, Z.; Hovanec, M. The UWB radar application in the aviation security systems. Appl. Sci. 2021, 11, 4556. [Google Scholar] [CrossRef]
- Forcier, B. Unattended wireless proximity sensor networks for counterterrorism, force protection, littoral environments, PHM, and tamper monitoring ground applications. In Proceedings of the Unattended Ground Sensor Technologies and Applications V, Orlando, FL, USA, 21–25 April 2003; Volume 5090, pp. 485–492. [Google Scholar]
- Lande, T.S.; Hjortland, H.A. Impulse Radio technology for Biomedical applications. In Proceedings of the 2007 IEEE Biomedical Circuits and Systems Conference, Montreal, QC, Canada, 27–30 November 2007; pp. 67–70. [Google Scholar]
- Dragomiretskiy, K.; Zosso, D. Variational mode decomposition. IEEE Trans. Signal Process. 2013, 62, 531–544. [Google Scholar] [CrossRef]
- Duan, Z.; Liang, J. Non-contact detection of vital signs using a UWB radar sensor. IEEE Access 2018, 7, 36888–36895. [Google Scholar] [CrossRef]
- Zhang, X.; Liu, Z.; Kong, Y.; Li, C. Mutual interference suppression using signal separation and adaptive mode decomposition in noncontact vital sign measurements. IEEE Trans. Instrum. Meas. 2021, 71, 4001015. [Google Scholar] [CrossRef]
- Pan, T.; Guo, Y.; Guo, W.; Kang, C. Detection of vital sign based on UWB radar by a time domain coherent accumulation method. IEEE Sens. J. 2023, 23, 17054–17063. [Google Scholar] [CrossRef]
- Yu, H.; Huang, W.; Du, B. SSA-VMD for UWB radar sensor vital sign extraction. Sensors 2023, 23, 756. [Google Scholar] [CrossRef] [PubMed]
- Li, J.; Guo, S.; Cui, G.; Zhou, X.; Shi, L.; Kong, L.; Yang, X. Multidomain separation for human vital signs detection with fmcw radar in interference environment. IEEE Trans. Microw. Theory Tech. 2023, 72, 4278–4293. [Google Scholar] [CrossRef]
- Nguyen, V.; Javaid, A.Q.; Weitnauer, M.A. Harmonic Path (HAPA) algorithm for non-contact vital signs monitoring with IR-UWB radar. In Proceedings of the 2013 IEEE Biomedical Circuits and Systems Conference (BioCAS), Rotterdam, The Netherlands, 31 October–2 November 2013; pp. 146–149. [Google Scholar]
- Nguyen, V.; Javaid, A.Q.; Weitnauer, M.A. Spectrum-averaged Harmonic Path (SHAPA) algorithm for non-contact vital sign monitoring with ultra-wideband (UWB) radar. In Proceedings of the 2014 36th Annual International Conference of the IEEE Engineering in Medicine and Biology Society, Chicago, IL, USA, 26–30 August 2014; pp. 2241–2244. [Google Scholar]
- Zhang, Y.; Li, X.; Qi, R.; Qi, Z.; Zhu, H. Harmonic multiple loop detection (HMLD) algorithm for not-contact vital sign monitoring based on ultra-wideband (UWB) radar. IEEE Access 2020, 8, 38786–38793. [Google Scholar] [CrossRef]
- Jing, F.; Liang, J.; Wang, Y.; Chen, P. Harmonics and intermodulation products-based fuzzy logic (HIPBFL) algorithm for vital sign frequency estimation using a UWB radar. Expert Syst. Appl. 2023, 228, 120294. [Google Scholar] [CrossRef]
- Zadeh, L.A. Fuzzy sets. Inf. Control 1965, 8, 338–353. [Google Scholar] [CrossRef]
- Zadeh, L. A rationale for fuzzy control. In Fuzzy Sets, Fuzzy Logic, and Fuzzy Systems: Selected Papers by Lotfi A Zadeh; World Scientific: Singapore, 1996; pp. 123–126. [Google Scholar]
- Zadeh, L.A. Outline of a new approach to the analysis of complex systems and decision processes. IEEE Trans. Syst. Man Cybern. 1973, SMC-3, 28–44. [Google Scholar] [CrossRef]
- Choi, I.; Kim, M.; Choi, J.; Park, J.; Park, S.; Kim, K. Robust cardiac rate estimation of an individual. IEEE Sens. J. 2021, 21, 15053–15064. [Google Scholar] [CrossRef]
- Wang, Y.; Liang, J. Robust Non-Contact Vital Signs Extraction Based on UWB Radar. In Proceedings of the IGARSS 2024—2024 IEEE International Geoscience and Remote Sensing Symposium, Athens, Greece, 7–12 July 2024; pp. 8472–8476. [Google Scholar]
- Yan, J.; Hong, H.; Zhao, H.; Li, Y.; Gu, C.; Zhu, X. Through-wall multiple targets vital signs tracking based on VMD algorithm. Sensors 2016, 16, 1293. [Google Scholar] [CrossRef] [PubMed]


Disclaimer/Publisher’s Note: The statements, opinions and data contained in all publications are solely those of the individual author(s) and contributor(s) and not of MDPI and/or the editor(s). MDPI and/or the editor(s) disclaim responsibility for any injury to people or property resulting from any ideas, methods, instructions or products referred to in the content. |
© 2025 by the authors. Licensee MDPI, Basel, Switzerland. This article is an open access article distributed under the terms and conditions of the Creative Commons Attribution (CC BY) license (https://creativecommons.org/licenses/by/4.0/).