Article

A Generic Image Steganography Recognition Scheme with Big Data Matching and an Improved ResNet50 Deep Learning Network

1
School of Instrumentation Science and Opto-Electronics Engineering, Beijing Information Science and Technology University, Beijing 102206, China
2
Key Laboratory of Modern Measurement and Control Technology Ministry of Education, Beijing Information Science and Technology University, Beijing 102206, China
3
China Information Technology Security Evaluation Center, Beijing 100085, China
4
College of Automation, Beijing Information Science and Technology University, Beijing 102206, China
*
Author to whom correspondence should be addressed.
These authors contributed equally to this work.
Electronics 2025, 14(8), 1610; https://doi.org/10.3390/electronics14081610
Submission received: 14 March 2025 / Revised: 8 April 2025 / Accepted: 14 April 2025 / Published: 16 April 2025
(This article belongs to the Special Issue AI-Based Solutions for Cybersecurity)

Abstract

:
Image steganalysis has been a key technology in information security in recent years. However, existing methods are mostly limited to the binary classification for detecting steganographic images used in digital watermarking, privacy protection, illicit data concealment, and security images, such as unaltered cover images or surveillance images. They cannot identify the steganography algorithms used in steganographic images, which restricts their practicality. To solve this problem, this paper proposes a general steganography algorithms recognition scheme based on image big data matching with improved ResNet50. The scheme first intercepts the image region with the highest complexity and focuses on the key features to improve the analysis efficiency; subsequently, the original image of the image to be detected is accurately located by the image big data matching technique and the steganographic difference feature image is generated; finally, the ResNet50 is improved by combining the pyramid attention mechanism and the joint loss function, which achieves the efficient recognition of the steganography algorithm. To verify the feasibility and effectiveness of the scheme, three experiments are designed in this paper: verification of the selection of the core analysis region, verification of the image similarity evaluation based on Peak Signal-to-Noise Ratio ( P S N R ), and performance verification of the improved ResNet50 model. The experimental results show that the scheme proposed in this paper outperforms the existing mainstream steganalysis models, such as ZhuNet and YeNet, with a detection accuracy of 96.11%, supports the recognition of six adaptive steganography algorithms, and adapts to the needs of analysis of multiple sizes and image formats, demonstrating excellent versatility and application value.

Graphical Abstract

1. Introduction

Since the emergence of image steganography [1], it has been widely applied in the field of information security, including digital watermarking [2], copyright protection [3], and privacy protection [4], by virtue of the secrecy it exhibits in the process of dissemination. However, steganography is essentially a double-edged sword, and its ability to hide information can be used by lawbreakers to embed secret data in images, which can be used to commit criminal activities such as terrorism, posing a serious threat to national security and public interests [5]. Unruly elements can embed hidden data into images downloaded from the Internet or generated through artificial intelligence, making these doctored images look completely normal. With the advancement of technology, the misuse of steganography is on the rise, further accelerating the spread of harmful information. Therefore, it is particularly important to accurately detect and identify steganographic information in web images and effectively stop the dissemination of illegal content.
As a countermeasure to image steganography, steganalysis analyzes the statistical properties of carrier images, identifies the data hidden in them, determines whether or not there is any embedding of additional information, estimates the information capacity, and even extracts the steganographic content as much as possible [6]. The study of steganalysis plays an integral role in preventing the leakage of sensitive information, combating terrorism and criminal activities, and maintaining the security of the Internet [7,8]. Steganalysis usually consists of three key steps: first, determining whether the target image contains steganographic information, i.e., classifying it and determining whether it is a steganographic image or an ordinary image; second, identifying the steganographic algorithm used for the steganographic image, as well as the location of the hidden information and the embedded cipher capacity; and finally, extracting the secret information from the steganographic image.
However, the functions of most steganalysis methods are only limited to achieving the binary classification task of an image, determining whether an image contains steganographic information or not, while less attention is paid to the identification of steganographic algorithms and further information parsing work such as analyzing the data structure of steganographic data from steganographic images and extracting embedded data. With the increasing complexity of modern steganography techniques, it is difficult to comprehensively deal with the threats posed by steganographic information dissemination in practice by relying only on simple binary classification models. Therefore, the study of high-precision steganalysis models capable of detecting steganographic images while further identifying steganographic algorithms is the key to improving the effectiveness and practicality of steganalysis.
Based on this, this paper proposes a new image steganography algorithm recognition scheme based on image big data matching with improved ResNet50 [9]. By improving ResNet50, its efficiency in capturing feature differences in image steganalysis at different levels and granularities during the feature fusion process can be improved, and category differentiation can be strengthened so as to increase the accuracy and robustness of the steganographic algorithm recognition. Unlike traditional steganalysis methods that only focus on the binary classification task between steganographic images and secure images, the proposed scheme can not only accurately detect whether an image contains steganographic information, but also further identify the steganographic algorithms used in the steganographic image. Specifically, this scheme extracts the cryptographic difference features between the image to be tested and its original image through big data matching analysis and achieves accurate recognition of cryptographic algorithms with the help of a deep learning model based on improved ResNet50. The significant advantages of this scheme are its strong adaptability, its ability to handle images of various sizes and formats, its ability to accurately locate the embedded position of steganographic information, its support for multiple steganographic algorithms in the spatial and frequency domains, and its excellent performance in steganography detection and algorithm recognition accuracy.
The contributions of this paper are summarized as follows:
(1)
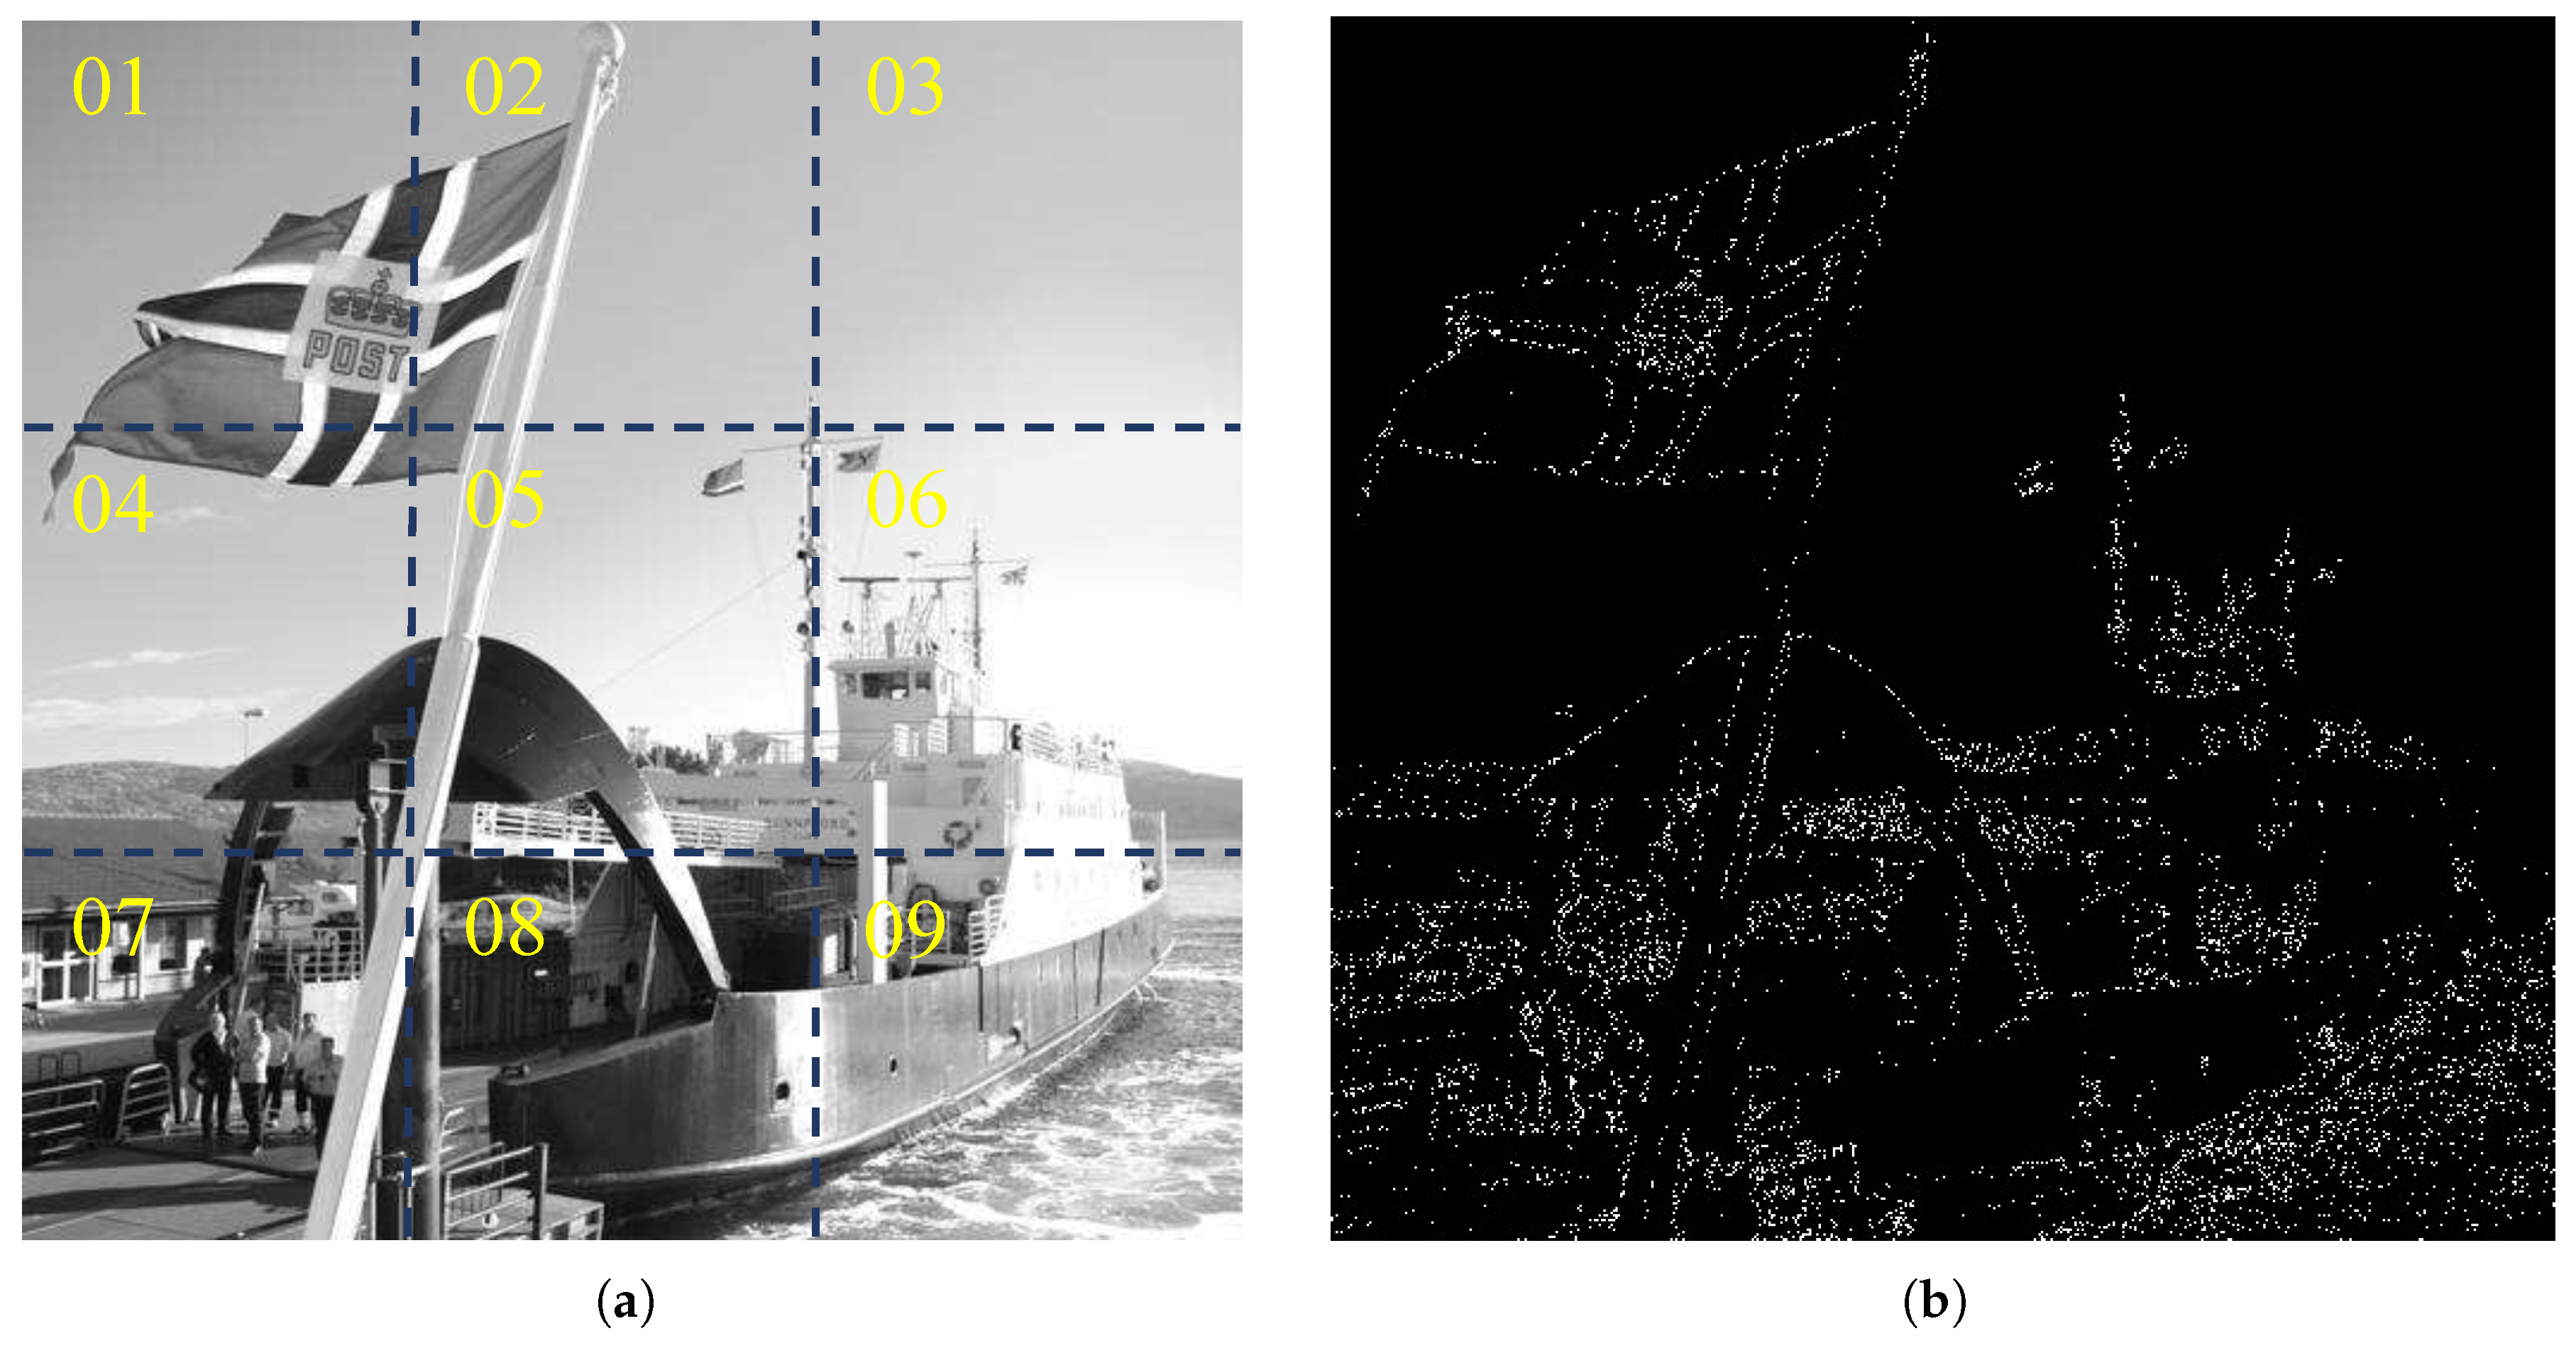
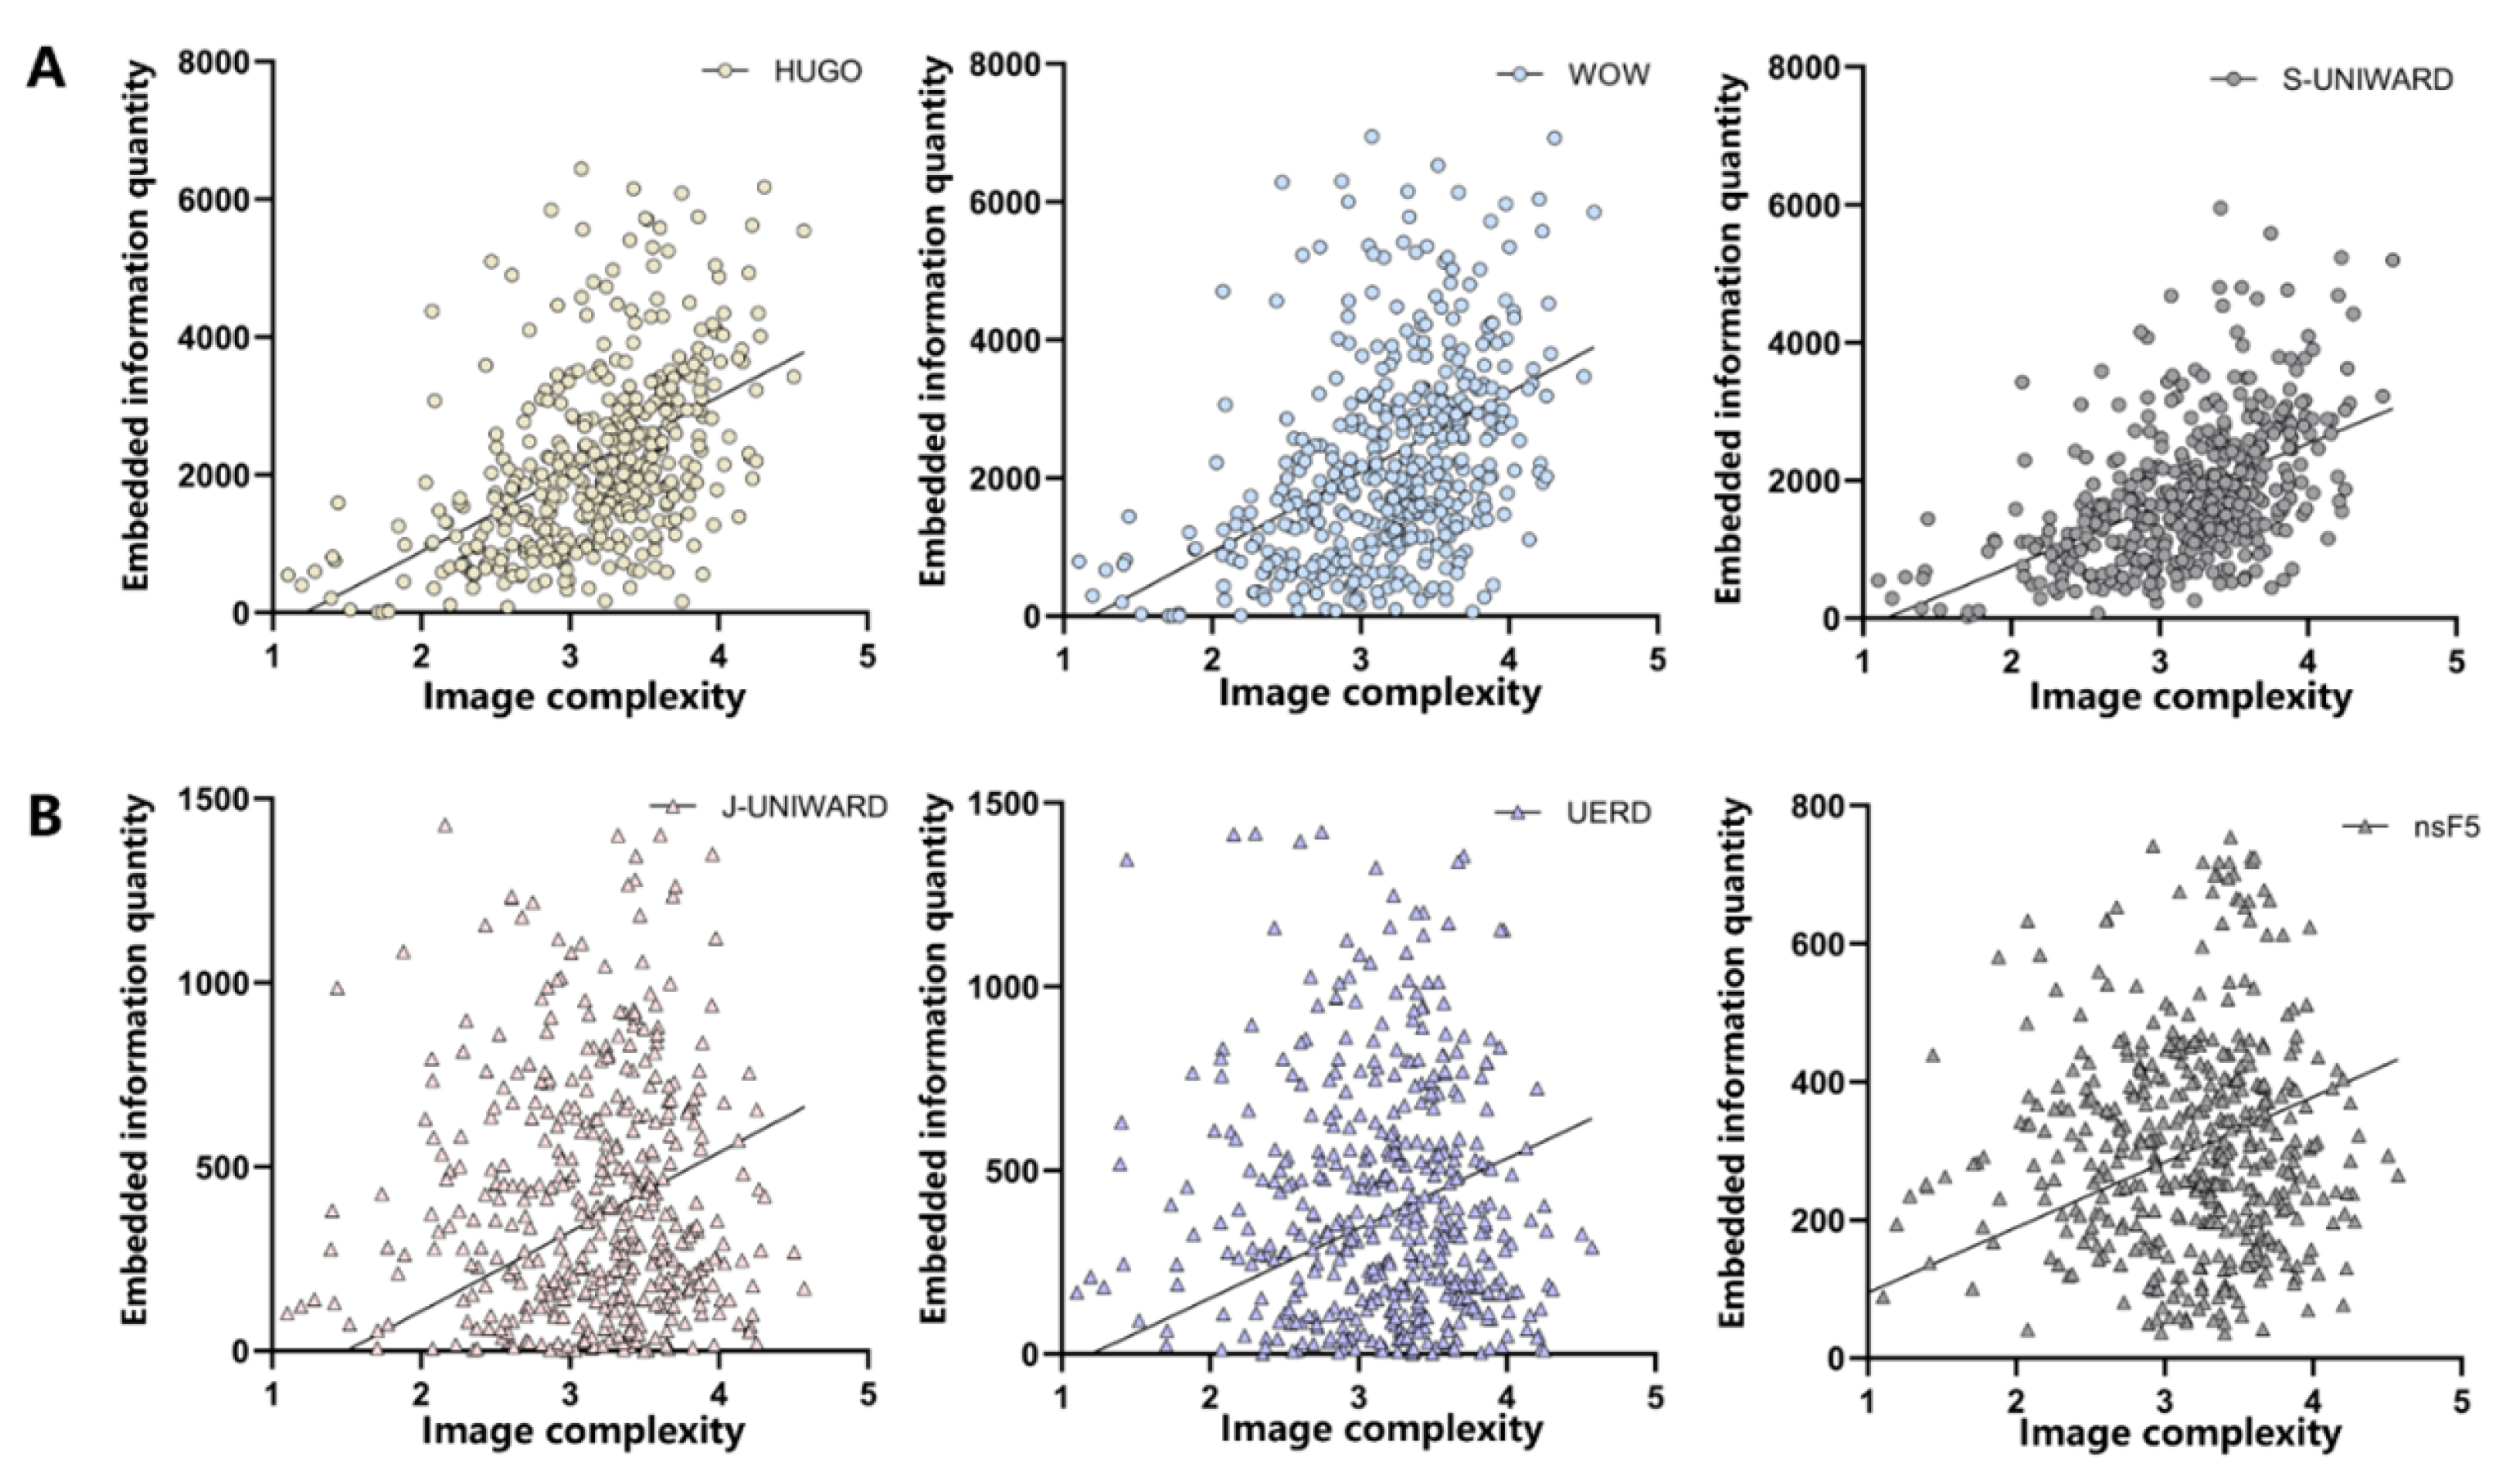
We explore the differences in image modification caused by six image steganography algorithms under the same parameters, innovatively propose using the entropy value of the gray level co-occurrence matrix (GLCM) [10] to quantify the image complexity, and verify the positive correlation between the image complexity and the embedding position of steganographic information, which provides a new idea for the characterization of steganographic behavior.
(2)
For the first time, we introduce the image big data matching technique into the field of steganography analysis to solve the problem of insufficient accuracy in locating steganographic information in image steganography detection. The technique accurately identifies the embedded location of steganographic information by precisely matching the steganographic image with its original image, which provides important support for the efficient recognition of steganography algorithms.
(3)
We improve the ResNet50 model by combining the pyramid attention mechanism and the joint loss function based on Softmax loss [11] and ArcFace loss [12], which significantly improves the recognition accuracy and efficiency of the steganography algorithm. The method shows strong generality and robustness under multiple steganographic algorithms and image formats.
The subsequent structure of this paper is organized as follows: Section 2 reviews the current research status of steganographic analysis algorithms and analyzes their main methods and limitations; Section 3 details the design and implementation of an image steganography algorithm recognition scheme based on the big data matching technique and the improved ResNet50; Section 4 validates the proposed scheme through experiments, and analyzes and discusses the experimental results; Section 5 summarizes the main work and research contributions of this paper and looks forward to future research directions.

2. Related Work

2.1. Traditional Image Steganalysis Algorithms

Traditional image steganalysis algorithms rely on manually designed feature extraction methods and expert experience to identify hidden information by analyzing the statistical properties of an image, which usually includes three steps: feature extraction, feature enhancement, and classification detection [13]. These methods have performed well in the detection of early steganography algorithms, especially for the Least Significant Bit (LSB) algorithm [14] in the spatial domain and the JSteg algorithm [15] in the frequency domain. Specifically, the LSB algorithm embeds steganographic information by directly modifying the least significant bit of a pixel. In contrast, the JSteg algorithm hides the information by adjusting the coefficients of the discrete cosine transform (DCT). These steganographic algorithms significantly change the statistical properties of the image when embedding the information, thus providing a clear detection target and technical path for traditional steganalysis. Based on these characteristics, many classical steganalysis models have emerged, such as Subtractive Pixel Adjacency Matrix (SPAM) [16], Spatial Rich Model (SRM) [17], Discrete Cosine Transform Residual (DCTR) [15], Projection Histogram Rich Model (PHARM) [18] and Gabor Filter Residual (GFR) [19].
However, as steganography technology gradually develops in the direction of intelligence and adaptivity, the complexity and covertness of information steganography significantly increase, making the limitations of traditional steganalysis algorithms more and more prominent. Unlike traditional steganography algorithms, adaptive steganography algorithms embed secret information into high-complexity regions that are difficult to model by dynamically adjusting the embedding strategy. This approach dramatically enhances the covertness of the steganographic information and effectively reduces the possibility of detection. Figure 1 demonstrates the typical embedding process of the adaptive steganography algorithm.
The rise of adaptive steganography, while driving up the complexity of information steganography, also puts higher demands on traditional steganalysis algorithms. For example, the number of feature dimensions that traditional analysis algorithms need to handle has increased dramatically, from 686 feature dimensions in SPAM to 34,671 in SRM. The exponential growth of feature dimensions significantly increases the computational cost and poses a serious challenge to the training efficiency and generalization ability of the model.
In summary, traditional steganalysis methods show significant limitations when facing unknown steganography algorithms or complex adaptive steganography techniques due to their high reliance on manually designed features. The manually designed features are difficult to adapt to the rapid development and diversified needs of steganography, which not only limits the generalization ability and robustness of traditional methods, but also makes it difficult to effectively cope with the complexity and steganography of adaptive steganography algorithms. These limitations suggest that steganalysis techniques must evolve towards more automated, efficient, and adaptive deep learning methods to meet the increasingly complex needs of modern steganography.

2.2. Deep Learning-Based Image Steganalysis Algorithm

With the rapid development of deep learning technology, significant progress has been made in the field of image steganalysis. Deep learning-based steganalysis models are free from the dependence on manual computation and empirical feature extraction, and can achieve automated image steganalysis by combining feature learning and classifier training.
In 2015, Qian et al. [20] proposed a GNCNN model based on a convolutional neural network (CNN), which is capable of automatically extracting features for steganalysis. In 2016, Xu et al. [21] proposed Xu-Net based on a GNCNN, whose detection performance exceeds the traditional SRM under the same steganographic algorithm. In 2017, Ye et al. [22] developed Ye-Net, which significantly improved the detection accuracy of adaptive steganography algorithms for complex texture regions by combining the selection channel with a CNN.
Subsequently, Boroumand et al. [23] proposed SRNet in 2018, which showed strong robustness in both spatial (LSB) and frequency domains (JPEG). In 2019, Zhu-Net, proposed by Zhu et al. [24] improved the training efficiency and the overall performance by simplifying the model structure. In the same year, Yedroudj et al. [25] developed Yedroudj-Net by combining the architectures of Xu-Net and Ye-Net to further optimize the detection capability.
In recent years, more innovative methods have been proposed. In 2022, Wang et al. [26] proposed an improved feature extraction method, which improved the accuracy of Ye-Net and Yedroudj-Net by 1.30% to 8.21%. In 2023, Xia et al. [27] proposed a non-linear residual-based steganalysis model for JPEG images, which further improved the accuracy compared to traditional models such as DCTR, GFR, and PHARM. In the same year, Li et al. proposed a deep learning feature-driven steganalysis method [28], while the CSRnet model [29] proposed by Ma et al. improves the detection accuracy of various steganography algorithms.
Despite significant progress in deep learning-based steganalysis methods, most models still belong to dedicated steganalysis, i.e., models designed for known specific steganographic algorithms. Such methods usually show high accuracy in detecting specific steganography algorithms, but the scope of application is relatively limited, and it is difficult to support multiple image formats and multiple steganography algorithms at the same time. In addition, existing research has mainly focused on determining whether a carrier image contains steganographic information, while in-depth analyses of the steganographic information itself, such as identifying steganographic methods or locating embedded regions, have been less studied. These limitations highlight the importance of developing more general and robust steganographic analysis models. To this end, this paper proposes an image steganography algorithm recognition scheme based on big data matching with improved ResNet50, which is not only capable of detecting steganographic images but also further identifying the steganography algorithms employed.

3. Program Design

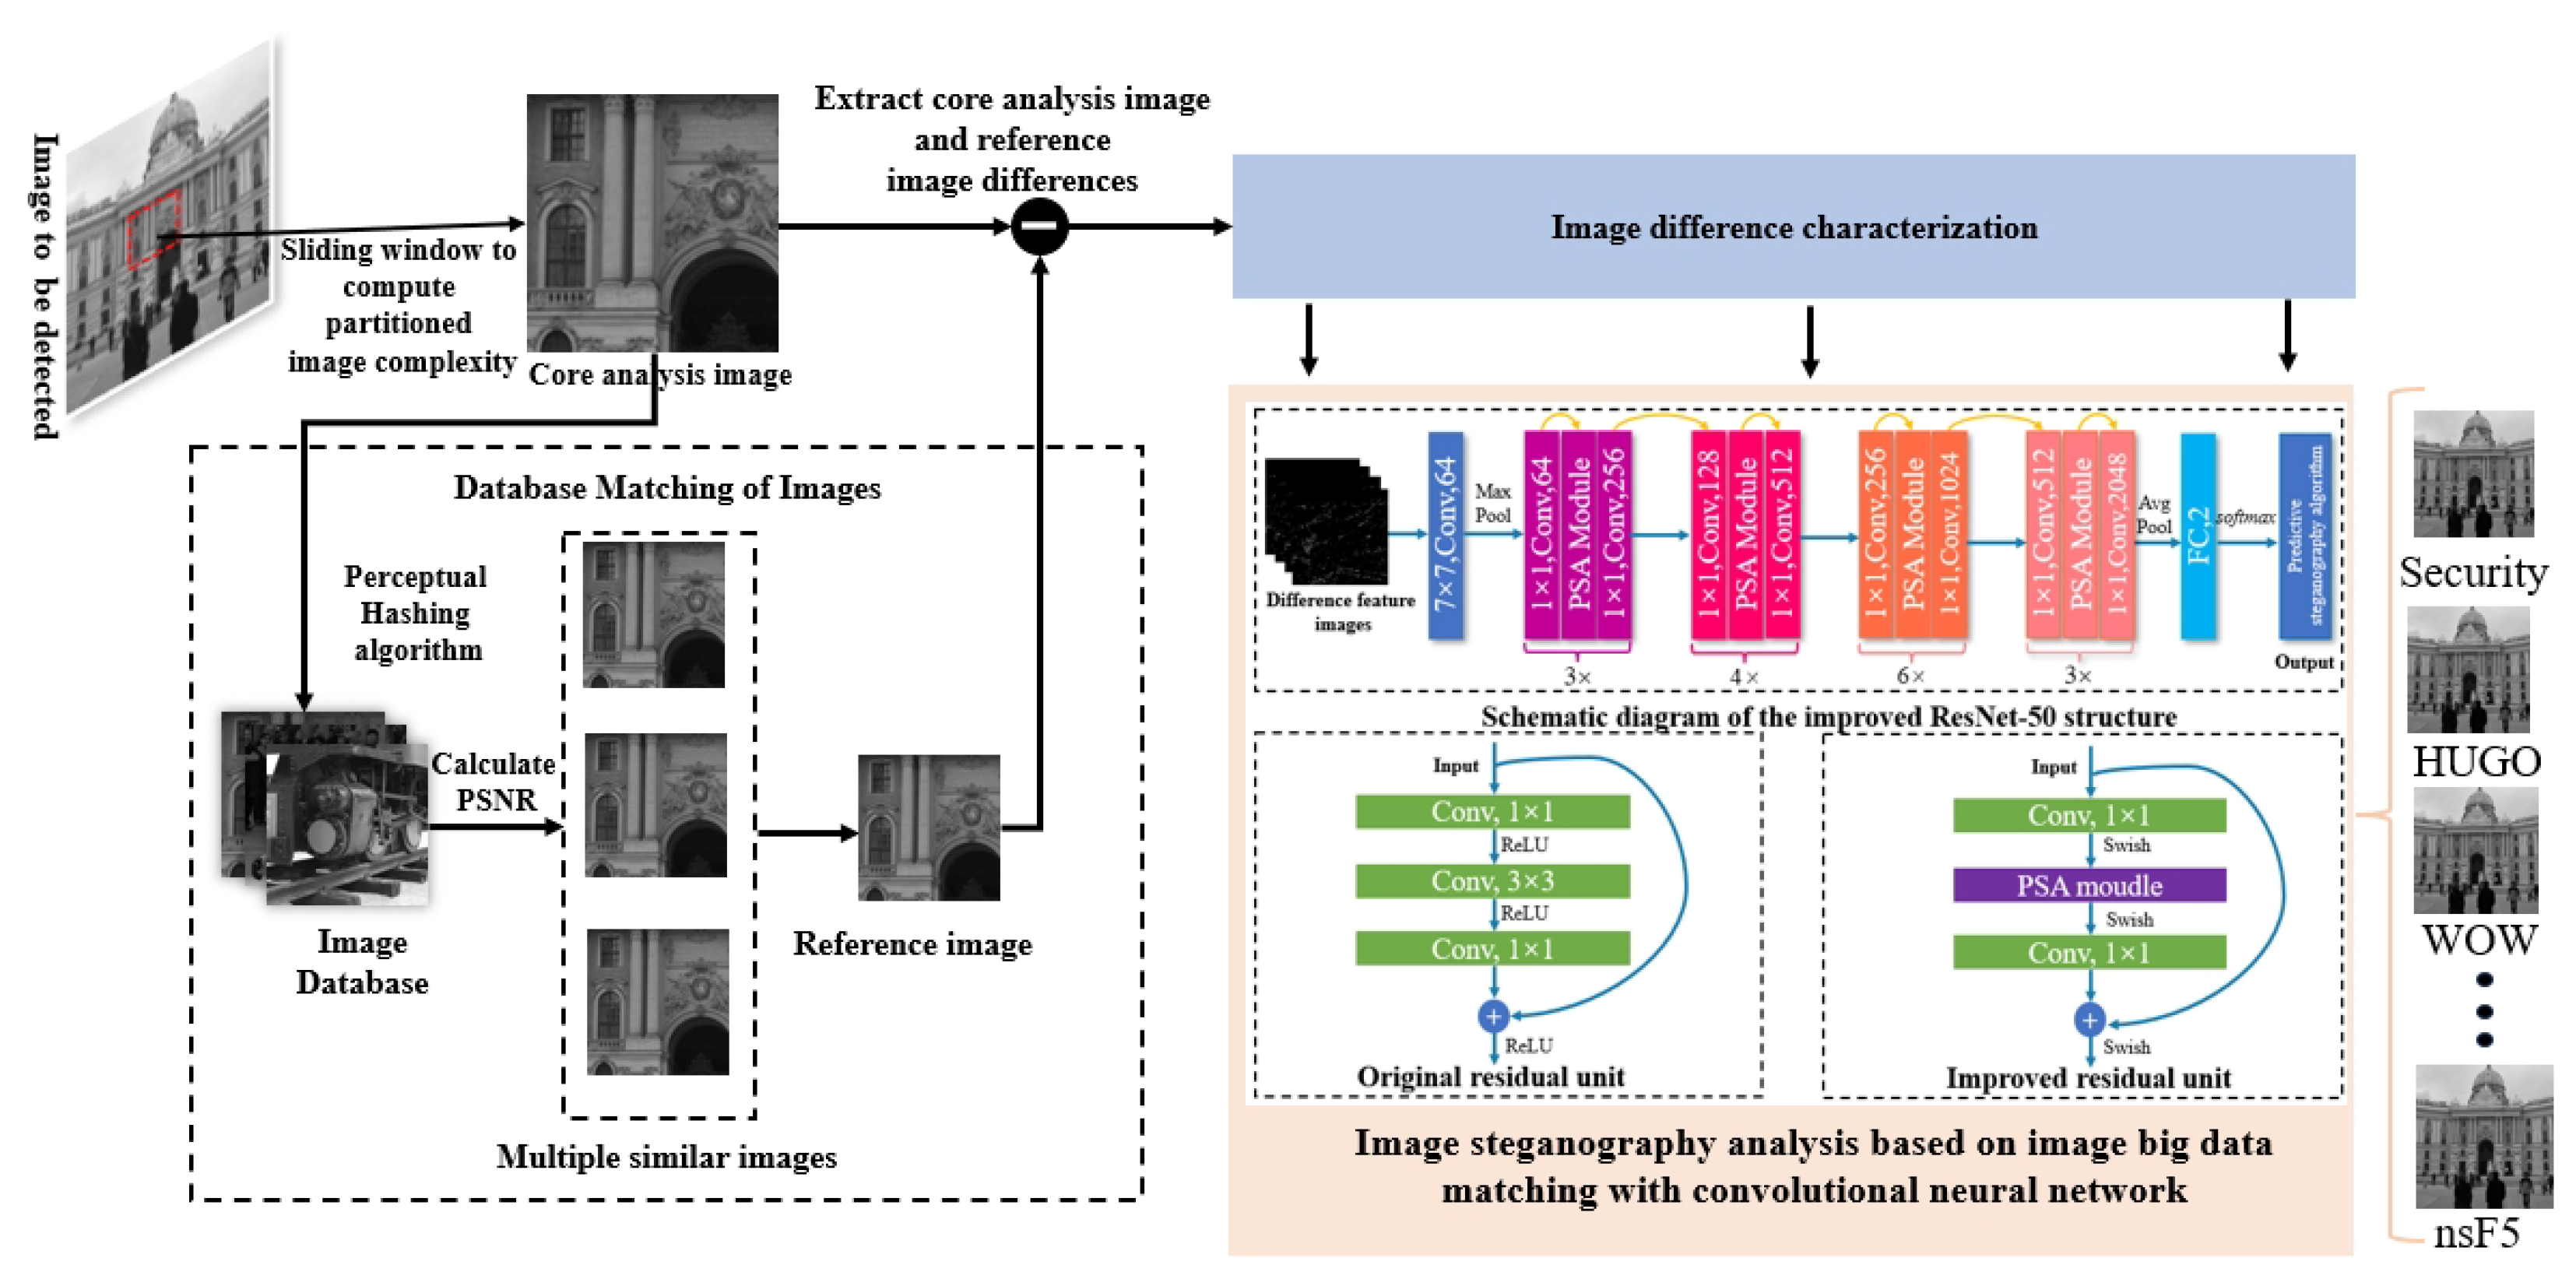
3.1. Overall Program Architecture

The overall framework of the proposed method, as depicted in Figure 2, includes the core analysis of image, image big data matching, and a general steganalysis model based on an improved ResNet50 architecture in three main parts. The specific implementation steps are as follows:
(1)
Apply the sliding window technique to partition the image to be detected, calculate the entropy value of the gray level co-occurrence matrix (GLCM) of each region to quantify the image complexity, and intercept the region with the highest complexity as the core analysis part.
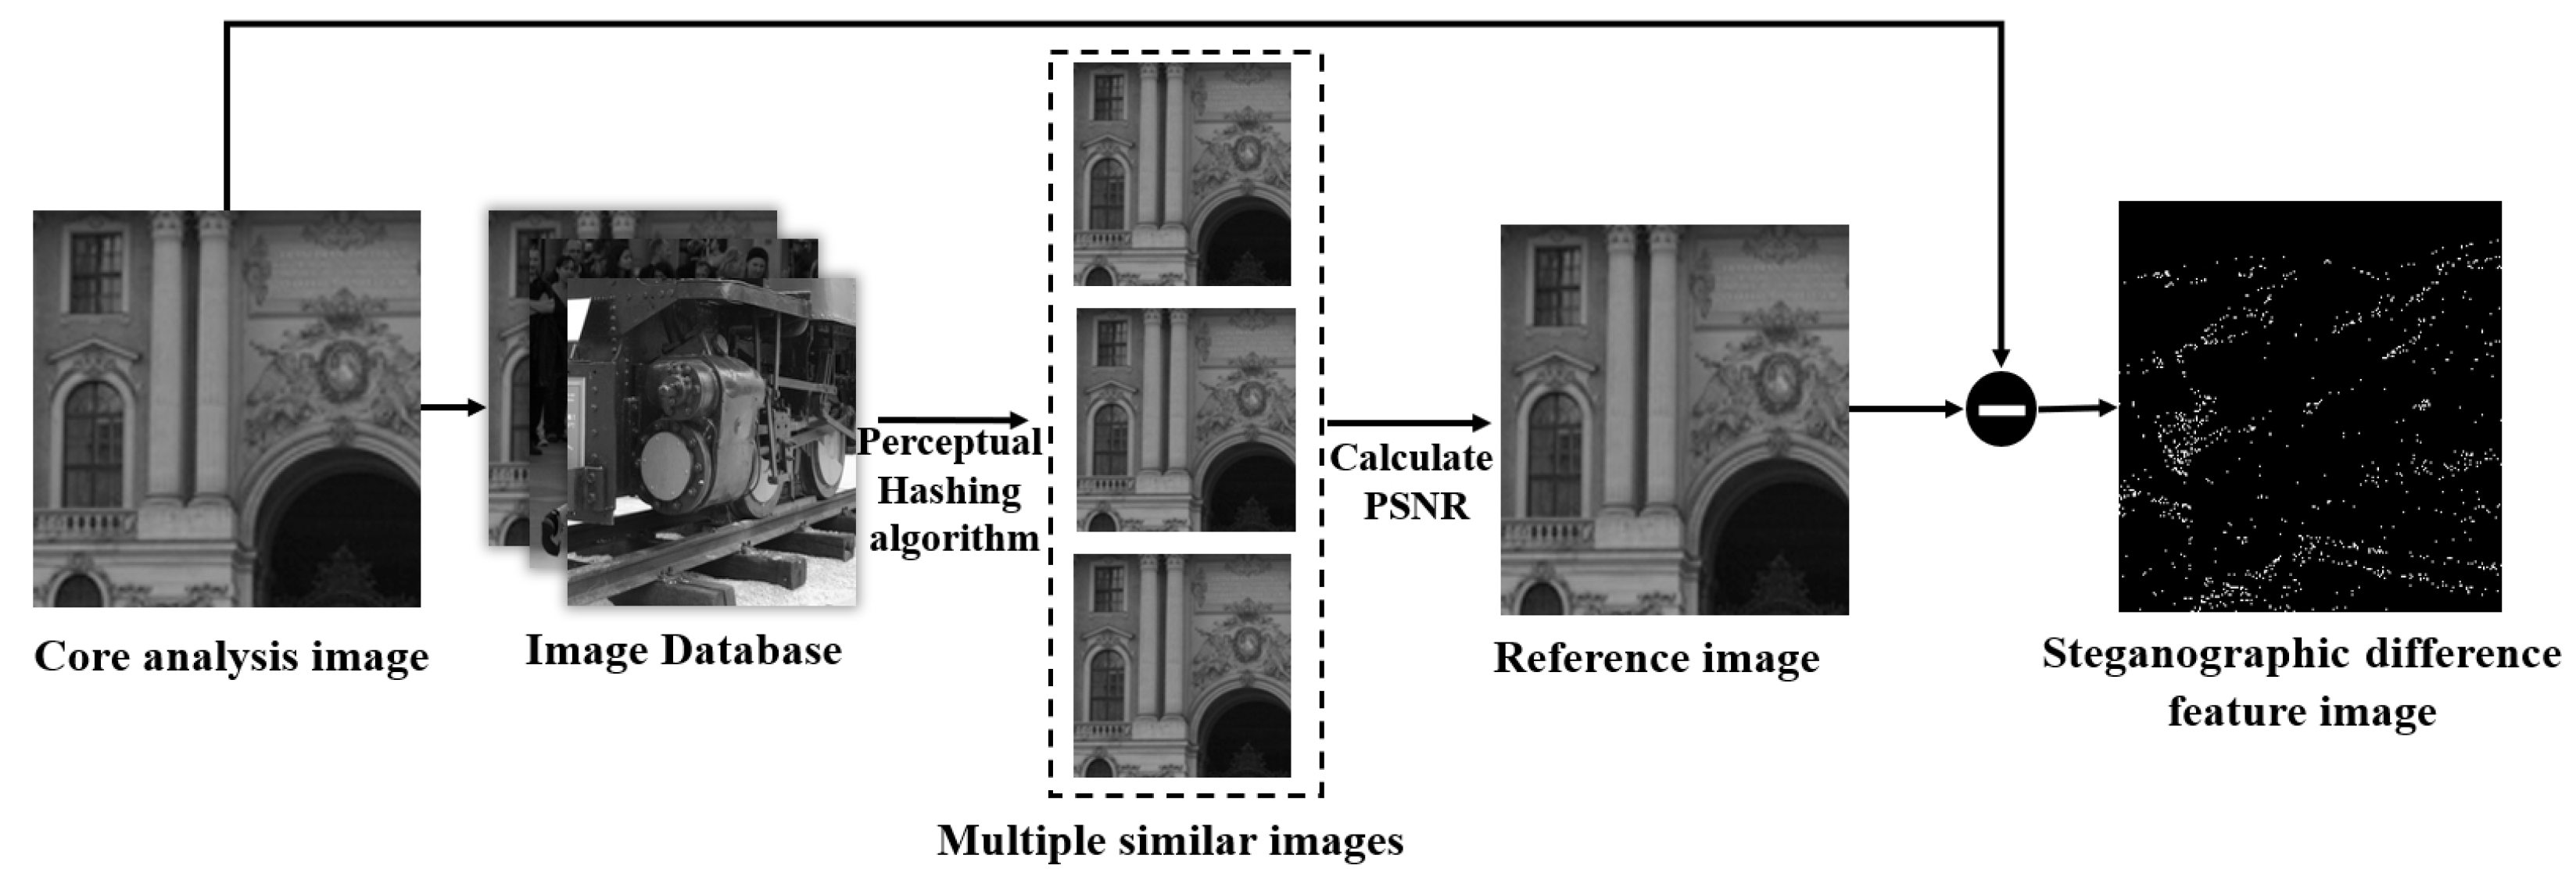
(2)
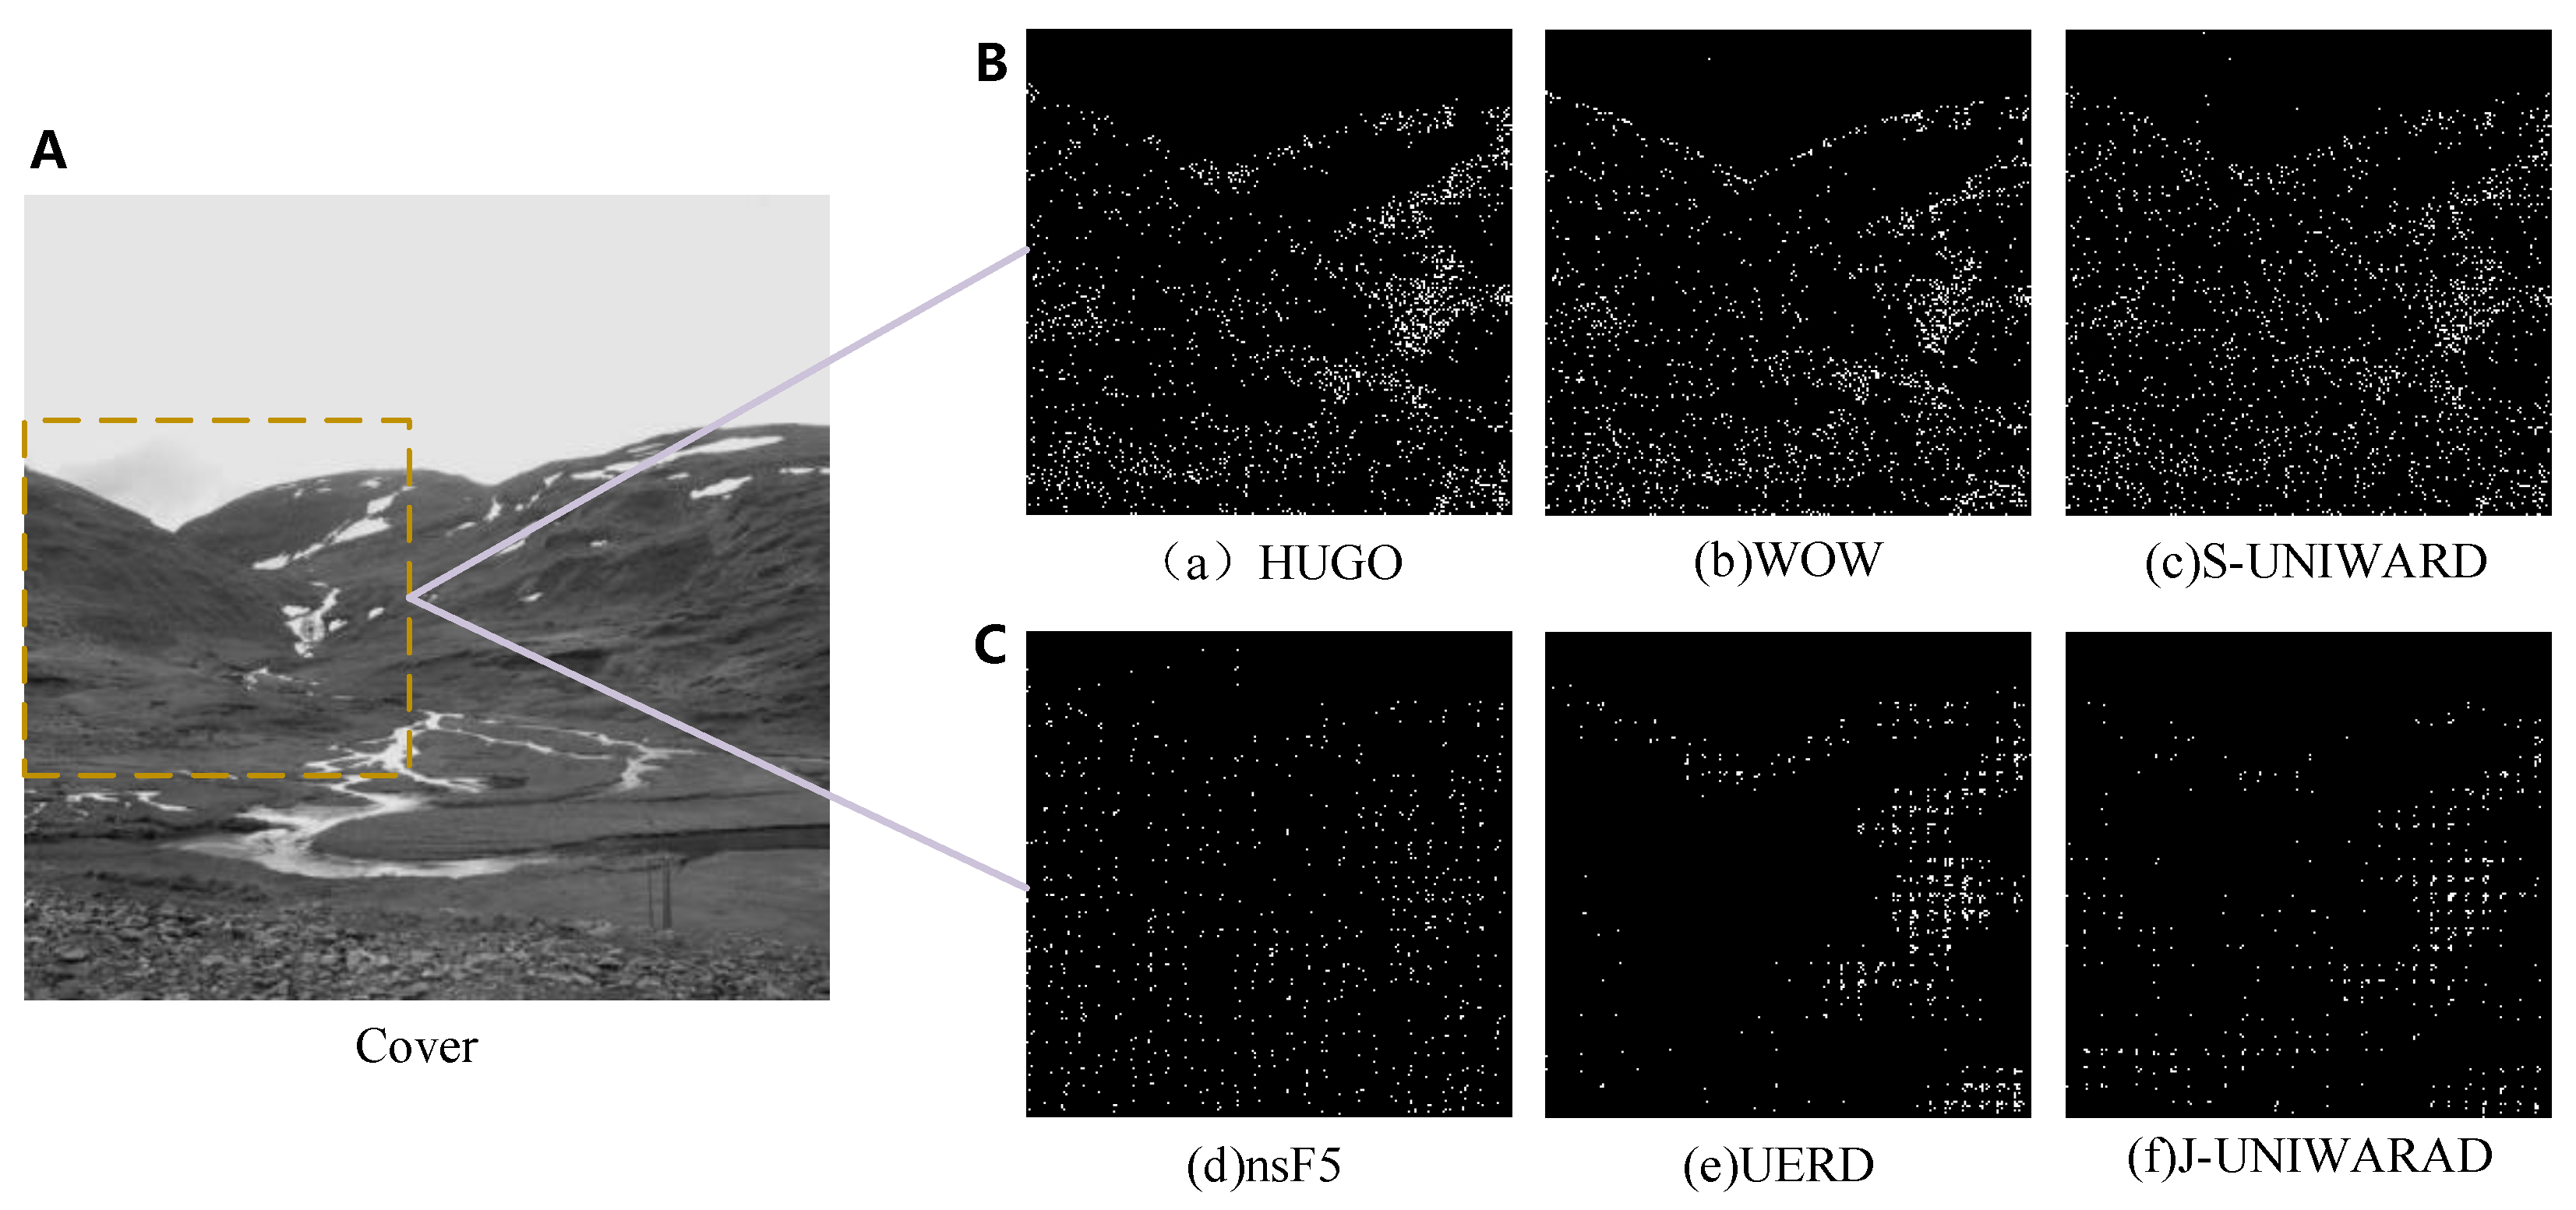
Apply a perceptual hash algorithm to quickly match the core analysis images, retrieve them against images in a local database or a cloud database connected via the web, and extract all similar images. For the matched multiple similar images, Peak Signal-to-Noise Ratio ( P S N R ) [30] is used for accurate similarity calculation, and the image with the highest similarity is selected as the reference image so as to generate the steganographic difference feature image between the reference image and the core analysis image.
(3)
The steganographic difference feature images are fed into the improved ResNet50-based steganography algorithm recognition model for deep feature extraction and classification. According to the output results of the model, the final judgment is made on whether the image to be detected is a safe image or not. Further, it completes the recognition task of the steganography algorithm.

3.2. GLCM-Based Image Selection for Core Analysis

In practice, large-size images often have tens of millions of pixels, and direct steganalysis of the whole image is computationally intensive and inefficient. Meanwhile, not all regions of the whole image are embedded with steganographic information. Therefore, accurately selecting the core regions containing rich steganographic features from large-size images is a key issue to improve the efficiency and accuracy of the analysis. Adaptive steganography algorithms tend to embed secret information into regions with higher image complexity, which makes complexity analysis a key basis for core image selection.
In order to effectively describe the image complexity, this paper quantifies the image texture by using the GLCM method, which is a method based on a statistical model describing the texture characteristics of an image, and measures the complexity of an image by studying the gray level spatial correlation. Let f ( x , y ) be a two-dimensional digital image; then, the gray level co-production matrix satisfying certain spatial relations is
P ( i , j ; d , θ ) = # { ( x 1 , y 1 ) ( x 2 , y 2 ) | f ( x 1 , y 1 ) = i , f ( x 2 , y 2 ) = j } , ( x 1 , y 1 ) ( x 2 , y 2 ) = d , ( x 1 , y 1 ) ( x 2 , y 2 ) = θ
# denotes the number of pixel pairs with gray level I at ( x 1 , y 1 ) and j at ( x 2 , y 2 ) in the image according to the condition in Equation (1). The distance between two pixels is d, and the orientation angle is θ . The range of values of different features in GLCM is different, so before extracting the features, they need to be normalized as follows.
P N ( i , j ; d , θ ) = P ( i , j ; d , θ ) + P T ( i , j ; d , θ ) 2 # L x L y , d , θ
where P N ( i , j ; d , θ ) denotes the normalized GLCM, P T ( i , j ; d , θ ) denotes the transpose, and # L x , L y , d , θ is a constant when the image size is given, which is computed as follows.
# L x L y , d , θ = N ( N d ) θ = 0 , 90 ; d = 1 , 2 , 3 , 4 ( N d ) 2 θ = 45 , 135 ; d = 1 , 2 , 3 , 4
The entropy of GLCM is a measure of the amount of information an image has, texture information also belongs to the information of an image. It is a measure of randomness, which indicates the degree of non-uniformity or complexity of the texture in an image and is defined as follows.
E N T = i j P ( i , j ; d , θ ) log ( P ( i , j ; d , θ ) )
where the larger the entropy value, the more complex the image texture, indicating that the region is more likely to embed steganographic information.
In summary, in this paper, the image complexity of each region of the image to be tested is calculated with the size of 224 × 224 pixels and a sliding window of 100 pixels, and the region with the highest image complexity is finally intercepted as the core image for steganalysis.

3.3. Image Big Data Matching and Steganographic Difference Feature Image Acquisition

Figure 3 shows the overall process of efficient matching of reference images and steganographic difference image acquisition. In this paper, the proposed image data matching scheme based on the Perceptual Hashing algorithm and P S N R is combined with the efficient screening of the local database and the complementary network search technology to achieve accurate matching between the core analysis image and the original image. On this basis, key support for the analysis and recognition of steganography algorithms is provided by extracting steganographic difference feature images in the spatial and frequency domains.

3.3.1. Image Big Data Matching

In order to obtain the steganographic difference features between the steganographic image and the original image, it is necessary to accurately match the original image to the steganographic image. Although the steganographic image is almost identical to the original image visually, some pixel values will change slightly, so a scientific similarity evaluation index is needed to quantify the degree of change of the image before and after steganography.
During the initial screening phase, the dHash [31] values of the core analyzed images are computed using a perceptual hash algorithm and compared with the dHash values of the original images stored in the database. The degree of matching between images is measured by vector similarity; the higher the vector similarity, the smaller the corresponding Hamming distance, indicating a higher degree of similarity between the two images. The Hamming distance is calculated by comparing each bit of the vectors to see if they are the same, and if they are different, then the Hamming distance is increased by 1. We set a preset threshold for the Hamming distance, and when the Hamming distance is less than 15, the image partition is selected as a candidate image. This method can quickly filter out the more similar images. However, although the perceptual hash algorithm can quickly screen candidate images, it cannot quantify the subtle differences between images. Therefore, a more accurate similarity evaluation method needs to be introduced to further improve the accuracy of matching.
In the precise evaluation stage, this paper adopts P S N R to quantify the pixel differences between the steganographic image and the original image. P S N R is a signal-to-noise ratio-based image similarity evaluation method, which is suitable for accurately quantifying the subtle changes between images. For a given steganographic image I of size m × n and the original image K, P S N R is calculated as follows.
P S N R = 10 × log 10 M A X I 2 M S E
M S E = 1 m n i = 0 m 1 j = 0 n 1 [ I ( i , j ) K ( i , j ) ] 2
where M S E is the mean square error, and M A X I is the maximum possible pixel value of the image. When two images are identical, the M S E value tends to zero, at which point the P S N R value tends to infinity. Usually, the larger the P S N R value, the higher the image similarity. Therefore, by calculating the P S N R value between the candidate image and the core analysis image, the original image that is most similar to the core analysis image can be further screened as the reference image for recognition by the steganography algorithm.

3.3.2. Steganographic Difference Feature Image Acquisition

The extraction of steganographic difference feature images is mainly divided into spatial domain steganographic difference feature images and frequency domain steganographic difference feature images based on the working domain of the steganographic algorithm.
For spatial domain adaptive steganography algorithms such as HUGO [32], WOW [33], and S-UNIWARD [34], the steganographic information is usually achieved by making small adjustments, such as +1 or −1, to the pixel values. These methods apply to uncompressed image formats such as BMP, PGM, and PNG. In extracting the spatial steganographic difference features, the pixel matrix A of the original image is first taken as the base and the pixel matrix B of the steganographic image is subtracted to obtain the difference matrix D a i r , which is calculated as follows:
D a i r i j = 1 , A i j B i j = 1 0 , A i j B i j = 0 255 , A i j B i j = 1
where i j denotes the ranks of the image pixel matrix. The value of the difference matrix D a i r represents the specific modification of the pixel by the steganography algorithm. To facilitate deep feature extraction for subsequent steganographic algorithms to recognize the model, the difference matrix D a i r is transformed into image form and defined as a spatial steganographic difference feature image, as shown in Figure 4a.
For frequency domain adaptive steganography algorithms such as J-UNIWARD [35], nsF5 [36], and UERD [37], steganographic information is usually achieved by modifying the discrete cosine transform (DCT) coefficients of the image. These methods apply to compressed image formats such as JPEG. The DCT transform decomposes the image into 1 DC coefficient and 63 AC coefficients, and the steganography algorithm mainly adjusts the mid-frequency AC coefficients to ensure that the image structure does not change significantly. When extracting the frequency domain steganographic difference features, the DCT coefficient matrix C A of the original image and the DCT coefficient matrix C B of the steganographic image are first extracted. Taking C A as the base, the difference matrix D f r e between the two is calculated as follows:
D f r e = C A C B
Similarly, the difference matrix D f r e is converted to an image, defined as a frequency domain steganographic difference feature map, as shown in Figure 4b.

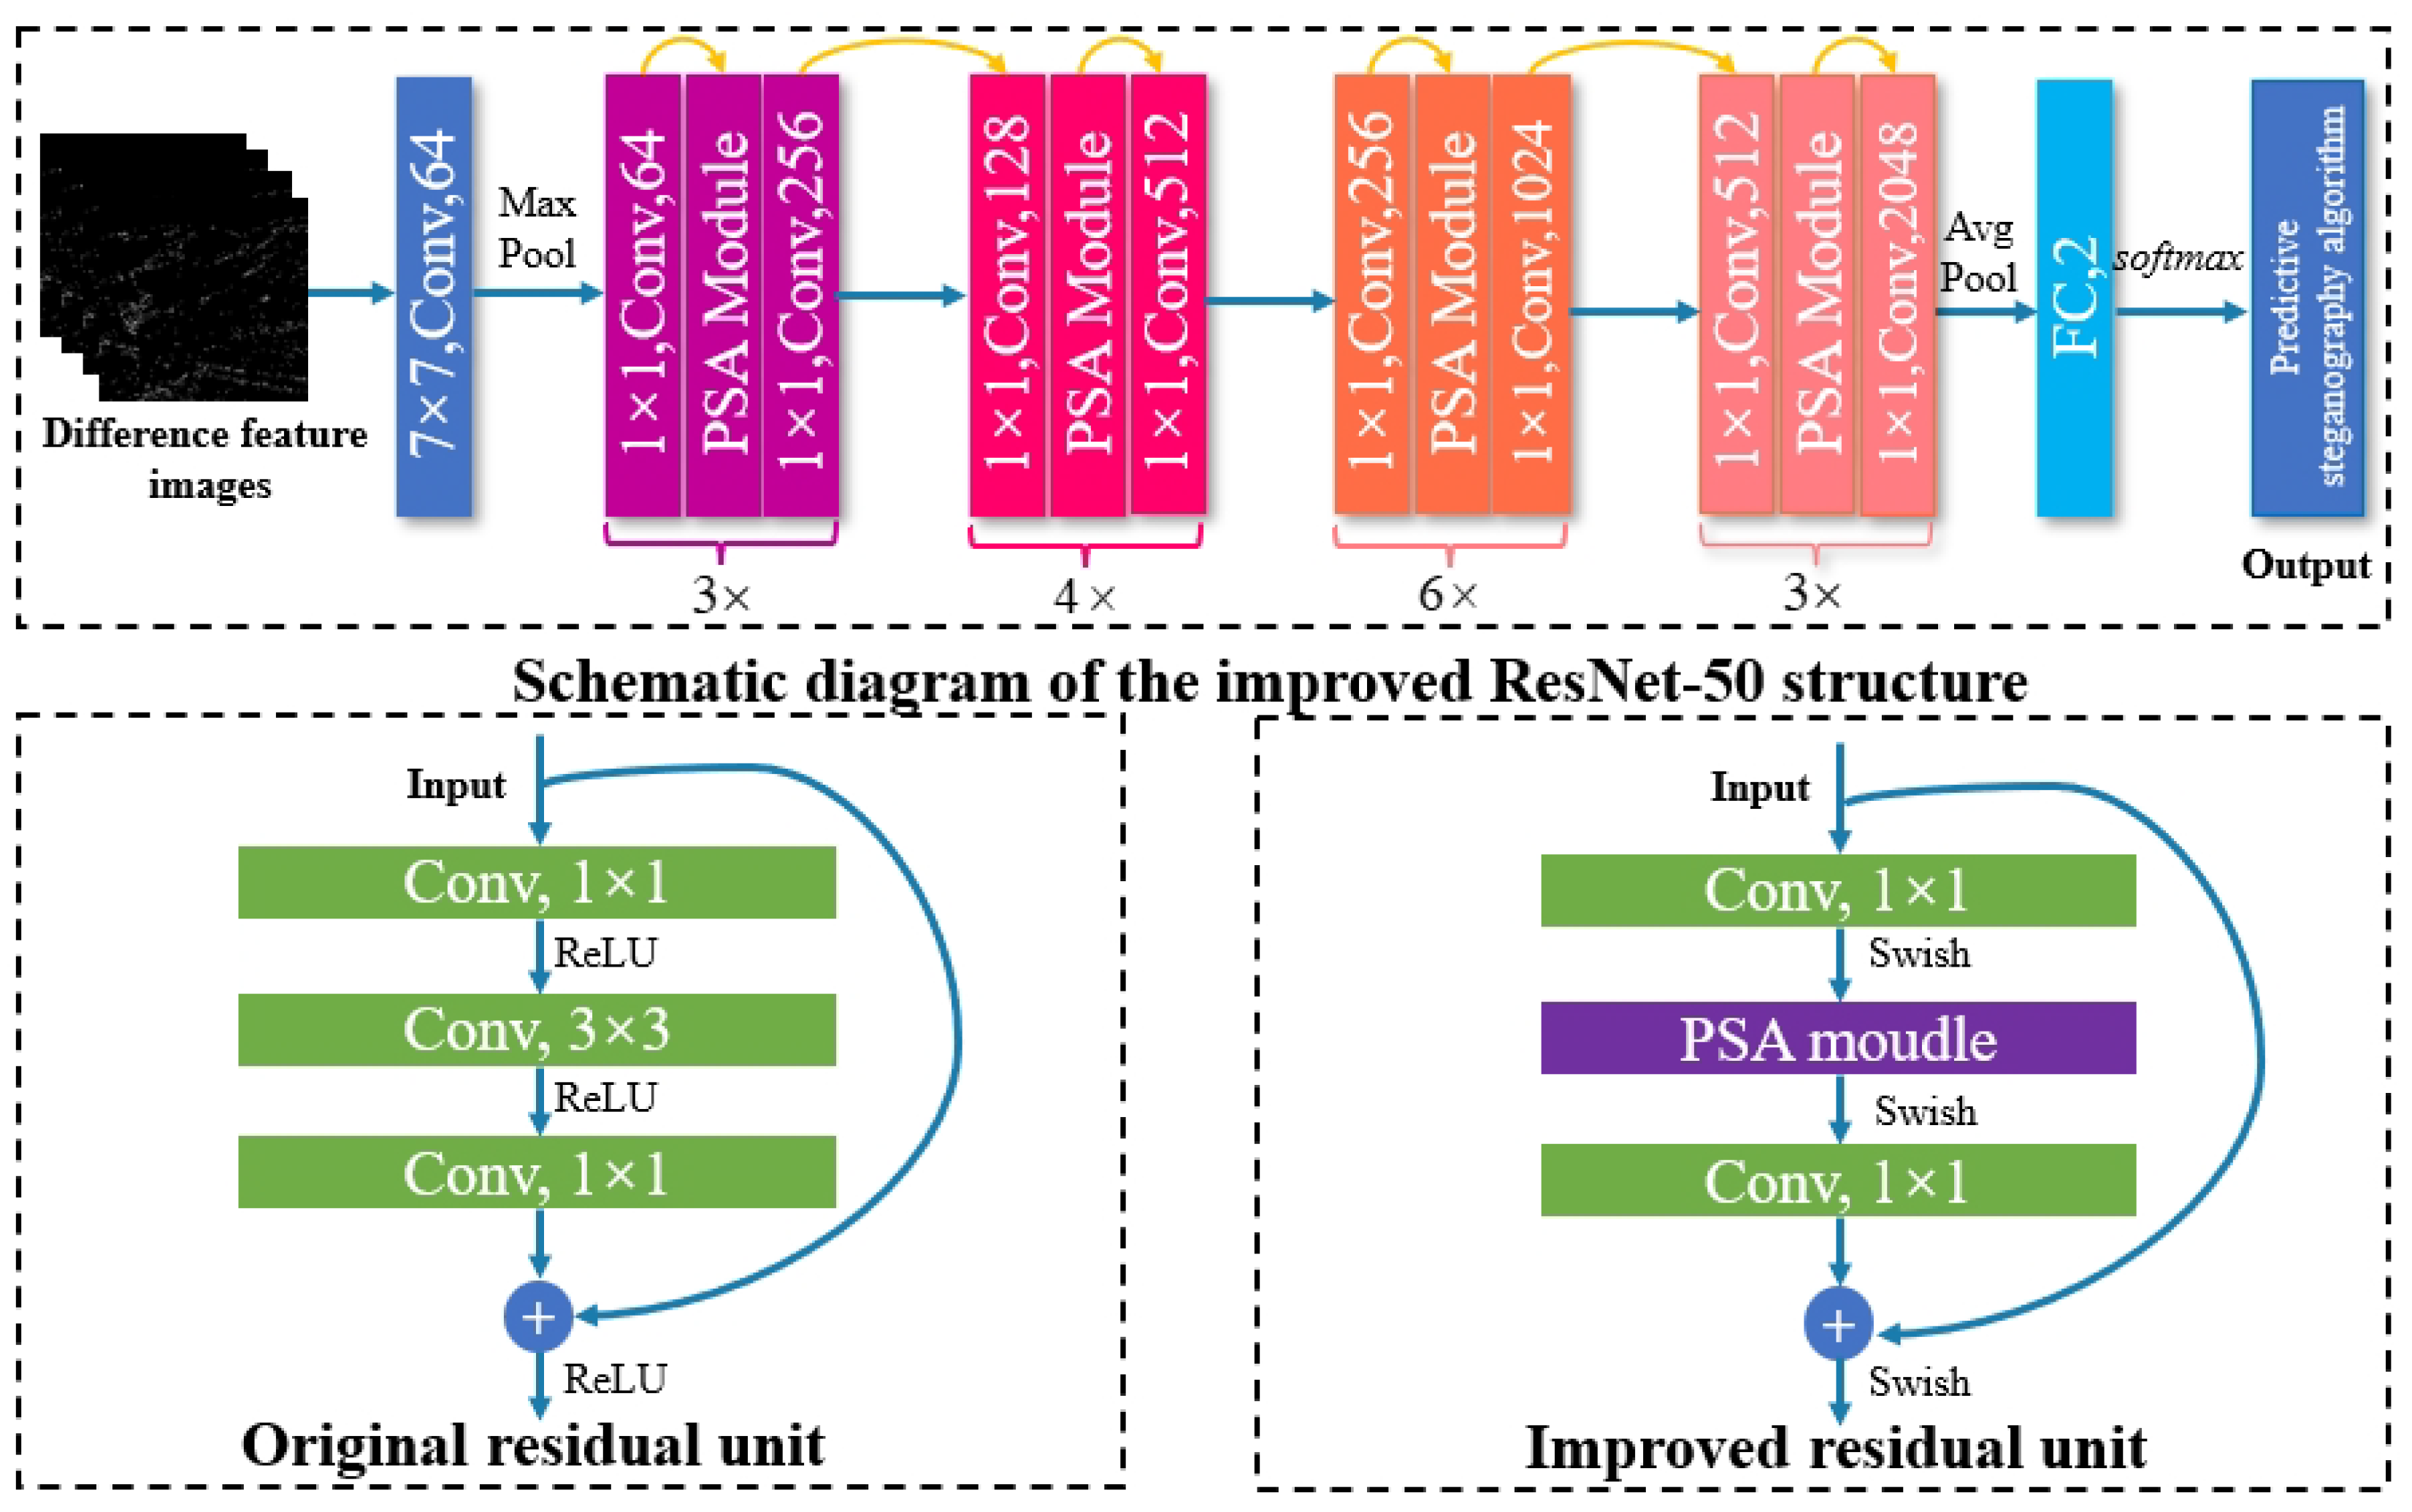
3.4. Image Steganography Algorithm Recognition Model Based on Improved ResNet50

The design goal of the distortion function for adaptive steganography algorithms is to select regions for embedding that have the least impact on the image content, and different distortion functions achieve this goal in different ways with different specific features. However, the same type of steganography algorithm produces less variance in the steganographic features, which makes traditional classification methods more challenging for algorithm identification. In view of this, this paper proposes an image steganography algorithm recognition model based on improved ResNet50 to achieve accurate recognition of the steganography algorithm used in the image to be tested. Figure 5 shows the steganographic difference feature maps extracted from the same region of the image embedded by six steganographic algorithms such as WOW, HUGO, S-UNIWARD nsF5, J-UNIWARD, UERD, etc., which provides an intuitive visual comparison of the small differences between the features of different steganographic algorithms.

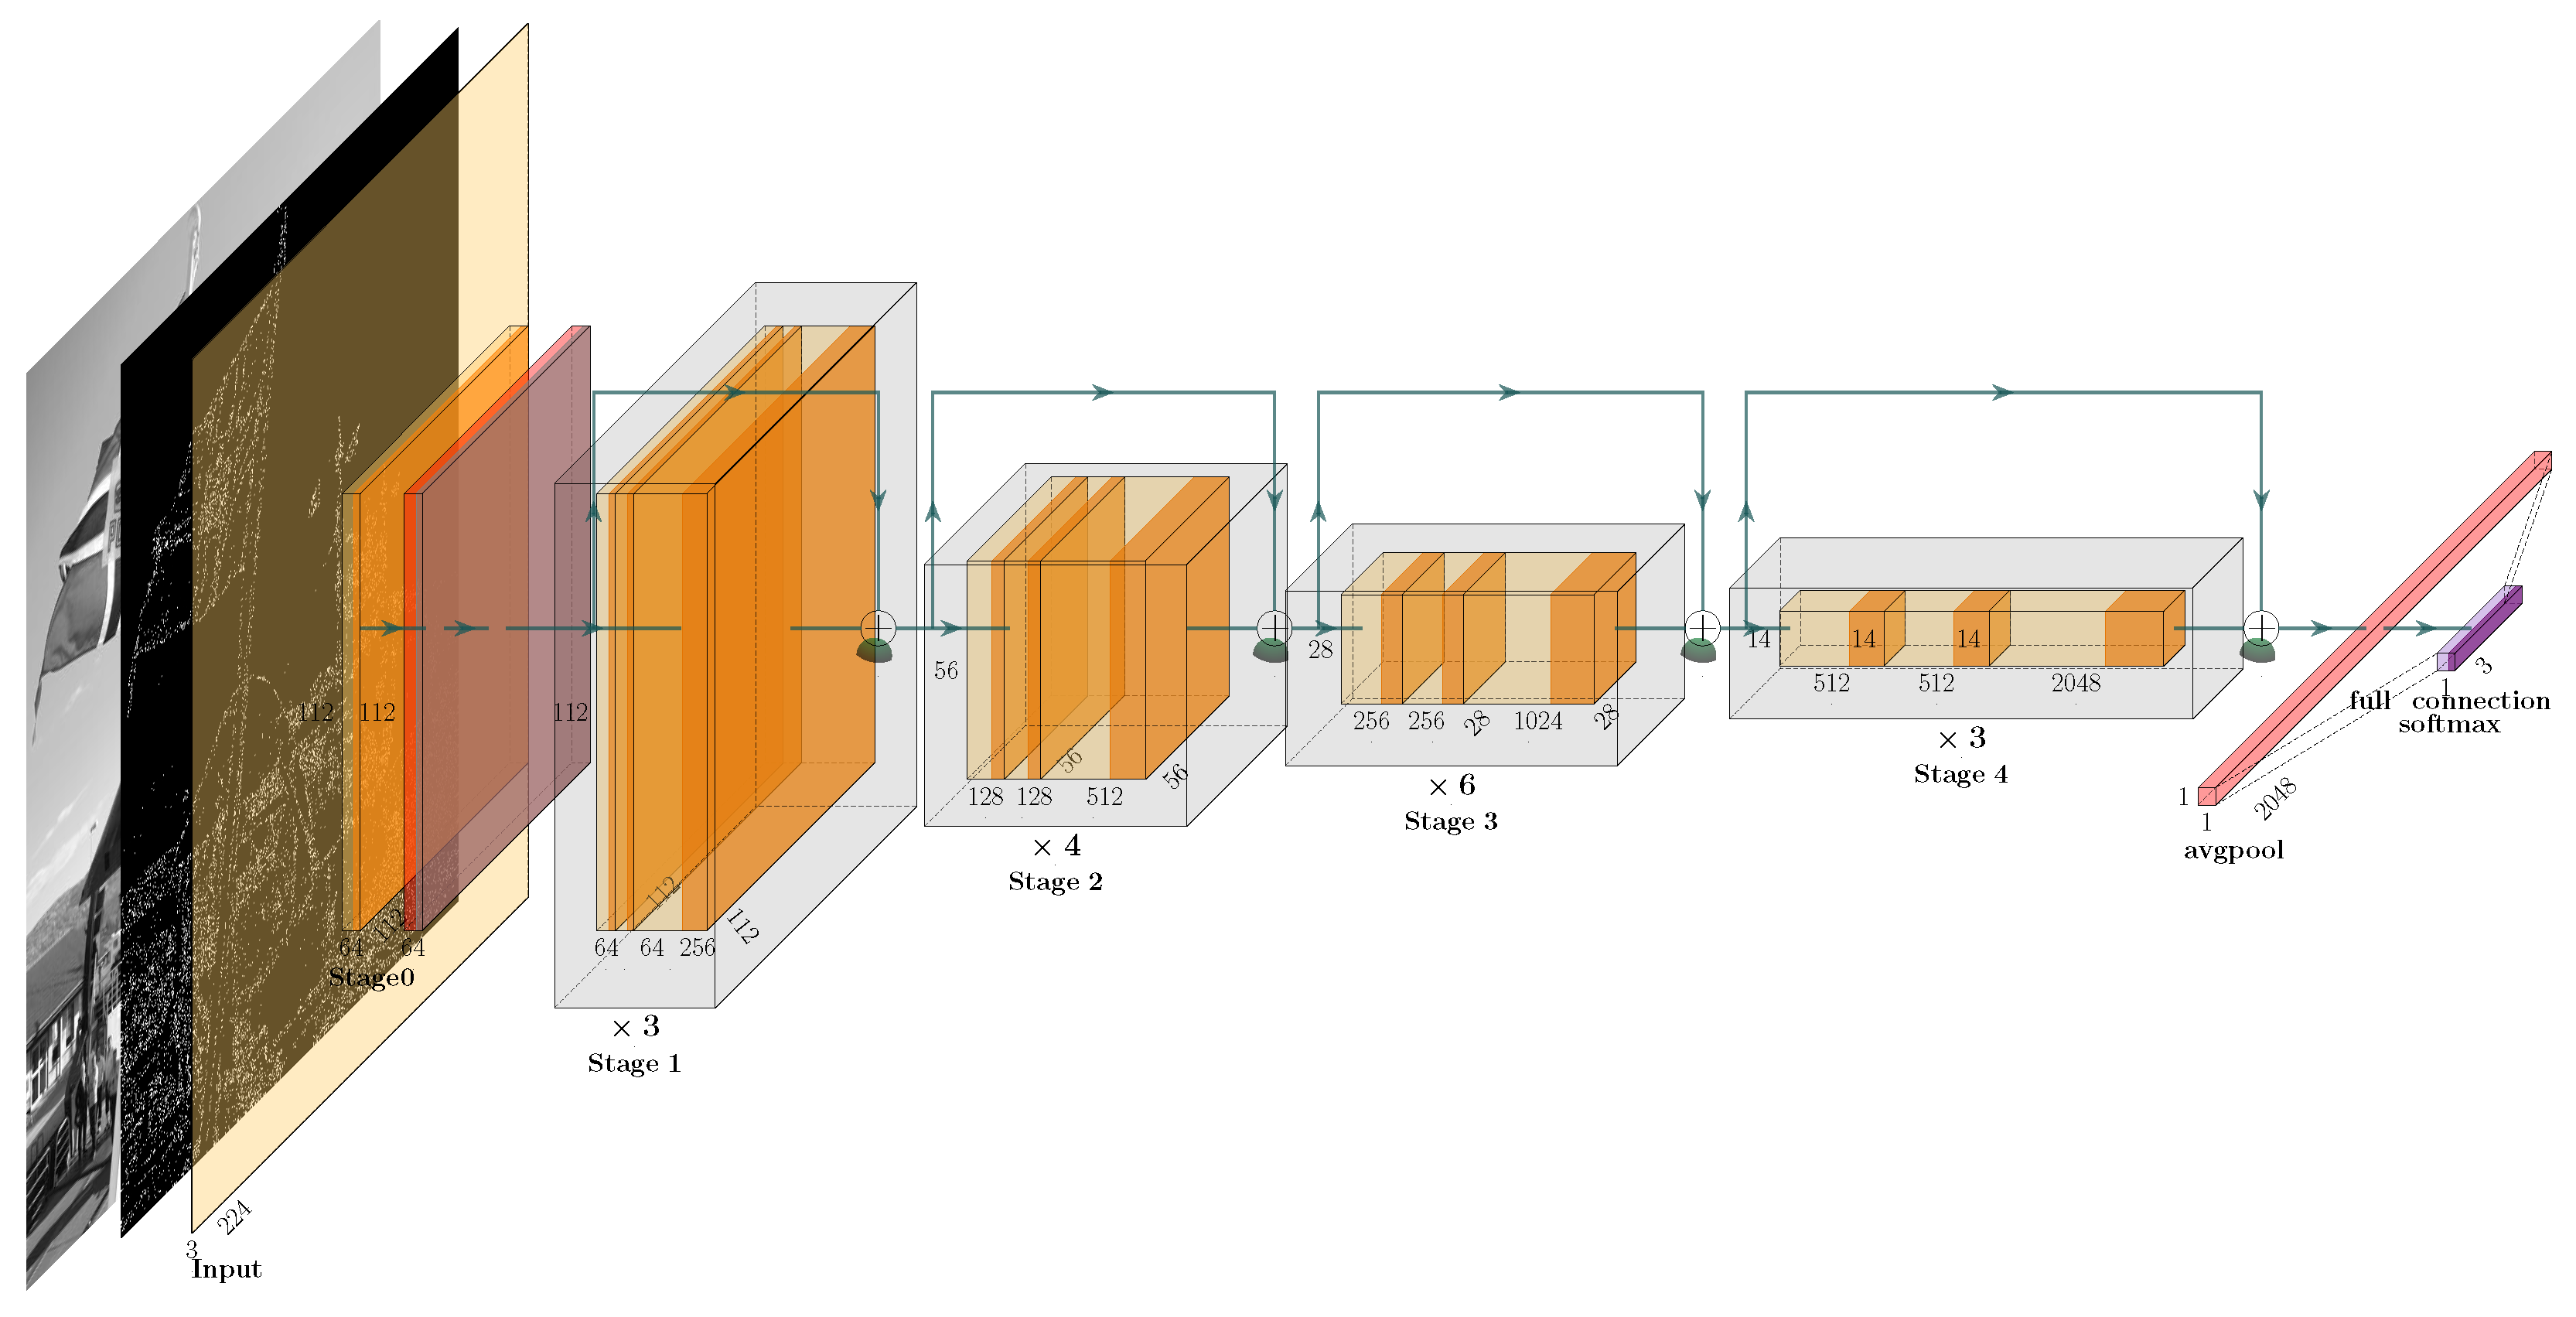
3.4.1. ResNet50 Deep Learning Network

ResNet [9], proposed by He et al. based on the concept of residual learning, is a deep neural network architecture that includes multiple variants, such as 18-layer, 34-layer, 50-layer, and 101-layer networks. This architecture effectively addresses the degradation problem in deep learning models, mitigating issues such as gradient vanishing and performance degradation caused by excessively deep network layers in traditional convolutional neural networks. As a result, ResNet enables more efficient extraction of image features while significantly improving convergence speed. Currently, ResNet has been widely applied in various engineering fields, including facial recognition and autonomous driving [38]. Considering the trade-off between model complexity and performance, this study selects the ResNet50 variant for optimization and enhancement.
Figure 6 shows the architecture of ResNet50, which consists of five groups of 49 convolutional layers and one fully connected layer. The convolutional layers utilize kernels of three different sizes, namely 1 × 1 , 3 × 3 , and 5 × 5 , to extract features from images at various resolutions. ReLU activation functions are applied after each convolution operation to introduce non-linearity. The network takes an input image of size 224 × 224 × 3 and processes it through the convolutional layers to generate feature maps of size 7 × 7 × 2048 . Subsequently, pooling layers compress the feature maps into a feature vector, which is then passed to the classifier to compute the probability distribution across all categories.

3.4.2. Pyramid Split Attention Module

For convolutional neural networks, most studies improve performance by stacking convolutional layers to integrate more spatial features. However, this approach often increases the model’s depth and training complexity. Attention mechanisms enable neural networks to assign varying weights to different regions, allowing them to focus on task-relevant key features and improve training efficiency and effectiveness. To enhance the prediction accuracy of steganographic categories, this study incorporates the Pyramid Split Attention (PSA) module into the baseline model ResNet50. The PSA module combines a multi-scale pyramid convolutional structure with channel attention mechanisms, effectively strengthening the correlation between multi-scale features and the representation of cross-channel semantic information. This design captures steganographic feature differences across different levels and granularities, significantly improving the accuracy of image steganalysis.
Figure 7 illustrates the structure of the PSA module, which operates through the following four steps: (a) Using the Split and Concat (SPC) module, the input feature map with a height H, width W, and channel number C is divided into multiple groups along the channel dimension. Multi-scale channel-level feature information is then extracted using convolution kernels of different scales within the pyramid structure. (b) The output features from the SPC module are fed into the SE module, where the channel-wise attention weights are computed to generate an attention vector corresponding to the channel features. (c) The attention vector is normalized using the Softmax function, redistributing the channel weights to produce new cross-channel attention weights. (d) The normalized attention weights are element-wise multiplied with the multi-scale spatial features, further refining the multi-scale features while modeling the inter-channel correlation and differentiation. Of these, the descriptions of the SPC and SE modules are shown below:
(a)
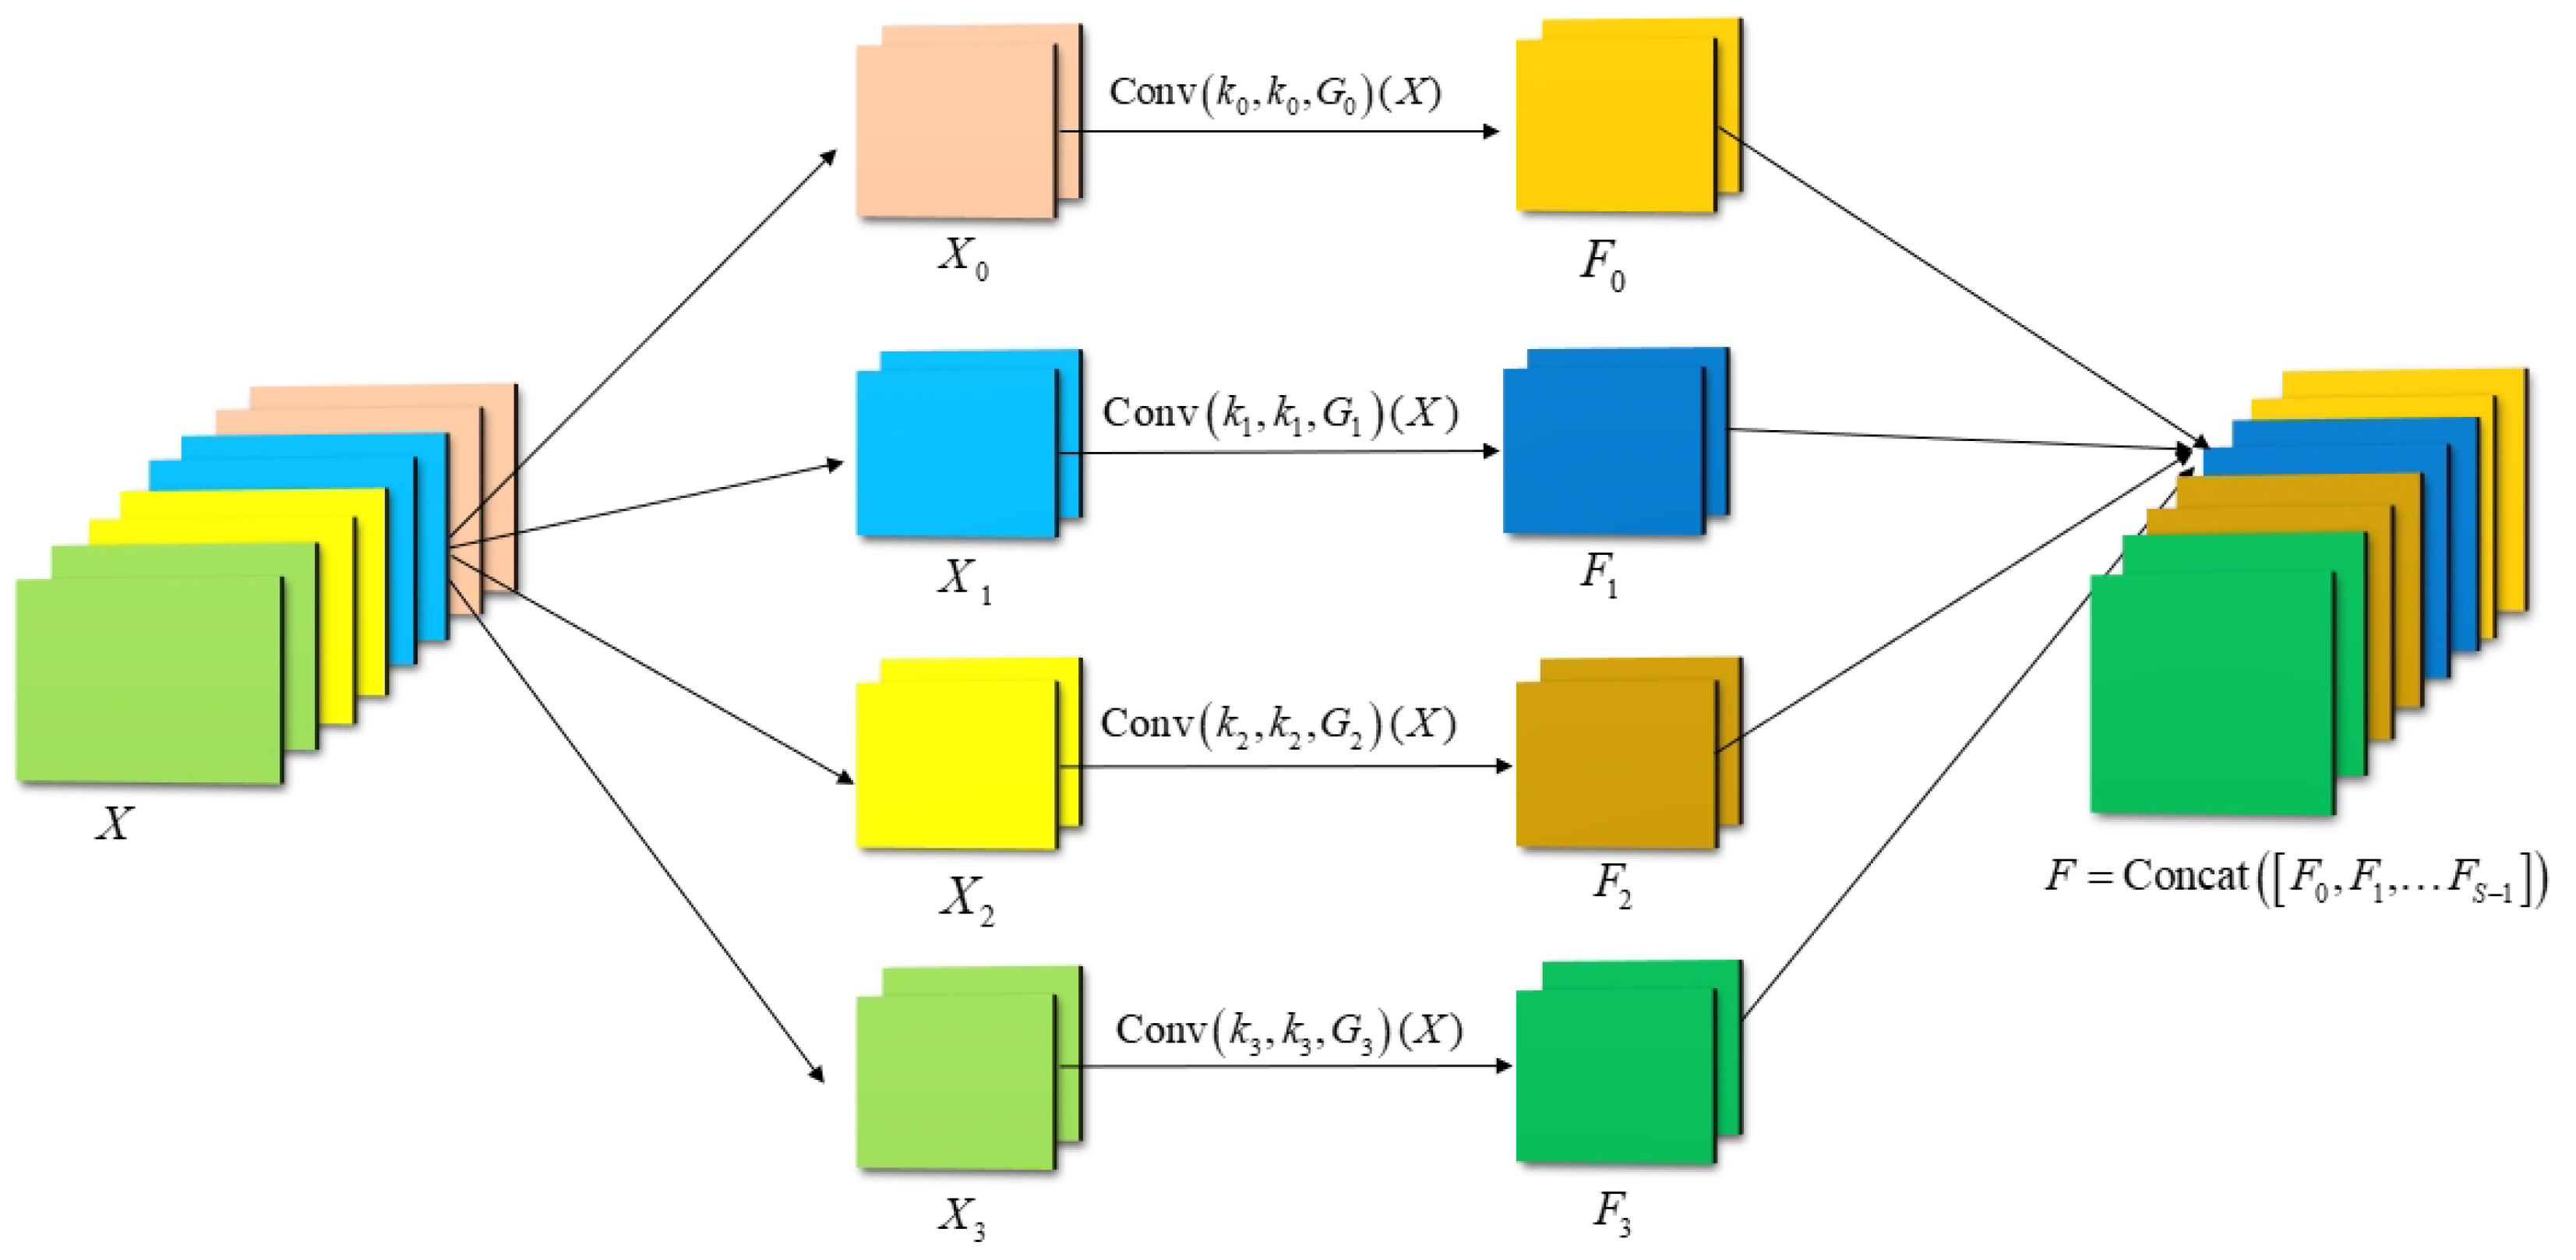
The computation process of the SPC within the PSA module is illustrated in Figure 8. This module constructs a feature pyramid using multi-scale grouped convolution to extract spatial information across different scales within channel feature maps, generating feature maps with various resolutions and depths. Specifically, the input feature map is first divided along the channel dimension into S parts, denoted as [ X 0 , X 1 , , X S 1 ] , with each part containing C = C S channels. Convolution operations with different kernel sizes are then applied to each part, where the kernel size is determined by k i = 2 × ( i + 1 ) + 1 ( i = 0 , 1 , , S 1 ) . To mitigate the significant increase in computational complexity caused by larger kernel sizes, the SPC module employs grouped convolution for each part, with the number of groups defined as G i = 2 k i 1 2 . Multi-scale feature maps are generated for each part using the formula F i = Conv ( k i × k i , G i ) ( X ) ( i = 0 , 1 , , S 1 ) , and these feature maps are concatenated along the channel dimension to form a multi-channel representation enriched with multi-scale information, expressed as F = C o n c a t ( [ F 0 , F 1 , , F S 1 ] ) . By combining multi-scale grouped convolution and concatenation, the SPC module effectively captures multi-scale spatial features while significantly reducing computational complexity, thereby enhancing the networks ability to model multi-scale features.
(b)
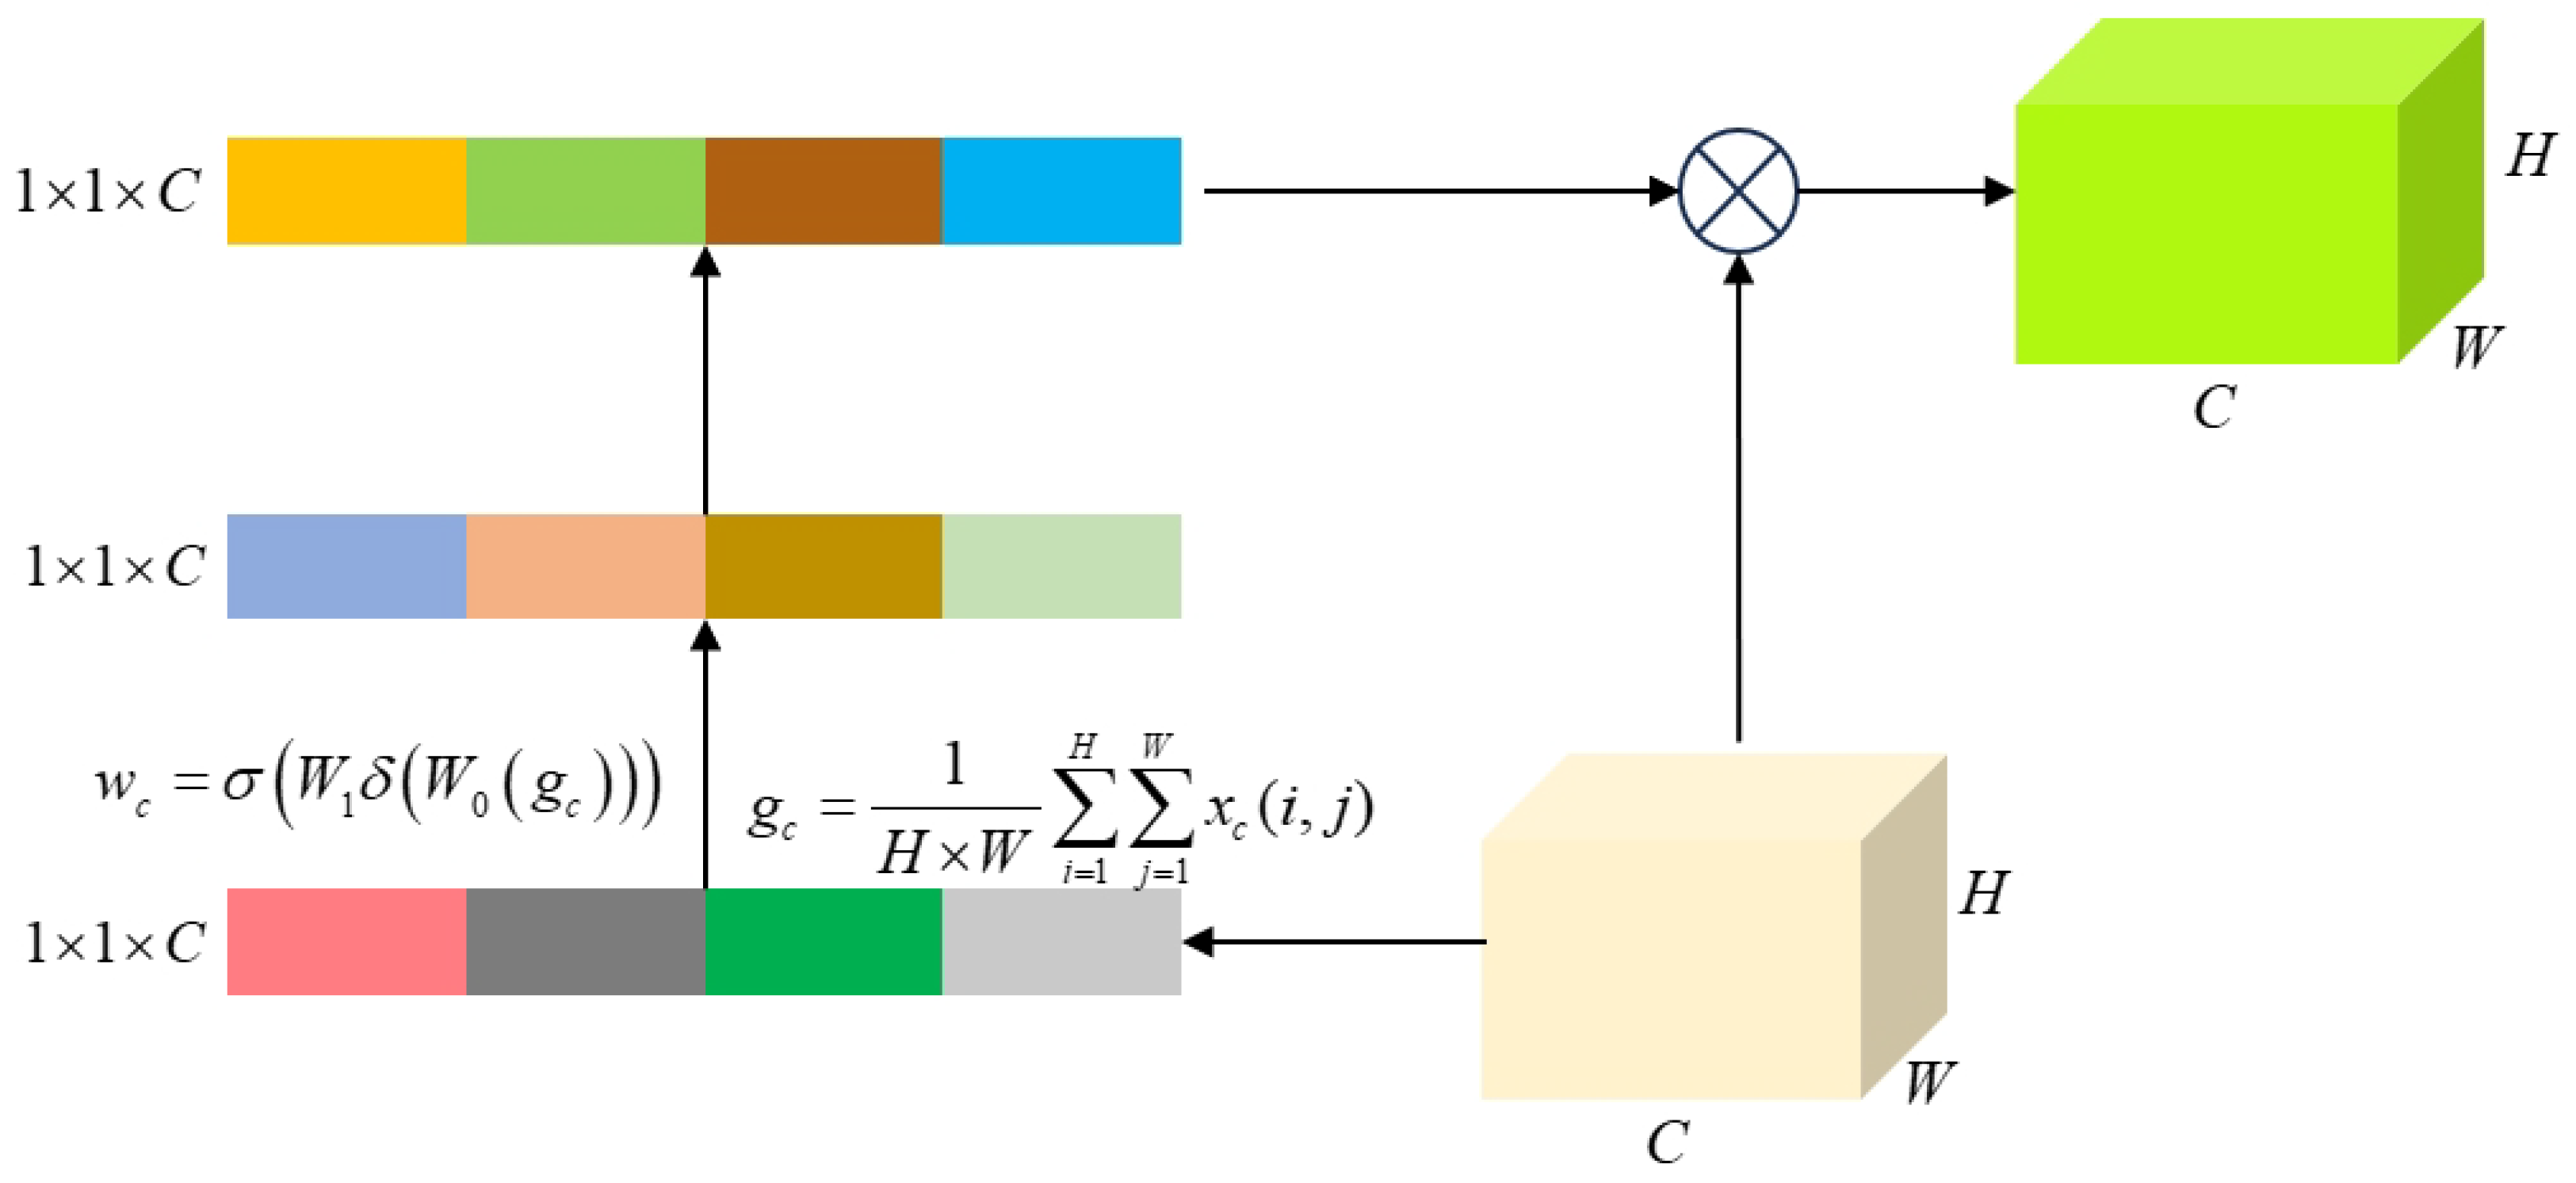
As shown in Figure 9, the SE module consists of two main components: “squeeze” and “excitation”. First, global average pooling is applied to compress the channel dimension of the input feature map, generating a global feature vector with dimensions 1 × 1 × C . Assuming the input of the c-th channel is x, the global average pooling is computed as g c = 1 H × W i = 1 H j = 1 W x c ( i , j ) . Subsequently, fully connected layers and activation functions are employed to capture inter-channel dependencies and compute attention weights. The attention weight for the c-th channel is defined as w c = σ W 1 δ ( W 0 ( g c ) ) , where σ and δ denote the Sigmoid and ReLU activation functions, respectively, and W 0 and W 1 represent the weight matrices of the two fully connected layers. The fully connected layers perform linear transformations on the input data, while the activation functions introduce non-linearity, effectively modeling the semantic dependencies across distant channels. Finally, the attention weights are normalized using a Softmax function and fused with the outputs of the multi-scale feature extraction module through weighted integration, thereby enhancing the representational capacity of the image features.

3.4.3. Swish Function

Inspired by neural networks that utilize Sigmoid functions for gating mechanisms, such as Long Short-Term Memory (LSTM) networks, Swish has emerged as a self-gating activation function with significant advantages. It effectively controls the magnitude of feature values while maintaining data stability in deeper networks, thereby improving training efficiency and overall performance. Swish acts as a gating mechanism by filtering the input data x, regulating the flow of information from lower to higher layers, and connecting to the feature map through shortcut paths. This characteristic makes it particularly suitable for Local Response Normalization (LRN) and enables it to outperform other activation functions in deep networks with more than 40 layers [39]. The mathematical expression for the Swish function is given as follows:
f ( x ) = x · Sigmoid ( β x ) = x 1 + e β x
where β is a learnable parameter, and f ( x ) ( 0 , 1 ) .
To further enhance the performance of the proposed image steganalysis model, this study incorporates Swish as a replacement for all ReLU activation functions in the ResNet50 architecture. This modification is implemented on top of the residual units enhanced with the PSA attention module, aiming to improve the model’s capability in extracting and classifying steganographic features effectively.

3.4.4. Joint Loss Function

The Softmax loss function effectively ensures clear differentiation between different classes. However, it cannot account for intra-class variations. In the task of image steganalysis, the steganographic difference feature maps for different algorithms often exhibit significant similarity within the same region. Relying solely on Softmax loss may lead to the misclassification of steganographic algorithms, thus affecting the model’s accuracy in identifying steganographic methods. To improve the performance of image steganalysis, the design of the loss function must simultaneously enhance inter-class feature separability and maintain intra-class feature compactness.
To address this issue, this study proposes a combined loss function that integrates Softmax loss with ArcFace loss. ArcFace loss amplifies subtle inter-class feature differences by introducing an angular margin, thereby improving classification performance. Its formulation is expressed as
L a = 1 N i = 1 N log e s · cos ( θ y i + m ) e s · cos ( θ y i + m ) + j y i e s · cos ( θ j )
where s represents a feature scaling factor that controls the distribution range of features, m denotes the angular margin that enhances inter-class separability, and θ y i refers to the angle between sample i and its corresponding class center. In the PSA-ResNet model, the combined loss function is formulated as:
L = L s + λ L a
Here, L s corresponds to the Softmax loss, L a represents the ArcFace loss, and λ is a weight parameter used to balance the contribution of ArcFace loss within the combined loss function.

3.4.5. Image Steganalysis Based on the Improved ResNet50 Algorithm

ResNet50, as a deep network, fails to effectively capture the differences in image steganalysis features across different levels and granularities during feature fusion. This limitation reduces the contribution of key channel features to the improvement of algorithm performance. To address this issue, this paper proposes an improved ResNet50 deep learning algorithm integrated with a visual attention mechanism for image steganalysis tasks. The structure of the improved model is shown in Figure 10.
Specifically, a PSA attention module is introduced into each residual unit to adaptively recalibrate the importance of each feature channel, which is then fused with the original features, thereby significantly enhancing the utilization efficiency of key features. Furthermore, the network’s activation function is replaced with Swish, and the model is trained using the newly adopted Ranger optimizer to further optimize its performance. Additionally, by incorporating a joint loss function, the improved algorithm not only strengthens the differentiation between different classes but also effectively reduces intra-class variations in steganographic feature maps, thereby enhancing the model’s accuracy and robustness in identifying steganographic algorithms.

4. Experiments and Analysis of Results

4.1. Datasets and Data Processing

The BOSSbase V1.01 dataset contains 10,000 grayscale images captured by multiple digital cameras, with a resolution of 512 × 512 pixels and stored in PGM format [40]. To make the dataset suitable for frequency domain steganographic algorithms, the original PGM images were first converted to JPEG format. Additionally, to expand the dataset and improve the robustness of model training, data augmentation techniques were employed. Specifically, six widely used steganographic algorithms (WOW, HUGO, S-UNIWARD, nsF5, J-UNIWARD, and UERD) were used to embed steganographic content into the images at embedding rates (bit per pixel, bpp) of 0.2 bpp and 0.4 bpp, individually. For each algorithm and embedding rate, 10,000 stego images were generated, resulting in a total of 120,000 stego images. However, these stego images cannot be directly used for model training and validation, as the critical information for steganalysis lies in the differences between the stego images and their corresponding cover images. Therefore, the pixel-wise differences between the stego and cover images were extracted, and the resulting difference features were saved in PNG format. This process produced 120,000 difference feature images, effectively highlighting the regions impacted by steganographic embedding while suppressing irrelevant information.
To align with the local matching analysis strategy adopted in the proposed method, the difference feature images were further processed using a sliding window partitioning approach. Specifically, a sliding window of 224 × 224 pixels was applied with a step size of 100 pixels. Each 512 × 512 difference feature image was divided into 9 smaller images of size 224 × 224 , expanding the dataset size from 120,000 images to 1,080,000 images.
The final processed dataset occupies 3.4 GB of storage, which is a modest increase compared to the 2.44 GB size of the original BOSSbase dataset. Despite the relatively small increase in storage, the number of samples increased significantly from 10,000 to 1,080,000, representing a 108-fold expansion.

4.2. Experimental Environment and Parameter Setup

The experimental hardware and software environment included the Windows 11 operating system, an i7-13700K CPU, an RTX 3090 GPU (24 GB of memory), and 32 GB of RAM. Python 3.10 was used as the programming language, and the deep learning framework was PyTorch 2.0.1. CUDA 11.8 and cuDNN 8.9 were employed to accelerate training on the GPU, significantly improving training efficiency and computational performance. In terms of experimental settings, the preprocessed 1,080,000 224 × 224 steganographic difference feature images were divided into training, validation, and test sets in a 6:2:2 ratio. The initial learning rate of the model was set to 0.0001, with a batch size of 128. The training process utilized a combined loss function, and the Ranger optimizer was employed to further enhance the training process.
The confusion matrix was used as a key evaluation tool for the performance of the classification model. It is intuitive, simple, and easy to calculate, and it provides a clear representation of the distribution of classification results. The confusion matrix is defined as follows:
Confusion Matrix = T P F P F N T N
where T P (True Positive) represents the number of samples correctly classified as positive, F P (False Positive) represents the number of negative samples incorrectly classified as positive, F N (False Negative) represents the number of positive samples incorrectly classified as negative, and T N (True Negative) represents the number of negative samples correctly classified as negative. To evaluate the performance of the model in the steganographic algorithm classification task, accuracy was adopted as the evaluation metric, and its formula is as follows:
Accuracy = T P + T N T P + F N + F P + T N
Accuracy comprehensively reflects the model’s classification performance and effectiveness in detecting steganographic algorithms.

4.3. Feasibility Validation of the Core Analysis Area Selection Method

In order to verify the feasibility of selecting the core analysis region based on image complexity, the experiment adopts six mainstream steganography algorithms, namely WOW, HUGO, S-UNIWARD, nsF5, J-UNIWARD, and UERD, to embed the information in the carrier image and to analyze the relationship between image complexity and the region embedded with steganographic information.
The experiment was conducted on the carrier image Figure 11a, which was divided into 9 different regions. The image complexity of each region was calculated and the amount of information embedded under different steganography algorithms was counted; the results are shown in Table 1. In addition, Figure 11b demonstrates the positional distribution of the information embedded in the HUGO steganography algorithm, and the white dots indicate the embedding positions of the steganographic information.
From Table 1, it can be seen that the steganographic information is mainly concentrated in regions of high image complexity, such as regions 5, 7, 8, and 9, while regions of lower complexity, such as region 3, have almost no information embedded in them. This indicates that image complexity is an important factor affecting the amount of steganographic information embedded.
In order to verify the generality of the above trend, the experiment further randomly selected 50 images as test samples and calculated the complexity of each image and the amount of information embedded under the six steganographic algorithms, and the results are shown in Figure 12.
As can be seen from Figure 12, there is a significant positive correlation between image complexity and the amount of steganographic information embedded, and the correlation coefficients of each steganographic algorithm are high. This further validates the conclusion that regions with high image complexity are more likely to embed steganographic information.
In summary, regions with higher image complexity have significantly more implicitly written information embedded in them, while regions with low complexity have almost no information embedded in them. This indicates that the method of selecting core analysis images based on image complexity has high feasibility and practical value. By focusing on the core region with high complexity, the method can effectively reduce the amount of computation and improve the efficiency and accuracy of the steganography algorithm recognition, which is especially suitable for steganographic information detection scenarios in large images.

4.4. Feasibility Validation and Timeliness Analysis of PSNR-Based Image Similarity Assessment Methods

Currently, in addition to P S N R , the mainstream image similarity evaluation methods include the Structure Similarity Index Measure ( S S I M ) [36]. S S I M measures the similarity between images x and y by evaluating their three aspects: brightness, contrast, and structure. Compared with the traditional P S N R metric, S S I M can better simulate the human visual system’s perception of image quality, and is therefore considered to be more advantageous in image similarity assessment. The formula for S S I M is as follows:
S S I M ( x , y ) = ( 2 μ x μ y + C 1 ) ( 2 σ x y + C 2 ) ( μ x 2 + μ y 2 + C 1 ) ( σ x 2 + σ y 2 + C 2 )
where μ x and μ y are the mean luminance of image x and y, respectively, σ x 2 and σ y 2 are the variances of image x and y, respectively, σ x y is the covariance between them, and C 1 and C 2 are constants used to avoid the denominator being zero.
To verify the feasibility and effectiveness of P S N R as an index for image similarity evaluation, this experiment selects the six steganographic algorithms mentioned above and evaluates the steganographic images in comparison with the original images in terms of P S N R and S S I M at different embedding rates. The experimental results are shown in Table 2.
From Table 2, it can be seen that the P S N R value of the steganographic image and the original image decreases significantly as the embedding rate increases, indicating that the higher the embedding rate, the lower the image similarity. This trend has a strong correlation with the change in embedding rate, while the change in S S I M is small and always stays around 99%, which makes it difficult to effectively distinguish the similarity of images under different embedding rates. This indicates that P S N R can reflect the effect of embedding rate on image similarity more sensitively, and is suitable as an index to measure the similarity of steganographic images.
In addition, in order to further evaluate the timeliness of the image matching process, we conducted detailed experimental analyses of the image matching time performance under six types of steganographic algorithms, namely, WOW, HUGO, S-UNIWARD, nsF5, J-UNIWARD, and UERD. The experimental results show that the average time of image matching is only 0.15 s, and the overall matching speed is maintained at a high level. Although these steganographic algorithms introduce different image features when embedding data, our matching strategy can still effectively handle images containing steganographic data and maintain a fast response speed.

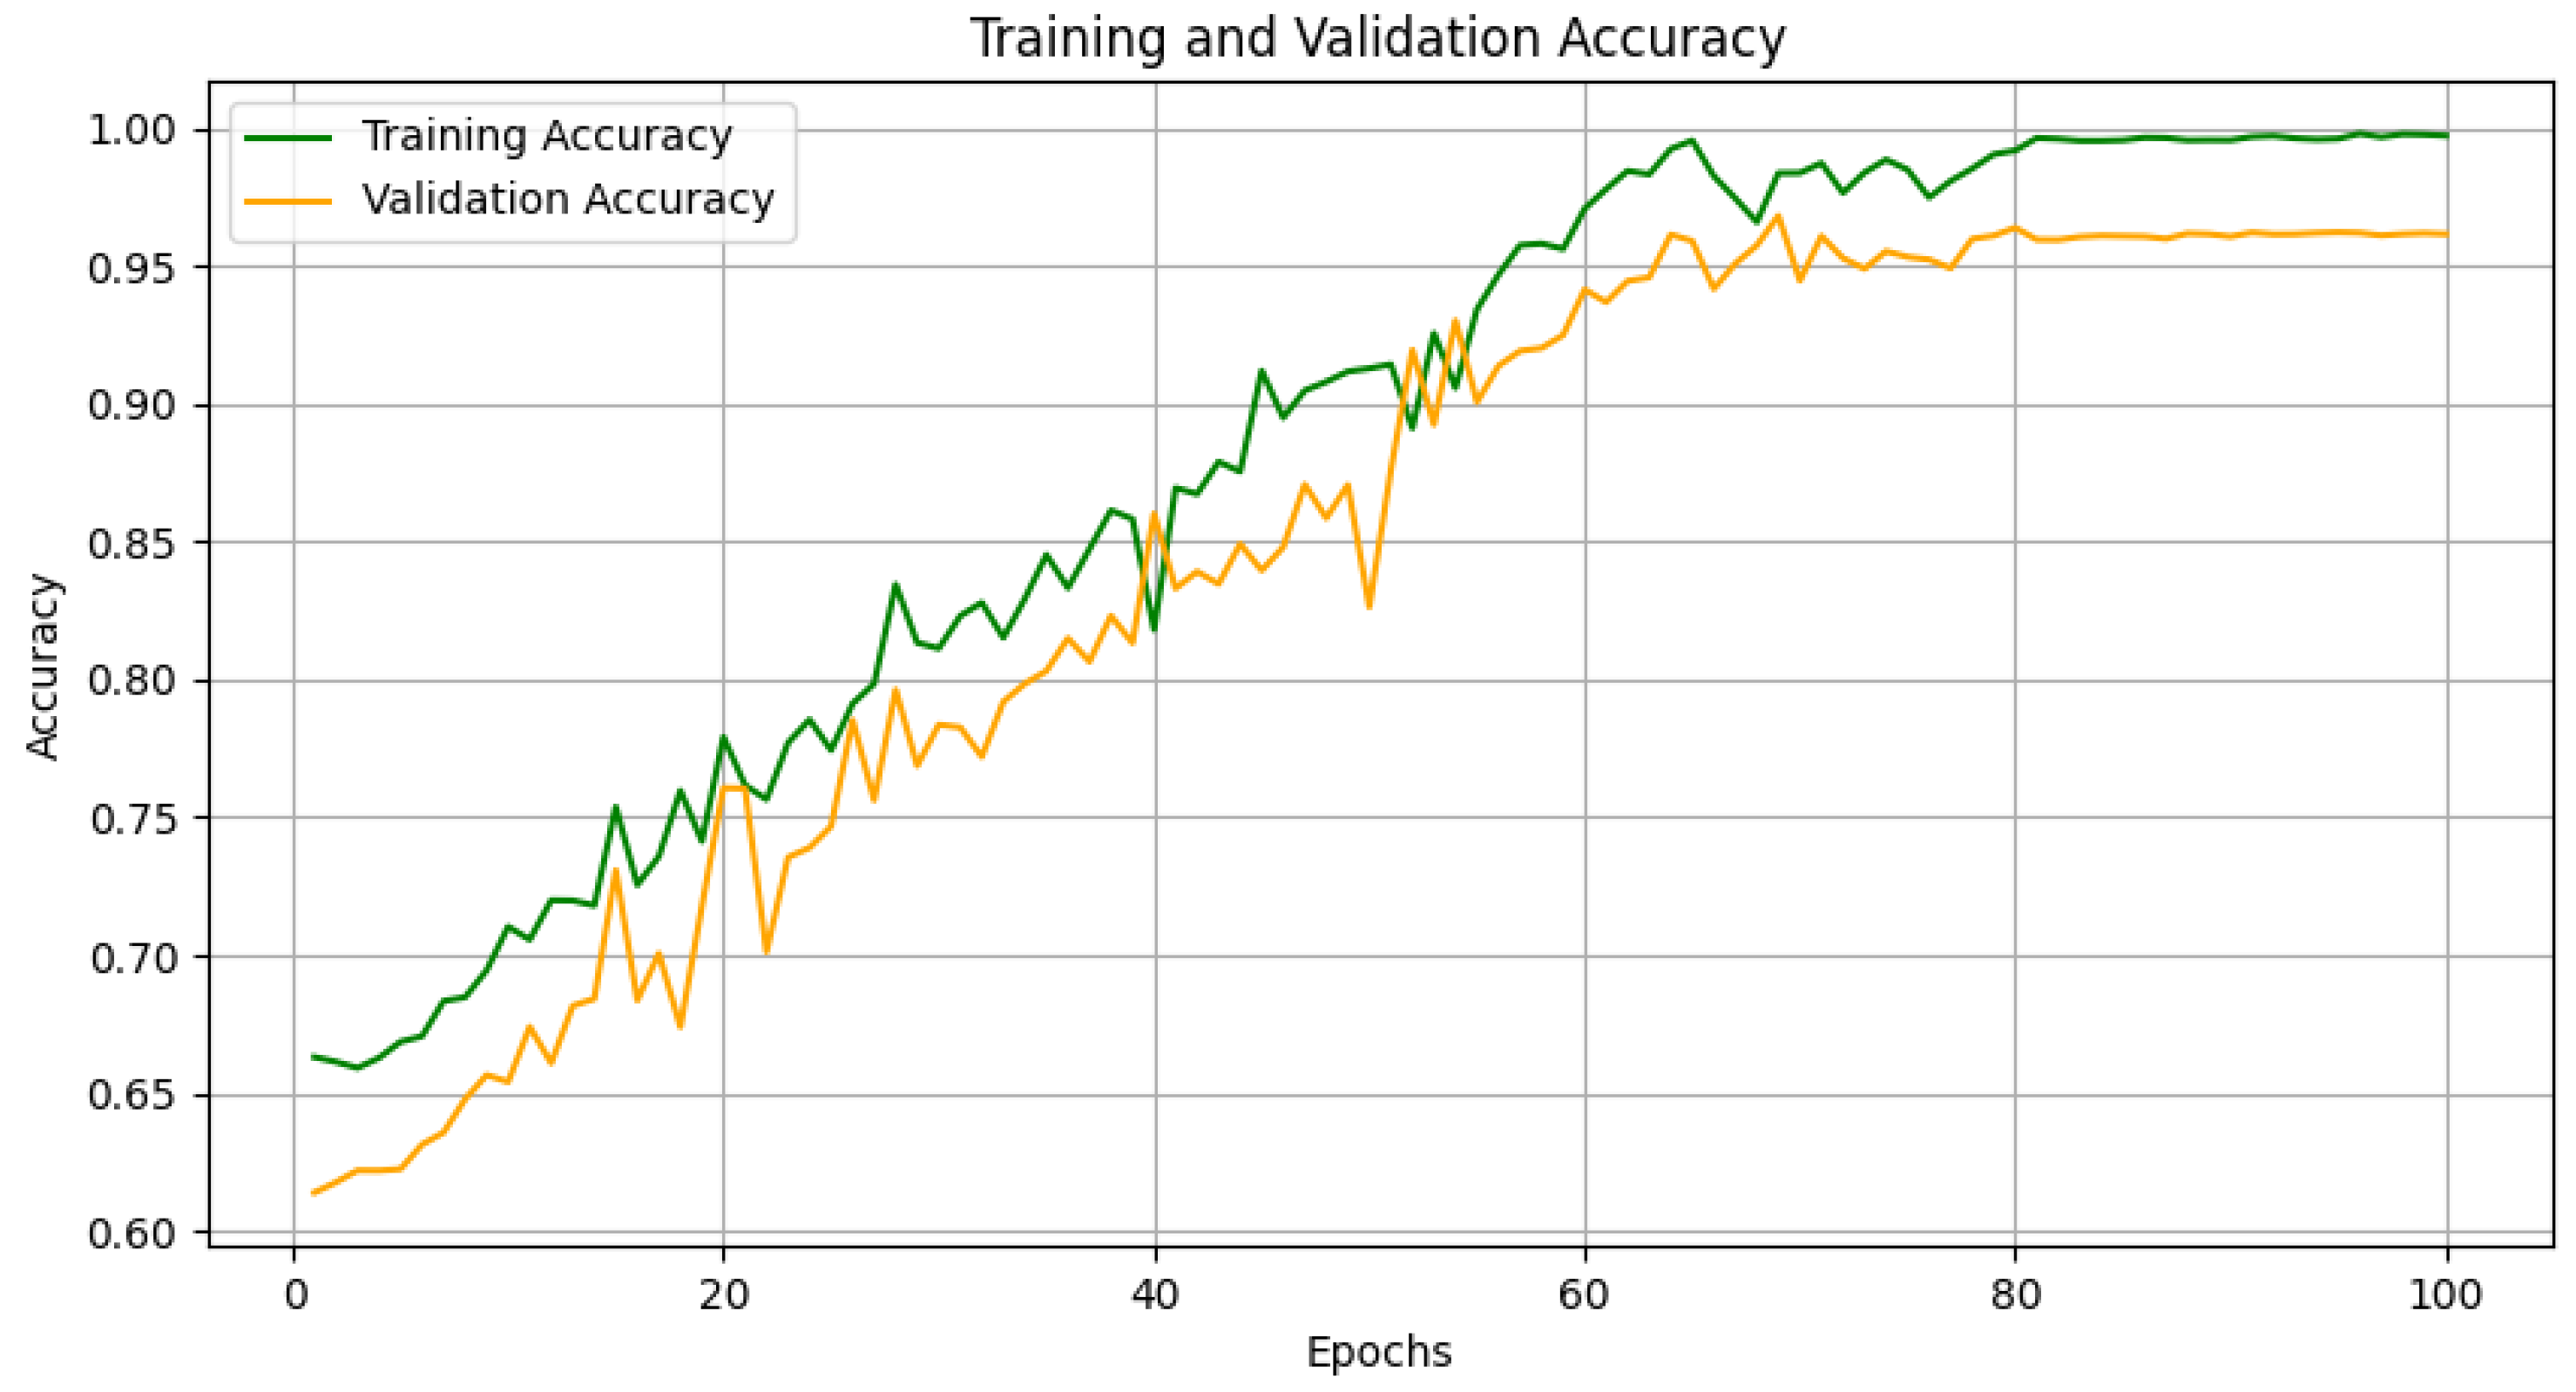
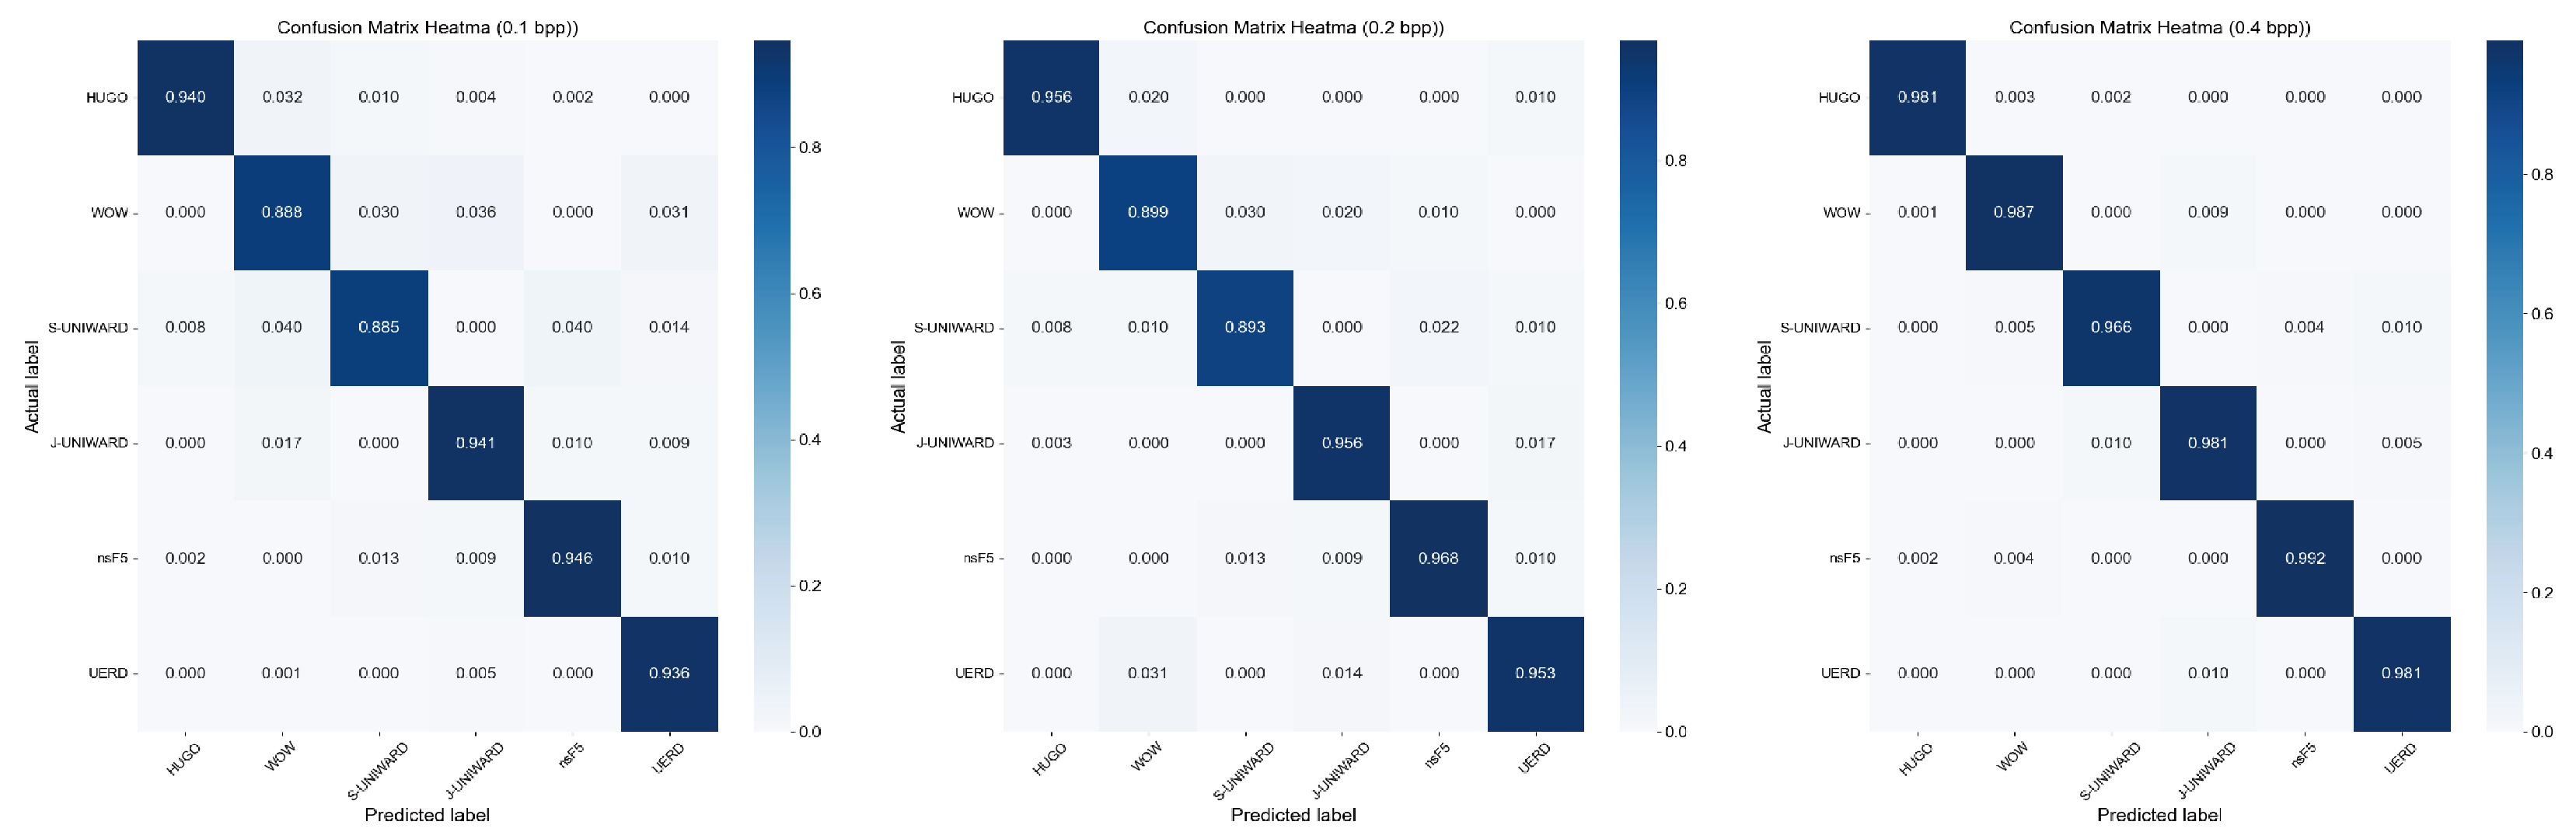
4.5. Performance Validation of Steganographic Algorithm Recognition Model Based on Improved ResNet50

After 100 rounds and about 23 h of training, the accuracy results of the model in the training set and the validation dataset are shown in Figure 13. The results show that the proposed algorithm achieves 96.11% accuracy in the validation set. These results show that the algorithm not only accurately detects whether an image contains steganographic information, but also reliably and accurately identifies the type of steganographic algorithm. This highlights its potential as a powerful technical support for image steganalysis.

4.5.1. Impact of ResNet50 Improvements on Image Steganalysis

In order to further explore the effectiveness of the improvements made to ResNet50 in this paper, we designed six sets of ablation experiments in order to analyze and verify the effects of the PSA attention module, the Swish function, the Ranger optimizer, and the joint loss function on the results of image steganalysis. The results of the relevant ablation experiments are shown in Table 3.
To verify the effectiveness of the PSA attention module, the residual units in the original ResNet50 model were replaced with the improved residual units containing the PSA module. As shown in Table 3, the accuracy reached 94.98% after incorporating only the PSA attention module, representing an improvement of 2.19%. This result indicates that the PSA attention module effectively captures the differences in steganographic features at various levels and granularities, thereby contributing to the development of a more robust image steganalysis model.
To evaluate the effectiveness of the Swish activation function, all ReLU activation functions in the model were replaced with the Swish function in this experiment. The Swish activation function enhances the model’s performance by producing a strong regularization effect, which is further amplified by its smooth and continuous properties. This substitution resulted in an improvement in the model’s recognition rate by 0.62%.
Furthermore, to assess the impact of introducing a joint loss function, this experiment added ArcFace loss on top of the original model’s Softmax loss. The experimental results demonstrate that the incorporation of the joint loss function improved the model’s accuracy by 0.97%, highlighting its effectiveness in enhancing model performance.
When evaluating the impact of the Ranger optimizer on model performance, the experiment replaced the commonly used Adam optimizer with the Ranger optimizer. The results indicate that the introduction of the Ranger optimizer improved the model’s accuracy by 0.42%, showcasing its advantages in optimizing the model and enhancing its generalization ability.
In summary, the combination of the PSA attention mechanism, Swish activation function, Ranger optimizer, and joint loss function effectively improved the ResNet50 model for image steganalysis in this study. These findings demonstrate that the proposed improvements are both effective and reliable.

4.5.2. Comparison with Existing Research on Common Image Steganalysis

In order to further verify the advancement and effectiveness of the proposed scheme in this paper, this paper compares the scheme with the more advanced image steganalysis methods in recent years, and the relevant results are shown in Table 4 and Table 5. Table 4 shows the comparison of the accuracy of the proposed method with other methods for three kinds of spatial steganography algorithms under the embedding rates of 0.1 bpp, 0.2 bpp, and 0.4 bpp, while Table 5 shows the comparison of the accuracy of three kinds of frequency steganography algorithms under the same embedding rates.
From Table 4 and Table 5, it can be seen that the advantage of this model is that it has better detection performance for both spatial and frequency domain steganography algorithms at all embedding rates, especially in the frequency domain where the detection accuracy reaches more than 93%, which is about 1–42.54% ahead of other methods. For the spatial domain steganography algorithm, the detection accuracy of this model in WOW and S-UNIWARD with a 0.1 bpp embedding rate is relatively low, but it also reaches more than 88%, which is about 1–37.46% ahead of the other methods and is better than the other traditional steganography models or deep learning-based steganography analysis models. To further demonstrate the detailed classification of different steganographic algorithms, this paper visualizes and analyzes the steganographic algorithm recognition results obtained by the model at 0.1 bpp, 0.2 bpp, and 0.4 bpp using a confusion matrix, as shown in Figure 14.
From Figure 14, it can be seen that with the increase in the steganographic embedding rate, the model’s misclassification of steganographic algorithms is gradually reduced, especially at high embedding rates. Thus, the model can more accurately distinguish between different steganographic algorithms, and the chance of misclassification is greatly reduced. In addition, our proposed model has been tested to be able to complete steganography algorithm recognition at an average speed of about 0.26 s per image. Even in the face of different types of steganography algorithms, our model is still able to maintain a high recognition accuracy while ensuring a fast response. This shows that although different steganographic algorithms may introduce different image features and affect the complexity of the image, our proposed model still demonstrates excellent practicality and processing efficiency.

5. Conclusions

This paper addresses the limitations of existing image steganography analysis methods, such as the limited range of detectable steganography algorithms, lack of versatility, and a focus on the binary classification of steganographic and security images. We propose a steganography algorithm recognition scheme based on image big data matching with an improved ResNet50. The method enhances analysis efficiency by selecting the region with the highest image complexity as the core analysis area, focusing on key features. Image big data matching technology is then used to match the original image, generating a steganographic feature image through difference analysis. The recognition performance is further improved by integrating the enhanced ResNet50 model. Experimental results show that the method achieves a detection accuracy of 96.11%, supports multi-size and multi-format image analysis, and significantly reduces computational costs. Additionally, we are the first to link image complexity with the amount of information embedded in adaptive steganography algorithms, confirming that higher complexity regions are more likely to contain steganographic information. The analysis of these regions demonstrates the method’s strong generality and practicality, offering valuable insights for steganography analysis research and its practical applications. Future work will focus on the efficient extraction and decoding of steganographic information to further improve the application and effectiveness of steganalysis.

Author Contributions

X.G.: data curation, software, writing—original draft preparation; J.Y.: conceptualization, methodology; L.L.: algorithm framework design; L.T.: writing—reviewing and editing. All authors have read and agreed to the published version of the manuscript.

Funding

This research was funded by the National Key R&D Program of China, grant number 2024QY1703.

Data Availability Statement

The data that support the findings of this study are available from the corresponding author upon reasonable request.

Acknowledgments

The authors would like to express their sincere gratitude for the financial and technical support provided by the program, which significantly facilitated the progress of this research.

Conflicts of Interest

The authors declare no conflicts of interest.

References

  1. Hu, K.; Wang, M.; Ma, X.; Chen, J.; Wang, X.; Wang, X. Learning-based image steganography and watermarking: A survey. Expert Syst. Appl. 2024, 249, 123715. [Google Scholar] [CrossRef]
  2. Wang, L.; Banerjee, S.; Cao, Y.; Mou, J.; Sun, B. A new self-embedding digital watermarking encryption scheme. Nonlinear Dyn. 2024, 112, 8637–8652. [Google Scholar] [CrossRef]
  3. Vyas, N.; Kakade, S.M.; Barak, B. On provable copyright protection for generative models. In Proceedings of the 40th International Conference on Machine Learning, Honolulu, HI, USA, 23–29 July 2023; pp. 35277–35299. [Google Scholar]
  4. Zhao, P.; Wang, B.; Qin, Z.; Ding, Y.; Choo, K.K.R. A privacy protection scheme for green communication combining digital steganography. Peer-to-Peer Netw. Appl. 2024, 17, 2507–2522. [Google Scholar] [CrossRef]
  5. Xiang, X.; Tan, Y.; Qin, J.; Tan, Y. Advancements and challenges in coverless image steganography: A survey. Signal Process. 2024, 228, 109761. [Google Scholar] [CrossRef]
  6. Eid, W.M.; Alotaibi, S.S.; Alqahtani, H.M.; Saleh, S.Q. Digital image steganalysis: Current methodologies and future challenges. IEEE Access 2022, 10, 92321–92336. [Google Scholar] [CrossRef]
  7. Priscilla, C.V.; HemaMalini, V. Steganalysis Techniques: A Systematic Review. J. Surv. Fish. Sci. 2023, 10, 244–263. [Google Scholar] [CrossRef]
  8. Farooq, N.; Selwal, A. Image steganalysis using deep learning: A systematic review and open research challenges. J. Ambient Intell. Humaniz. Comput. 2023, 14, 7761–7793. [Google Scholar] [CrossRef]
  9. He, K.; Zhang, X.; Ren, S.; Sun, J. Deep residual learning for image recognition. In Proceedings of the 2016 IEEE Conference on Computer Vision and Pattern Recognition, Las Vegas, NV, USA, 27–30 June 2016; pp. 770–778. [Google Scholar]
  10. Pantic, I.; Cumic, J.; Dugalic, S.; Petroianu, G.A.; Corridon, P.R. Gray level co-occurrence matrix and wavelet analyses reveal discrete changes in proximal tubule cell nuclei after mild acute kidney injury. Sci. Rep. 2023, 13, 4025. [Google Scholar] [CrossRef]
  11. Zhou, J.; Jia, X.; Shen, L.; Wen, Z.; Ming, Z. Improved softmax loss for deep learning-based face and expression recognition. Cogn. Comput. Syst. 2019, 1, 97–102. [Google Scholar] [CrossRef]
  12. Deng, J.; Guo, J.; Xue, N.; Zafeiriou, S. Arcface: Additive angular margin loss for deep face recognition. In Proceedings of the 2019 IEEE/CVF Conference on Computer Vision and Pattern Recognition, Long Beach, CA, USA, 15–20 June 2019; pp. 4690–4699. [Google Scholar]
  13. Liu, J.; Jiao, G.; Sun, X. Feature passing learning for image steganalysis. IEEE Signal Process. Lett. 2022, 29, 2233–2237. [Google Scholar] [CrossRef]
  14. Sakshi, S.; Verma, S.; Chaturvedi, P.; Yadav, S.A. Least Significant Bit Steganography for Text and Image hiding. In Proceedings of the 2022 3rd International Conference on Intelligent Engineering and Management (ICIEM), London, UK, 27–29 April 2022; pp. 415–421. [Google Scholar]
  15. Laishram, D.; Tuithung, T. A secure adaptive Hidden Markov Model-based JPEG steganography method. Multimed. Tools Appl. 2024, 83, 38883–38908. [Google Scholar] [CrossRef]
  16. Salama, W.M.; Aly, M.H.; Abouelseoud, Y. Deep learning-based spam image filtering. Alex. Eng. J. 2023, 68, 461–468. [Google Scholar] [CrossRef]
  17. Willis, J.R.; Sivaganesan, M.; Haugland, R.A.; Kralj, J.; Servetas, S.; Hunter, M.E.; Jackson, S.A.; Shanks, O.C. Performance of NIST SRM® 2917 with 13 recreational water quality monitoring qPCR assays. Water Res. 2022, 212, 118114. [Google Scholar] [CrossRef] [PubMed]
  18. Holub, V.; Fridrich, J. Phase-aware projection model for steganalysis of JPEG images. In Proceedings of the Media Watermarking, Security, and Forensics 2015, San Francisco, CA, USA, 9–11 February 2015; Volume 9409, pp. 259–269. [Google Scholar]
  19. Wang, S.; Shi, J.; Ye, Z.; Dong, D.; Yu, D.; Zhou, M.; Liu, Y.; Gevaert, O.; Wang, K.; Zhu, Y.; et al. Predicting EGFR mutation status in lung adenocarcinoma on computed tomography image using deep learning. Eur. Respir. J. 2019, 53, 1800986. [Google Scholar] [CrossRef]
  20. Qian, Y.; Dong, J.; Wang, W.; Tan, T. Deep learning for steganalysis via convolutional neural networks. In Proceedings of the Media Watermarking, Security, and Forensics 2015, San Francisco, CA, USA, 9–11 February 2015; Volume 9409, pp. 171–180. [Google Scholar]
  21. Xu, G.; Wu, H.Z.; Shi, Y.Q. Structural design of convolutional neural networks for steganalysis. IEEE Signal Process. Lett. 2016, 23, 708–712. [Google Scholar] [CrossRef]
  22. Ye, J.; Ni, J.; Yi, Y. Deep learning hierarchical representations for image steganalysis. IEEE Trans. Inf. Forensics Secur. 2017, 12, 2545–2557. [Google Scholar] [CrossRef]
  23. Boroumand, M.; Chen, M.; Fridrich, J. Deep residual network for steganalysis of digital images. IEEE Trans. Inf. Forensics Secur. 2018, 14, 1181–1193. [Google Scholar] [CrossRef]
  24. Zhang, R.; Zhu, F.; Liu, J.; Liu, G. Depth-wise separable convolutions and multi-level pooling for an efficient spatial CNN-based steganalysis. IEEE Trans. Inf. Forensics Secur. 2019, 15, 1138–1150. [Google Scholar] [CrossRef]
  25. Yedroudj, M.; Comby, F.; Chaumont, M. Yedroudj-net: An efficient CNN for spatial steganalysis. In Proceedings of the 2018 IEEE International Conference on Acoustics, Speech and Signal Processing (ICASSP), Calgary, AB, Canada, 15–20 April 2018; pp. 2092–2096. [Google Scholar]
  26. Wang, X.; Li, J.; Song, Y. DDAC: A feature extraction method for convolutional neural network image steganalysis model. J. Commun. 2022, 43, 68–81. [Google Scholar]
  27. Chao, X.; Yaqi, L.; Qingchu, G.; Xin, J.; Yanshuo, Z.; Shengwei, X. Nonlinear residual-based steganalysis of JPEG images. J. Commun. 2023, 44, 142–152. [Google Scholar]
  28. Li, Y.; Ling, B.; Hu, D.; Zheng, S.; Zhang, G. A Deep Learning Driven Feature Based Steganalysis Approach. Intell. Autom. Soft Comput. 2023, 37. [Google Scholar] [CrossRef]
  29. Ma, Y.; Yang, Z.; Li, T.; Xu, L.; Qiao, Y. Image steganalysis method based on cover selection and adaptive filtered residual network. Comput. Graph. 2023, 115, 43–54. [Google Scholar] [CrossRef]
  30. Setiadi, D.R.I.M. PSNR vs. SSIM: Imperceptibility quality assessment for image steganography. Multimed. Tools Appl. 2021, 80, 8423–8444. [Google Scholar] [CrossRef]
  31. Wang, J.; Liu, D.; Fu, X.; Xiao, F.; Tian, C. DHash: Dynamic Hash Tables with Non-blocking Regular Operations. IEEE Trans. Parallel Distrib. Syst. 2022, 33, 3274–3290. [Google Scholar] [CrossRef]
  32. Auchère, F.; Soubrié, E.; Pelouze, G.; Buchlin, É. Image enhancement with wavelet-optimized whitening. arXiv 2022, arXiv:2212.10134. [Google Scholar] [CrossRef]
  33. Li, J.; Wang, X.; Song, Y.; Wang, P. FPFnet: Image steganalysis model based on adaptive residual extraction and feature pyramid fusion. Multimed. Tools Appl. 2024, 83, 48539–48561. [Google Scholar] [CrossRef]
  34. Holub, V.; Fridrich, J. Digital image steganography using universal distortion. In Proceedings of the First ACM Workshop on Information Hiding and Multimedia Security, Montpellier, France, 17–19 June 2013; pp. 59–68. [Google Scholar]
  35. Beneš, M.; Hofer, N.; Böhme, R. The effect of the JPEG implementation on the cover-source mismatch error in image steganalysis. In Proceedings of the 2022 30th European Signal Processing Conference (EUSIPCO), Belgrade, Serbia, 29 August–2 September 2022; pp. 1057–1061. [Google Scholar]
  36. Bakurov, I.; Buzzelli, M.; Schettini, R.; Castelli, M.; Vanneschi, L. Structural similarity index (SSIM) revisited: A data-driven approach. Expert Syst. Appl. 2022, 189, 116087. [Google Scholar] [CrossRef]
  37. Wang, Z.; Feng, G.; Qian, Z.; Zhang, X. JPEG steganography with content similarity evaluation. IEEE Trans. Cybern. 2023, 53, 5082–5093. [Google Scholar] [CrossRef]
  38. Hoang, T.N.; Kim, D. Supervised contrastive ResNet and transfer learning for the in-vehicle intrusion detection system. Expert Syst. Appl. 2024, 238, 122181. [Google Scholar] [CrossRef]
  39. Ramachandran, P.; Zoph, B.; Le, Q.V. Swish: A Self-Gated Activation Function. arXiv 2017, arXiv:1710.05941. [Google Scholar]
  40. Bas, P.; Filler, T.; Pevný, T. “Break Our Steganographic System”: The Ins and Outs of Organizing BOSS; Springer: Berlin/Heidelberg, Germany, 2011. [Google Scholar]
  41. Xia, C.; Liu, Y.; Guan, Q.; Jin, X.; Zhang, Y.; Xu, S. Steganalysis of JPEG images using non-linear residuals. J. Commun./Tongxin Xuebao 2023, 44, 142. [Google Scholar]
Figure 1. Embedding process of adaptive steganography: (A) Cover image; (B) Stego image.
Electronics 14 01610 g001
Figure 2. System block diagram.
Electronics 14 01610 g002
Figure 3. Matching process of reference images through the local database.
Electronics 14 01610 g003
Figure 4. Image steganography differential characterization: (a) Spatial steganographic differential characterization. (b) Frequency steganographic differential characterization.
Electronics 14 01610 g004
Figure 5. Differences produced by six steganography algorithms for the same region: (A) Cover image; (B) Spatial steganographic differential characterization; (C) Frequency steganographic differential characterization.
Electronics 14 01610 g005
Figure 6. ResNet50 network architecture.
Electronics 14 01610 g006
Figure 7. PSA module structure.
Electronics 14 01610 g007
Figure 8. Calculation process of SPC.
Electronics 14 01610 g008
Figure 9. SE module structure.
Electronics 14 01610 g009
Figure 10. Schematic diagram of the improved ResNet50 image steganalysis algorithm.
Electronics 14 01610 g010
Figure 11. Schematic of the embedding position of the adaptive steganography: (a) Cover image. (b) Steganography position.
Electronics 14 01610 g011
Figure 12. Image complexity versus steganographic information content for six steganography algorithms: (A) Spatial steganographic; (B) Frequency steganographic.
Electronics 14 01610 g012
Figure 13. Model training and validation results graph.
Electronics 14 01610 g013
Figure 14. Heat map of the confusion matrix at each embedding rate.
Electronics 14 01610 g014
Table 1. Relationship between the amount of information embedded in steganography and image complexity.
ShoreImage ComplexityThe Amount of Steganography Information
HUGO [32]WOW [33]S-UNIWARD [34]J-UNIWARD [35]nsF5 [36]UERD [37]
13.11303157214371232169202273
22.95307138013441066162155223
31.9155500300320
43.49875210919141608231236289
53.50382296730772381393280400
62.434128621001801125103115
73.83679333830332526347351515
84.23709524653904228779422726
93.59842478849604126693377411
Table 2. Comparison of P S N R and S S I M with the original image after steganography with different embedding rates.
Steganographic AlgorithmPSNR [30]SSIM [36]
0.1 bpp0.2 bpp0.4 bpp0.1 bpp0.2 bpp0.4 bpp
HUGO [32]65.227661.888158.441099.996099.988199.9629
WOW [33]65.214361.817658.400799.994599.984799.9564
S-UNIWARD [34]65.214362.792359.283299.994599.984999.9576
J-UNIWARD [35]56.264552.596848.614799.969899.918799.7662
nsF5 [36]52.966849.189145.152399.855799.657499.1545
UERD [37]55.247651.602447.231299.872499.893499.6850
Table 3. Contributions of different modules to the ResNet50 network.
ModuleExp1Exp2Exp3Exp4Exp5Exp6
PSA×××
Swish function×××
Joint loss function×××
Ranger×××××
Accuracy(%)92.7994.9893.4193.7695.6996.11
The symbol × means that the module was not introduced in the model; on the contrary, ✓ means that the module was introduced in the model.
Table 4. Comparison of detection accuracies of models for spatial steganography.
MethodEmbedding RateModel Accuracy (%)
OursZhuNet [24]YeNet [22]SRNet [23]CSRNet [29]
HUGO [32]0.193.9756.7165.3356.5183.63
0.295.6259.8368.7759.3285.49
0.498.1368.3281.1669.0695.30
WOW [33]0.188.7958.8359.9959.3281.79
0.289.9176.7167.4963.5083.37
0.498.7386.1679.1884.5893.37
S-UNIWARD [34]0.188.5377.6565.4672.6878.82
0.289.2579.4668.7875.2683.99
0.496.6487.4381.1786.2395.79
Table 5. Comparison of detection accuracies of models for frequency domain steganography.
MethodEmbedding RateModel Accuracy (%)
OursGFRspam [41]DCTRspam [41]SRNet [23]CSRNet [29]
J-UNIWARD [35]0.194.1155.3251.5753.5159.71
0.295.5758.1856.5856.8562.27
0.498.0673.8370.0963.8679.05
nsF5 [36]0.194.5553.4352.9557.6979.41
0.296.7656.3355.7963.9683.40
0.499.2473.5771.2682.7998.37
UERD [37]0.193.5953.7754.3771.7671.28
0.295.3257.5556.9375.2875.82
0.498.1371.0369.4980.8788.36
Disclaimer/Publisher’s Note: The statements, opinions and data contained in all publications are solely those of the individual author(s) and contributor(s) and not of MDPI and/or the editor(s). MDPI and/or the editor(s) disclaim responsibility for any injury to people or property resulting from any ideas, methods, instructions or products referred to in the content.

