Abstract
A precision resistance measurement method based on synchronous sampling is proposed to enable accurate resistance measurement under low-current testing conditions. This method utilizes a single current source input, connecting the standard resistor and the test resistor in series. The setup is simple, easy to operate, and allows for the convenient and rapid comparison of the voltage across the resistors. The resistance value of the test resistor is determined through calculation, achieving high measurement accuracy. An experimental comparison of two standard resistors under a low current of 1 μA demonstrated that the data dispersion reached the 10−6 level, and the measurement error was within the 10−6 range. This study also employed a resistance ratio measurement method based on room-temperature Direct Current Comparator (DCC) technology to validate the superiority of the proposed synchronous sampling approach under low-current measurement conditions. The comparative analysis demonstrated that our method exhibits significant advantages over conventional DCC techniques under a low current of 1 μA. This paper presents the first demonstration of high-accuracy resistance ratio measurement using synchronous sampling under weak current conditions. Experimental results verify that at 1 μA current level, the proposed method achieves superior measurement accuracy and lower uncertainty compared to conventional precision DC current comparator techniques under identical test conditions.
1. Introduction
Precise measurement of resistance is a fundamental task in electrical metrology, and its importance has grown with advancements in technology and increasing demands for accuracy. The 2019 revision of the International System of Units (SI) marked a quantum revolution, redefining all base units in terms of fundamental physical constants [1,2,3]. Resistance, for example, is now directly linked to the quantum Hall effect, which depends solely on Planck’s constant (h) and elementary charge (e)—both invariant over time and space [4,5,6].
where:
- h: Planck constant,
- e: elementary charge,
- RK: von Klitzing constant.
- RH: Quantized Hall Resistance
National standards for DC resistance worldwide are built on the quantum Hall effect [7], primarily utilizing gallium arsenide-aluminum gallium arsenide heterostructures to produce quantum Hall resistors [8,9,10]. Resistance value transfer is typically conducted via cryogenic current comparator (CCC) bridges or, in some cases, direct current comparator (DCC) bridges [11,12,13]. However, with the discovery of the quantum Hall effect in graphene, graphene-based quantum Hall resistors have emerged as promising alternatives, offering advantages such as reduced size and enhanced reproducibility.
Despite these advantages, the fabrication of graphene resistors is challenging due to their small size and current-handling limitations. Testing these devices often requires extremely low currents, presenting significant challenges for measurement accuracy. Additionally, DCC bridges, while highly accurate, are unsuitable for low-current applications as they generate significant current surges during pre-balancing and polarity switching [14,15,16].
The resistance ratio measurement method based on this synchronous sampling technique is designed for a testing system composed of conventional measurement instruments, aiming to achieve high-precision resistance ratio measurements under weak small-signal (1 μA) current conditions. This means that some standard commercial equipment can be used to perform ratio measurements of quantized Hall resistance (at the 10−6 level). The design is simple yet capable of high-precision resistance measurements at currents below 1 μA, which is currently unattainable with the highest-precision direct current comparator (DCC) resistance ratio testing equipment under room-temperature DC conditions, particularly in small-signal measurement scenarios.
DC current comparators based on magnetic modulation principles, such as the MI 6010 series (MI, Prescott, ON, Canada) and Guildline’s 6622 series (Guildline, Smiths Falls, ON, Canada), are highly accurate resistance ratio devices. Under optimal signal-to-noise ratio conditions (test currents of 0.3 mA to 3 mA), their resistance ratio measurement accuracy can reach 2 × 10⁻⁸. However, under weak signal conditions—such as a measurement current of 1 μA—their resistance ratio accuracy deteriorates rapidly, failing to meet the requirements for high-precision small-signal measurements.
Currently, the primary materials used for quantized Hall resistance (QHR) devices internationally are gallium arsenide (GaAs) and graphene. Among these, graphene has gained particular favor among scientists due to its reduced requirements for magnetic field strength and temperature.
As a new type of Hall chip material, graphene is now widely used in quantized Hall resistance benchmark research based on liquid helium (4.2 K) and cryocoolers (3 K). However, the minimum input current for typical graphene samples is currently around 38 μA, meaning there has been no urgent need for testing equipment capable of handling much weaker currents (e.g., at the 1 μA level). Yet, with advancements in graphene materials—especially for quantized Hall resistance chips operating at liquid nitrogen temperatures (77 K) or under high-temperature superconductivity conditions—their size has been shrinking. In ref. [17], smaller dimensions mean they can no longer sustain large currents and must instead operate at very low currents, around 1 μA. This creates a demand for high-precision resistance measurement methods that can function effectively under such ultra-low current conditions.
This paper proposes a high-precision resistance ratio measurement method capable of operating at ultra-low currents (on the order of 1 μA). Its key innovation lies in its implementation using standard commercial test instruments, enabling highly accurate resistance ratio measurements under weak current conditions. This approach meets the demand for high-precision resistance ratio testing in low-signal environments, where conventional methods fall short. This study presents a novel resistance ratio measurement technique that achieves high accuracy at ultra-low currents (~1 μA) using off-the-shelf test equipment, addressing the need for precise measurements in weak-signal applications.
To address these challenges, this paper proposes a precision resistance measurement system based on synchronous sampling, designed specifically for low-current conditions. This method ensures accurate measurements at currents as low as 1 μA, making it particularly suited for graphene quantum Hall resistors. The system achieves measurement accuracy within the 10−6 level and features a simple, efficient design that facilitates high-speed testing. In current metrological practice, precision bridges commonly used for weak-current measurements are fundamentally limited by their inherent signal-to-noise ratios, making them unsuitable for resistance ratio measurements at 1 μA or lower currents. Our synchronous sampling method demonstrates markedly superior performance compared to these conventional bridge techniques. As detailed in the concluding section, we propose specific improvement strategies to further enhance the measurement accuracy.
2. Basic Principle
Resistance ratio measurement is a technique that achieves high-precision measurement by accurately determining the resistance ratio between two or more resistors. This measurement does not rely on the absolute value of resistance, but focuses on the relative ratio, thus avoiding systematic errors inherent in absolute measurements. By utilizing the characteristic that when the same current flows through series-connected resistors, the voltage drop is proportional to the resistance value (V = IR), the resistance ratio can be obtained directly by measuring the voltage ratio. This approach enables the elimination of power supply fluctuations through common-mode rejection, cancels thermoelectric errors via symmetrical design, and employs the four-wire measurement method with independent current excitation and voltage detection circuits to remove lead resistance effects. This paper designs a synchronous sampling-based precision resistance measurement system based on this resistance measurement method. The system is easy to set up and operate, adopts a single adjustable current source input, and achieves high measurement accuracy. The system uses two high-resolution 8508A digital multimeters (Fluke, Everett, WA, USA) from Fluke for voltage measurement and a Keithley 6221 (Keithley, Cleveland, OH, USA) current source as the synchronous current output. Additionally, a LabVIEW-based host computer was designed for system control. Experimental testing has verified that the measurement system designed in this paper achieves a measurement error on the order of 10−6 under a 1 μA current condition, with a standard uncertainty of the test results also reaching the 10−6 level. Under the same conditions with a 10 μA current, the standard uncertainty can reach the 10−7 level. Moreover, the system offers fast measurement speed, meeting the requirements for precision resistance measurement under low-current conditions.
The proposed precision resistance measurement system is based on the principle of synchronous sampling to achieve accurate resistance measurement under low-current conditions. The system operates by applying a stable current source and measuring the voltage across the resistor under test. The resistance value is then determined using Ohm’s law:
where R is the resistance of the test sample, U is the measured voltage across the resistor, I is the applied current.
Synchronous sampling ensures that voltage measurements are taken simultaneously across both the standard resistor and the test resistor. This technique minimizes errors caused by noise, drift, or instability in the current source, which are critical factors under low-current conditions. By comparing the voltage drops across the standard resistor (Ustd) and the test resistor (Utest), the system can calculate the resistance ratio:
Rearranging this equation gives the resistance of the test resistor as:
Figure 1 shows the system block diagram of the synchronous sampling method for measuring the resistance ratio. When a synchronous trigger signal is applied to the system, currents in forward and reverse directions are passed through the two resistors, respectively. The potential difference across the sampling resistors is then calculated based on the electric potentials at both ends. Subsequently, long-term sampling is performed via the host computer program to ultimately obtain the ratio value of the two resistors. Through multiple averaging over an extended period, the average value and dispersion of the measured resistance ratio are determined.
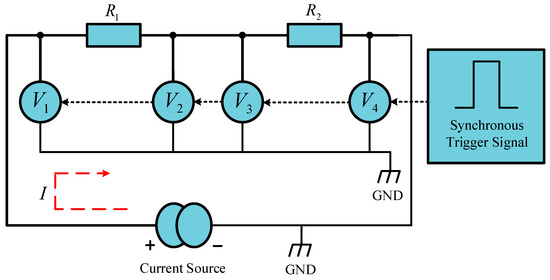
Figure 1.
Principle diagram of synchronous sampling resistance precision measurement method.
The basic principle of the precision resistance measurement method based on synchronous sampling is shown in Figure 1. With a single current source input, the voltage across both the test resistor and the standard resistor is measured simultaneously. This synchronous sampling eliminates the impact of timing issues on the measurement results and subsequent calculations, ensuring high accuracy and reliability.
In Figure 1, V1, V2, V3, and V4 represent the voltage values measured by four voltmeters, respectively. After connecting the circuit according to the schematic diagram, the voltage values of the four voltmeters are synchronously recorded. Using the measured voltage data, the voltage drop across the two resistors R1 and R2 can be calculated by finding the voltage differences as follows:
where UR1 is the voltage drop across the standard resistor R1, and UR2 is the voltage drop across the test resistor R2. These calculated voltage differences are then used to determine the resistance values accurately.
In the measurement circuit, considering the presence of DC offset and thermoelectric potential effects, a single-direction DC current for measurement can introduce bias, resulting in inaccurate voltage values across the test resistor (R2) and the standard resistor (R1). This bias can be mathematically expressed as:
where:
UR1 and UR2 are the voltage drops across R1 and R2, respectively.
Δ1 and Δ2 represent the bias caused by DC offset and thermoelectric effects under forward current conditions.
These biases prevent accurate determination of the resistance values, necessitating corrective measures to eliminate their influence.
To eliminate these biases and ensure accurate measurement results, a current-reversal technique is employed. By applying current in both the forward and reverse directions, two sets of voltage measurements are obtained. Using the proportional relationship between voltage and resistance, the voltage ratios for the forward and reverse currents are calculated as follows:
where p is the voltage ratio under forward current, and p′ is the voltage ratio under reverse current. By averaging the ratios from the forward and reverse directions, the resistance value of the test resistor (R2) can be calculated as:
Simplifying the expression yields:
Here, and represent the total voltage drops across R1 and R2, respectively, after accounting for both forward and reverse current directions.
In the system designed in this article, two Fluke 8508A digital multimeters are used for voltage measurement. Each multimeter’s front and rear terminals act as separate voltmeters. The “F-R” mode of the 8508A multimeter enables measurements according to the principles outlined above, allowing for accurate resistance determination by mitigating offset and bias effects.
3. Experimental Device and Results
The measurement system designed in this article consists of two main functional modules: the external hardware measurement system and the upper computer control system developed using LabVIEW. As illustrated in Figure 2, the external measurement system integrates high-precision instruments and custom components to ensure accurate and synchronized resistance measurements. The key components include:
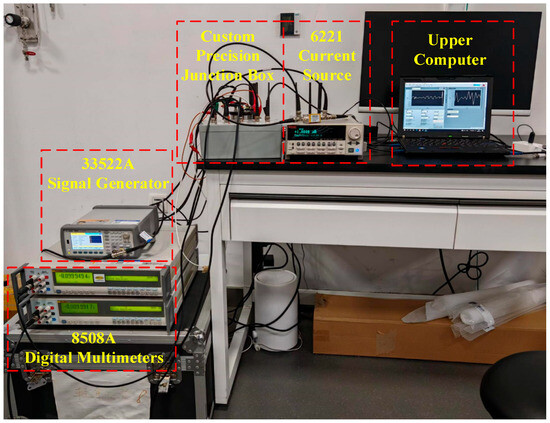
Figure 2.
Resistance precision measurement system.
8508A Digital Multimeters (Fluke, WA, USA): Two Fluke 8508A multimeters are used to measure the voltages across the test resistor and the standard resistor. Two high-accuracy Fluke 8508A multimeters are employed to measure the voltage drops across both the test resistor (R2) and the standard reference resistor (R1). These multimeters offer exceptional resolution and stability, ensuring reliable voltage readings at microvolt-level precision.
33522A Signal Generator (Keysight Technologies, Santa Rosa, CA, USA): Provides identical external trigger signals to the two multimeters, ensuring synchronized measurements. A Keysight 33522A waveform generator supplies synchronized external trigger signals to both multimeters, enabling simultaneous sampling and eliminating timing errors in voltage measurements. This synchronization is critical for reducing noise and drift effects in low-current measurements.
6221 Current Source (Keithley, OH, USA): A Keithley 6221 programmable current source provides high-stability bidirectional current excitation, delivering precise forward and reverse currents to the resistor network. Its ultra-low noise and adjustable output (from nanoamps to milliamps) allow flexible testing under different current conditions.
Custom Precision Junction Box: Facilitates accurate and reliable connections within the measurement loop. A specially designed junction box ensures low-thermal EMF and high-contact reliability in the measurement loop. Gold-plated terminals and shielded cabling minimize parasitic resistance and electromagnetic interference, enhancing measurement repeatability.
This integrated setup enables high-resolution, low-drift resistance measurements with automated control via the LabVIEW interface, significantly improving testing efficiency and accuracy compared to manual methods. The control system, programmed using NI LabVIEW 2022 (National Instruments, Austin, TX, USA), handles the upper computer’s functions, including synchronizing sampling, recording measurement data, and executing automated measurement sequences.
In this article, the test system employs two Fluke 8508A digital multimeters to measure the voltages across the test resistor and the standard resistor. The input terminals on the front and rear panels of each multimeter are connected to the respective ends of the resistors. By selecting the “F-R” mode on the 8508A’s control panel, the voltage difference between the front and rear panel inputs is calculated, providing the voltage data for the resistors. To ensure measurement accuracy and methodological rigor, each resistor in the system features single-point grounding at its low-potential terminal. This grounding scheme effectively eliminates potential measurement errors that could arise from ground loops or stray potentials when determining voltage differences between resistors. By maintaining strict electrical isolation at the measurement nodes, this design preserves the integrity of the synchronous sampling method and guarantees the reliability of acquired data. The implemented grounding strategy represents a critical component of our precision measurement architecture, as it prevents the introduction of systematic errors during high-impedance current measurements.
To ensure high precision in voltage measurement, the multimeters are set to the DC mode with an 8.5-digit resolution. The external trigger mode of the 8508A is used, with a 33522A signal generator providing simultaneous trigger signals to both devices. The signal generator outputs a 1 kHz step signal with a 10 V amplitude, ensuring synchronized triggering and enabling the two multimeters to perform synchronous sampling. This setup guarantees precise and consistent voltage measurements across the resistors.
The measurement system is governed by a custom-developed LabVIEW virtual instrument (VI), which provides an intuitive graphical user interface (GUI) for complete automation of the measurement process. The software architecture consists of multiple functional modules that handle instrument control, data acquisition, signal processing, and real-time analysis, ensuring high-precision resistance measurements with minimal manual intervention. The software automatically configures the Keithley 6221 current source to alternate between forward (+I) and reverse (−I) polarities at user-defined intervals. This current-switching technique cancels out thermoelectric voltages (Seebeck effect) and contact potential drifts, significantly improving measurement accuracy. Each polarity cycle includes a settling delay (adjustable from 10 ms to 10 s) to allow the circuit to stabilize before sampling.
The device was tested using two standard resistors with known values. Results under a 1 μA current showed a measurement dispersion of 10−6, and the measurement error was within the same order of magnitude. At a 10 μA current, the uncertainty improved to 10−7, demonstrating the system’s capability to perform high-precision resistance measurements under varying low-current conditions, presented in Table 1 and Table 2, respectively. Meanwhile, to validate the practical testing performance of this synchronous sampling method, we conducted comparative measurements on the same set of resistance ratios under identical weak current conditions using a Direct Current Comparator (DCC)—a standard instrument in metrology laboratories. Multiple datasets were systematically collected under both 1 μA and 10 μA test conditions, with the comprehensive results meticulously presented in Table 3 and Table 4, respectively, to facilitate thorough analysis and comparison.

Table 1.
1 μA current measurement experimental results.
Table 2.
10 μA current measurement experimental results.
Table 3.
1 μA current measurement experimental results (DCC 6010D).
Table 4.
10 μA current measurement experimental results (DCC 6010D).
The measurement system is designed to accurately determine the resistance of the test resistor. By measuring the voltages across a standard 10 kΩ resistor and the test resistor, along with the input current, the resistance of the test resistor can be calculated using Ohm’s law.
To eliminate system offsets, both forward and reverse current directions are used during measurements. The voltage ratios calculated from these measurements are averaged to obtain the final resistance value.
A sample of the measurement data is shown in Table 1, illustrating the voltage readings, current input, and calculated resistance values. This approach ensures high precision and reliability in the measurement results.
As seen in Table 1, when using an input current of 1 μA, the standard uncertainty reaches the level of 10−6. The test resistor used in this article has been calibrated using a precision bridge, ensuring an accurate calibrated value. From the data in the table, it can be observed that the measurement error compared to the true value is 6.1 × 10⁻⁶, indicating that the measured resistance value of the test resistor has high accuracy.
Using the same measurement method, the test resistor is measured with a 10 μA forward and reverse current. A portion of the measurement data is shown in Table 2.
Based on the data in Table 2, it can be seen that under the 10 μA condition, the standard uncertainty of the measurement data reaches the 10−7 level, and the measurement error of the test resistor is 5.7 × 10⁻⁶. This demonstrates that the measurement system maintains a high level of accuracy even with increased input current, achieving precise resistance measurements within a low margin of error. For comparative testing under 1 μA and 10 μA conditions, we conducted benchmark experiments using the DC Current Comparator (DCC) 6010D under identical measurement parameters. Specifically, Table 3 presents the DCC measurement data obtained at 1 μA test current, while Table 4 correspondingly documents the DCC performance metrics at 10 μA conditions.
From the above data, it can be observed that the synchronous measurement system achieves a measurement error within the 10−6 level and standard uncertainty within the 10−6 level under both 1 μA and 10 μA input current conditions. As the current increases, the standard uncertainty of the measurement data can be further reduced, meeting the requirements for precise resistance measurements under low current conditions. Under the test condition of weak current around 1 μA, the DC current comparator (DCC) exhibits excessive measurement noise (as its current range is essentially limited to 0.3 mA–3 mA), consequently failing to achieve satisfactory ratio accuracy and measurement uncertainty. In contrast, the synchronous sampling method demonstrates superior signal-to-noise ratio performance compared to current comparators, which explains why this approach can obtain better measurement uncertainty in weak current testing scenarios.
The Allan variance analysis curve of this resistance measurement system is shown in Figure 3, illustrating the variation trend of the voltage ratio data. In this measurement system, when the sampling time is 1000 s, the Allan standard deviation reaches its minimum of 10−6, indicating that the system has reached its measurement limit.
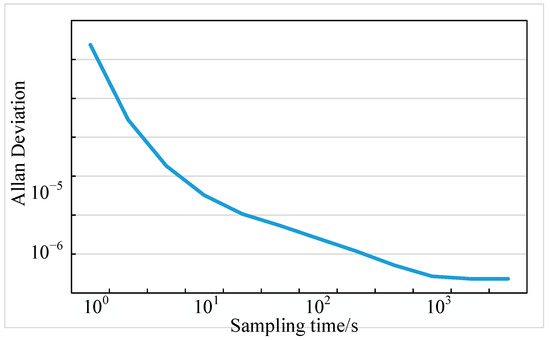
Figure 3.
Allan variance plot.
4. Conclusions and Future Work
This paper proposes a synchronous sampling resistance measurement method and designs a precision measurement system based on synchronous sampling, which can perform precise resistance measurements under low current conditions in the microampere (μA) range. Compared to traditional DC bridges, the detection accuracy and dispersion of the system are improved by several orders of magnitude. The resistance precision measurement system designed in this paper, under low current conditions, achieves a standard uncertainty of the measurement data within the 10−6 level and a measurement error also within the 10−6 level, meeting the requirements for precise resistance measurements under small current conditions.
The primary limiting factors for the system’s measurement accuracy are the errors introduced by the voltmeters and the inability to achieve perfect synchronization when sampling data. The errors caused by the voltmeters can be further reduced by improving the circuit structure. As for the synchronization of the sampling data, it will be optimized through improvements in the control program, thereby achieving higher measurement accuracy.
This study outlines a three-pronged roadmap for future advancements: (1) Hardware system optimization will focus on developing ultra-low-noise preamplifier circuits targeting noise figures below 3 dB, implementing 24-bit high-precision Σ-Δ analog-to-digital converters to replace existing voltage measurement modules, and designing adaptive electromagnetic shielding structures with active compensation capabilities. These hardware improvements aim to reduce systematic voltage measurement errors to the 0.1 ppm level while enhancing immunity to environmental interference. The optimized front-end electronics will be specifically designed to maintain stability across wide temperature ranges from cryogenic to room temperature conditions. (2) Synchronization control enhancement represents a critical innovation area, where we will develop FPGA-based hardware triggering systems achieving sub-nanosecond timing precision (<1 ns), implement real-time dynamic delay compensation algorithms, and establish rigorous mathematical models of sampling clock jitter mechanisms. By combining these approaches, we target synchronization errors below 10 ps—a key requirement for achieving the ultimate measurement accuracy. This work will include a detailed characterization of timing uncertainties and their propagation through the measurement chain. (3) Measurement methodology expansion will explore several groundbreaking directions: multi-frequency synchronous sampling techniques covering 1 Hz to 10 kHz for comprehensive impedance characterization; specialized measurement protocols for graphene quantum Hall devices operating at liquid nitrogen temperatures (77 K); and machine learning-based uncertainty evaluation systems capable of real-time error analysis. These methodological innovations aim to extend the system’s operational current range from 0.1 μA to 100 μA while maintaining 10−6 level accuracy.
Author Contributions
The study presented here was conducted in collaboration between all authors. C.Z., Y.L. and P.H. wrote the paper and designed the idea; Y.L. and P.H. improved the idea and experiment; J.Z. drew the main conclusions and critically reviewed the paper. All authors have read and agreed to the published version of the manuscript.
Funding
This work was supported in part by the National Key R&D Program of China (2023YFF0612502) and in part by the Basic Science Research Funding in the National Institute of Metrology (AKYZD2106).
Data Availability Statement
The original contributions presented in this study are included in the article. Further inquiries can be directed to the corresponding author.
Conflicts of Interest
The authors declare no conflicts of interest.
References
- Schurr, J.; Ahlers, F.; Kibble, B.P. The ac quantum Hall resistance as an electrical impedance standard and its role in the SI. Meas. Sci. Technol. 2012, 23, 124009. [Google Scholar] [CrossRef]
- Taylor, B.N. Molar mass and related quantities in the New SI. Metrologia 2009, 46, 16–19. [Google Scholar] [CrossRef]
- Haddad, D.; Abbott, P.; Chao, L.S.; Mulhern, E.; Seifertt, F.; Schlamminger, S.; Kubarych, Z.; Newell, D.B. Small Mass Realization in the New SI. In Proceedings of the 2020 Conference Precision Electromagnetic Measurements (CPEM), Denver, CO, USA, 24–28 August 2020. [Google Scholar]
- Kruskopf, M.; Patel, D.K.; Liu, C.-I.; Rigosi, A.F.; Elmquist, R.E.; Wang, Y.; Bauer, S.; Yin, Y.; Pierz, K.; Pesel, E.; et al. Graphene quantum Hall effect devices for AC and DC resistance metrology. IEEE Trans. Electron Devices 2021, 68, 3672–3677. [Google Scholar] [CrossRef]
- Cage, M.E.; Jeffery, A. A Problem in AC Quantized Hall Resistance Measurements and a Proposed Solution. J. Res. Natl. Inst. Stand. Technol. 1998, 103, 593–604. [Google Scholar] [CrossRef] [PubMed]
- Giesbers, A.J.M.; Rietveld, G.; Houtzager, E.; Zeitler, U.; Yang, R.; Novoselov, K.S.; Geim, A.K.; Maan, J.C. Quantum resistance metrology in graphene. Appl. Phys. Lett. 2008, 93, 222109. [Google Scholar] [CrossRef]
- Panna, A.R.; Kruskopf, M.; Rigosi, A.F.; Marzano, M.; Patel, D.K.; Payagala, S.U.; Jarrett, D.G.; Newell, D.B.; Elmquist, R.E. Superconducting Contact Geometries for Next-Generation Quantized Hall Resistance Standards. In Proceedings of the 2020 Conference Precision Electromagnetic Measurements (CPEM 2020), Denver, CO, USA, 24–28 August 2020. [Google Scholar]
- Oe, T.; Matsuhiro, K.; Itatani, T.; Gorwadkar, S.; Kiryu, S.; Kaneko, N.-H. Development of Quantum Hall Array Resistance Standards at NMIJ. IEEE Trans. Instrum. Meas. 2011, 60, 2590–2595. [Google Scholar] [CrossRef]
- Poirier, W.; Schopfer, F. Quantum Hall effect and OHM Metrology. Int. J. Mod. Phys. B 2009, 23, 2779–2789. [Google Scholar] [CrossRef]
- Elmquist, R.E.; Kruskopf, M.; Patel, D.K.; Hu, I.F.; Liu, C.I.; Rigosi, A.F.; Panna, A.R.; Payagala, S.U.; Jarrett, D.G. AC and DC Quantized Hall Array Resistance Standards. In Proceedings of the 2020 Conference on Precision Electromagnetic Measurements (CPEM 2020), Denver, CO, USA, 24–28 August 2020. [Google Scholar]
- Janssen, T.J.B.M.; Williams, J.M.; Fletcher, N.E.; Goebel, R.; Tzalenchuk, A.; Yakimova, R.; Lara-Avila, S.; Kubatkin, S.; Fal’ko, V.I. Precision comparison of the quantum Hall effect in graphene and gallium arsenide. Metrologia 2012, 49, 294–306. [Google Scholar] [CrossRef]
- Lartsev, A.; Lara-Avila, S.; Danilov, A.; Kubatkin, S.; Tzalenchuk, A.; Yakimova, R. A prototype of RK/200 quantum Hall array resistance standard on epitaxial graphene. J. Appl. Phys. 2015, 118, 044506. [Google Scholar] [CrossRef]
- Lin, F.; Liang, B.; Shao, H.; Wang, H. A Novel Method for Calibrating Automatic Direct Current Comparator Resistance Bridges. In Proceedings of the 2018 Conference on Precision Electromagnetic Measurements (CPEM 2018), Paris, France, 8–13 July 2018. [Google Scholar]
- Kusters, N.L.; MacMartin, M.P. A Direct Current Comparator Bridge for High Resistance Measurements. IEEE Trans. Instrum. Meas. 1973, 22, 382–386. [Google Scholar] [CrossRef]
- Brown, D.; Wachowicz, A.; Huang, S. The Enhanced Performance of the DCC Current Comparator Using AccuBridge® Technology. In Proceedings of the 2016 Conference on Precision Electromagnetic Measurements (CPEM 2016), Ottawa, ON, Canada, 10–15 July 2016. [Google Scholar]
- Zhou, L.; Zhu, L.; Geng, J. Investigation on the Direct Current Coefficient of I/V Transducer. In Proceedings of the 2023 IEEE 16th International Conference on Electronic Measurement & Instruments (ICEMI), Harbin, China, 9–11 August 2023. [Google Scholar]
- Wang, Y.; Gao, X.; Yang, K. Quantum Hall phase in graphene engineered by interfacial charge coupling. Nat. Nanotechnol. 2022, 17, 1272–1279. [Google Scholar] [CrossRef] [PubMed]
Disclaimer/Publisher’s Note: The statements, opinions and data contained in all publications are solely those of the individual author(s) and contributor(s) and not of MDPI and/or the editor(s). MDPI and/or the editor(s) disclaim responsibility for any injury to people or property resulting from any ideas, methods, instructions or products referred to in the content. |
© 2025 by the authors. Licensee MDPI, Basel, Switzerland. This article is an open access article distributed under the terms and conditions of the Creative Commons Attribution (CC BY) license (https://creativecommons.org/licenses/by/4.0/).