Abstract
Selecting appropriate locations of emergency centers is an important issue in avoiding probable damages by natural disasters. Emergency rescue sites are constructed to provide emergency supplies swiftly for people in affected areas. Factors of transportation fluency and road damage degrees should be considered, which largely affect rescue efficiency. In order to find appropriate sites accurately, we proposed a redesigned method Variable Butterfly Optimization Algorithm (VBOA), based on the Butterfly Optimization Algorithm, by adding the Variation Operator mechanism to avoid the limitations of local optimum problems present in other optimization algorithms. The Variation Operator effectively combines both global and local search strategies to improve the performance of global searching, and it accelerates the convergence speed of the algorithm. We conducted our experiment on selected candidate sites with multiple optimization methods; the experiment results demonstrate that our proposed method maintains the balance between conditions of coverage area and expenditure. Our proposed method relieved the reliance of local optimum results and achieved better convergence accuracy in our selected samples in comparison with other methods both in initial and later siting phases.
1. Introduction
In recent years, global environmental changes have occurred rapidly, posing certain threats to societal security and stability through a series of unexpected events. In practical rescue operations involving large-scale and multi-site emergency rescue tasks that occur randomly, the ability of emergency logistics to swiftly identify optimal sites for emergency supplies centers is a critically important research topic.
Scholars investigate through two dimensions: time and space, specifically determining the timing and the regional planning of emergency facilities. Following the occurrence of emergency events, emergency facility siting includes the selection of mass shelters, material storage center locations, and medical and rescue personnel centers, among others. In emergency rescue operations, emergency facility siting becomes a dynamic issue, where factors such as rescue time, material distribution, operations, material storage costs, etc., constantly change over time and are subject to sudden influences.
Numerous scholars have researched emergency siting. X. Y. Jiang et al. [1] considered the transportation cost from the rescue center to the disaster site, the cost of establishing the rescue center, and the golden rescue time, and selected a suitable location to establish an emergency rescue center. X. Yan et al. [2] develops a bi-objective optimization model in considering the utility of values and warehouses, emergency materials to make optimum decisions in building rescue centers. Clustering multi-center locations is helpful to find the optimum solution and reduce the site selection costs. J. Jiang et al. [3] used the fuzzy analytic hierarchy process to establish a hierarchical model for each factor, calculated the weight values of each factor in the indicators, and finally obtained a comprehensive evaluation table for each candidate benchmark. Yuanqiao Wen et al. [4] constructed a dual-objective location optimization model with the shortest emergency response time and the lowest construction cost, using LINGO to solve the model and obtain the optimal solution. Dejun Cheng et al. [5] established a multi-objective emergency rescue site selection optimization model with timeliness and economy as the core rescue site selection objectives, using the improved NSGA-II algorithm to screen out satisfactory site selection schemes.
The emergency location is usually decided by the categories of disasters; for rescue operations at earthquake emergency sites [1,2], golden rescue time is the key issue for consideration. Transportation costs and penalty costs are the core points to consider when taking emergency rescues, with the search for optimum solutions typically based on the nearest places within disaster points. For flooding disaster cases, the issue of accident rates among different river sections should be fully considered [3], and the natural environment is more vital to river transportation. Selecting emergency sites should be carried out before the disaster happens. Hierarchy analysis is the key issue to finding the probable happened locations. Flooding speed is an important issue when considering oil spill pollution, which has a large effect on carrying out urgent actions [4,6]. Yang Liu et al. [7] constructed a model that considered many kinds of social issues relating to security, accessibility, and reliability to make optimal solutions to avoiding disasters.
However, these methods fail to address the efficiency problem caused by differences in emergency material demand between the early and late stages.
The Butterfly Optimization Algorithm (BOA) draws inspiration from butterfly foraging and mating behaviors. BOA’s advantages lie in its few parameters, fast convergence speed, and high optimization accuracy, making it widely applicable in practical problems. Yuxin Ma et al. [8] improved the algorithm by introducing four optimization strategies, including Bernoulli chaotic mapping, dynamic switching probability, adaptive inertia weight, and reverse learning. Amirmohammad Shahbandegan et al. [9] proposed a binary version of BOA (BBOA) to solve the 0 to 1 MKP problem. Abhishek Singh Verma et al. [10] proposed an efficient adaptive butterfly optimization technique to reduce the size of regression testing suites. Haichuan Ma et al. [11] proposed the t-distribution butterfly optimization algorithm (TBOA) to solve the problem of finding optimal parameters in the logistic regression loss function. Yuqi Fan et al. [12] added a new aromaticity coefficient to the basic butterfly optimization algorithm and introduced a new iteration and update strategy. Wangshuo Tang et al. [13] proposed an ISAR translation compensation method based on the global butterfly optimization algorithm. Zan Yang et al. [14] combined the Halton sequence initialization butterfly optimization algorithm (HSBOA) with the traditional t-SNE algorithm to improve optimization accuracy and convergence speed. Yao Jishuai et al. [15] introduced an improved Emperor Butterfly Optimization (IMBO) algorithm to solve the Multi-to-Multi Weapon Target Allocation (WTA) problem. Nevertheless, the aforementioned improvements still face challenges such as poor global search performance.
In summary, this paper’s contributions can be summarized as follows:
Firstly, this paper outlined the emergency logistics facility siting problem, considering the different material demands before and after events, and constructs a novel evaluation index for emergency logistics facility siting.
Secondly, this paper introduced variable operations to improve the Butterfly Optimization Algorithm and verified its effectiveness across multiple test functions.
Lastly, this paper incorporated the Variable Butterfly Optimization Algorithm into the optimization of emergency material center siting, thereby achieving efficient, cost-effective, and equitable siting solutions.
The structure of this paper is outlined as follows: Chapter One serves as the introduction to the entire document. Chapter Two presents the modeling approach for the siting of emergency material centers. Chapter Three provides an introduction to the Butterfly Optimization Algorithm along with our proposed enhancements and validates the performance of the Variable Butterfly Optimization Algorithm. Chapter Four presents the results and comparative experiments of applying the Variable Butterfly Optimization Algorithm to the problem of comprehensive emergency material center group placement throughout all periods. Finally, Chapter Five concludes the entire manuscript.
2. The Modeling Method for the Siting of Comprehensive Emergency Material Centers Throughout All Periods
According to the urgency of each demand point, infrastructure conditions (major factories, road density, etc.), and material demand criteria, we constructed an evaluation system for prioritizing rescue at demand points. Due to the suddenness and uncertainty of emergencies, as well as variations in population and infrastructure across demand points, the order of rescue for each demand point differs. Combining factors such as material demand, population coverage, and infrastructure, we established evaluation criteria for the rescue priority of demand points. Commonly, constructing emergency centers to defend unpredicted disasters is a puzzling issue; in cases of floods, the emergency center should be located at higher ground far from lower plains; for the issue of earthquakes, the emergency sites are usually man-made swiftly, as the frequency is not too often and results in short rescue time. We utilized the Analytic Network Process to determine the weights of the evaluation criteria for rescue priority before employing the Technique for Order Preference by Similarity to Ideal Solution to establish rescue priorities. This approach allows for a more comprehensive and accurate determination of the importance of rescue for each demand point. The Table 1 below shows the evaluation indexes of our paper, which demonstrates the rescue priority when considering complex issues.

Table 1.
Evaluation criteria for demand point rescue priority.
Considering the variations in rescue tasks and operations during different stages of emergency events, a multi-objective emergency material center siting model under dynamic environments was designed. During the initial phase of emergency events, a mathematical model is constructed to minimize rescue response time and maximize coverage area by integrating the rescue priority of demand points, material demand quantity, and the increase in transportation distance due to road damage. During the later stages of emergency events, factors such as transportation costs, center construction and storage costs, costs incurred by early and late arrivals at demand points, and the variance in the allocation ratio of materials at various demand points are considered when constructing a mathematical model that minimizes rescue costs and maximizes fairness.
The model for the initial stage of rescue aimed to minimize response time and maximize coverage area for emergency centers, considering the characteristics of emergency logistics. During this stage, to ensure the shortest total response time for distribution, the model considers minimizing the travel time for vehicles to reach each demand point and the time spent loading and unloading materials at each demand point, especially in scenarios involving road damage. The rescue coverage area is determined based on rescue priority and the required quantity of materials. The objective function is formulated as follows:
Here, represents demand points, represents candidate emergency material centers, represents the distance between demand point and candidate emergency material center , represents the coefficient indicating the increase in transportation distance due to road damage, represents the speed of vehicle travel, and represents the quantity of materials transported from candidate emergency material center to demand point . represents the emergency material demand at demand point , represents the inventory level of materials at candidate emergency material center , represents the time required for loading and unloading economic materials per unit at the vehicle, and represents the departure time of the vehicle. Within the constraints of , which demonstrates the search for alternative emergency material storage point in the value of 0 or 1, if , the storage point j is the optimum alternative material storage point as the emergency distribution center location, represents the constraints of whether the supplies of demand point should be served by emergency distribution center ; if , the matching is optimum selection, otherwise, the matching is not correct. The constraints inside our initial stage are listed below:
In the later stages of the rescue phase, a multi-objective emergency center siting model is designed to minimize rescue costs and maximize fairness. During this period, to minimize rescue costs, factors such as transportation costs, fixed site selection costs, material storage costs, and penalties incurred when vehicles arrive at demand points earlier or later than the required time window are considered. To ensure fairness in resource allocation, the variance in the allocation ratio of materials at various demand points is utilized, while still considering the rescue priority of demand points, material demands, and the actual dispatched quantity of materials. A smaller variance indicates less disparity in emergency material distribution among different demand points, thus promoting fairness. Based on these considerations, the following objective function is constructed:
Here, represents the quantity of materials transported from candidate emergency material center to demand point , represents the new emergency material demand quantity at demand point during the later stages of the rescue phase, represents the inventory level of materials at candidate emergency material center , represents the new rescue priority of demand point i during the later stages of the rescue phase, represents the unit transportation cost from demand point i to candidate emergency material center , and represents the construction cost of candidate emergency material center . represents the unit material storage cost at candidate emergency material center , represents the penalty cost coefficient for vehicles arriving late at demand points, represents the penalty cost coefficient for vehicles arriving early at demand points, represents the arrival time of the vehicle at demand point , represents the latest time point by which materials need to arrive at demand point , and represents the earliest time point by which materials need to arrive at demand point . Similarly, is the variable for matching, with the value equals to 0 or 1. If , the supplies of demand point i are correctly matched by the emergency distribution center j for service; otherwise, the matching result is false. The constraints inside our last stage are listed below:
3. Description and Experiment of the Algorithm
3.1. Butterfly Optimization Algorithm
In nature, butterflies can produce a scent, and the intensity of this scent can be controlled by the butterflies themselves. The intensity of the scent produced varies at different times. During mating periods or when discovering high-quality nectar, butterflies emit a strong odor to attract other butterflies. If a butterfly fails to find high-quality nectar, it will move towards areas with a high concentration of scent. This scent is unique to butterflies, and the intensity of scent production by butterflies is represented as follows:
In Equation (5), represents the concentration of scent produced by butterflies; represents the perceptual form; and represent the stimulus intensity (related to the fitness of butterflies) and power index, respectively. Where a and c generally range within [0, 1], and the formula for calculation is as follows:
In Formula (6), N represents the maximum number of iterations. Given the known objective function, the standard Butterfly Optimization Algorithm (BOA) proceeds as follows:
- Initialize the population and calculate the stimulus intensity for each butterfly.
- Calculate the fitness of each butterfly and record the position of the best solution .
- Perform random global or local searches, where the update formula for global search is given by (7); for local search by (8), within each iteration step, the parameter of switch probability is utilized to select whether global or local search is carried on, where the value is typically set as 0.8. If the random number , the global search occurred and carried on Formula (7); otherwise, if , local search is conducted and carried on Formula (8).
- Repeat the process until the iterations are completed.
Here, represents the concentration of scent of the i-th butterfly, is the position vector of the i-th butterfly at the t-th iteration, and is a random number between 0 and 1. and are both individuals randomly selected from the population at the t-th iteration on the -th and -th butterfly samples separately.
3.2. Variable Butterfly Optimization Algorithm
Due to the high interdependence among individuals in the standard algorithm, it is difficult to escape from local optima once trapped. To address the issues of poor global search performance and susceptibility to local optima in the Butterfly Optimization Algorithm, this paper introduces variation operators, including initialization variation operators and search variation operators. By assuming that real world conditions like vehicle capacity are unchanged in our methods, our model is constructed based on changes of natural general conditions. Specifically, the initialization variation operators enhance population diversity from the outset, reducing premature convergence risks. Search variation operators, meanwhile, systematically expand exploration capabilities, enabling individuals to efficiently escape local optima and improve global search coverage.
- (1)
- Initialization Variation Operator
The standard algorithm initializes by randomly distributing individuals in the global space, which does not align with the collective behavior characteristics of butterflies. Therefore, this paper introduces variation operators to arrange the population into a multi-ring concentric structure within the space during initialization. Low variance defines the generated values within the top 10% of the available range, medium variance represents values within the range of 10% to 50%, and high variance means the generated values cover 80% of the range. The initialization formula, which is typically based on levels of variance, is as follows:
- (2)
- Search Variation Operator
The search variation operator comprises global search variation and local search variation. During global search, a random number between 0 and 1 is generated, and if it is less than 0.7, a variation search is conducted according to Formula (10), where is the -th butterfly sample among selected population in -th iteration, with being the number of selected sample; otherwise, the original iterative method is employed. During local search, another random number between 0 and 1 is generated, and if it is less than 0.5, a variation search is conducted according to Formula (13), which added the result of previous iteration sample , the global optimum result , and the result of variation search on randomly matched sample , where shows the index of randomly matched sample, and is the iteration round; otherwise, the original iterative method is used.
3.3. Experiments of Variable Butterfly Optimization Algorithm
The experimental data are generated by our developed system, with 10 demanding points and 4 emergency material center alternative sites. We compared our proposed Variable Butterfly Optimization Algorithm (VBOA) method with 7 mainstream optimization algorithms on the performance of these selected data. Comparing models mainly contain Butterfly Optimization Algorithm (BOA), Gray Wolf Optimization (GWO), Multi-Verse Optimization (MVO), Ant Lion Optimization (ALO), Moth-Flame Optimization (MFO), Sine Cosine Algorithm (SCA), Simulated Annealing (SA). These methods simulate natural behaviors of species or meta inspection; it is easy to explore optimum results by imitating these behaviors and solve issues of continuous optimization problems. But these algorithms are easy to fall into the dilemma of local optimum and slow convergence speed, sometimes large amount of time is wasted in waiting for convergence.
Butterfly Optimization Algorithm (BOA) [16] method simulates the behaviors of butterflies on food foraging and mating. The algorithm only relies on a few parameters to maintain the balance of global search and local search by conducting the mechanism of fragrance diffusion, which evaluates speed of convergence to the best solution based on butterfly movements. Gray Wolf Optimization (GWO) [17,18] algorithm simulates the hierarchy and hunting strategy of gray wolves. The wolf group contains Alpha, Beta, Delta, and Omega, where leader Alpha represents optimal solution, Beta and Delta represent the suboptimal and tertiary solutions, respectively, and Omega follows the guidance of these leaders to explore the searching space. By tracking, encircling, and attacking prey, the optimum solution is gradually reached. Multi-Verse Optimization (MVO) [19,20] method imitates the motion of multiverse population with the combination of white holes, black holes, and wormholes. The white and black holes are utilized among detection period and wormholes act in the mining phase. The performance of this method is affected by finding the location of wormholes, which are located within the orbit of white holes and black holes to converge towards an optimum solution. Ant Lion Optimization (ALO) [21,22] method mimics the behaviors of ant lions’ predating behavior on ants, where ants are moving around the searching spaces while ant lions utilize traps for wandering randomly in order to better capture the searching targets. By dynamically altering the parameters of moving speed, trapping locations, and optimum solutions are found with the convergence of ant lions and ants. Moth-Flame Optimization (MFO) [23,24] method simulates the flying behavior of moths, which involves the operations of finding the target fire, flying around the fire, and fluttering the fire. As fixed number of moths wander around the solution spaces, the number of moths is of great importance to the convergence, and the number of flames defines the solutions need to be solved for enhancing the model’s robustness. Sine Cosine Algorithm (SCA) [25,26] method is a stochastic optimization method, which simply utilizes the volatility and periodicity of sine and cosine functions to realize the goal of objective search. The algorithm is easy to implement with fewer parameters and faster convergence speed, which is practical in real life. Simulated Annealing (SA) [27] method aims at finding the approximate global optimum solution within a large searching space in a certain period. The global optimum solution is approached by combining multiple local optimum solutions among multivariate objective functions [28]. The temperature issue mainly influences the rate of accepting worse solutions in this model.
The Variable Butterfly Optimization Algorithm (VBOA) proposed in this paper was compared with others. We used the average and standard deviation of the optimization results as the criteria for evaluating the superiority or inferiority of the algorithm. We set the max iteration number of 100 to maintain the balance of convergence and avoid local optimum solutions. The convergence curves are shown in Figure 1, Figure 2, Figure 3, Figure 4, Figure 5, Figure 6, Figure 7, Figure 8, Figure 9 and Figure 10. The predicted results for each algorithm are presented in Table 2.
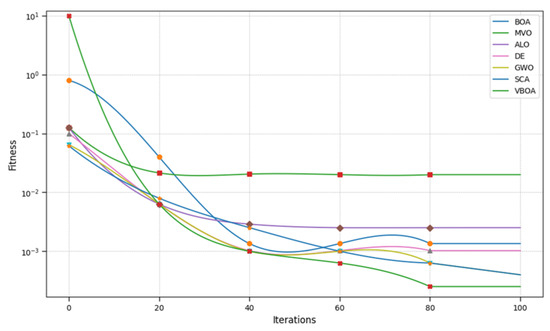
Figure 1.
Result of Kowalik ff.
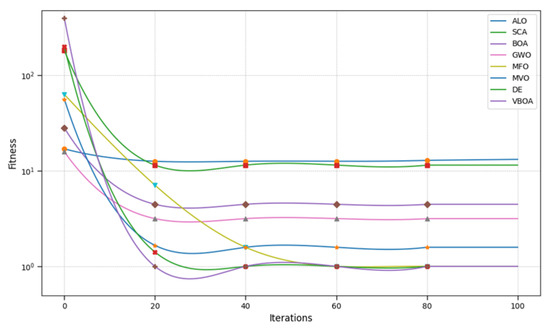
Figure 2.
Result of Foxholes.
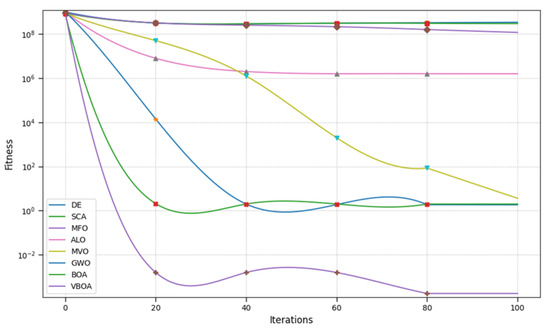
Figure 3.
Result of Penalized 2.
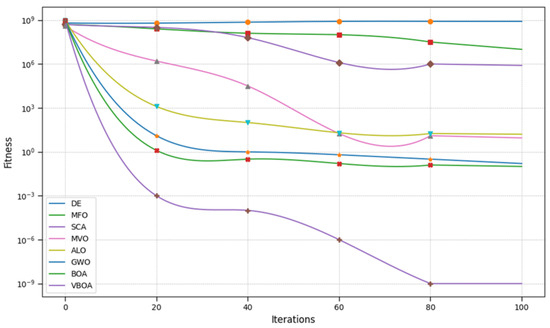
Figure 4.
Result of Penalized 1.
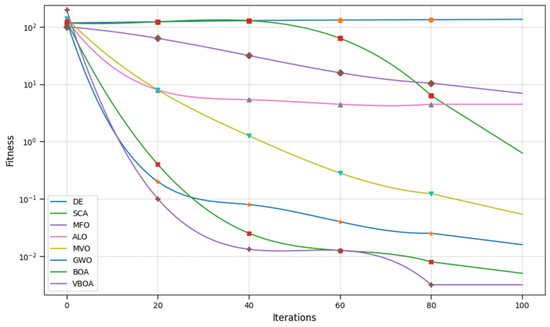
Figure 5.
Result of Noise.
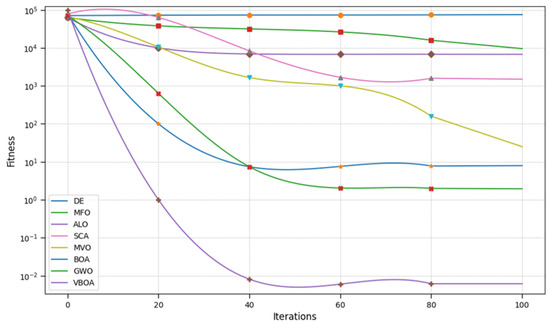
Figure 6.
Result of Step.
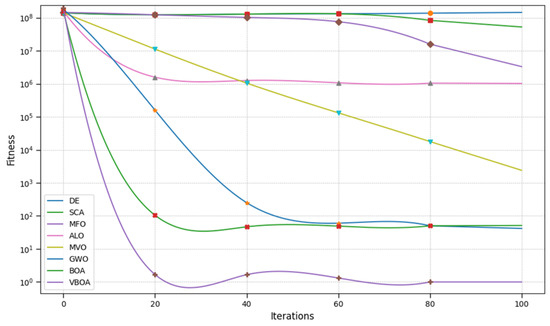
Figure 7.
Result of Rosenbrock.
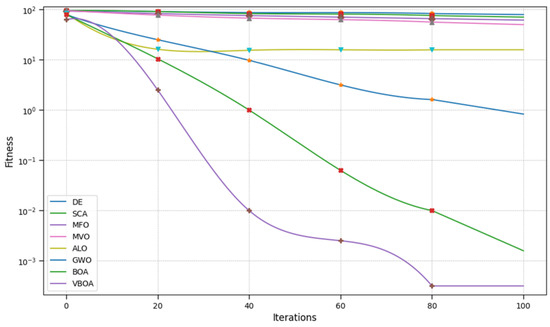
Figure 8.
Result of Schwefel 2.21.
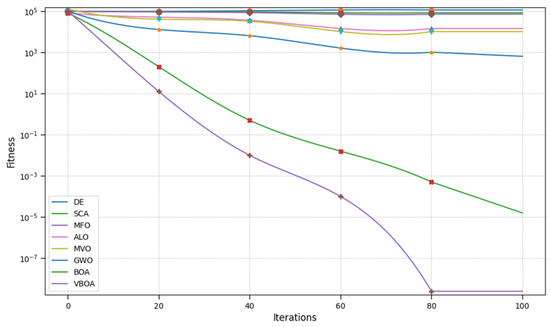
Figure 9.
Result of Schwefel 1.2.
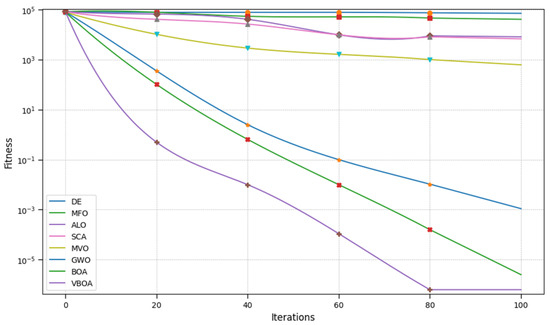
Figure 10.
Result of Sphere.
Table 2.
The value of the results.
From Figure 1, Figure 2, Figure 3, Figure 4, Figure 5, Figure 6, Figure 7, Figure 8, Figure 9 and Figure 10 and Table 2, we can observe that the Variable Butterfly Optimization Algorithm proposed in this paper performs better in terms of both convergence speed and convergence accuracy compared to similar algorithms. This evidence is sufficient to demonstrate the effectiveness of our improvement.
4. Design and Experiment
The experiment consists of 10 demand points and 4 candidate sites for emergency material centers. During the initial stage of the emergency event, partial experimental data for each trial are shown in Table 3 and Table 4. As the emergency event progresses, the data for the later stage of the experiment are presented in Table 5 and Table 6, while other relevant parameters are listed in Table 7 and Table 8. The unit transportation cost is set at 3/km, the penalty cost coefficient for early arrival time is 2, and the penalty cost coefficient for late arrival time is 6. The test results on our select samples are demonstrated in Table 9 and Table 10, the functions of our statistical analysis is shown in Table 11, and the statistical results of our study are shown in Table 12 and Table 13.
Table 3.
Experimental data for the initial stage include demand points.
Table 4.
Initial site selection, experimental data.
Table 5.
Experimental data for later-stage demand points.
Table 6.
Later site selection, experimental data.
Table 7.
Distance parameters between demand points and candidate sites (km).
Table 8.
Road extension coefficients between demand points and candidate sites.
Table 9.
Results of VOBA before Preliminary Site.
Table 10.
Results of VOBA after Preliminary Site.
Table 11.
Testing functions.
Table 12.
Optimization results of testing function ().
Table 13.
Optimization results of testing function ().
As the emergency event unfolds, the relevant information of demand points and candidate sites changes. To verify the limitations of the model, information from the fifth day after the occurrence of the emergency event is selected as the experimental data required for the later stage model of the emergency event. The specifics are as follows:
Substitute the above parameters into the early-stage model of emergency logistics site selection and use the Variable Butterfly Optimization Algorithm proposed in this paper to solve it. Compared with other algorithms, the iterative process is shown in Figure 11, and the results are shown in Table 9.
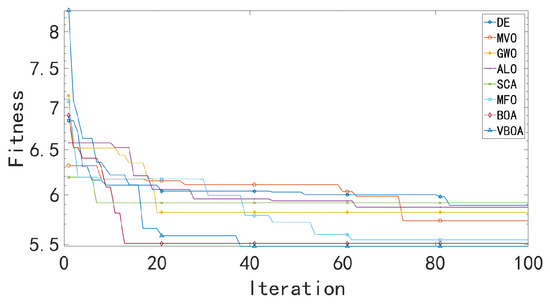
Figure 11.
Result of early-stage Model.
After completing the preliminary site selection model, we applied the algorithm to the later site selection model. The iterative process is shown in Figure 12, and the results are shown in Table 10.
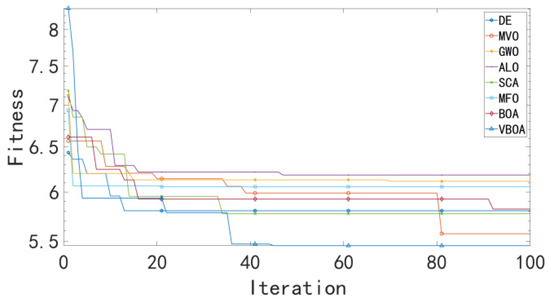
Figure 12.
Result of later-stage model.
From the table, it can be observed that the Variable Butterfly Optimization Algorithm proposed in this paper performs exceptionally well in solving the emergency material center siting problem. Not only does it balance coverage area and cost, but it also meets the requirements for fairness and delivery time.
In order to test the performance of our improved method, VBOA, we compared our test experiment on our sampled data with the original version. The statistical results are mainly based on the testing functions, where is the two-dimensional function, contains the only global optimum point and the variation in the values in the parabolic valleys is relatively small, does not have local optimum value with only global optimum point, and has multiple local minimum values. However, it is hard to find global minimum value. Detailed descriptions of these functions are shown in Table 11. The statistical analysis of our table utilizes average precision to evaluate our performance of our redesigned method.
The comparison of our method has been made with the original Butterfly Optimization Algorithm and improved the performance of the method in dealing with dynamic optimization issues. The results are shown in cases of dimension value D in 10 and 30; detailed results are shown in Table 12 and Table 13.
The results demonstrate that our redesigned method has better performance in dealing with multidimensional optimization problems, while the convergence and searching ability of our method has been greatly improved.
5. Conclusions
In conclusion, our paper aimed at solving the issue of finding the locations of emergency sites material centers in emergency situations with a dynamic prediction of the demand of materials in different periods. We redesigned the original Butterfly Optimization Algorithm, which has the advantage of finding fast solutions in lower dimensions of continuous data but has limitations on early convergence of search limitations. In order to deal with the problem of emergency material center siting throughout all periods, we introduced the variation operator to initially divide populations into a multi-ring concentric structure and added search variation operators to relieve the limitations on local optimum problems. Our proposed method has the uniqueness of adding random perturbation factors to complement the diversity of grouping population, and the performance on global search and model’s convergence have been improved. However, our method has limitations when considering real-life scenarios involving factors of uncertain conditions like budget or vehicle capacity on local conditions. Furthermore, the robustness of our method should be considered in the future as the randomness of selecting places has not been tested in our method, which we need to consider thoroughly.
Author Contributions
Conceptualization, Y.S.; methodology, L.Y.; validation, H.J.; formal analysis, L.Y.; investigation, W.C.; resources, Z.S.; writing—original draft preparation, Y.S.; writing—review and editing, W.C.; supervision, W.C.; project administration, Z.S.; funding acquisition, Z.S. All authors have read and agreed to the published version of the manuscript.
Funding
This research was funded by Jiangsu Agriculture Science and Technology Innovation Fund (JASTIF) CX(22)1007.
Data Availability Statement
The original contributions presented in this study are included in the article. Further inquiries can be directed to the corresponding author.
Conflicts of Interest
The authors declare no conflicts of interest.
References
- Jiang, X.Y.; Pa, N.Y.; Wang, W.C.; Yang, T.T.; Pan, W.T. Site Selection and Layout of Earthquake Rescue Center Based on K-Means Clustering and Fruit Fly Optimization Algorithm. In Proceedings of the 2020 IEEE International Conference on Artificial Intelligence and Computer Applications (ICAICA), Dalian, China, 27–29 June 2020; pp. 1381–1389. [Google Scholar]
- Yan, X.; Hou, H.; Yang, J.; Fang, J. Site selection and layout of material reserve based on emergency demand graduation under large-scale earthquake. Sustainability 2021, 13, 1236. [Google Scholar] [CrossRef]
- Jiang, J. Study on site selection model of emergency rescue base based on fuzzy analytic hierarchy process. In Proceedings of the 2021 6th International Conference on Transportation Information and Safety (ICTIS), Wuhan, China, 22–24 October 2021; pp. 896–901. [Google Scholar]
- Wen, Y.; Song, R.; Zhang, F.; Zhou, C.; Yi, W.; Sui, Z. Site selection model and algorithm for oil spill emergency rescue point on the Yangtze River trunk line. In Proceedings of the 2019 5th International Conference on Transportation Information and Safety (ICTIS), Liverpool, UK, 14–17 July 2019; pp. 759–764. [Google Scholar]
- Cheng, D.; Tang, T.; Li, Z. Research on the Emergency Rescue Point Location Method Harbor Cruise Ship. In Proceedings of the 2020 IEEE 9th Joint International Information Technology and Artificial Intelligence Conference (ITAIC), Chongqing, China, 11–13 December 2020; pp. 1656–1660. [Google Scholar]
- Hu, M.; Cai, W. Research on the evacuation characteristics of cruise ship passengers in multi-scenarios. Appl. Sci. 2022, 12, 4213. [Google Scholar] [CrossRef]
- Liu, Y.; Li, L.; Xie, Z.; Zhu, G.; Xu, G. Urban emergency shelter site selection. In Proceedings of the 2017 International Conference on Behavioral, Economic, Socio-Cultural Computing (BESC), Krakow, Poland, 16–18 October 2017; pp. 1–6. [Google Scholar]
- Ma, Y.; Liu, X.; Shao, P. A Multi-Strategy Improved Butterfly Optimization Algorithm. In Proceedings of the 2023 International Conference on New Trends in Computational Intelligence (NTCI), Qingdao, China, 3–5 November 2023; pp. 324–328. [Google Scholar]
- Shahbandegan, A.; Naderi, M. A Binary Butterfly Optimization Algorithm for the Multidimensional Knapsack Problem. In Proceedings of the 2020 6th Iranian Conference on Signal Processing and Intelligent Systems (ICSPIS), Mashhad, Iran, 23–24 December 2020; pp. 1–5. [Google Scholar]
- Verma, A.S.; Choudhary, A.; Tiwari, S. Test Case Optimization using Butterfly Optimization Algorithm. In Proceedings of the 2020 10th International Conference on Cloud Computing, Data Science & Engineering (Confluence), Noida, India, 29–31 January 2020; pp. 704–709. [Google Scholar]
- Ma, H.; Leng, P.; Yang, Z.; Li, D.; Nai, W. Logistic Regression Based on t-Distribution Butterfly Optimization Algorithm. In Proceedings of the 2021 14th International Symposium on Computational Intelligence and Design (ISCID), Hangzhou, China, 11–12 December 2021; pp. 372–376. [Google Scholar]
- Fan, Y.; Shao, J.; Sun, G.; Shao, X. A Self-Adaption Butterfly Optimization Algorithm for Numerical Optimization Problems. IEEE Access 2020, 8, 88026–88041. [Google Scholar] [CrossRef]
- Tang, W.; Gao, Y.; Xing, M. Translational Motion Compensation Method Based On Global Butterfly Optimization Algorithm for ISAR Imaging. In Proceedings of the 2021 CIE International Conference on Radar (Radar), Haikou, China, 15–19 December 2021; pp. 27–30. [Google Scholar]
- Yang, Z.; Li, D.; Nai, W. T-SNE Based on Halton Sequence Initialized Butterfly Optimization Algorithm. In Proceedings of the 2023 IEEE 13th International Conference on Electronics Information and Emergency Communication (ICEIEC), Beijing, China, 14–16 July 2023; pp. 1–5. [Google Scholar]
- Yao, J.; Guo, H.; Liu, X.; Chi, P. Improved Monarch Butterfly Optimization for Multi-to-Multi Weapon-Target Assignment Problems. In Proceedings of the 2020 Chinese Automation Congress (CAC), Shanghai, China, 6–8 November 2020; pp. 1391–1396. [Google Scholar]
- Cao, P.; Huang, Q. Hybrid Multi-Strategy Improved Butterfly Optimization Algorithm. Appl. Sci. 2024, 14, 11547. [Google Scholar] [CrossRef]
- Deng, F.; Wei, Y.; Liu, Y.; Yan, B.; Wu, J.; Cui, Y.; Pan, S. Distribution route optimisation of emergency supplies based on improved grey wolf optimisation algorithm. Int. J. Logist. Res. Appl. 2023, 1–17. [Google Scholar] [CrossRef]
- Seyedali, M.; Seyed, M.; Andrew, L. Grey Wolf Optimizer. Adv. Eng. Softw. 2014, 96, 46–61. [Google Scholar]
- Sahoo, S.K.; Premkumar, M.; Saha, A.K.; Houssein, E.H.; Wanjari, S.; Emam, M.M. Multi-objective quasi-reflection learning and weight strategy-based moth flame optimization algorithm. Neural Comput. Appl. 2024, 36, 4229–4261. [Google Scholar] [CrossRef]
- Amezquita, L.; Castillo, O.; Soria, J.; Cortes-Antonio, P. New variants of the multi-verse optimizer algorithm adapting chaos theory in benchmark optimization. Symmetry 2023, 15, 1319. [Google Scholar] [CrossRef]
- Durgut, P.G.; Tozak, M.B.; Ayvaz, M.T. SHuffled Ant Lion Optimization approach with an exponentially weighted random walk strategy. Neural Comput. Appl. 2024, 36, 10475–10499. [Google Scholar] [CrossRef]
- Seyedali, M. The Ant Lion Optimizer. Adv. Eng. Softw. 2014, 83, 80–98. [Google Scholar]
- Yin, L.; Liu, R. A normalized deep neural network with self-attention mechanisms based multi-objective multi-verse optimization algorithm for economic dispatch. Appl. Energy 2025, 383, 125414. [Google Scholar] [CrossRef]
- Sahoo, S.K.; Saha, A.K.; Ezugwu, A.E.; Agushaka, J.O.; Abuhaija, B.; Alsoud, A.R.; Abualigah, L. Moth flame optimization: Theory, modifications, hybridizations, and applications. Arch. Comput. Methods Eng. 2023, 30, 391–426. [Google Scholar] [CrossRef] [PubMed]
- Wei, F.; Zhang, Y.; Li, J. Multi-strategy-based adaptive sine cosine algorithm for engineering optimization problems. Expert Syst. Appl. 2024, 248, 123444. [Google Scholar] [CrossRef]
- Mirjalili, S. SCA: A sine cosine algorithm for solving optimization problems. Knowl.-Based Syst. 2016, 96, 120–133. [Google Scholar] [CrossRef]
- Pardalos, P.M.; Mavridou, T.D. Simulated annealing. In Encyclopedia of Optimization; Springer International Publishing: Cham, Switzerland, 2024; pp. 1–3. [Google Scholar]
- Stewart, R.H.; Palmer, T.S.; DuPont, B. A survey of multi-objective optimization methods and their applications for nuclear scientists and engineers. Prog. Nucl. Energy 2021, 138, 103830. [Google Scholar] [CrossRef]
Disclaimer/Publisher’s Note: The statements, opinions and data contained in all publications are solely those of the individual author(s) and contributor(s) and not of MDPI and/or the editor(s). MDPI and/or the editor(s) disclaim responsibility for any injury to people or property resulting from any ideas, methods, instructions or products referred to in the content. |
© 2025 by the authors. Licensee MDPI, Basel, Switzerland. This article is an open access article distributed under the terms and conditions of the Creative Commons Attribution (CC BY) license (https://creativecommons.org/licenses/by/4.0/).