Article

Roadside Perception Applications Based on DCAM Fusion and Lightweight Millimeter-Wave Radar–Vision Integration

1
College of Electron and Information, Zhongshan Institute, University of Electronic Science and Technology of China, Zhongshan 528402, China
2
Heilongjiang Province Key Laboratory of Laser Spectroscopy Technology and Application, Harbin University of Science and Technology, Harbin 150080, China
*
Author to whom correspondence should be addressed.
Electronics 2025, 14(8), 1576; https://doi.org/10.3390/electronics14081576
Submission received: 7 March 2025 / Revised: 6 April 2025 / Accepted: 11 April 2025 / Published: 13 April 2025

Abstract

:
With the advancement in intelligent transportation systems, single-sensor perception solutions face inherent limitations. To address the constraints of monocular vision detection, this study presents a vehicle road detection system that integrates millimeter-wave radar and visual information. By generating mask maps from millimeter-wave radar point clouds, radar data transition from a global assistance role to localized guidance, identifying vehicle target positions within RGB images. These mask maps, along with RGB images, are processed by a Dual Cross-Attention Module (DCAM), where the fused features are fed into an enhanced YOLOv5 network, improving target localization accuracy. The proposed dual-input DCAM enables dynamic feature fusion, allowing the model to adjust its reliance on visual and radar data according to environmental conditions. To optimize the network architecture, ShuffleNetv2 replaces the YOLOv5 Backbone, while the Ghost Module is incorporated into the Neck, creating a lightweight design. Pruning techniques are applied to reduce model complexity, making it suitable for embedded applications and real-time detection scenarios. The experimental results demonstrate that this fusion scheme effectively improves vehicle detection accuracy and robustness compared to YOLOv5, with accuracy increasing from 59.4% to 67.2%. The number of parameters is reduced from 7.05 M to 2.52 M, providing a precise and reliable solution for intelligent transportation and roadside perception.

1. Introduction

With the rapid growth in China’s social economy, the living standards of its residents have significantly improved. To facilitate travel, the construction of expressways and highways has continuously advanced. According to statistics, as of 2023, the total number of civilian vehicles in China reached 330 million, with privately owned vehicles accounting for 290 million [1]. Meanwhile, China’s total road mileage has expanded to 5.35 million kilometers, with expressways and highways increasing by 1.12 million kilometers compared to previous levels, bringing the total highway mileage to 177,000 km. However, the expansion of road infrastructure has failed to keep pace with the rapid increase in vehicle ownership, leading to escalating road safety concerns and a rise in traffic accidents. According to official reports, in total, 256,409 traffic accidents have occurred nationwide, of which 157,407 involved automobiles, accounting for approximately 61% of all cases.
Traffic accidents have resulted in significant economic losses, underscoring the urgent need for effective measures to enhance road safety and protect lives and property. Traditional traffic monitoring primarily relies on video surveillance, which, while effective under limited data loads, struggles to cope with the increasing complexity and volume of modern traffic data. The Intelligent Transportation System (ITS) integrates advanced technologies, including information processing, communication, sensing, control, and computing, into transportation management, forming a robust and intelligent infrastructure [2]. Within this framework, traffic target detection and tracking play a crucial role in ensuring efficient and reliable monitoring [3].
Commonly used sensors for traffic target detection include millimeter-wave radar, video cameras, LiDAR, and infrared sensors [4]. Each of these technologies has distinct advantages and limitations. Millimeter-wave radar detects moving targets by transmitting electromagnetic signals, providing precise speed and distance measurements across a wide range. However, it lacks detailed object information and is susceptible to clutter interference. Video-based detection utilizes grayscale image variations to deliver cost-effective and accurate vehicle recognition, but it is highly sensitive to weather conditions, occlusions, and environmental constraints, and it lacks the ability to measure speed or precise positioning [5]. LiDAR offers high-resolution 3D point clouds, enabling accurate positioning and the shape detection of objects. However, it is computationally expensive and costly to deploy. Infrared detection relies on structural and edge-based features, but the absence of color information complicates the detection of small objects, as their edges may appear blurred.
A single sensor alone cannot fully meet the requirements of traffic target detection, as each suffers from inherent limitations that may result in detection failures or inaccuracies. This makes multi-sensor fusion a crucial strategy, allowing different sensors to complement each other’s strengths and provide a more comprehensive and reliable traffic perception system. This study explores millimeter-wave radar and vision fusion within intelligent traffic systems, aiming to overcome the constraints of single-sensor detection, enhance traffic monitoring efficiency at intersections and in urban areas, and contribute to more effective traffic management.
This study’s contributions include using radar point clouds to create a mask map that highlights vehicle target areas in images and improving localization in tough conditions like occlusion or low light. A dual-input DCA [6] module fuses visual and radar features with dynamic weighting—favoring vision in good light and radar in occlusion—for greater flexibility. The model uses ShuffleNetv2 and Ghost Modules to cut complexity, suiting real-time use on embedded devices while maintaining accuracy. It also optimizes DBSCAN clustering with adaptive parameters, trajectory prediction, and KD-tree searches to process radar point clouds more accurately and efficiently.

2. Related Work

2.1. Visual Target Detection Methods

Visual target detection, which relies on image or video data to automatically identify and locate objects, has gained considerable attention in recent years. Traditional methods, which rely on shallow neural networks and handcrafted features, have shown limited success in complex environments with diverse targets. In contrast, deep learning-based approaches now dominate the field, leveraging deep neural networks to extract features and predict target positions and categories in an end-to-end fashion. These methods generate candidate regions for classification and localization, where classifiers identify objects and regressors refine bounding boxes.
Deep learning-based object detection methods can be classified into two-stage and single-stage approaches. Two-stage methods, such as SPP-net [7], R-CNN [8], Fast R-CNN [9], and Faster R-CNN [10], first generate regional proposals before classification and localization, offering high detection accuracy but at the expense of slower inference speeds. Single-stage methods, such as SSD [11] and YOLO [12,13], directly perform classification and localization in a unified framework, prioritizing real-time efficiency while maintaining competitive accuracy.
Deep learning models have significantly advanced object detection by capturing multi-level semantic and contextual information through deep feature abstraction and fusion. These models, when trained on large-scale datasets with high computational resources, exhibit superior detection capabilities. For example, Ghosh et al. [14] enhanced Faster R-CNN by incorporating multi-scale Region Proposal Networks (RPNs) to improve vehicle detection under varying weather conditions. Similarly, Ma et al. [15] introduced a densely connected Feature Pyramid Network into YOLOv3, boosting detection performance.

2.2. Millimeter-Wave Radar Detection Methods

For millimeter-wave radar-based detection, various improvements have been proposed. Rainier Heijne et al. [16] refined the CFAR (Constant False Alarm Rate) algorithm using Monte Carlo simulations, enhancing its accuracy and sensitivity in detecting moving targets such as pedestrians and vehicles in traffic environments. Deng et al. [17] combined radar range-Doppler images with YOLOv3, enabling the automatic detection of vehicles, bicycles, pedestrians, and trucks, contributing to advances in intelligent radar perception. Tzvi Diskin et al. [18] introduced a sparse adaptive CFAR algorithm, optimizing noise estimation in cluttered environments and improving multi-target detection. H. Zhao et al. [19] developed an adaptive tracking framework based on a non-uniform Poisson process, enhancing multi-target tracking in complex settings. L. Cheng et al. [20] employed CNNs on range-Doppler radar data, improving vehicle-mounted radar detection in challenging conditions. Q. Ge et al. [21] combined noise density-based clustering with Gaussian kernel distance and Kalman filtering, refining target tracking precision. Y et al. [22] applied a Gaussian Hidden Markov Model, leveraging radar speed and distance data to improve stationary object detection.

2.3. Multi-Sensor Fusion Approaches

The fusion of millimeter-wave radar and vision can be classified into three levels: Data-level fusion combines raw radar and camera data, preserving detailed sensor information with low computational overhead. However, it is highly sensitive to data instability, requiring extensive preprocessing due to differences in sensor modalities. Feature-level fusion extracts and merges features from radar and image data, reducing computational demands while improving detection speed. However, some raw data may be lost, affecting precision, and the method requires customized feature extraction techniques, increasing system complexity. Decision-level fusion integrates detection results from multiple sensors using filtering techniques, such as Bayesian theory [23], Kalman filtering [24,25], and Dempster–Shafer theory [26]. This approach is flexible, fault-tolerant, and well-suited for heterogeneous sensor integration, but it demands high computational resources and advanced fusion algorithms.
In research, Y. Fang et al. [27] first proposed converting 3D radar points into 2D image projections for target detection, merging radar and camera data. However, early radar data missed many targets over short distances. Yeong et al. [28] improved this by extracting target regions from vehicle shadows and radar points together. Zhang et al. [29] transformed radar points into pixel coordinates, feeding them into a Region Proposal Network (RPN) for better efficiency. Wu et al. [30] used an enhanced YOLOv5 algorithm with radar and camera data for multi-target detection, boosting accuracy and efficiency. Meanwhile, Wiseman [31] explored the use of ultrasonic rangefinders as ancillary sensors for autonomous vehicles, demonstrating their potential in short-range obstacle detection. Similarly, Premnath et al. [32] designed a sensor fusion system combining LiDAR, ultrasonic sensors, and wheel encoders, highlighting the advantages of multi-modal data integration for robust perception.

2.4. Key Contributions of the Proposed Method

The following summarizes the key contributions of the proposed method:
(1) Multi-Sensor Fusion Framework: We present a novel vehicle road detection system that integrates millimeter-wave radar and visual data by transforming radar point clouds into mask maps. This approach provides precise localized guidance for target detection within RGB images, effectively improving detection accuracy.
(2) Dual Cross-Attention Module (DCAM): We improve the DCAM, which is a mechanism that dynamically fuses radar and visual features by adjusting feature weights based on environmental conditions. This adaptive strategy significantly enhances target localization accuracy, particularly in challenging scenarios such as occlusions and adverse weather conditions.
(3) Lightweight Optimization and Embedded Deployment: We optimize the YOLOv5 model by integrating ShuffleNetv2 and Ghost Modules, coupled with pruning techniques, reducing model parameters from 7.05 M to 2.52 M with minimal accuracy loss. The optimized model is converted to ONNX format and accelerated via C++, enabling real-time inference on embedded platforms.

3. Methods

3.1. Roadside Sensing Architecture

This study focuses on a vehicle road detection system that integrates millimeter-wave radar and visual information for enhanced target perception. First, millimeter-wave radar and camera data are synchronously collected and fused, with preprocessing applied to raw radar point cloud data. Specifically, the proposed method employs radar distance and angle estimation algorithms to determine the spatial positioning of radar detections. These estimations are then combined with a DBSCAN-based clustering algorithm to refine data preprocessing and establish inter-frame data associations, thereby achieving more precise radar detection results.
Next, the preprocessed hexadecimal detection data, along with the generated mask maps and RGB images, are fed into the Dual Cross-Attention Module (DCAM) to enhance the feature representation of target regions. Finally, the enriched feature maps are input into the YOLOv5 model for object detection. The overall system framework is illustrated in Figure 1.
In terms of network optimization, lightweight modules (ShuffleNetv2 and Ghost Module) are introduced to reconstruct the Backbone and Neck components of YOLOv5, significantly improving computational efficiency. Additionally, pruning techniques are applied to further compress the model, reducing both the number of parameters and computational load. After optimization, the model is converted to the ONNX format and deployed on an embedded platform with C++ acceleration, enabling real-time and efficient vehicle detection. This optimized system provides a precise, scalable solution for intelligent transportation and roadside perception.

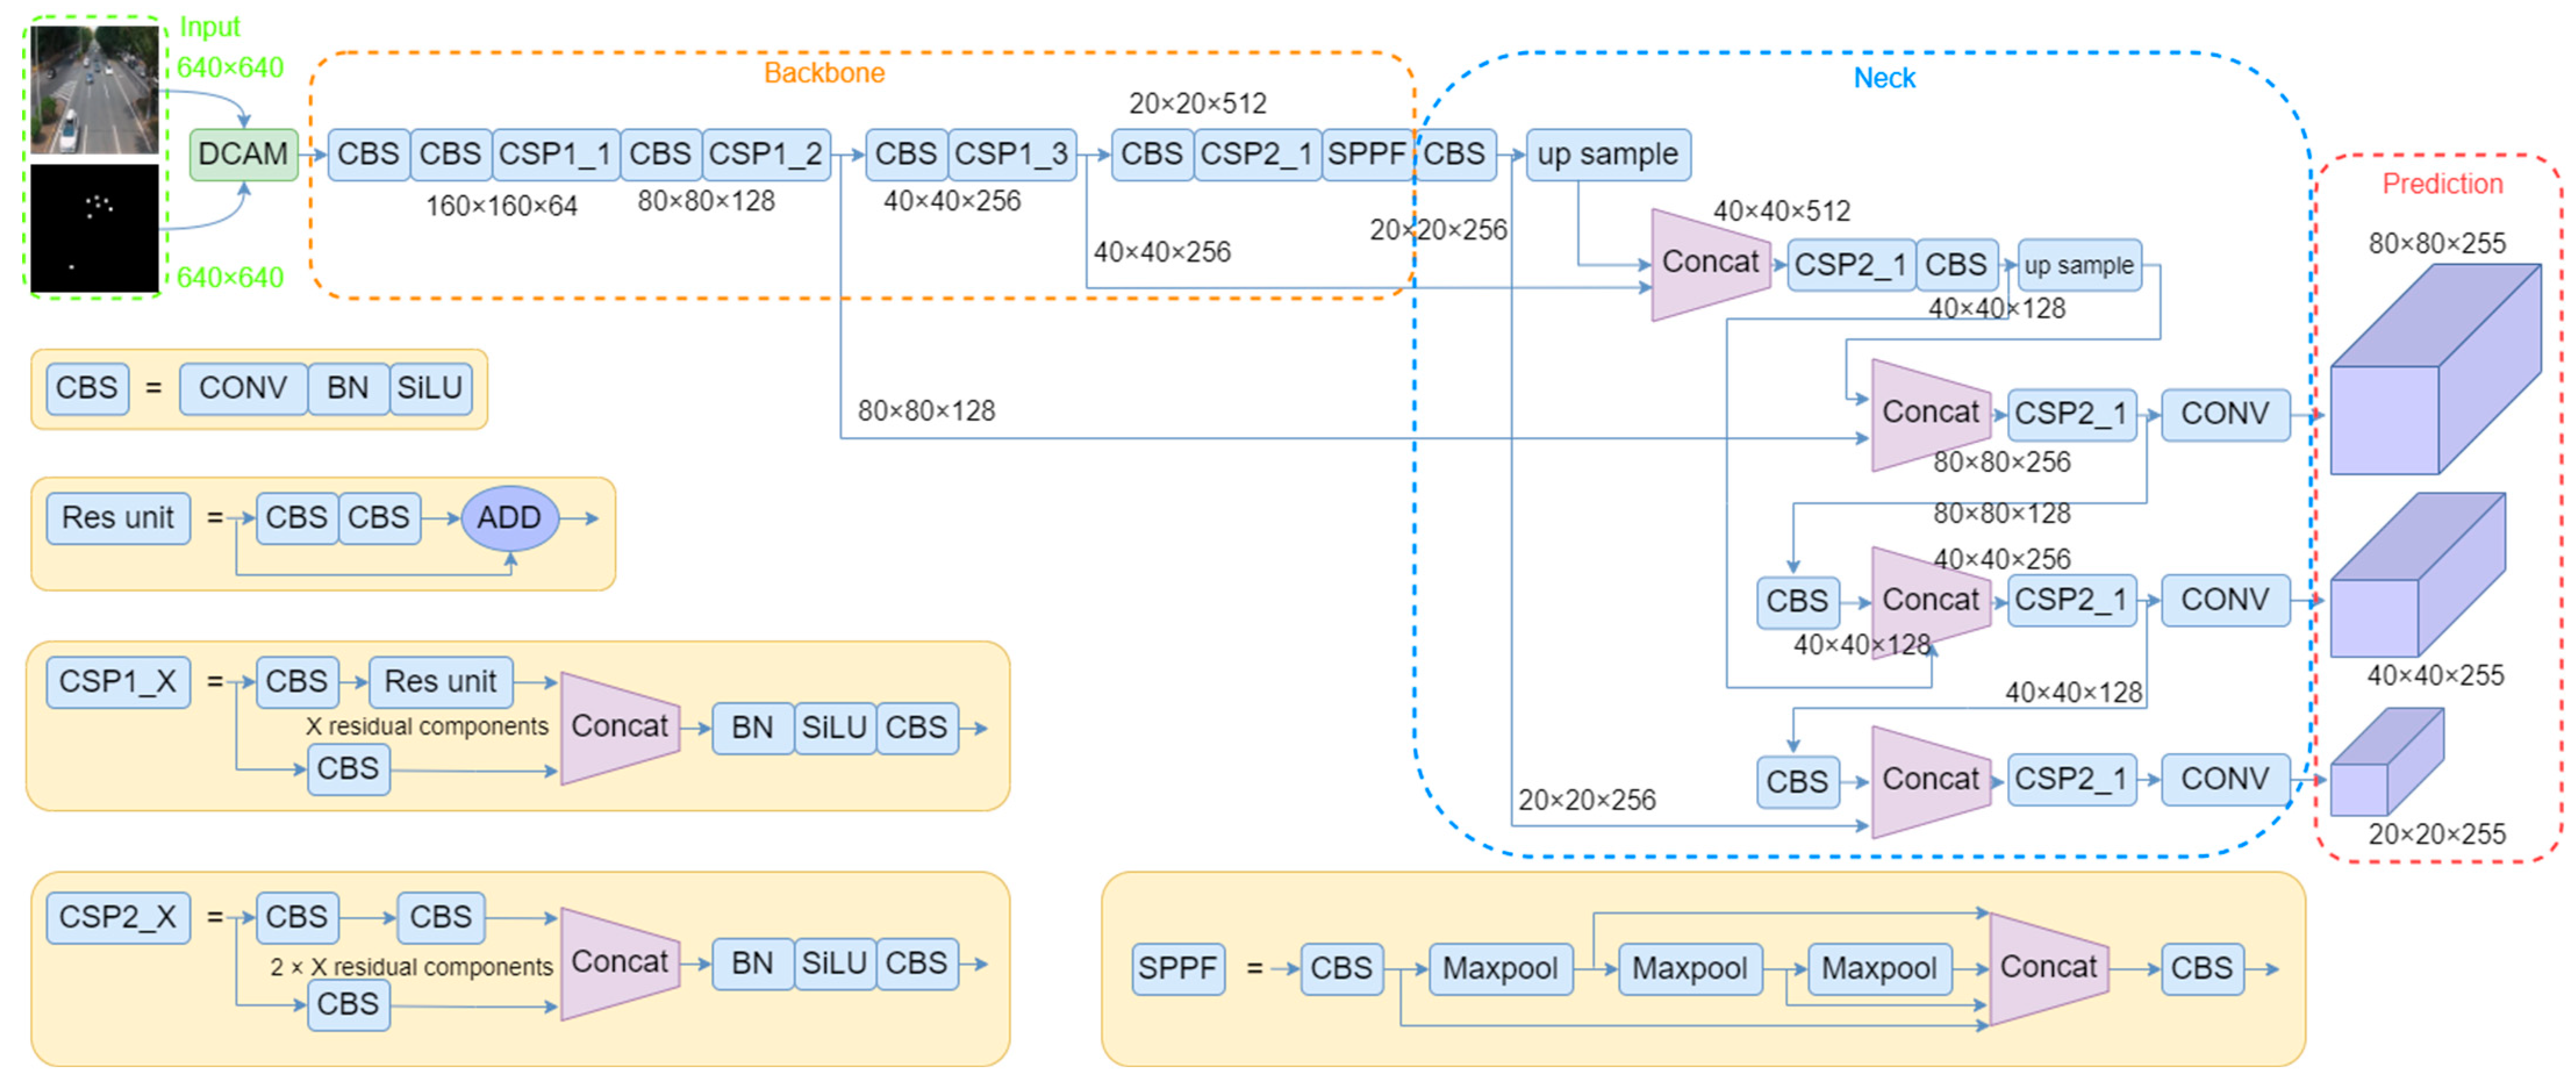
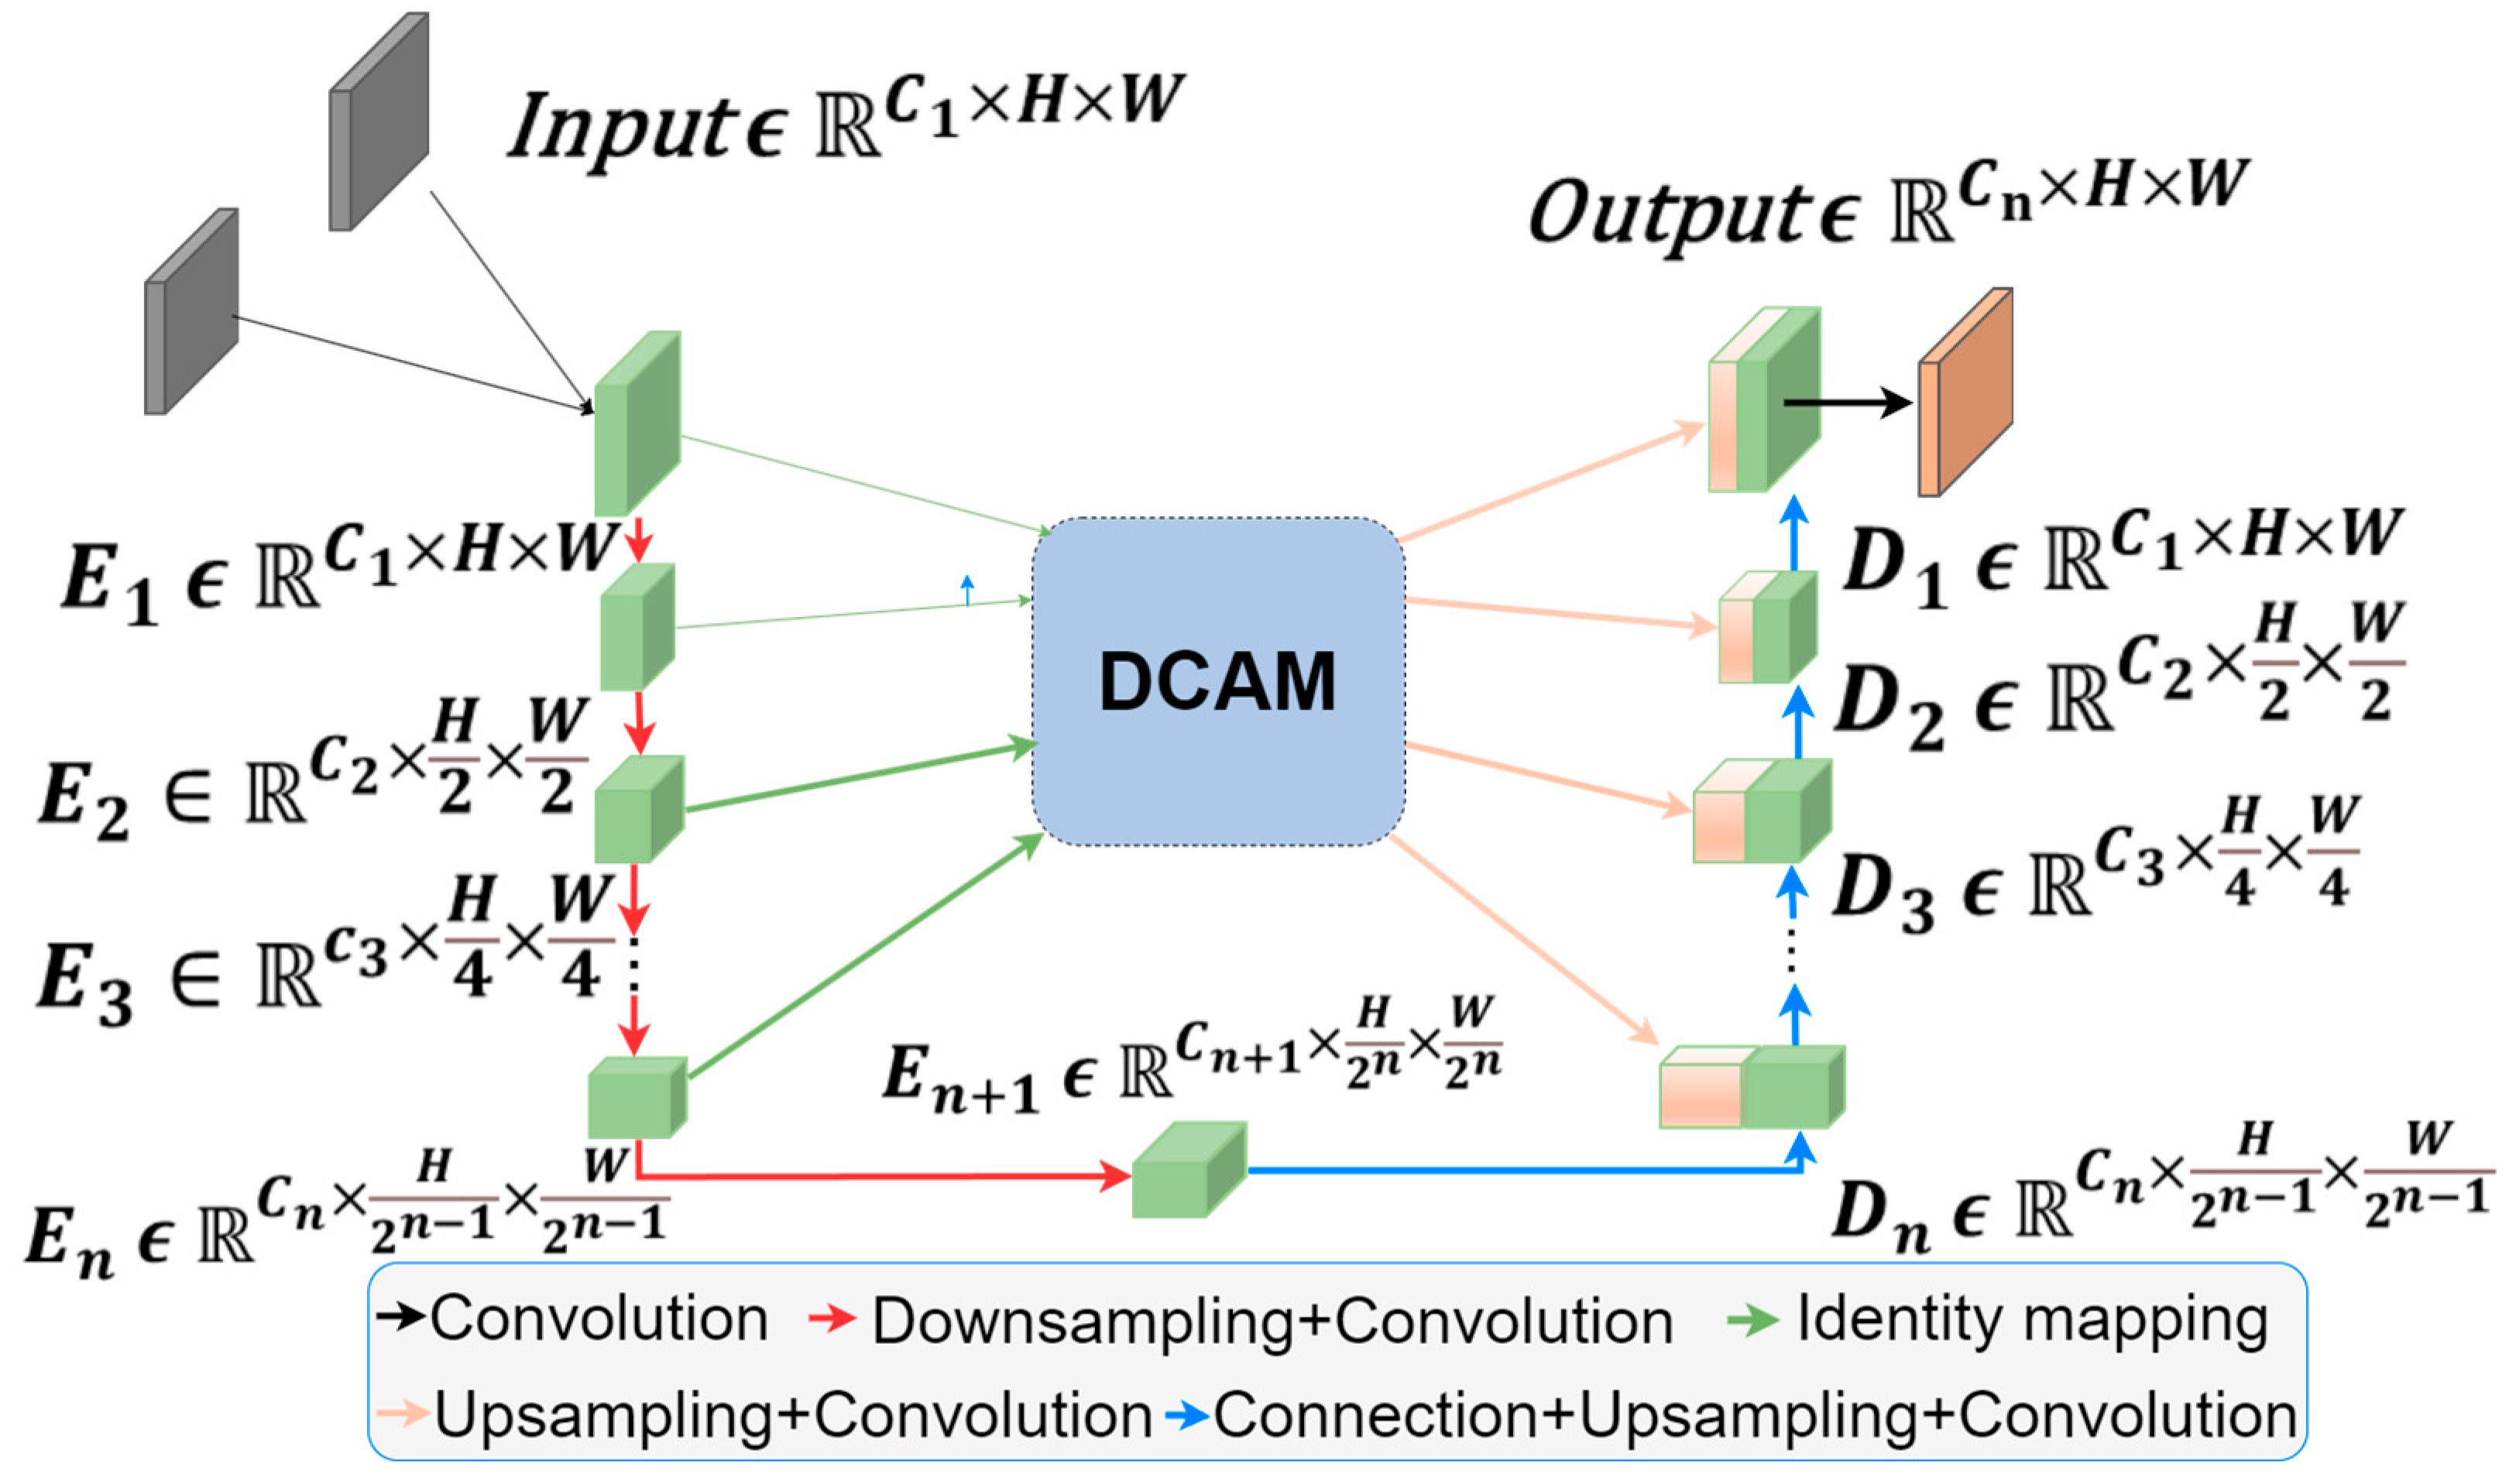
3.2. Improved Double-Cross-Attention Mechanism

The selection of YOLOv5 as the object detection framework for this study was made after a comprehensive evaluation.
(1)
YOLOv5 has been extensively validated and widely adopted in industrial applications since its initial release in 2020. Compared to its subsequent versions, it has undergone extensive community testing and bug fixes, resulting in higher stability and reliability, which is particularly crucial for roadside perception systems deployed in real-world traffic environments.
(2)
From an engineering perspective, YOLOv5 offers superior compatibility with inference acceleration frameworks such as ONNX and TensorRT, facilitating efficient deployment on embedded platforms.
This study introduces the Dual Cross-Attention Mechanism (DCAM) and designs dual-input architecture. This architecture separately processes millimeter-wave radar mask images and RGB images within the DCAM, facilitating multimodal information fusion. The DCAM dynamically enhances the model’s focus on target regions through a cross-modal attention mechanism, generating fused feature maps that are then passed to the YOLOv5 model for final object detection.
This fusion strategy effectively combines the spatial location information from millimeter-wave radar with the texture-rich features from RGB images, thereby enhancing target localization accuracy while reducing background noise interference. In scenarios where visual data are insufficient, radar information serves as a critical supplementary modality, significantly improving detection robustness and accuracy. The optimized detection pipeline enables more precise object recognition and localization in challenging environments, offering an efficient multimodal fusion solution. The overall architecture of the improved system is illustrated in Figure 2, where millimeter-wave radar mask images and RGB images serve as dual inputs. These inputs are fused via the DCAM and subsequently processed by the YOLOv5 model for object detection.
The core functionality of DCAM lies in its cross-modal attention mechanism, which fuses critical information from RGB images and millimeter-wave radar mask images. Specifically, DCAM dynamically adjusts the attention distribution of the RGB image based on the target locations extracted from the radar mask image, thereby enhancing focus on relevant target regions. Through this process, DCAM effectively guides the target locations marked in the mask image into the RGB image, significantly improving object detection accuracy.
The DCAM architecture is illustrated in Figure 3. In this figure, H and W are the height and width of the input picture size, respectively. Its structure is independent of the number of encoder stages. Given n + 1 multi-scale encoder stages, the DCAM processes feature layers from the first n stages, enhances their representations, and connects them to the corresponding n decoder stages for final feature integration.
As illustrated in Figure 4, DCA (Dual Cross-Attention) consists of two main stages and three key steps. The first stage comprises a multi-scale patch embedding the module designed to extract encoder tokens. In the second stage, Channel Cross-Attention (CCA) and Spatial Cross-Attention (SCA) modules are applied to these encoder tokens to implement DCA, enabling the capture of long-range dependencies. Finally, layer normalization and GeLU activation are employed to serialize and upsample these tokens, which are then connected to the corresponding parts of the decoder.
The process begins by extracting patches from n multi-scale encoder stages. Given n different encoder stages, denoted as E i R C i × H 2 1 × W 2 1 , the patch size is defined as P i s = P S 2 for i = 1, 2,..., n . To extract patches, average pooling with a kernel size and stride of P i s is applied, followed by a depthwise separable convolution for mapping on the flattened 2 D patches as follows:
T i = D C o n v 1 D E i ( R e s h a p e ( A v g P o o l 2 D E i ( E i ) ) )
where T i R p × C i represents the flattened patches from the i-th encoder stage for i = 1, 2,..., n .
In CCA, as shown in Figure 4, each T i first undergoes layer normalization (LN). Then, all T i ( i = 1, 2,..., n ) are concatenated along the channel dimension to form T c , which is used to generate Key and Value, while each T i serves as the Query. To further capture local information while reducing computational complexity, depthwise separable convolution is integrated into the self-attention mechanism.
In SCA, as illustrated in Figure 4, given the CCA-processed output T i R p × C i ( i = 1, 2,..., n ), layer normalization and concatenation are performed along the channel dimension. Unlike CCA, the concatenated token T c is used as Query and Key, while each T i serves as Value. The 1 × 1 depthwise separable convolutions are applied for projection on the Queries, Keys, and Values.

4. Implementation of Dual Sensor Fusion

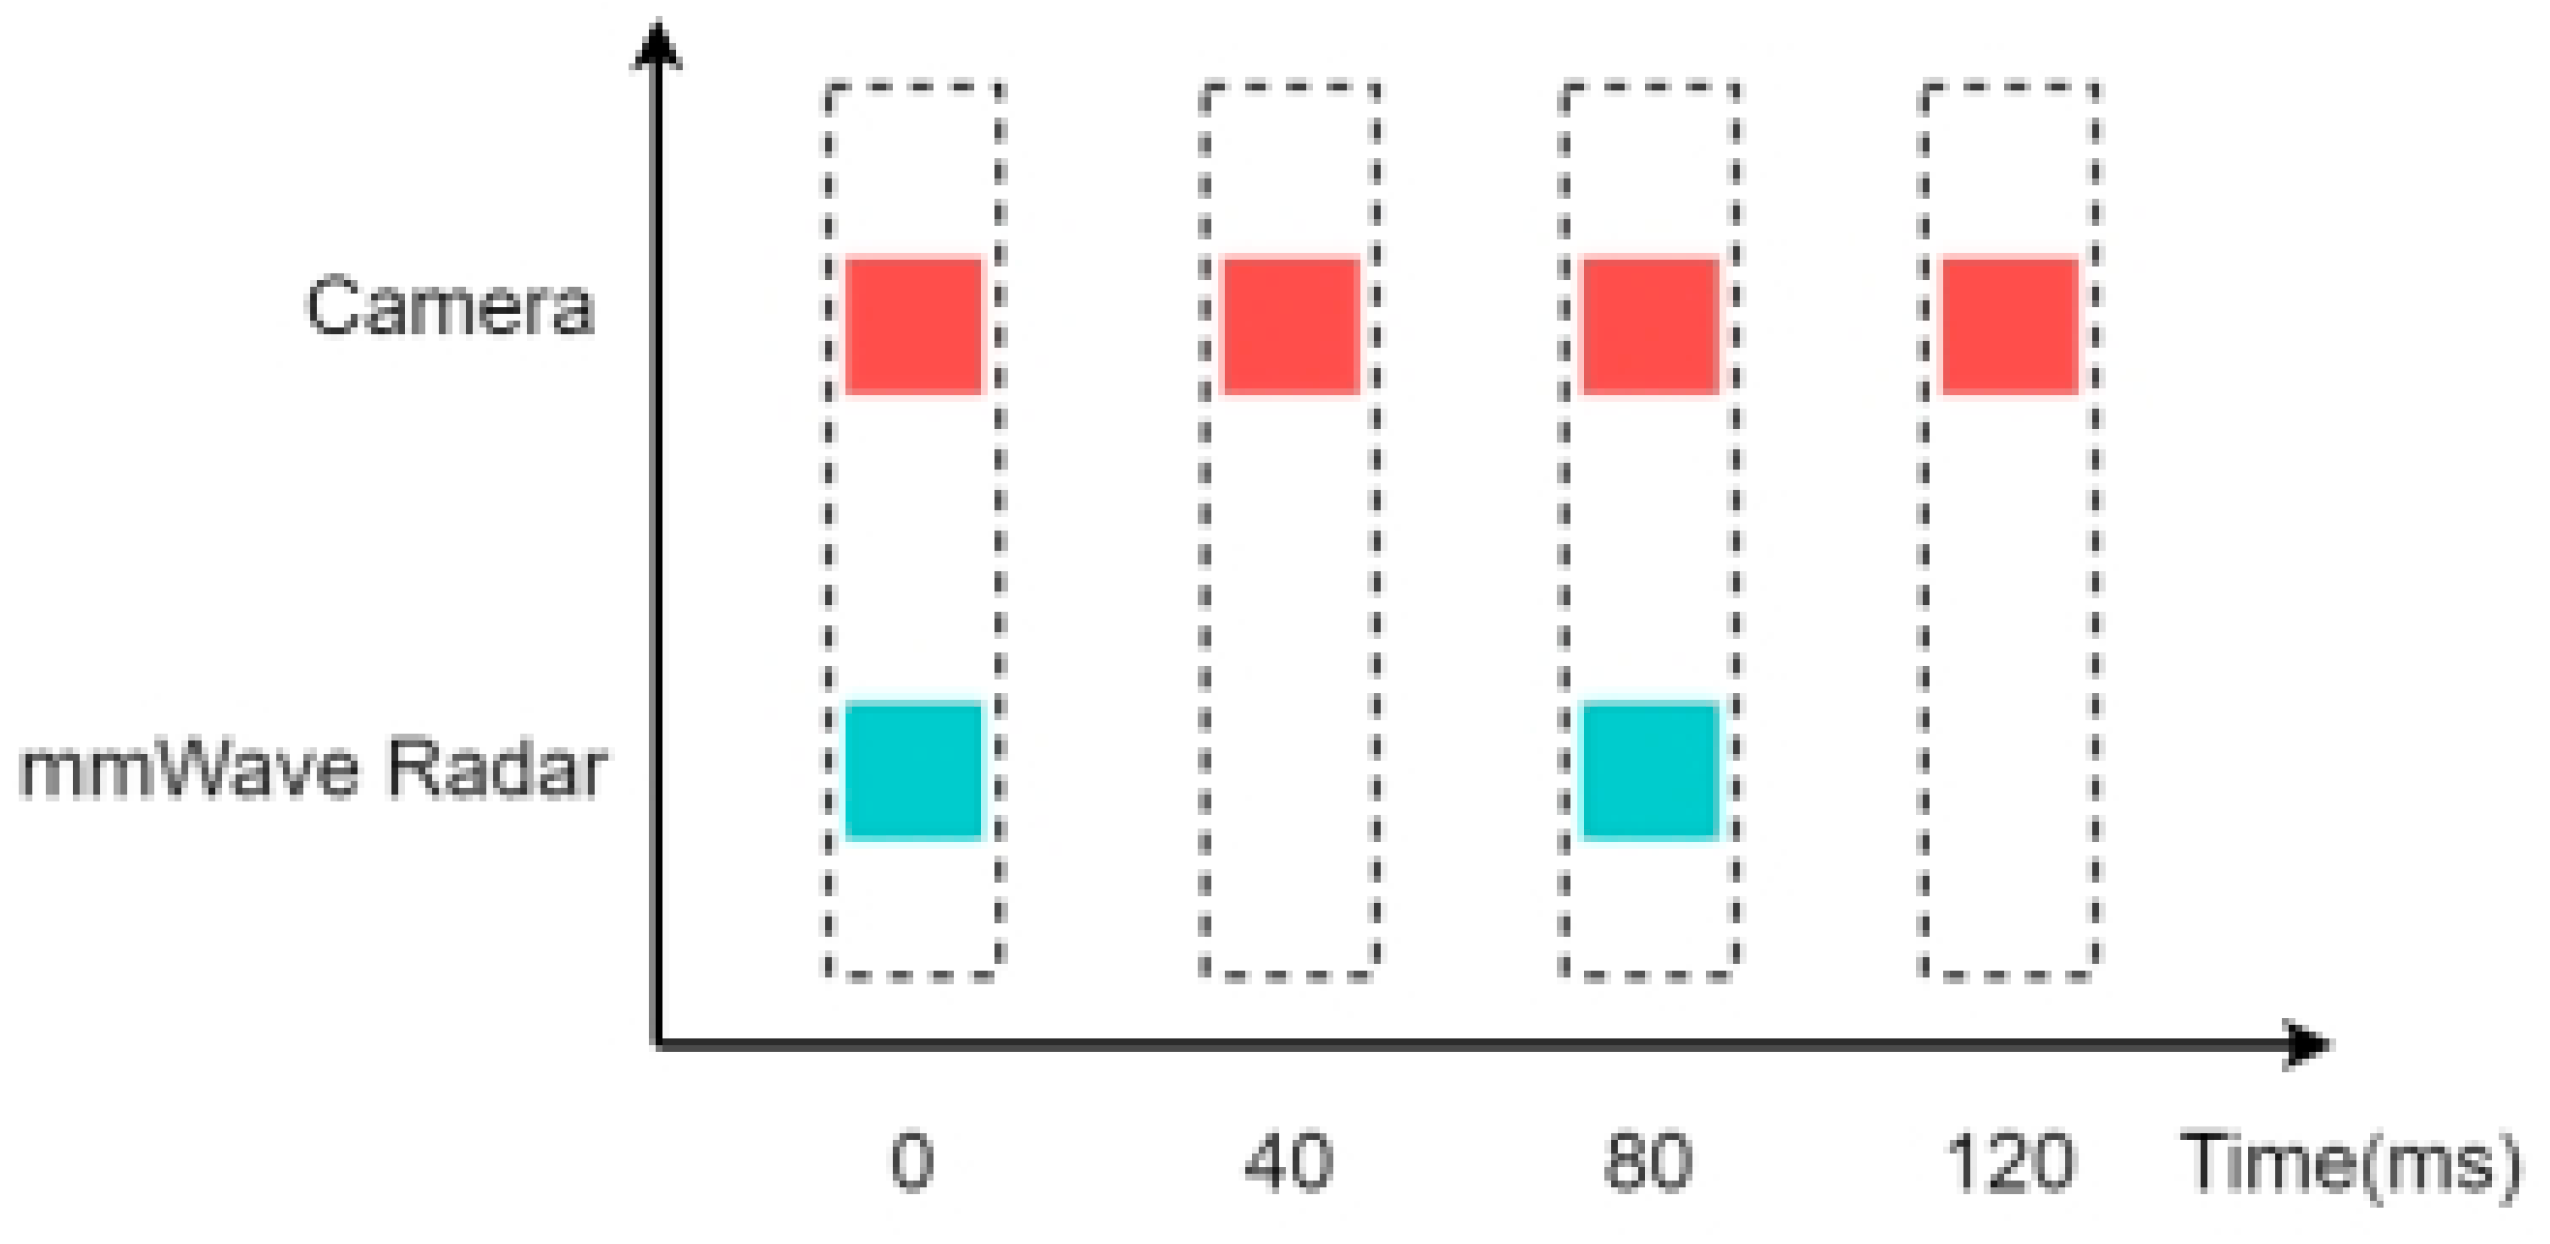
4.1. Temporal Alignment

In multi-sensor systems, different sensors typically operate with varying sampling periods and data processing speeds, resulting in differences in update frequencies during data transmission. To ensure the effectiveness of multi-sensor information fusion, it is crucial to achieve temporal synchronization before fusion. If the time sequences are not aligned, the fused data may become disordered, leading to inaccurate environmental perception and potentially invalid perception results. Therefore, prior to fusion, temporal synchronization between sensors is required to prevent data inconsistency caused by temporal discrepancies.
In this study, the WPR-9410 mm-wave radar has a sampling period of 80 ms, while the camera operates at a sampling period of 40 ms. Considering the frame intervals of both the millimeter-wave radar and the camera, the fusion sampling interval is set to 80 ms to ensure temporal consistency between the radar and camera data at each sampling instance. The sampling timelines of both sensors are illustrated in Figure 5.

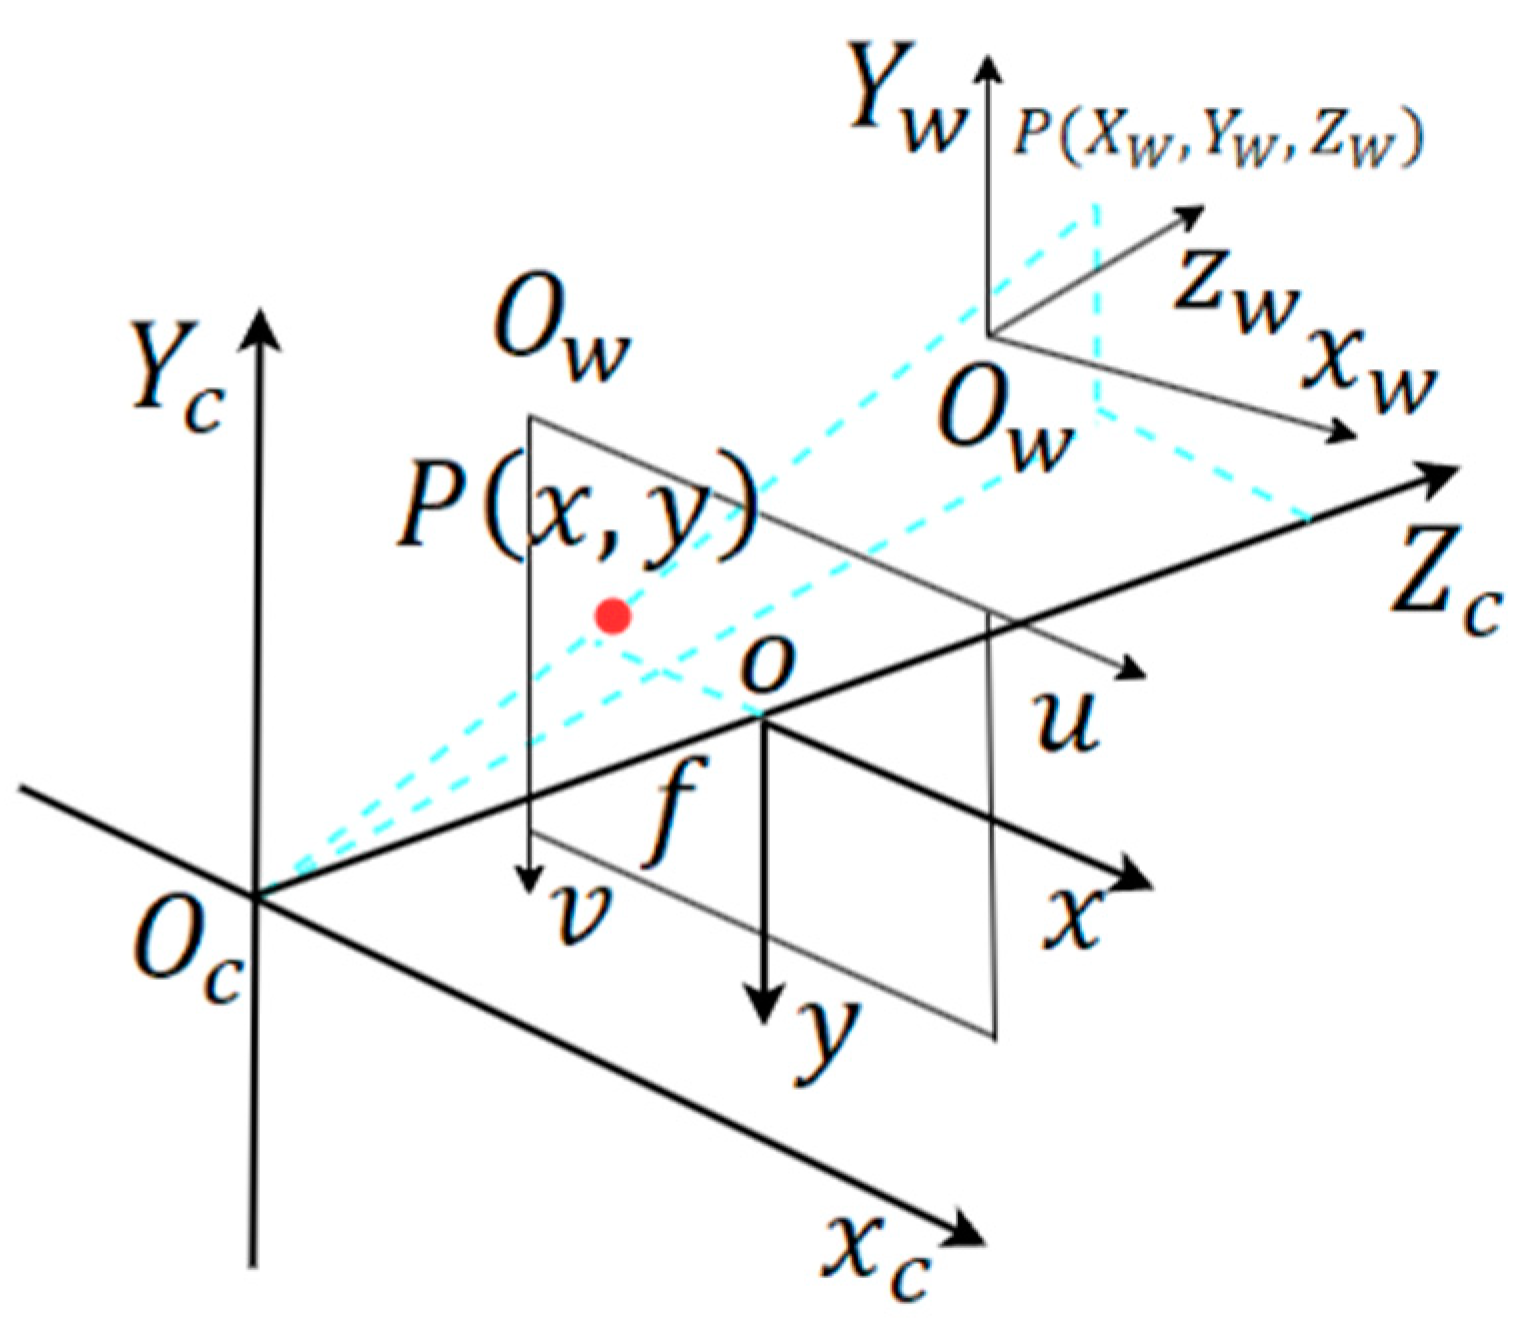
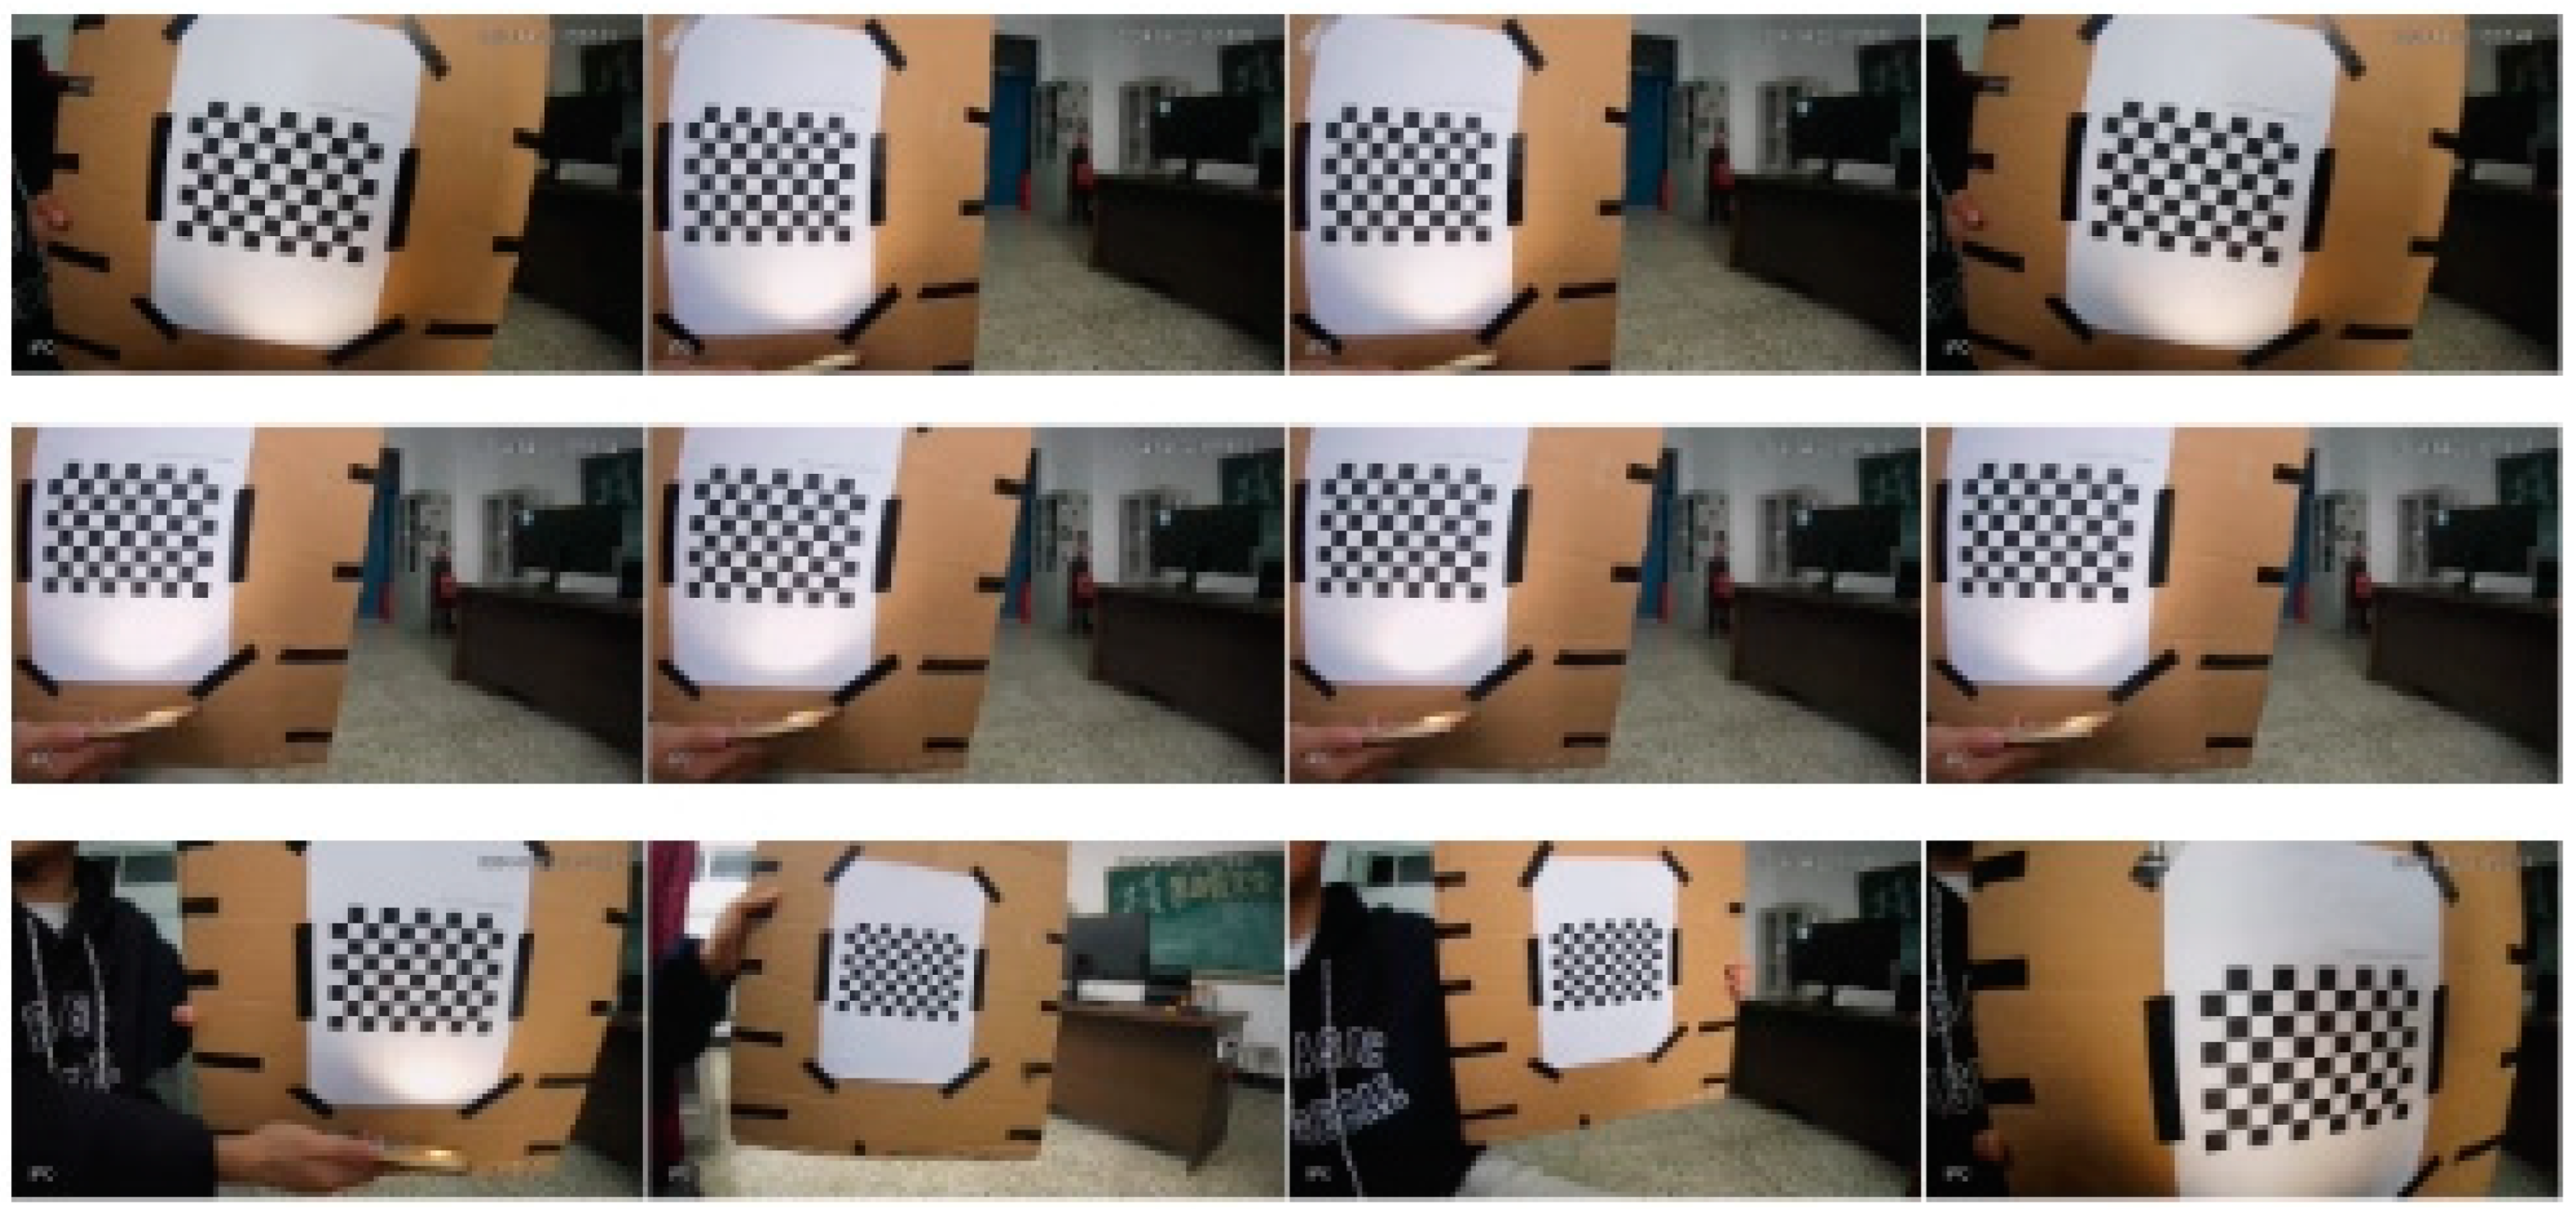
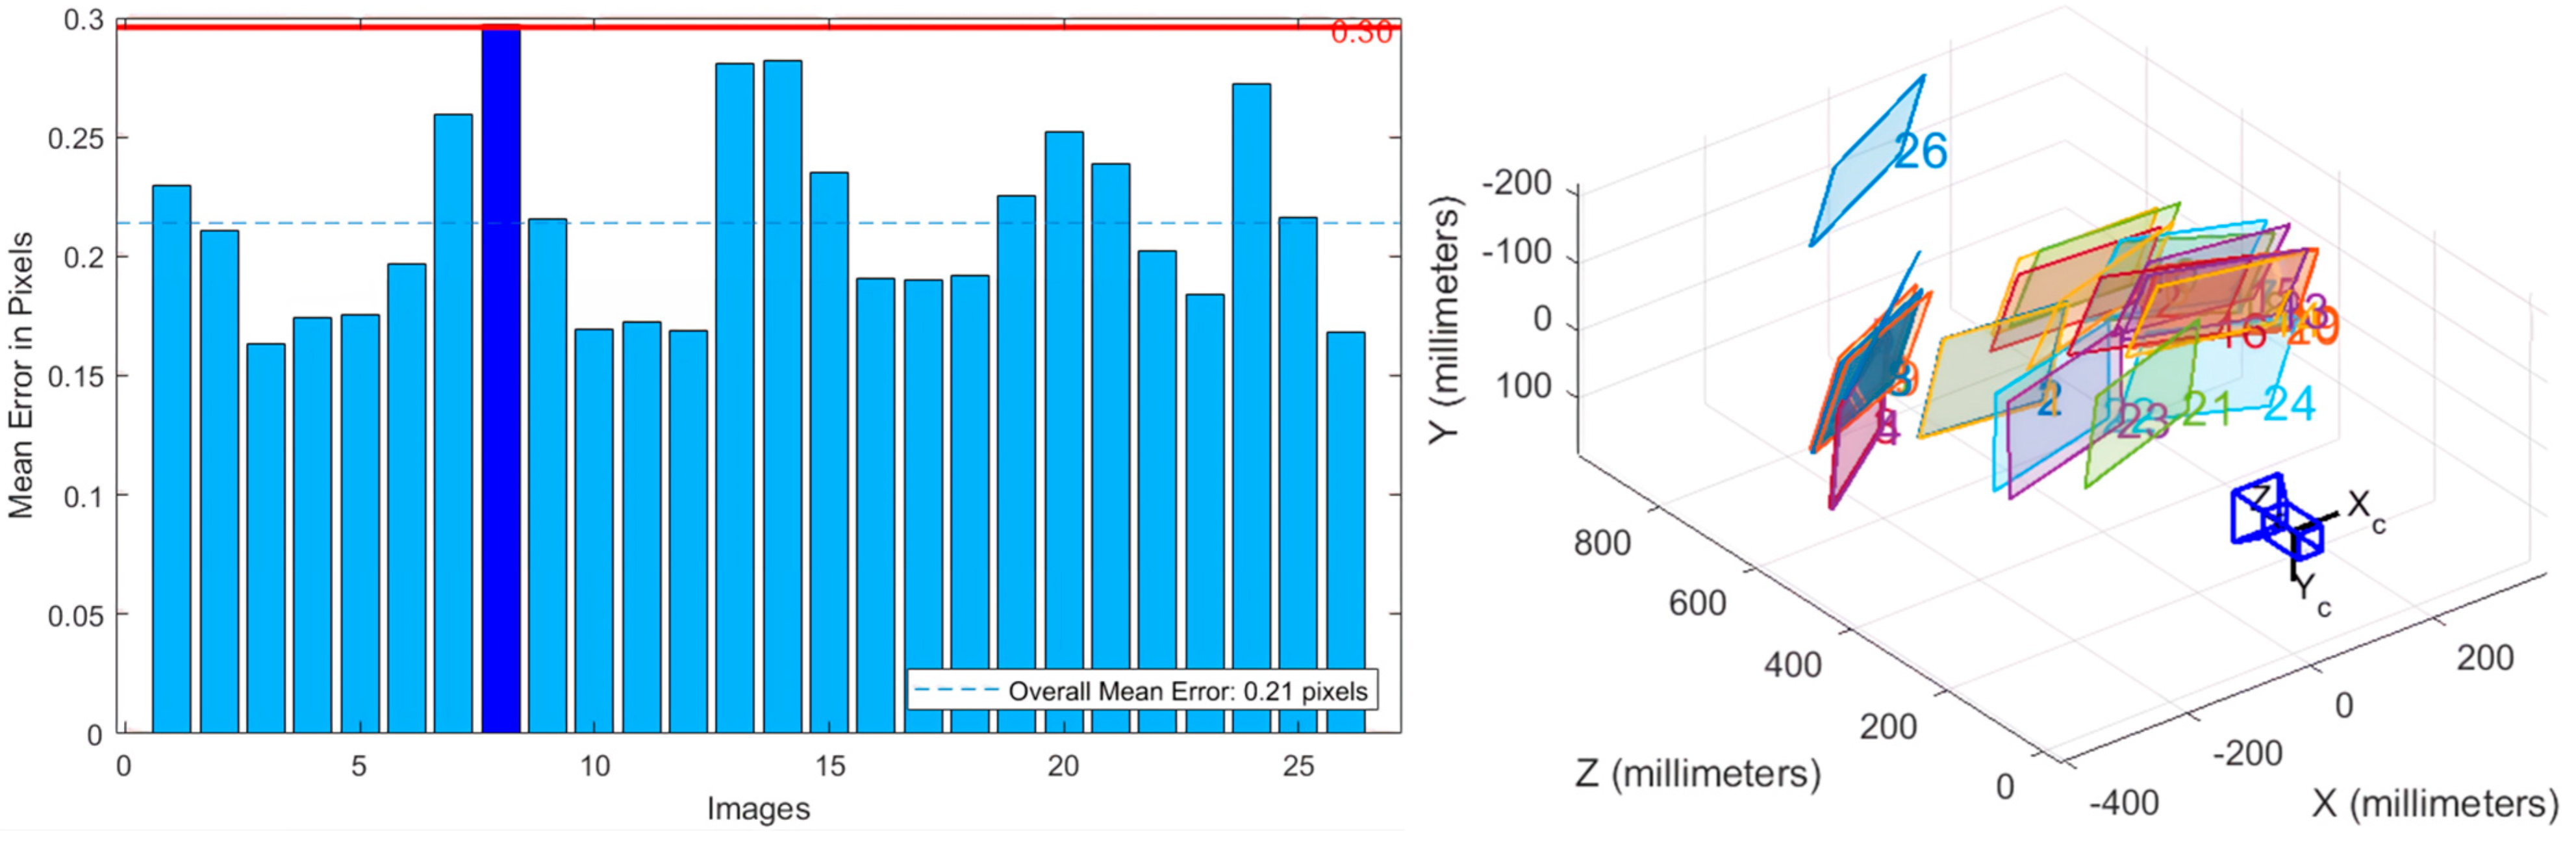
4.2. Spatio Calibration

Figure 6 illustrates the coordinate transformation relationships within the radar–camera fusion system. The diagram depicts three key coordinate frames and their transformations: the world coordinate system (WCS) with origin O W and axes X W ,   Y W ,   Z W , the camera coordinate system (CCS) with origin O C and axes X C ,   Y C ,   Z C , and the Image Plane Coordinate System (IPS) with origin O, containing u, v axes, where f represents the focal length. A target point P( X W ,   Y W ,   Z W ) in the world coordinate system is first projected into the camera coordinate system as P(x, y) (marked as a red dot in Figure 6) and is ultimately projected onto the image plane. The blue dashed line represents the projection ray from the 3D world point through the camera center to the image plane. This transformation process involves an Extrinsic Matrix, which defines the rotation and translation between the world coordinate system and the camera coordinate system, and an Intrinsic Matrix, which describes the projection relationship from the camera coordinate system to the image plane. By utilizing this calibration method, the system accurately maps radar-detected point cloud data onto the camera image plane, ensuring the precise alignment and fusion of the two sensor modalities and providing a foundation for subsequent target recognition and tracking.
The relationship between the world coordinate system and the image pixel coordinate system can be expressed as follows:
Z c u v 1 = 1 d x 0 u 0 0 1 d y v 0 0 0 1 f 0 0 0 0 f 0 0 0 0 1 0 R T O T 1 x w y w z w 1 = f x 0 u 0 0 0 f y v 0 0 0 0 1 0 R T 0 1 x w y w z w 1
In the formula, ( u ,   v ) represents the coordinates in the pixel coordinate system, while Z c denotes the depth value in the camera coordinate system, which is the Z -axis distance from the point to the camera’s optical center. The terms 1 / d x and 1 / d y are pixel scaling factors, and ( u 0 ,       v 0 ) represent the principal point coordinates, all of which are intrinsic camera parameters obtained through calibration. The focal length ( f ) is also determined via camera calibration. The transformation from the world coordinate system to the camera coordinate system is described by the extrinsic camera matrix, which consists of a 3 × 3 rotation matrix ( R ) and a 3 × 1 translation vector ( T ). The rightmost term [ X ,   Y ,   Z , 1 ] represents the homogeneous coordinates of a point in the world coordinate system. This formula describes the process of projecting a 3D point from the world coordinate system onto the camera’s pixel plane.
To achieve spatial coordinate transformation between the millimeter-wave radar and the camera, the camera must first be calibrated to obtain its intrinsic parameters. The core principle of camera calibration is to establish a mapping relationship between the real-world 3D scene and the camera’s pixel coordinates based on the camera imaging model. A common calibration approach involves using a calibration board of known dimensions, capturing multiple images from different angles and positions, and applying calibration algorithms to compute the camera parameters. This process accurately reconstructs the camera’s imaging characteristics, forming the basis for subsequent multi-sensor fusion. The camera calibration diagram is shown in Figure 7.
The camera calibration in this study was conducted using the camera calibration module in MATLAB R2024a, as illustrated in Figure 8, which ultimately yields the intrinsic parameters of the camera.

4.3. Millimeter-Wave Radar Data Processing

Through temporal and spatial calibration between the camera and millimeter-wave radar, we successfully aligned their coordinate systems, providing a solid foundation for multimodal data fusion. After calibration, the millimeter-wave radar point cloud (represented as red dots) precisely aligns with vehicle positions in the camera images, as illustrated in Figure 9, validating the accuracy of the calibration process. Furthermore, by applying point cloud processing algorithms, the radar effectively extracts key information such as position, velocity, and the orientation of vehicles. This information not only enhances detection accuracy but also provides reliable data support for subsequent perception and decision-making modules.
Radar point clouds are often chaotic and noisy, which increases computational complexity and reduces detection reliability in target tracking. In radar–vision fusion systems, lightweight radar data preprocessing is essential for optimal performance. To address this, we utilized DBSCAN (Density-Based Spatial Clustering of Applications with Noise) to cluster point cloud data, effectively reducing noise and consolidating multiple reflection points into single target representations.
The algorithm is governed by two key parameters: radius (Eps) and minimum points (MinPts). Points that have at least MinPts neighbors within the radius Eps are classified as core points, while points adjacent to core points are categorized as border points. Points that fail to meet either condition are considered noise. In Figure 10, each color represents a distinct cluster, with different classifications visually distinguished using different colors. This clustering approach preserves target integrity, enhances algorithm efficiency, and reduces computational load, all while maintaining high detection accuracy, particularly in complex traffic environments. Overall, DBSCAN significantly improves radar data quality, establishing a robust foundation for radar–vision fusion.
In millimeter-wave radar point cloud processing, the determination of DBSCAN parameters must comprehensively consider radar performance, target dimensions, and scene characteristics. First, based on a radar’s range resolution (typically 0.5 m) and target size (e.g., vehicle width of approximately 2 m), and considering that a vehicle target in the point cloud typically consists of four to ten reflection points, the reasonable range for MinPts should be between five and eight to avoid missing small targets or misclassifying noise points. The Eps parameter is selected by identifying the inflection point in the distance distribution and fine-tuning it through experimental validation. Based on experimental results in typical road scenarios, this study selected Eps = 1.2 m and MinPts = 6, which is a parameter combination that ensures accurate target separation while effectively controlling noise points, making it suitable for most road detection environments.
As shown in Formula (3), each detected point cloud is assigned an initial confidence value w 0 , which is dynamically adjusted based on its persistence across consecutive frames. If a point cloud is detected in one frame but no corresponding vehicle is identified by YOLO, the system does not immediately classify it as a false positive. Instead, its behavior is monitored over a time window of n frames. If the point cloud persists but remains unverified by a YOLO bounding box, its confidence decays exponentially with factor α, approaching zero by the n _th frame, at which point the system classifies it as noise and filters it out. Conversely, if the point cloud is consistently validated by YOLO, its confidence gradually increases toward one, indicating a highly reliable target.
w t = w 0 × α n
In this study, we set w 0 = 0.5, α = 0.5, and n = 5. This progressive evaluation strategy effectively distinguishes temporary detection errors from persistent false positives while adapting to sensor performance fluctuations across different scenarios, significantly enhancing the robustness and accuracy of the fusion system.
When a millimeter-wave radar point cloud falls within a YOLO bounding box, we consider them aligned. However, due to road surface irregularities or other disturbances, point clouds may deviate from the YOLO bounding box position. To mitigate this misalignment, we introduced a correction method based on the Iterative Closest Point (ICP) algorithm. This algorithm iteratively estimates the optimal rigid transformation (translation and rotation) between two sets of points to achieve optimal alignment. The transformation is determined by minimizing the following objective function:
E R , t = 1 N p i = 1 N p y i R x i + t 2
where R is the rotation matrix, t is the translation vector, x i represents points in the millimeter-wave radar point cloud, y i denotes corresponding target points (bounding box center points), and N p is the number of points used in the calculation. In practical applications, the algorithm first identifies point clouds deviating from the YOLO bounding box but still within a defined threshold (±50 cm laterally, ±1.5 m longitudinally), then computes the optimal transformation parameters to realign these points with the bounding box. The implementation involves initial point correspondence estimation, least-squares optimization to solve the transformation matrix, the application of the transformation to the point cloud, and iterative refinement until convergence. This method is particular to our scenario, as vehicle trajectories on urban arterial roads exhibit high predictability, allowing the algorithm to correct minor misalignments without over-adjusting well-aligned point clouds.

4.4. Experimental Result Verification

The experimental environment for the algorithm in this study is as follows. The image dataset is divided into training, validation, and test sets in an 8:1:1 ratio to train the lightweight model. The experimental environment and training parameter settings for the model network are shown in Table 1 and Table 2 below.

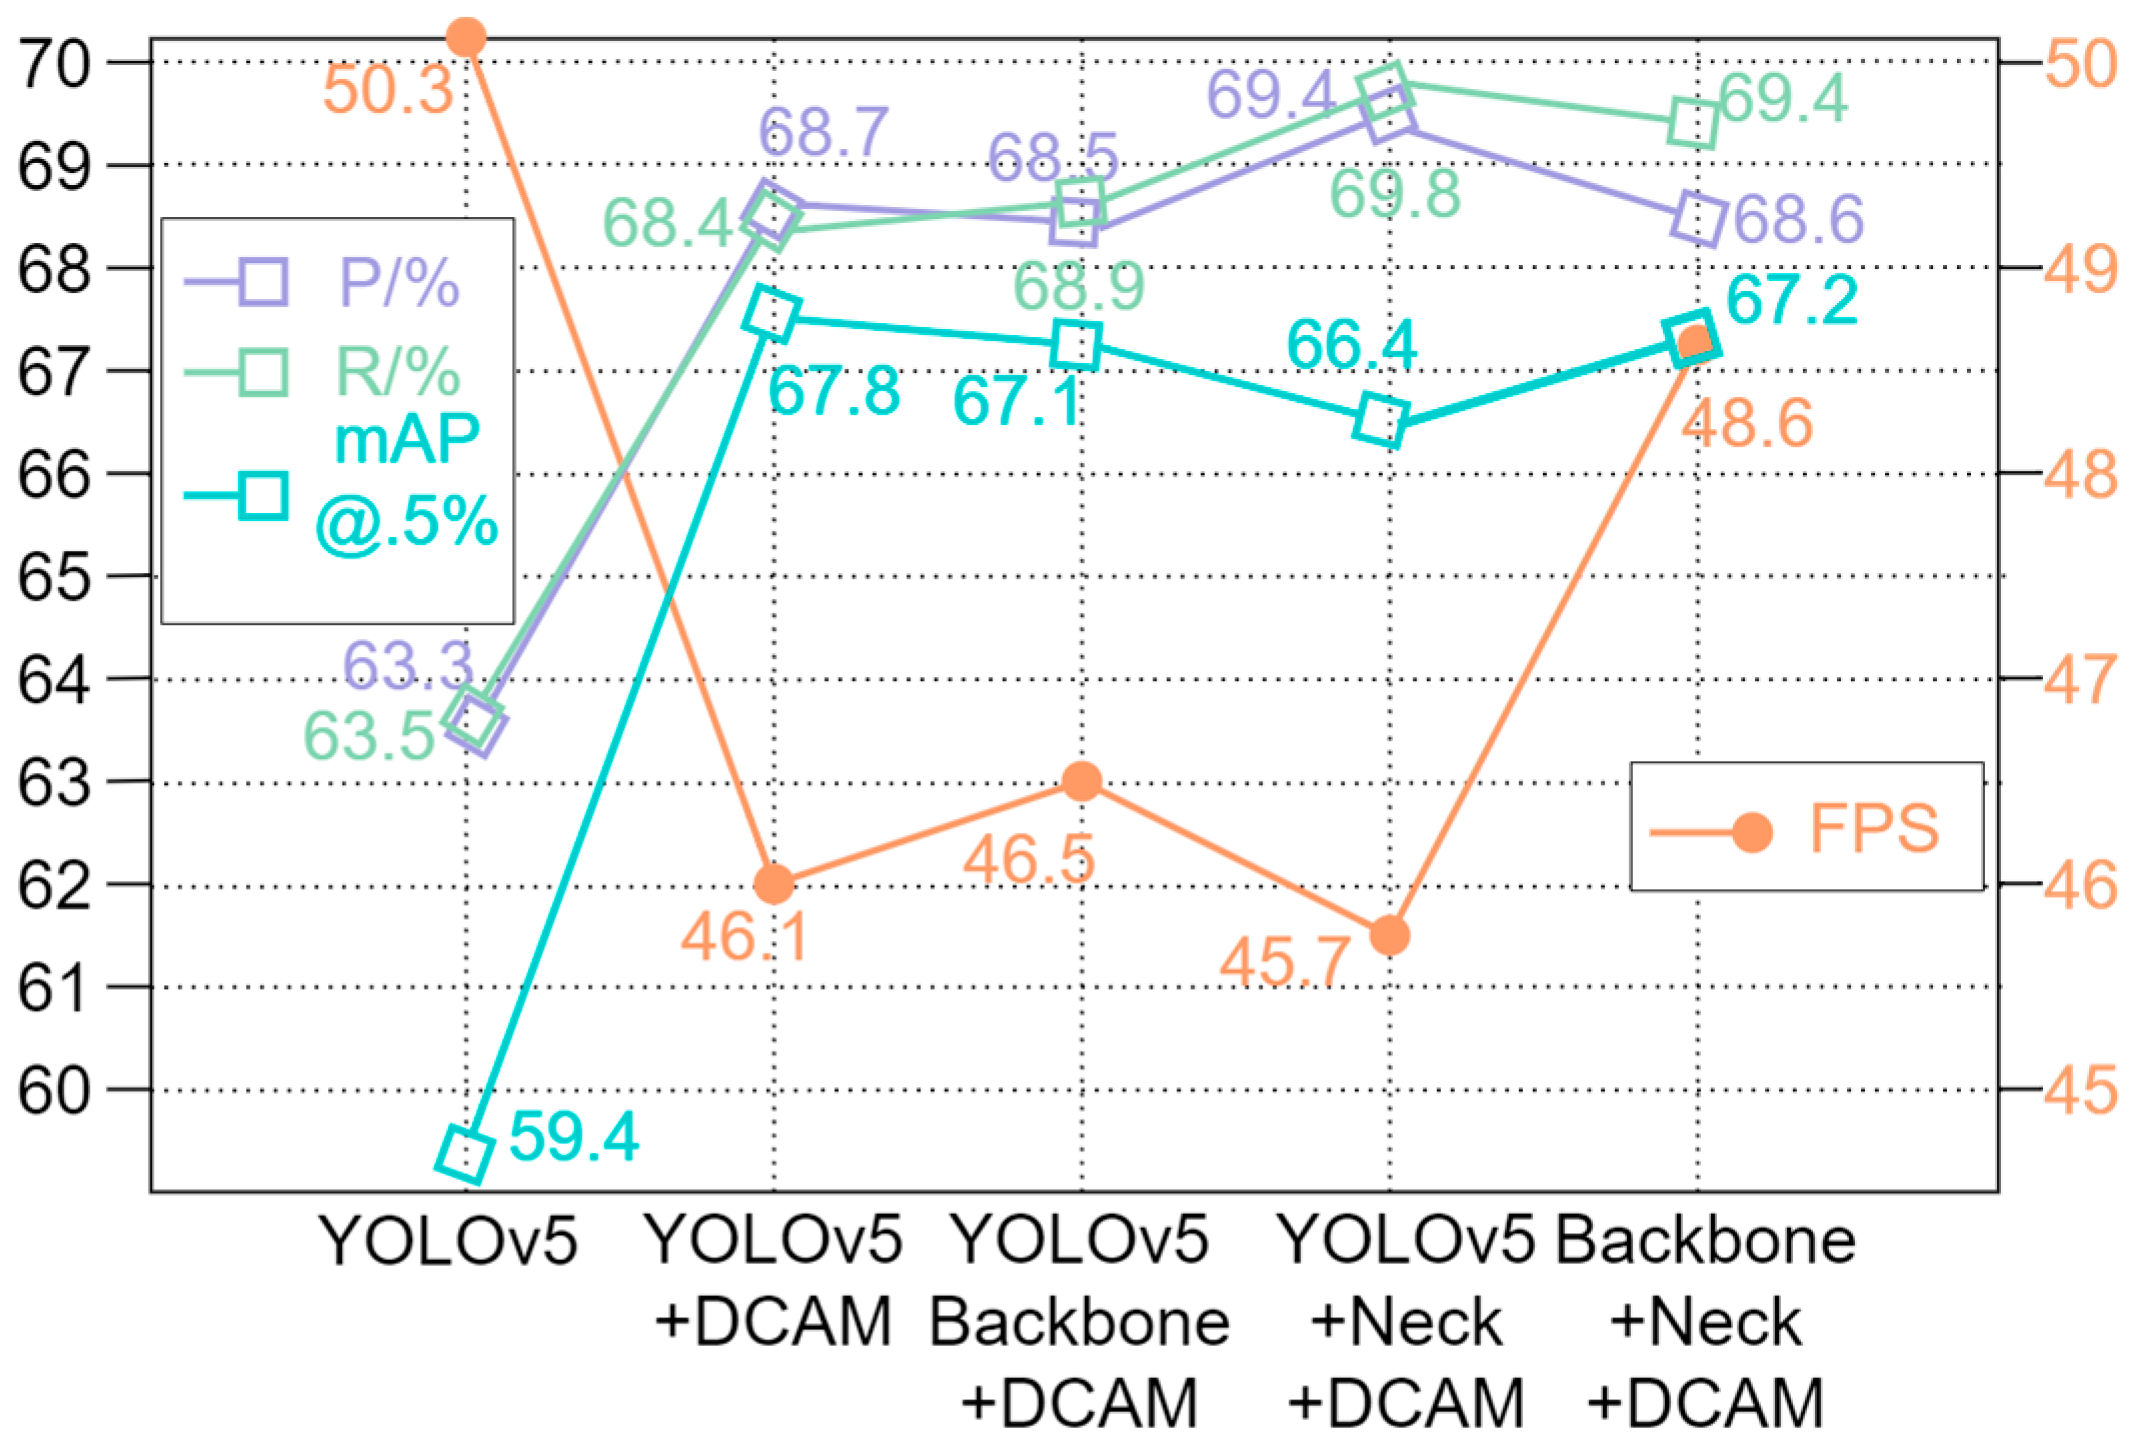
4.4.1. Ablation Experiment

To validate the effectiveness of the proposed modules and their contributions to overall network performance, this section presents ablation experiments using YOLOv5 as the baseline network to systematically introduce step-by-step improvements and evaluations. Specifically, the network is first structurally optimized by replacing the Backbone with ShuffleNetv2, achieving lightweight enhancement of the Backbone network. Next, the Ghost Module is integrated into the Neck to further reduce computational complexity by minimizing redundant feature mappings. Additionally, the Dual Cross-Attention Mechanism (DCAM) is incorporated to enhance the network’s focus on target regions, thereby improving detection accuracy.
To assess the impact of each module, we systematically removed and replaced individual components, comparing key performance metrics such as inference speed (FPS) and mAP to comprehensively evaluate the effectiveness of each module in optimizing the network. The experimental results are illustrated in Figure 11.
This section provides a detailed experimental evaluation of the improved YOLOv5 model, comparing it against both the original vision-only YOLOv5 and our proposed multimodal YOLOv5 (YOLOv5-Ours). The evaluation metrics include standard performance indicators, such as detection precision, recall rate, F1-Score, and mean average precision (mAP), as well as robustness under complex environmental conditions. The objective of these experiments is to determine whether multimodal fusion (combining visual and radar data) significantly enhances the model’s detection performance in real-world scenarios, particularly in challenging environments, including low-light conditions, adverse weather, and high-density traffic.

4.4.2. Confusion Matrix

The confusion matrix, also known as the error matrix, is a common performance evaluation tool in machine learning and is especially used for classification problems. It can intuitively display the performance of a classification model. Figure 12 shows the confusion matrix of the YOLOv5-Ours algorithm in this paper.
The confusion matrix illustrates the model’s performance in the vehicle classification task. Among all categories, the bus class demonstrates the highest accuracy, with a diagonal value of 0.81, indicating the model’s strong ability to recognize large vehicles and extract distinguishing features effectively. The car class follows with an accuracy of 0.74; however, a portion of car samples are misclassified, such as vans (0.21) and others (0.22), suggesting some degree of boundary ambiguity in medium-sized vehicle classification. The vans and other classes exhibit a relatively weaker performance, with accuracies of 0.48 and 0.39, respectively. The increased variability in vehicle shapes within these categories contributes to the challenge of feature extraction. The background class exhibited minimal confusion with other categories, except for a 0.18 misclassification with the bus class.
A particularly notable observation is the high misclassification value (0.81) between the background and car classes, which highlights the challenges in accurately identifying cars within the dataset. This phenomenon primarily stems from small distant vehicles, partial occlusions, complex background environments, and varying lighting conditions, which are common in public datasets. These factors make it difficult for the model to differentiate cars from the background, especially in scenarios where vehicle features are less prominent or when the background is highly cluttered. This issue is a well-recognized challenge in object detection, reflecting intrinsic dataset characteristics rather than simply limitations in the model’s performance.

4.4.3. Comparative Analysis of P-R Curves

The precision–recall (P-R) curve illustrates the relationship between precision and recall, where the horizontal axis represents recall, and the vertical axis represents precision. The area enclosed under the curve reflects the average precision of the algorithm during object detection. A curve closer to the upper right corner indicates superior algorithm performance.
As shown in Figure 13, the YOLOv5-Ours algorithm demonstrates higher average precision compared to the original YOLOv5, indicating improved detection accuracy.

4.4.4. F1-Score Comparative Analysis

Typically, precision and recall exhibit an inverse relationship. To provide a comprehensive evaluation that balances both metrics, the F1-Score is introduced. The F1-Score is the harmonic mean of precision and recall, serving as a holistic metric for classifier performance. A higher F1-Score signifies better model quality. As illustrated in Figure 14, the F1-Score of YOLOv5-Ours reaches 0.65, whereas the original YOLOv5 achieves an F-Score of only 0.59 within a narrower confidence range of 0.1 to 0.5. This result further verifies that YOLOv5-Ours consistently outperforms the original YOLOv5 in terms of overall detection performance.

4.4.5. Robustness of Multimodal Fusion

To assess the robustness of the improved model under various environmental conditions, particularly in challenging scenarios such as low-light conditions, occlusions, and high-density traffic, we designed highly complex test environments and conducted comparative evaluations of the model’s performance.
In low-light or nighttime conditions, the detection capability of vision-based sensors is significantly compromised, making target recognition particularly challenging in poorly illuminated environments. As shown in Figure 15, the pure vision-based YOLOv5 fails to fully detect objects, with missed detections marked by blue circle. In the figure the orange box shows the detected vehicles, the cyan box show the false detection. In contrast, YOLOv5-Ours effectively leverages millimeter-wave radar mask information to provide accurate spatial localization of targets, compensating for the deficiencies of visual data. The experimental results confirm that YOLOv5-Ours achieves notable improvements in the detection precision and recall rate in nighttime scenarios compared to pure vision-based YOLOv5, demonstrating that millimeter-wave radar integration significantly enhances model robustness in low-light environments.
In high-density traffic conditions, pure vision-based YOLOv5 often struggles to detect overlapping or closely spaced targets, especially when multiple vehicles are in proximity or partially occluded. As illustrated in Figure 16, the missed detections from the original YOLOv5 are highlighted with blue circle, indicating instances where targets remain undetected due to excessive overlap with other vehicles. The red box is for cars, and the green box is for trucks. In contrast, YOLOv5-Ours integrates millimeter-wave radar data, allowing it to more accurately identify occluded or densely packed targets through the assistance of radar-generated masks. The experimental results confirm that YOLOv5-Ours enhances detection precision, which is a marked improvement in performance under high-density traffic conditions.
In complex occlusion scenarios, vision-based sensors often struggle to accurately identify targets obstructed by other objects, such as vehicles in front. This issue is particularly evident when the degree of occlusion is high. The traditional YOLOv5 model, which relies solely on visual information, suffers from significant performance degradation under severe occlusion conditions.
For example, in Figure 17, when a truck blocks over 90% of a sedan behind it, the pure vision-based YOLOv5 fails to detect the occluded sedan, with the missed detection area marked by a blue circle. The red box is for cars, and the yellow box is for trucks In contrast, YOLOv5-Ours incorporates millimeter-wave radar mask information, providing precise spatial localization data for the target, thereby compensating for the limitations of vision-based detection. As a result, YOLOv5-Ours successfully identifies the occluded sedan, demonstrating that millimeter-wave radar data significantly improve detection performance in complex occlusion environments.
To mitigate potential detection errors in millimeter-wave radar, this study designs a hierarchical processing strategy to ensure the reliability of the detection system. When discrepancies occur between the radar point cloud and the actual vehicle position, the system classifies them into two scenarios for targeted handling:
  • Small deviations (where the point cloud offset remains within the same lane as the vehicle) are corrected using the data association and error-handling algorithm detailed in Section 4.3, effectively eliminating such common errors.
  • Large deviations (where the point cloud differs from the actual vehicle position by one or more lane widths), as illustrated in Figure 18, are handled through the inherent robustness of the fusion framework.
The adopted fusion strategy follows a vision-centric mid-level fusion approach, where the millimeter-wave radar serves as an auxiliary sensor by generating a mask map that provides “attention cues” for YOLOv5, guiding it to focus on relevant regions. However, the final detection result remains determined by the vision model. As shown in the mask map, despite a significant mismatch between the first vehicle’s radar point cloud and its actual position in the image, the detection remains unaffected.
Thus, even in the presence of major localization errors from radar, the system can still rely on vision-based detection to maintain functionality, preventing system failures caused by reliance on a single sensor. It is worth noting that during real-world testing, the probability of major radar errors is extremely low (<1%), as these errors are largely constrained by the intrinsic performance limitations of the radar hardware and have minimal impact on overall detection performance. In contrast, small deviations are more common, making them the primary focus of our correction mechanism, ensuring high accuracy under normal operating conditions.

5. Lightweight and Embedded Deployment

5.1. Lightweight YOLOv5 Fusion Algorithm

To achieve road perception tasks on edge devices, we propose a lightweight detection model, the network structure of which is illustrated in Figure 19.
To avoid network fragmentation and reduce redundant computations caused by network branches, following the recommendations in the ShuffleNetv2 paper, we discarded the original CBS modules and CSP1_X modules in YOLOv5. Instead, we adopted the S-(1) module from the ShuffleNetv2 basic unit (shown in Figure 20) to replace the CBS modules and the S-(2) module to replace the CSP1_X modules, thereby reconstructing the Backbone network. In the diagram above, the S-(1) module is used to extract features from the input feature map while maintaining the same feature map size. The S-(2) module is a downsampling module that halves the spatial size of the feature map and doubles the number of channels. In the Neck network, the FPN and PAN structures are retained, but the original CBS modules are replaced with the Ghost Module and a custom-designed GhostBottleneck, while the CSP2_X modules are replaced with the S-(1) module. By substituting the original modules with lightweight ones, we eliminated many redundant branches, reducing the network’s parameter count and computational load.
In Table 3, the results show that we improved the Backbone network structure by sequentially stacking network modules from small to large indices. This design enhances the compatibility of intermediate-level features. To strengthen the extraction of intermediate-layer features, we set the repetition count of the S-(1) module to three for modules with indices of four and six in the Backbone network. This approach effectively ensures the network’s depth while significantly reducing the number of parameters and improving the network’s training speed.
In parameter configuration, three parameters are typically used to define a convolution operation: the first parameter represents the number of input channels, the second parameter represents the number of output channels, and the third parameter represents the stride of the convolution kernel. However, the parameter configuration for the SPPF module is slightly different. While the first and second parameters still denote the input and output channels, the third parameter represents the size of the pooling kernel, usually 5 × 5. The SPPF module differs from the SPP module in that it processes the input sequentially through 5 × 5 max-pooling layers and then concatenates the input with the pooled outputs to improve runtime efficiency and reduce computational load.
As shown in Table 4, after model lightweighting, the number of parameters was reduced from 8.40 M to 2.52 M, with only a 0.6% decrease in detection accuracy, which still meets the detection requirements.

5.2. Embedded Deployment and Acceleration

The primary objective of research on object detection algorithms is to enable computer vision systems to automatically identify and localize objects in images or videos, thereby leveraging advanced technology to enhance productivity and improve quality of life. While traditional PC and server hardware offer powerful computational capabilities, making them well-suited for model training and inference, their deployment in real-world applications presents significant challenges due to high computational demands and substantial energy consumption. This issue is particularly critical for object detection tasks, where portability and real-time responsiveness are essential.
In recent years, embedded devices have undergone continuous advancements in computational power alongside the evolution of deep learning technologies, making the deployment of deep learning algorithms on resource-constrained embedded platforms increasingly feasible. In this context, exploring efficient, high-performance deployment strategies for object detection algorithms in complex environments not only holds great engineering significance but also contributes to the broader advancement of the field. This research is structured into three core sections, as illustrated in Figure 20.
In this study, the RDK X3 platform, equipped with 5 TOPS computing power, was selected as the deployment platform based on a comprehensive evaluation of application requirements, cost-effectiveness, and performance trade-offs. A comparative analysis of mainstream development boards currently available on the market is presented in Table 5. The results demonstrate that in terms of both computing power and cost, RDK X3 is the most suitable choice for this research.
Empirical testing confirms that after network pruning and TensorRT acceleration, the millimeter-wave radar and vision fusion detection system achieves a 15 FPS real-time processing performance on the RDK x3, fully meeting the latency requirements of roadside perception applications.
The deployment on the RDK x3 embedded platform workflow is shown in Figure 21. The red arrow represents the deployment process, and the black arrow represents the verification process.
The roadside vehicle detection system designed in this study adopts a multimodal sensor fusion architecture based on the RDK X3 embedded platform, integrating camera and millimeter-wave radar to achieve more precise target detection. The hardware structure is illustrated in Figure 22.
The system first acquires image data from the camera and radar echo signals from the millimeter-wave radar. The collected data undergo preprocessing and feature extraction using an improved algorithm, after which the fused data are stored in the BIN file deployment zone. To enhance computational efficiency, the system incorporates the C++ inference acceleration module, significantly improving the real-time performance and accuracy of object detection. Finally, the detection results are visually presented through an output display module. This multimodal, heterogeneous fusion architecture not only overcomes the limitations of conventional single-sensor approaches but also offers a highly efficient and reliable solution for vehicle detection in complex road environments.
After the final experiment, we successfully transferred the camera and millimeter-wave radar data to our improved algorithm and deployed them in RDKx3, as shown in Figure 23.

6. Conclusions

This paper proposes a vehicle road detection system based on the fusion of millimeter-wave radar and visual information, offering an effective solution to the limitations of monocular vision detection in complex environments. Innovatively, it transforms millimeter-wave radar point cloud data into a mask map, shifting from global assistance to local guidance and precisely identifying vehicle target regions in RGB images. A Dual Cross-Attention Module (DCAM) was designed to dynamically fuse visual and radar features, enabling the model to intelligently adjust its reliance on each based on varying scenarios To meet embedded deployment needs, this study reconfigured YOLOv5 into a lightweight model using ShuffleNetv2 and Ghost Modules, combined with pruning techniques, significantly reducing the parameter count and computational complexity. The experimental results demonstrate the system’s superior detection performance across diverse, complex conditions, particularly excelling in scenarios like low light and occlusion, where traditional vision-based detection struggles. Additionally, through the ONNX format conversion and C++ acceleration, the system achieved real-time, efficient operation on embedded platforms, providing a precise and reliable solution for intelligent transportation and roadside perception. Future research could further explore multi-sensor fusion strategies to enhance system robustness under extreme weather conditions.
Despite the effectiveness of our proposed fusion model, certain limitations remain. The sparse nature of millimeter-wave radar point clouds may impact object boundary precision, and minor information loss could occur during mask map transformation. Future work will focus on exploring advanced multi-modal fusion strategies, optimizing detection for small objects, and enhancing model efficiency through quantization techniques to further improve real-time performance on embedded platforms.

Author Contributions

Conceptualization, X.Y., T.H. and H.Z.; methodology, X.Y., T.H. and H.Z.; software T.H., writing—review and editing X.Y., T.H. and H.Z. All authors have read and agreed to the published version of the manuscript.

Funding

This work was funded by the Key Field Special Project of Guangdong Provincial Department of Education (2023ZDZX3044), the Key Research and Development Plan Project of Heilongjiang (JD2023SJ19), the Natural Science Foundation of Heilongjiang Province (LH2023F034), and the Science and Technology Project of Heilongjiang Provincial Department of Transportation (HJK2024B002).

Data Availability Statement

The data supporting the findings of this study are not publicly available due to commercial confidentiality restrictions. These data were obtained from a study testing project and are subject to privacy and ethical constraints imposed by the data provider.

Conflicts of Interest

The authors declare no conflicts of interest.

References

  1. Chun, B.T.; Lee, S.H. A Study on Intelligent Traffic System Related with Smart City. Int. J. Smart Home 2015, 9, 223–230. [Google Scholar] [CrossRef]
  2. Zhang, C. Application of Artificial Intelligence in Urban Intelligent Traffic Management System. In Proceedings of the 3rd International Conference on Computer Information and Big Data Applications (CIBDA), Wuhan, China, 15–17 April 2022; pp. 1–5. [Google Scholar]
  3. Wang, J.; Fu, T.; Xue, J.; Li, C.; Song, H.; Xu, W.; Shangguan, Q. Realtime Wide-Area Vehicle Trajectory Tracking Using Millimeter-Wave Radar Sensors and the Open TJRD TS Dataset. Int. J. Transp. Sci. Technol. 2023, 12, 273–290. [Google Scholar] [CrossRef]
  4. Zhou, T.; Zhang, X.; Kang, B.; Chen, M. Multimodal Fusion Recognition for Digital Twin. Digit. Commun. Netw. 2024, 10, 337–346. [Google Scholar] [CrossRef]
  5. Su, H.; Gao, H.; Wang, X; Fang, X; Liu, Q; Huang, G.-B. Object Detection in Adverse Weather for Autonomous Vehicles Based on Sensor Fusion and Incremental Learning. In IEEE Transactions on Instrumentation and Measurement. In IEEE Transactions on Instrumentation and Measurement; IEEE: New York, NY, USA, 2024; Volume 73, pp. 1–10. [Google Scholar] [CrossRef]
  6. Ates, G.C.; Mohan, P.; Celik, E. Dual Cross-Attention for Medical Image Segmentation. Eng. Appl. Artif. Intell. 2023, 126, 107139. [Google Scholar] [CrossRef]
  7. He, K.; Zhang, X.; Ren, S.; Sun, J. Spatial Pyramid Pooling in Deep Convolutional Networks for Visual Recognition. IEEE Trans. Pattern Anal. Mach. Intell. 2015, 37, 1904–1916. [Google Scholar] [CrossRef] [PubMed]
  8. Girshick, R.; Donahue, J.; Darrell, T.; Malik, J. Rich Feature Hierarchies for Accurate Object Detection and Semantic Segmentation. In Proceedings of the 2014 IEEE Conference on Computer Vision and Pattern Recognition, Columbus, OH, USA, 23–28 June 2014; pp. 580–587. [Google Scholar] [CrossRef]
  9. Girshick, R. Fast R-CNN. In Proceedings of the 2015 IEEE International Conference on Computer Vision (ICCV), Santiago, Chile, 7–13 December 2015; pp. 1440–1448. [Google Scholar] [CrossRef]
  10. Ren, S.; He, K.; Girshick, R.; Sun, J. Faster R-CNN: Towards Real-Time Object Detection with Region Proposal Networks. IEEE Trans. Pattern Anal. Mach. Intell. 2017, 39, 1137–1149. [Google Scholar] [CrossRef] [PubMed]
  11. Liu, W.; Anguelov, D.; Erhan, D.; Szegedy, C.; Reed, S.; Fu, C.Y.; Berg, A.C. SSD: Single Shot Multibox Detector. In Proceedings of the European Conference on Computer Vision (ECCV), Amsterdam, The Netherlands, 8–16 October 2016; Springer: Cham, Switzerland, 2016; pp. 21–37. [Google Scholar] [CrossRef]
  12. Zhao, L.; Wang, X.; Zhang, Y.; Zhang, Y. Research on Vehicle Object Detection Technology Based on YOLOv5s Fused with SENet. J. Graph. 2022, 43, 776–782. [Google Scholar]
  13. Redmon, J.; Divvala, S.; Girshick, R.; Farhadi, A. You Only Look Once: Unified, Real-Time Object Detection. In Proceedings of the 2016 IEEE Conference on Computer Vision and Pattern Recognition (CVPR), Las Vegas, NV, USA, 27–30 June 2016; pp. 779–788. [Google Scholar] [CrossRef]
  14. Ghosh, R. On-Road Vehicle Detection in Varying Weather Conditions Using Faster R-CNN with Several Region Proposal Networks. Multimed. Tools Appl. 2021, 80, 25985–25999. [Google Scholar] [CrossRef]
  15. Ma, Y.; Chai, L.; Jin, L.; Yu, Y.; Yan, J. AVS-YOLO: Object Detection in Aerial Visual Scene. Int. J. Pattern Recognit. Artif. Intell. 2022, 36, 2250004. [Google Scholar] [CrossRef]
  16. Heijne, R. Comparing Detection Algorithms for Short Range Radar: Based on the Use-Case of the Cobotic-65. Master’s Thesis, Delft University of Technology, Delft, The Netherlands, 2022. [Google Scholar]
  17. Deng, T.; Liu, X.; Wang, L. Occluded Vehicle Detection via Multi-Scale Hybrid Attention Mechanism in the Road Scene. Electronics 2022, 11, 2709. [Google Scholar] [CrossRef]
  18. Diskin, T.; Beer, Y.; Okun, U.; Wiesel, A. CFARnet: Deep Learning for Target Detection with Constant False Alarm Rate. Signal Process. 2024, 223, 109543. [Google Scholar] [CrossRef]
  19. Zhao, H.; Yang, J. An Optimized Poisson Multi-Bernoulli Multi-Target Tracking Algorithm. In Proceedings of the 2024 9th International Conference on Intelligent Computing and Signal Processing (ICSP), Xi’an, China, 19–21 April 2024; pp. 46–50. [Google Scholar] [CrossRef]
  20. Cheng, L.; Cao, S. TransRAD: Retentive Vision Transformer for Enhanced Radar Object Detection. IEEE Trans. Radar Syst. 2025, 3, 303–317. [Google Scholar] [CrossRef]
  21. Ge, Q.; Bai, X.; Zeng, P. Gaussian-Cauchy Mixture Kernel Function Based Maximum Correntropy Criterion Kalman Filter for Linear Non-Gaussian Systems. IEEE Trans. Signal Process. 2025, 73, 158–172. [Google Scholar] [CrossRef]
  22. Zhang, Y.; Gao, L; Zhao, Y; Wu, S. Static Targets Recognition and Tracking Based on Millimeter Wave Radar. In Proceedings of the 3rd International Forum on Connected Automated Vehicle Highway System through the China Highway & Transportation, Jinan, China, 29 October 2020. [Google Scholar] [CrossRef]
  23. Fang, F.-F.; Qu, L.-B. Applying Bayesian Trigram Filter Model in Spam Identification and Its Disposal. In Proceedings of the 2011 International Conference on Electric Information and Control Engineering, Wuhan, China, 15–17 April 2011; pp. 3024–3027. [Google Scholar] [CrossRef]
  24. Sasiadek, J.Z.; Hartana, P. Sensor data fusion using Kalman filter. In Proceedings of the Third International Conference on Information Fusion, Paris, France, 10-13 July 2020; Volume 2, pp. WED5/19–WED5/25. [Google Scholar] [CrossRef]
  25. Gao, J.B.; Harris, C.J. Some Remarks on Kalman Filters for the Multisensor Fusion. Inf. Fusion 2002, 3, 191–201. [Google Scholar] [CrossRef]
  26. Zhao, K.; Li, L.; Chen, Z.; Sun, R.; Yuan, G.; Li, J. A Survey: Optimization and Applications of Evidence Fusion Algorithm Based on Dempster–Shafer Theory. Appl. Soft Comput. 2022, 124, 109075. [Google Scholar] [CrossRef]
  27. Fang, Y.; Masaki, I.; Horn, B. Depth-Based Target Segmentation for Intelligent Vehicles: Fusion of Radar and Binocular Stereo. IEEE Trans. Intell. Transp. Syst. 2002, 3, 196–202. [Google Scholar] [CrossRef]
  28. Yeong, D.J.; Velasco-Hernandez, G.; Barry, J.; Walsh, J. Sensor and Sensor Fusion Technology in Autonomous Vehicles: A Review. Sensors 2021, 21, 2140. [Google Scholar] [CrossRef] [PubMed]
  29. Zhang, X.; Zhou, M.; Qiu, P.; Huang, Y.; Li, J. Radar and Vision Fusion for the Real-Time Obstacle Detection and Identification. Ind. Robot 2019, 46, 391–395. [Google Scholar] [CrossRef]
  30. Wu, Y.; Li, D.; Zhao, Y.; Yu, W.; Li, W. Radar-Vision Fusion for Vehicle Detection and Tracking. In Proceedings of the 2023 International Applied Computational Electromagnetics Society Symposium (ACES), Monterey, CA, USA, 26–30 March 2023; pp. 1–2. [Google Scholar] [CrossRef]
  31. Wiseman, Y. Ancillary Ultrasonic Rangefinder for Autonomous Vehicles. Int. J. Secur. Appl. 2018, 12, 49–58. [Google Scholar] [CrossRef]
  32. Premnath, S.; Mukund, S.; Sivasankaran, K.; Sidaarth, R.; Adarsh, S. Design of an Autonomous Mobile Robot Based on the Sensor Data Fusion of LIDAR 360, Ultrasonic Sensor and Wheel Speed Encoder. In Proceedings of the 2019 9th IEEE International Conference on Advances in Computing and Communication (ICACC), Bangalore, India, 15–16 March 2019; pp. 62–65. [Google Scholar] [CrossRef]
Figure 1. System framework.
Electronics 14 01576 g001
Figure 2. Improved YOLOv5 structure diagram.
Electronics 14 01576 g002
Figure 3. DCAM structure.
Electronics 14 01576 g003
Figure 4. DCA Structure with CCA and SCA Structure.
Electronics 14 01576 g004
Figure 5. Time alignment diagram.
Electronics 14 01576 g005
Figure 6. Coordinate transformation.
Electronics 14 01576 g006
Figure 7. Calibration diagram.
Electronics 14 01576 g007
Figure 8. MATLAB toolbox interface.
Electronics 14 01576 g008
Figure 9. Calibration verification diagram.
Electronics 14 01576 g009
Figure 10. Schematic diagram of DBSCAN clustering effect.
Electronics 14 01576 g010
Figure 11. Experimental results.
Electronics 14 01576 g011
Figure 12. Confusion matrix.
Electronics 14 01576 g012
Figure 13. P-R curve analysis.
Electronics 14 01576 g013
Figure 14. Comparison of F1-Score.
Electronics 14 01576 g014
Figure 15. Lowlight environment and mask diagram.
Electronics 14 01576 g015
Figure 16. High-density environment and mask diagram.
Electronics 14 01576 g016
Figure 17. Occlusion environment and mask diagram.
Electronics 14 01576 g017
Figure 18. Radar point cloud failure.
Electronics 14 01576 g018
Figure 19. Network structure.
Electronics 14 01576 g019
Figure 20. Embedded research content.
Electronics 14 01576 g020
Figure 21. Deployment flowchart.
Electronics 14 01576 g021
Figure 22. Hardware structure.
Electronics 14 01576 g022
Figure 23. Effect of the board.
Electronics 14 01576 g023
Table 1. Experimental environment.
Experimental EnvironmentEnvironmental Condition
CPU13th Gen Intel (R) Core (TM) i7-13700H 2.40 GHz (Intel Corporation, Santa Clara, CA, USA)
GPUNVIDIA GeForce RTX 4060 (Nvidia Corporation, Santa Clara, CA, USA)
Operating systemUbuntu 18.04
Programming language
embedded platform
Python 3.8
RDK x3
Table 2. Model training parameter settings.
Parameter NameParameter Value
Image size640 × 640
Weight decay0.0005
Batch size16
Learning rate0.01
Epochs100
Table 3. Structure parameters of Backbone network.
NumberModule RepetitionModule NamesParameter ConfigurationOutput Size
01Focus[3,32,3]32 × 320 × 320
11S-(2)[32,64,2]64 × 160 × 160
21S-(1)[64,64,1]64 × 160 × 160
31S-(2)[64,128,2]128 × 80 × 80
43S-(1)[128,128,1]128 × 80 × 80
51S-(2)[128,256,2]256 × 40 × 40
63S-(1)[256,256,1]256 × 40 × 40
71S-(2)[256,512,2]512 × 20 × 20
81SPPF[512,512,[5,5,5]]512 × 20 × 20
91S-(1)[512,512,1]512 × 20 × 20
Table 4. Comparison of different structural performance.
ModelPar/MBFPSmAP@.5%
YOLOv57.0550.2959.4
YOLOv5 + DCAM8.4046.1567.8
YOLOv5 + Backbone + DCAM5.0446.5367.1
YOLOv5 + Neck + DCAM5.8845.7466.4
Backbone + Neck + DCAM2.5248.5667.2
Table 5. Parameter comparison of mainstream development boards.
RDK x3Raspberry Pie 5Jetson Nano
CPU8x Cortex A55@1.5 GHz4x A76@2.4 GHz4-core ARM Cortex-A57
NPU5 TOPS/7 TOPS
Network1 × RJ45 gigabit
supporting PoE power supply
dual frequency WIFI-6
1 × RJ45 Gigabit
PoE requires additional HAT
dual band WIFI-5
1 × RJ45 gigabit
supporting PoE power supply,
dual frequency WIFI-5
Price¥375¥486¥1500
Disclaimer/Publisher’s Note: The statements, opinions and data contained in all publications are solely those of the individual author(s) and contributor(s) and not of MDPI and/or the editor(s). MDPI and/or the editor(s) disclaim responsibility for any injury to people or property resulting from any ideas, methods, instructions or products referred to in the content.

