Article

A Supervised System Integrating Image Processing and Machine Learning for the Staging of Chronic Hepatic Diseases

1
Department of Electrical, Electronics, Telecommunication Engineering, and Naval Architecture (DITEN), Università degli Studi di Genova, 16145 Genova, Italy
2
Ospedale Policlinico San Martino IRCCS, 16132 Genova, Italy
3
Esaote S.p.A., 16152 Genova, Italy
4
RAISE Ecosystem, 16122 Genova, Italy
*
Author to whom correspondence should be addressed.
Electronics 2025, 14(8), 1534; https://doi.org/10.3390/electronics14081534
Submission received: 12 March 2025 / Revised: 7 April 2025 / Accepted: 8 April 2025 / Published: 10 April 2025

Abstract

:
Liver disease is a major global health concern. Given the critical role of medical image categorization in fibrosis staging (low, moderate, severe, cirrhotic) and the challenges posed by limited medical image datasets, this paper aims to leverage ultrasound imaging to assess liver margin characteristics at the level of Glisson’s capsule—here referred to as Glisson’s line—to develop a simple, automated model for accurately distinguishing fibrosis stages. The proposed approach combines traditional image processing techniques in a pre-processing stage with machine learning algorithms for classification. The pre-processing phase introduces an attention-focusing mechanism that stretches the gray levels of Glisson’s line while shrinking the intensity levels associated with the liver parenchyma and surrounding tissues. This results in the so-called region of contrast interest (ROCI), where potential classification distractors are minimized. For classification, a convolutional neural network (CNN)-based model is used to process original, rotated, and transformed ultrasound images. To address dataset imbalance and overfitting, a 10-fold cross-validation strategy was implemented. The results demonstrate that, by effectively enhancing the information content of Glisson’s line, different liver fibrosis stages can be accurately distinguished without the need for explicit edge detection, achieving accuracy levels comparable to those reported in the literature. The novelty of this work lies in analyzing the morphology of Glisson’s capsule—obtained through this method—rather than focusing on the liver parenchyma and texture, as is traditionally carried out.

1. Introduction

Chronic liver disease (CLD) affects millions worldwide, causing nearly two million deaths annually [1,2]. An accurate assessment of the severity of liver fibrosis is essential to determine appropriate treatment. Currently, liver biopsy is the gold standard for fibrosis staging; however, it is invasive, carries risks of complications, and examines only a small portion of the liver, limiting its applicability. These drawbacks, along with contraindications for certain patients, underscore the need for alternative methods. Thus, there is an urgent demand for rapid, non-invasive, and cost-effective approaches to fibrosis staging [3].
Elastography-based techniques, such as FibroScan transient elastography (TE) [4] and shear wave elastography (SWE) [5], are gaining traction due to their non-invasive nature. Although elastography is generally more effective in assessing fibrosis, its dependence on operator skill, specialized equipment, and high costs can limit widespread adoption. Furthermore, while it provides a quantitative measure of liver stiffness, its accuracy can be compromised by factors such as obesity and liver congestion [6].
Other imaging modalities, such as magnetic resonance imaging (MRI) and computed tomography (CT), offer excellent diagnostic performance but are too expensive and invasive for routine fibrosis assessment, limiting their utility for ongoing monitoring [7].
In contrast, B-mode ultrasound imaging is more accessible and widely available in clinical settings [4,5,8,9,10].
Building on these findings and recognizing the challenges of acquiring large-scale medical data sets for fibrosis research due to privacy concerns and the high cost of expert annotation, this article proposes a novel classification approach for liver fibrosis using B-mode ultrasound imaging as a cost-effective solution.
As originally proposed in [11], the importance and innovation of this work lie in the analysis of echographic images at the liver margin, with a specific focus on the hyperechogenic line corresponding to the Glisson capsule in hepatic segment III, hereinafter referred to as Glisson’s line. Our findings highlight a key structural change: an increase in surface irregularity corresponds to alterations in Glisson’s line, which appears discontinuous in ultrasound images for high levels of fibrosis. This is due to the fact that progressive liver fibrosis compromises capsular regularity, making these changes valuable biomarkers for non-invasive staging of fibrosis.
In [12], Genoa Line Quantification (GLQ) software, developed at the Numip Laboratory of the DITEN Department, extracts the bottom edge of Glisson’s line as it appears in ultrasound images, along with related quantitative features. It provides high diagnostic precision for the evaluation of liver fibrosis, offering a rapid, non-invasive, and cost-effective alternative to existing methods, as also reported in a review survey [3].
Building on this background, the present work represents an evolution of previous studies, demonstrating how appropriate image processing steps can improve the performance of neural networks in assessing liver fibrosis stage, even when large databases are not available. The proposed procedure incorporates image processing through an adaptive algorithm that functions as a focus-of-attention mechanism, making the classification step less sensitive compared to the previous approach based on Glisson’s line edge detection.
Since much of the informative content is concentrated on Glisson’s line, whose morphological changes provide insight into fibrosis staging, the proposed image processing approach mainly focuses on morphological features. This contrasts with traditional ultrasound processing, which typically emphasizes textural features.
To this end, a preliminary step is performed to prevent the classification process from being influenced by irrelevant information, such as speckle noise. Consequently, the pre-processing step focuses on reducing the prominence of the lower parenchyma region, which is heavily affected by speckle, as well as the upper portion of the image, which depicts various tissues unrelated to Glissonian line features that we seek to enhance. Based on the typical acquisition defined in the present approach, we exclude the lower and upper portions of the image from processing, thereby defining the region of interest (ROI). We then apply an adaptive image transformation aimed at suppressing textural information related to speckle noise and interfaces between other organs and tissues outside the liver, which could act as distractors in the classification step. This results in the creation of the so-called ’region of contrast interest’ (ROCI). The images obtained through this procedure are then used for data augmentation and directly fed as input to the neural network (NN). This approach significantly improves the NN’s performance, as the network’s features are no longer confounded by structural image characteristics unrelated to the information we aim to analyze.
The combination of image transformation and a convolutional neural network (CNN) reveals that Glisson’s line contains valuable diagnostic information about liver pathologies. In the following section, we will demonstrate that without the focus-of-attention mechanism, CNN performance is significantly reduced. These results not only position this work within the state of the art but also show that strong performance does not necessarily depend on the depth of the layers in deep learning models, which may be infeasible when large datasets are unavailable.

2. Related Work

Deep learning methods, particularly CNNs, have demonstrated remarkable potential in medical image analysis [13] and have proven to be effective feature extractors, eliminating the need for complex manual feature engineering [14]. However, deep neural networks require very large annotated datasets, which are often difficult to obtain. To address this challenge, several novel approaches have been proposed. For instance, the study in [15] constructs medical image classifiers by leveraging features extracted from segmentation networks. In a different application, Ref. [16] integrates edge information into a neural network to enhance performance.
For a comprehensive review of liver fibrosis assessment based on ultrasound, we mainly refer to paper [3], which evaluates and compares 17 studies selected from the 52 eligible studies found in the literature. Five studies focused on shear wave elastography (SWE), two on quantitative ultrasound, three on multiple sequences, and six on non-elastographic acquisitions. Ultrasound elastography, which assesses tissue stiffness, has shown promise for fibrosis diagnosis when combined with deep learning. Kagadis et al. [17] utilized SWE elastograms with deep learning networks, achieving mean accuracies ranging from 87.2% to 97.4%, with ResNet50 and DenseNet201 yielding the best results. Similarly, Brattain et al. [18] demonstrated the effectiveness of SWE by developing an automated system to classify stages of fibrosis, outperforming manual approaches with an AUROC of 0.93 for a two-class problem (that is, ≥F2). More recently, Kavya et al. [19] achieved a recall of 0.91 but a relatively low precision of 0.24.
The best methods based on ultrasound B-mode imaging, as reported in [3], reference the work by Feng [20] and our previous study [21]. The former, using a database of 286 patients (122 of whom were labeled F4), employs two pyramid-structured CNN elements to extract multi-scale features. As mentioned above, the latter method, based on a smaller database of 157 patients (with only 27 labeled as F4), leverages edge detection results, specifically focusing on Glisson’s line, to guide neural network classification. To suppress the influence of potential distractors, the former approach employs a distillation method that utilizes attention maps, while the latter focuses on the extracted edges. They achieve accuracy values of 0.9665 and 0.8813 on five classes, respectively.
The more recent work described in [22] reports an accuracy of 0.94 across four fibrosis classes. Despite these promising results, concerns remain regarding the generalizability of such models due to the lack of external validation and the unclear distribution of images between training and testing sets.
As a consequence of the above considerations, unlike conventional ultrasound image processing methods that focus on volumetric and textural features, our approach leverages morphological features to study the hepatic echostructure and the regularity of liver margins at the level of Glisson’s capsule [11].
Building on previous research that has emphasized the role of image processing in improving neural network performance [21], we incorporate adaptive image processing techniques and define a focus-of-attention mechanism. Thanks to this approach, we demonstrate that even a shallow CNN, when supported by adaptive image processing, can achieve competitive results, as will be shown in the Results Section.

3. Materials and Methods
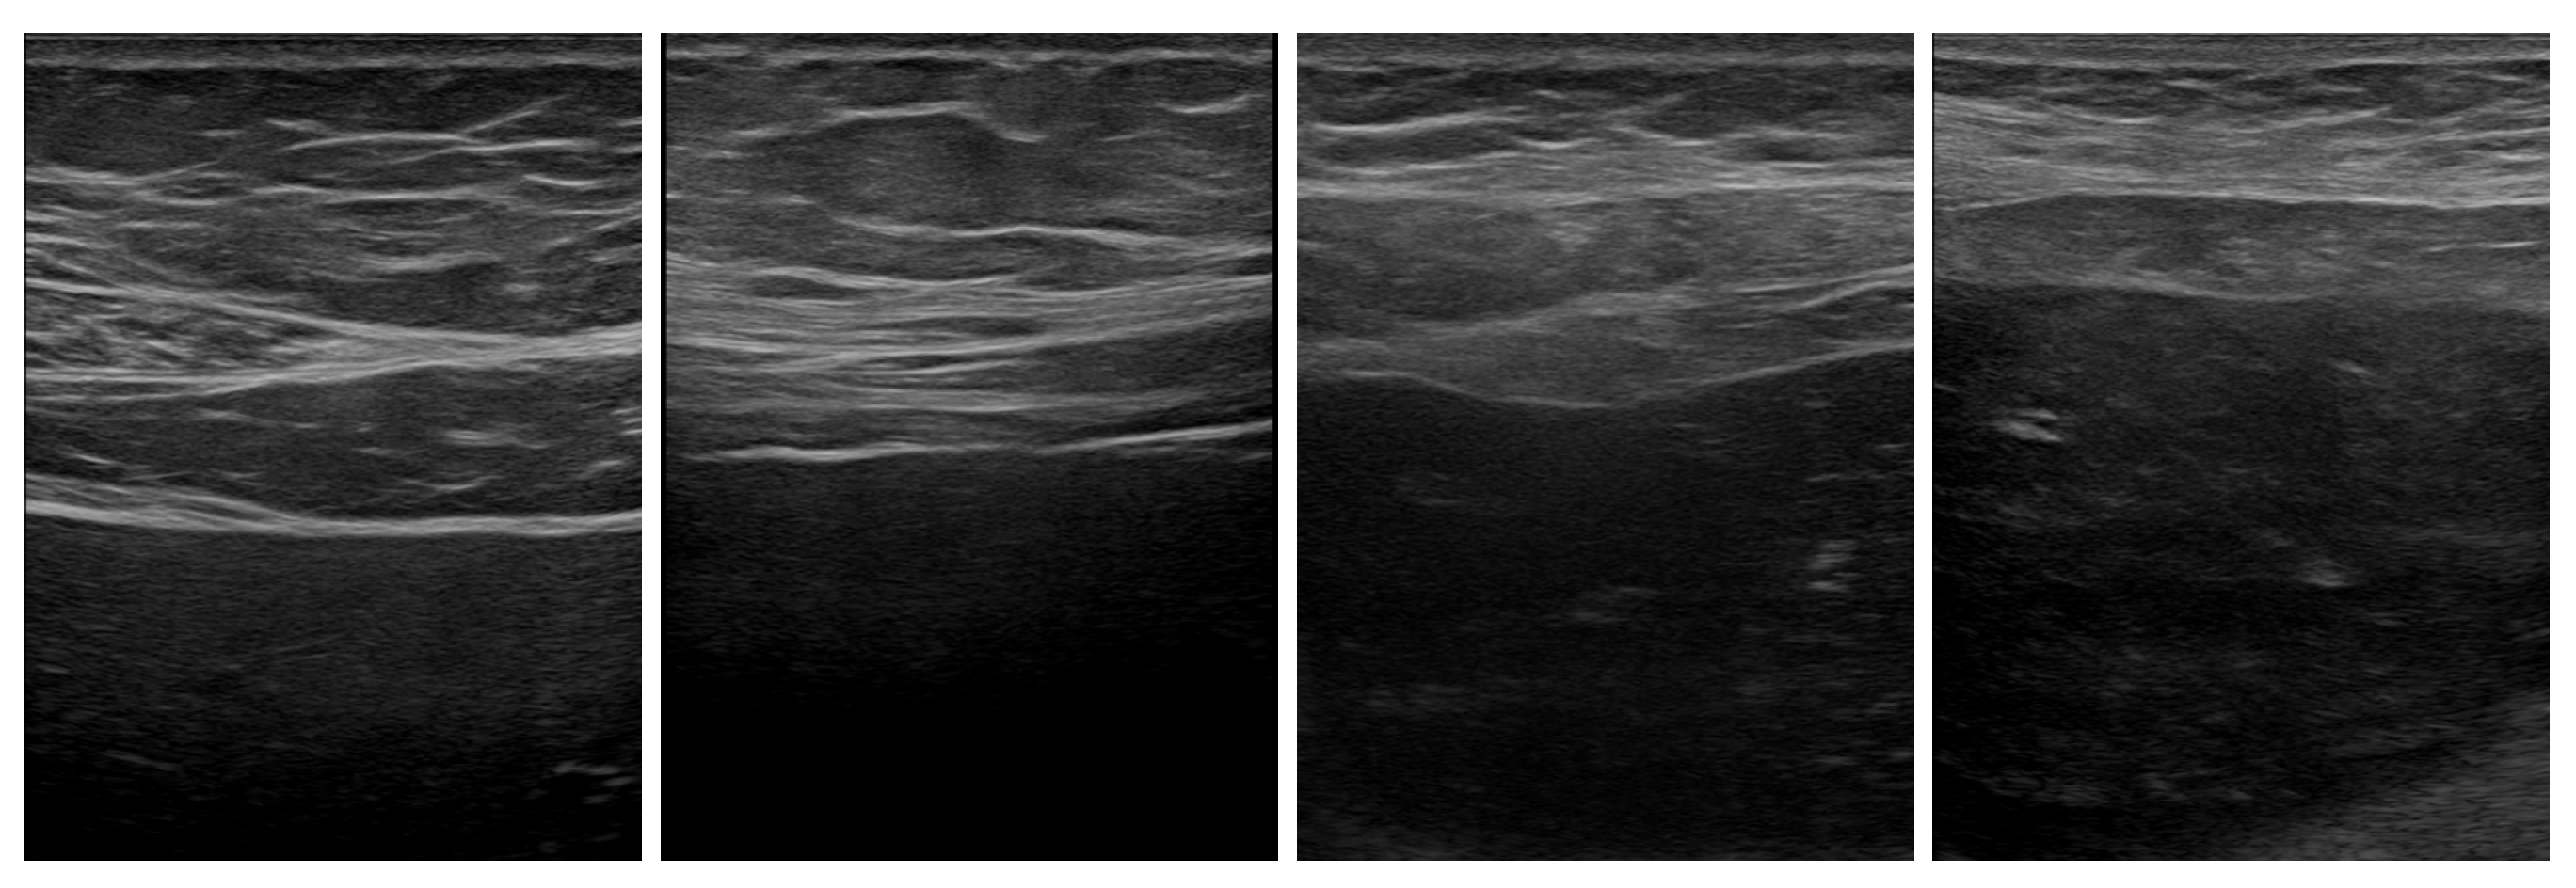
In this section, after describing the clinical data collected at Ospedale Policlinico San Martino IRCCS in Genoa, we present the formal model, which includes the proposed image processing technique as a focus-of-attention mechanism and the CNN-based liver staging classification. Additionally, we outline the parameters used for analyzing the results.

3.1. Available Data

This retrospective study, conducted at Ospedale Policlinico San Martino IRCCS in Genoa, involved 215 CLD patients (male and female) with an average age of 57.84 ± 13.39 years (range 20–92). Patients were diagnosed with conditions such as non-alcoholic fatty liver disease (NAFLD), hepatitis C (HCV), hepatitis B (HBV), autoimmune hepatitis (AIH), and primary biliary cholangitis (PBC). The dataset Figure 1 included 392 liver ultrasound images acquired using the M y L a b T M X 9 Esaote machine.
Despite convex probes being commonly used for liver diagnosis, scanning in this study was performed with a linear probe to focus on the liver’s third segment and better highlight Glisson’s capsule. All acquisitions were conducted by a single experienced operator. Annotation of fibrosis staging, according to METAVIR score [23], was derived from elastographic exams using shear wave and FibroScan elastography. Only patients with consistent results from both methods were included. The population was divided into four groups based on fibrosis severity: 98 patients with F0–F1 (no/mild fibrosis), 79 patients with F2 (moderate fibrosis), 76 patients with F3 (severe fibrosis), and 104 patients with F4 (cirrhosis). Image acquisition by the Esaote ultrasound machine M y L a b T M X 9 provided scans of different sizes (about 600 × 600) in a 3-channel, 40 kB average size and BMP format. Before constructing the database, all the images underwent an anonymization process. They were cropped, converted to grayscale, and resized (scaled to have equal height and width) to a resolution of 150 × 150 pixels. This action helps to reduce the number of pixels in an image, leads to faster and more accurate image processing algorithms and can therefore reduce the training time of a neural network. This is because the greater the number of pixels in an image, the greater the number of input nodes, which in turn increases the complexity of the model.
To enhance training data for a shallow convolutional neural network, the ultrasound images were augmented using image processing techniques, as described in the following subsection.

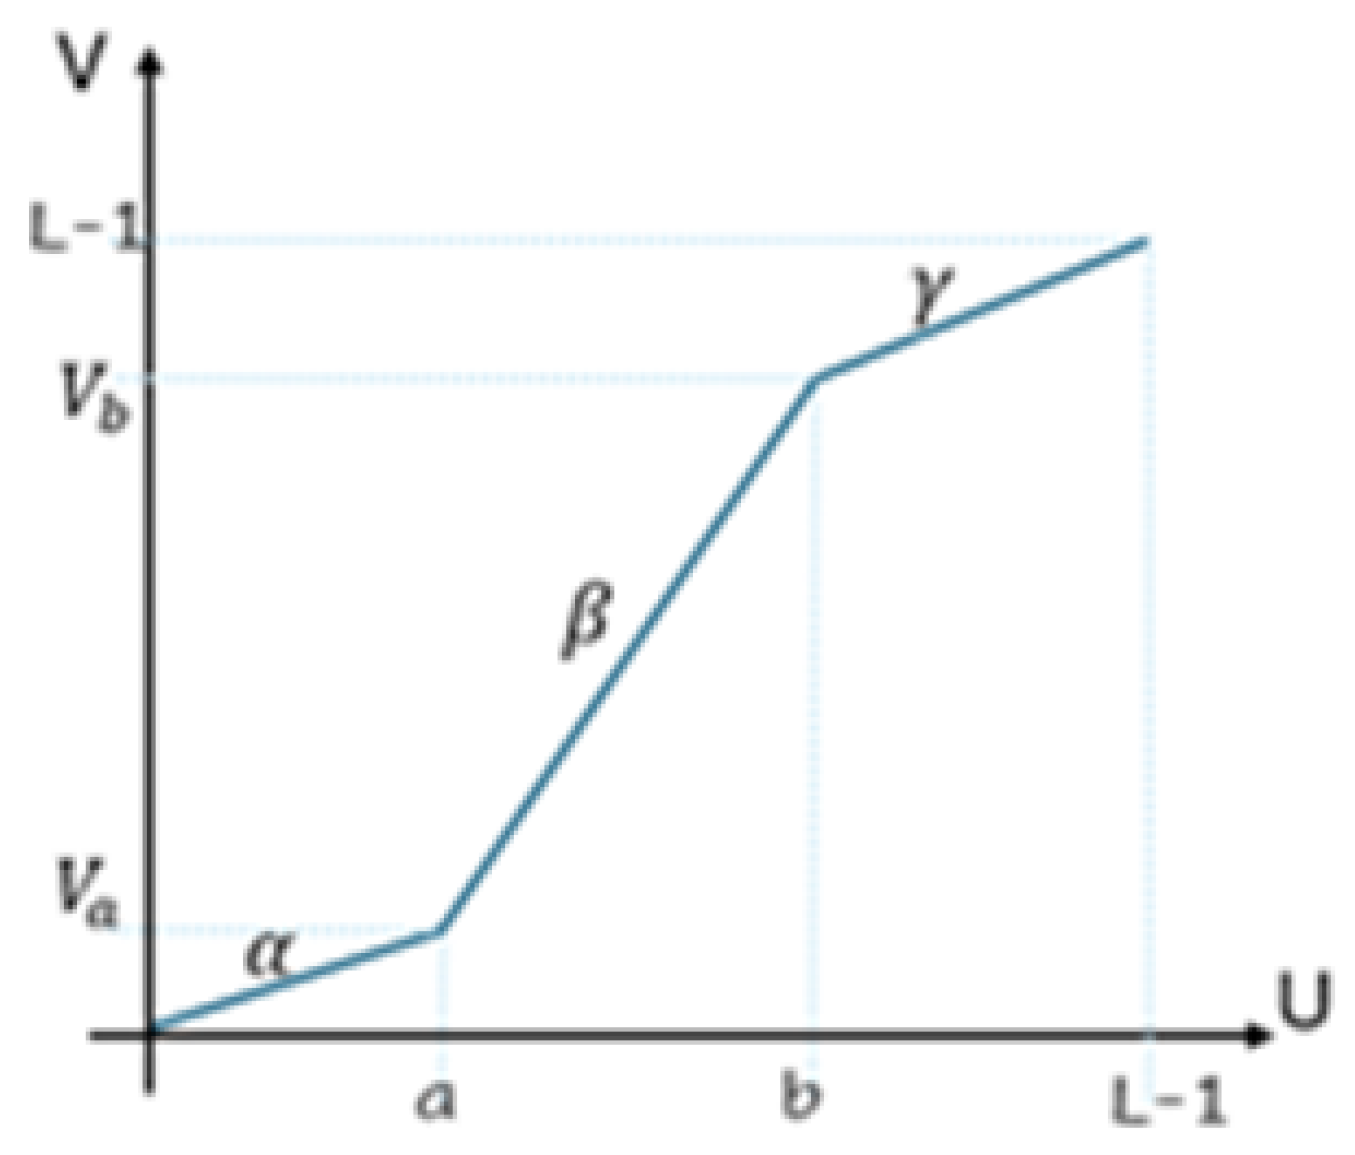
3.2. Image Processing

Medical US image analysis faces not only the challenge of a small amount of labeled data but also the disadvantage of a large number of artifacts.
A key challenge in training neural networks, particularly in biomedical imaging, is obtaining sufficient labeled data. To address this, data augmentation techniques are often employed to expand and balance datasets, enhancing training efficiency. For image classification, augmentations such as rotations, noise addition, translations, and blurring are crucial [24]. However, selecting the appropriate augmentation strategy is essential; excessive modifications can hinder training, as the performance of CNNs is strongly influenced by the training set.
In the current work, we have found that traditional data augmentation methods are insufficient, and the direct application of a CNN does not yield satisfactory performance, especially when the database is of a limited size. The richness of information in ultrasound images stems from the strong textural properties caused by typical speckle [25,26], which is not considered noise but rather valuable information for characterizing tissue properties. This textural information forms the basis for most analyses. CNN kernels and their related features heavily depend on this type of textural information, often at the expense of other features, such as morphological ones, which are central to the present analysis.
As mentioned in Section 1, ultrasound images are typically affected by low-contrast levels, making it difficult to detect pathological signs. To address this, a dedicated focus-of-attention mechanism was applied to enhance the contrast of Glisson’s line while reducing the structural features. This can be considered the first phase of data augmentation, where image pre-processing improves the information content and contrast of the image as much as possible. In this way, qualitative data augmentation is achieved. Below are the steps that led to the construction of the proposed focus-of-attention mechanism.
Let a 2 D digital image be represented by a matrix I of discrete points, which is a functional mapping I ( x , y ) :
I : Z × Z N
where Z is the set of integer numbers and N is the set of natural numbers.
The discrete domain is ( x , y ) , where
x = 0 , , M 1
is the column number and
y = 0 , , N 1
is the row number. The discrete co-domain is the pixel echographic intensity U, where
U [ 0 , L 1 ] ,
with L being equal to 256 in the present case of a format comprising 8 bits per pixel.
It is well known that radiologists and sonographers use characteristic echo patterns and transitions at organ interfaces to make accurate diagnoses. Anechoic areas appear completely black because they do not reflect any ultrasound waves, typically indicating the absence of structures. Hypoechoic areas appear darker than the surrounding tissues but are not completely black, suggesting that the tissue or structure in that region reflects fewer ultrasound waves. A hyperechoic signal, on the other hand, is caused by structures such as bone, calcifications, fibrous tissues, or fat. Significant transitions between hypoechoic and hyperechoic signals (or vice versa) typically correspond to the interfaces between different organs and tissues.
Punctual-based processing refers to point operators where the value of each pixel in the output image depends solely on the value of the corresponding pixel in the input image, using a linear or non-linear function. These operations are often based on appropriate transformations of the image histogram, which is the graphical representation of the occurrence frequency of gray levels:
h ( U ) = # P i x e l ( U ) M × N
It is evident that U = 0 L 1 h ( U ) = 1 . Moreover, the histogram serves as an estimate of the statistical distribution of the image’s intensity and tracks the occurrences of gray levels. The smallest intensity values refer to anechoic regions, the medium level values refer to hypoechoic areas, the brightest gray levels are associated with hyperechoic signals.
As described above, during the pre-processing phase, an image transformation technique was applied. This technique aims to highlight the features of interest of Glisson’s line contained in the ROI while reducing the relevance of elements that might introduce confusion, such as the textural information. This results in a transformed image called ROCI. By doing so, an ad hoc dataset is created, which can be provided as input to the neural network, focusing the classification on the key features of interest.
To implement an adaptive transformation, a histogram-based transformation is proposed, similar to the one commonly used for contrast stretching, as described in Figure 2 and explained below, where U is the original gray level and V is the gray level in the transformed image:
V = g ( U ) = α U , 0 U < a β ( U a ) + V a , a U < b γ ( U b ) + V b , b U L 1
The parameters a and b are adaptively set for each image to divide the dark (i.e., anechoic), medium (hypoechoic), and bright (hyperechoic) regions. The slopes α , β and γ are used for determining the relative transformation in these three regions.
From this modification of the histogram, we obtain a new image I o u t : ( x , y ) V . The piecewise-linear transformation shrinks dark and light intensities while stretching the intermediate values to increase the likelihood of a relevant region’s correct analysis. In such a way, we can drive the NN process. Let a and b denote the lower and upper limits, respectively, where a represents the mean value of the parenchyma, while b represents the mean value of the other tissues. Both are calculated for each image and estimated based on the mean value of the lower and upper portions of the ultrasound image divided vertically into three parts, respectively. This approach ensures that the technique remains adaptive. The corresponding transformed output values, V a and V b , are set to 50 and 200, respectively.
This method aims to enhance ultrasound images by expanding the intensity range of central pixels while shrinking the extremes.
By applying contrast stretching transformation to the ROIs, we generate additional images alongside the original ultrasounds. These images, referred to as transformed images, emphasize the information content of the Glissonian membrane while attenuating—or even eliminating—details of other anatomical structures and potential artifacts, thus defining the ROCIs.
Following this transformation, both the original and transformed images are used for network training. To further enhance the dataset, small rotations along the probe axis are simulated for both image types. This augmentation process results in an expanded dataset, which is then fed into the neural network for training.
Unlike other pathologies or conditions, such as cases involving tumors or lesions where abnormalities are clearly visible in ultrasound scans, liver staging relies on subtle contrast variations—particularly their presence, continuity, or absence.
While many studies employ traditional data augmentation techniques solely to increase the number of samples, leaving the task of feature extraction entirely to the neural network, our approach is different. Here, the application of contrast stretching not only augments the dataset but also enhances the quality of information within the image. This transformation helps guide the network’s attention toward the key features of the Glissonian line, improving its ability to learn relevant patterns for liver staging.
In conclusion, from a numerical perspective, after applying the focus-of-attention mechanism and rotation, we obtain a dataset consisting of 830 elements (where each element refers to a combination of the original ultrasound image, its transformed version, and its rotated variant). The dataset is then split into training, validation, and test sets, with proportions of 80%, 10%, and 10%, respectively. This setup enables 10-fold cross-validation and helps mitigate overfitting. N t denotes the size of the test set.

3.3. Fibrosis Staging

A convolutional neural network with a simple, shallow architecture is used for classification, in contrast to more complex CNNs [27]. Experimental results indicate that global features do not carry particularly relevant information; therefore, a very deep network is not necessary for processing the available data [11]. The proposed model is described in Figure 3.
The network takes image spatial ROIs as input from the image dataset, performs a feature learning phase, characterized by two convolutional layers with kernel 3 × 3, ReLU, max pooling (2 × 2) and dropout (0.4), in which incoming image features are automatically learned and then classified. For dealing with imbalanced datasets, 10-fold cross-validation was used to ensure fair and accurate model evaluation. In this way, the model is trained and tested on a representative sample of each class, mitigating bias and improving overall performance. This operation was necessary because, particularly for this pathology, it is difficult to obtain cases of intermediate fibrosis, resulting in an unbalanced dataset.
We analyzed the network’s behavior for two-class classification (F0 and F1 vs. F2 to F4) and three-class classification (low: F0/F1, moderate: F2, and cirrhotic: F3/F4) fibrosis stages. A sigmoid function was used for the former, while a softmax function was applied for the latter. During the training process, cross-entropy was used as a loss function. The model was optimized using the adaptive moment estimation (Adam) algorithm, with the learning rate set to 0.001. The network was trained for 30 epochs. The computational environment consisted of Python 3.9, PyTorch 2.3.1, and CUDA 12.1. The hardware utilized for computation was an NVIDIA GeForce RTX 4060 GPU (Nvidia Corporation, Santa Clara, CA, USA).

3.4. Quantitative Evaluation

After training and validating the supervised classification model [13,28], we evaluated its performance computing precision and recall for binary and three-class classification.
In addition to accuracy, we evaluated the mean absolute error (MAE). This metric was chosen because it is easy to interpret and resistant to outliers. The confusion matrix maps predicted results to actual labels, with C ( p , c ) denoting predicted class p versus actual class c.
The following metrics were used:
  • Mean absolute error of the predicted classes:
    M A E = 1 N t i = 1 N t | c c i p c i |
    where c c i is the correct class number of the i t h element, p c i is its predicted class number, and N t is the size of the test set, as defined in the Image Processing Subsection of the Materials and Methods Section.
  • Overall accuracy:
    A c c u r a c y = | p C ( p , p ) N t |
    is the ratio between the confusion matrix trace and the total tested cases (proportion of correct predictions).
  • Precision for each class p is
    P r e c i s i o n = T P ( p ) T P ( p ) + F P ( p )
    where T P ( p ) is the true-positive value from the confusion matrix (i.e., T P ( p ) = C(p,p)) and F P ( p ) is the false-positive occurrence:
    F P ( p ) = c , c p C ( p , c )
  • Recall is a measure of how many of the positive cases of a class c are correctly predicted, as compared with the positive cases in the class.
    R e c a l l = T P ( c ) T P ( c ) + F N ( c )
    where F N ( c ) is the false-negative occurrence:
    F N ( c ) = p , c p C ( p , c )
  • F1-score is a measure combining both precision and recall and is generally the harmonic mean of the two.

4. Results

As previously described, the dataset was classified into two and three distinct categories. For the two-class classification, the groups consisted of healthy or low-disease patients (Stages F0–F1) and patients with moderate to advanced disease (Stages F2–F4). For the three-class classification, the dataset was divided into healthy or low-disease patients (stages F0–F1), moderate-disease patients (Stage F2), and advanced-stage patients (Stages F3–F4). The proposed model, depicted in Figure 3, was developed without employing any transfer learning processes or incorporating external information [21,28,29].

4.1. Without Focus-of-Attention Mechanism

In medical imaging, the Digital Imaging and Communications in Medicine (DICOM) protocol [30] is the standard for communication and management of medical imaging information; therefore, DICOM files are typically used. In this research, for convenience of image analysis, the original images were converted to 256-grayscale BMP files. First, the original images were marked by experienced clinicians and verified in clinical reality. The physician selects the area around the Glissonian capsule by excluding the lower and upper portions of the image from processing, thus defining the region of interest (ROI).
The evaluation results are presented in Table 1 without the proposed image processing. As explained above, the CNN architecture used in this study consists of two convolutional layers, in contrast to the previous work in [21], where three layers were used.
Experimental tests revealed that, without initial image processing, the network already yielded poor results for three-class classification and only moderate performance for two-class classification. In particular, for the three-class scenario, the test set metrics were notably low, suggesting an overfitting problem.

4.2. With Focus-of-Attention Mechanism

As summarized in Table 2, after the proposed histogram transformation, the overall accuracy is high for the validation set, and even better for the testing set.
As shown in Table 2, the convolutional network, when aided by the proposed image processing, achieves high performance in binary classification (test accuracy equal to 0.94) and exhibits good performance in three-class classification (test accuracy equal to 0.70). Notably, our approach achieves these results by locating a region of interest (ROI) within the medical image, without relying on deep networks [31,32] or applying transfer learning methods [28,33]. For a comparison with the results in the literature, we refer to Ref. [3] for the classification of fibrosis stages F 2 . Only methods based on SWE report accuracy values ranging from 0.86 to 0.967.
Few works deal with image processing in support of neural networks [11,21]. However, even in this case, the performance obtained is comparable [28,33] and more robust, since no edge extractions are performed during analysis.

4.3. Model Evaluation

To evaluate the performance of the proposed method in comparison with deep models, we applied transfer learning to three alternative models, ResNet, VGG, and DenseNet, consisting of 50, 16, and 201 layers, respectively. As reported in Table 3, for binary classification, the proposed model achieved the highest recall (0.97), indicating superior sensitivity in identifying patients with the disease. Its overall accuracy (0.94) and precision (0.91) were very close to those of DenseNet, with the latter exhibiting a lower recall, thus reinforcing the reliability of our approach.
In the three-level classification of low, advanced, and cirrhotic stages, as reported in Table 4, the proposed model excelled again, achieving an overall accuracy of 0.701, a precision of 0.712, and a remarkable recall of 0.91, significantly outperforming the other models. On the other hand, VGG16 performed slightly better in accuracy and precision. It exhibited a significantly lower recall, demonstrating that a higher number of layers is not always the optimal solution. This highlights the robustness of the proposed model in accurately classifying liver disease stages, especially in the case of small datasets, suggesting its potential as a valuable diagnostic support tool that merits further investigation.

5. Discussion

With advances in medical technology and increasing awareness of potential complications, the reliance on liver biopsy may be decreasing. Many physicians are increasingly adopting non-invasive methods, such as liver stiffness measurements as well as transient and shear wave elastography. Each of these non-invasive approaches has unique advantages in terms of safety and patient comfort. However, their applicability may be affected by factors such as cost and examination duration. In this article, a study on the classification of liver fibrosis staging based on simple ultrasound images was presented, involving 215 patients with CLD of different ages and genders. The proposed method has several positive aspects in terms of applicability, as echography is a low-cost, non-invasive, repeatable and easy-to-perform modality. During the data augmentation phase, the use of an image-focusing mechanism, based on the image processing applied to ultrasound scans, was key to solving the problem of scarcity of medical image annotation data, reducing the problem of overfitting during the training phase and improving the generalization capability of the neural network. To prove the efficiency of a shallow NN, several state-of-the-art deep models were also examined, which received the same dataset as input. The comparison allowed us to establish how our classification system, thanks to image processing techniques, can achieve results similar to those of deep networks for liver fibrosis classification while avoiding expensive computational burdens.
At present, there are few studies exploring contrast enhancement processing in combination with neural networks. In the approach proposed here, this is the sole technique used to enhance data both qualitatively and quantitatively, aiding neural networks in classification. Furthermore, the input images consist of ROCI, without requiring any special feature extraction.
An initial experimental phase showed that CNNs alone did not correctly perform the classification of liver staging. To demonstrate the efficiency of the proposed shallow neural network, several state-of-the-art deep models were also evaluated using the same dataset. As expected, deep neural networks and transfer learning are well suited for problems where a similar pre-existing procedure exists and the task requires a large amount of data. The comparison established that our classification system, leveraging image processing techniques, can achieve results comparable to those of deep networks for liver fibrosis classification while avoiding high computational costs. Therefore, transfer learning was not used to minimize computational expenses and reduce the risk of introducing biases from pre-trained models.

6. Conclusions

The results of the present study demonstrate that by correctly highlighting the information content of the so-called Glissonian line, within the ROCI, it is possible to distinguish various liver fibrosis stages without the need to extract the line directly (despite a numerically limited dataset), making the whole classification more robust. The use of image processing techniques should be further studied and used to guide neural networks in liver fibrosis classification tasks. In this sense, these results could be considered as a basis for future educational purposes in the investigation of image techniques in liver fibrosis and other pathologies. Additionally, integrating this model into clinical workflows could help assess both its limitations and benefits. The process of acquiring an ultrasound scan, applying the focus-of-attention mechanism, and classifying it with the neural network could serve as a valuable diagnostic aid, significantly reducing dependence on operator variability. However, for clinical applicability, an accuracy of at least 80% is required. Although binary classification meets this criterion, multiclass classification does not, and it requires larger datasets, both within the proposed framework and in deep neural network approaches. An interesting future development could be to apply the model to a dataset obtained with different imaging devices and observe the robustness of the focus-of-attention mechanism when dealing with a heterogeneous dataset.

Author Contributions

Conceptualization, G.I. and S.D.; methodology, G.I. and S.D.; software, G.I. and A.W.; validation, G.I. and A.W.; formal analysis, G.I. and S.D.; investigation, G.I. and A.W.; resources, P.B. and M.M.; data curation, P.B.; writing, G.I. and S.D.; supervision, S.D.; project administration, S.D.; funding acquisition, S.D. All authors have read and agreed to the published version of the manuscript.

Funding

This research was partially supported by the PNRR Project “RAISE”, funded by NextGenerationEU. Grant number: D33C22000970006. The funders had role in the collection of data. They only funded the ultrasound machine used to perform the scans.

Institutional Review Board Statement

The study was conducted in accordance with the Declaration of Helsinki and approved by the Institutional Review Board (or Ethics Committee) of Azienda Ligure Sanitaria della Regione Liguria (protocol code 468; date of approval: 22 December 2021).

Informed Consent Statement

Informed consent was obtained from all subjects involved in this study. Written informed consent was obtained from the patient(s) to publish this paper.

Data Availability Statement

Data are contained within the article.

Acknowledgments

We acknowledge the partial support from the PNRR Project “RAISE”, funded by NextGenerationEU. This work was carried out in compliance with the GDPR regulations.

Conflicts of Interest

The author Marco Macciò was employed by the company Esaote S.p.A. The remaining authors declare that the research was conducted in the absence of any commercial or financial relationships that could be construed as a potential conflict of interest.

References

  1. Asrani, S.K.; Devarbhavi, H.; Eaton, J.; Kamath, P.S. Burden of liver diseases in the world. J. Hepatol. 2019, 70, 151–171. [Google Scholar] [CrossRef] [PubMed]
  2. Moon, A.M.; Singal, A.G.; Tapper, E.B. Contemporary Epidemiology of Chronic Liver Disease and Cirrhosis. Clin. Gastroenterol. Hepatol. 2020, 18, 2650–2666. [Google Scholar] [CrossRef] [PubMed]
  3. Punn, N.S.; Patel, B.; Banerjee, I. Liver fibrosis classification from ultrasound using machine learning: A systematic literature review. Abdom. Radiol. 2024, 49, 69–80. [Google Scholar] [CrossRef]
  4. de Lédinghen, V.; Vergniol, J. Transient elastography (FibroScan). Gastroentérologie Clin. Biol. 2008, 32 (Suppl. S1), 58–67. [Google Scholar] [CrossRef]
  5. Sarvazyan, A.P.; Rudenko, O.V.; Swanson, S.D.; Fowlkes, J.B.; Emelianov, S.Y. Shear wave elasticity imaging: A new ultrasonic technology of medical diagnostics. Ultrasound Med. Biol. 1998, 24, 1419–1435. [Google Scholar] [CrossRef]
  6. Perazzo, H.; Veloso, V.G.; Grinsztejn, B.; Hyde, C.; Castro, R. Factors that could impact on liver fibrosis staging by transient elastography. Int. J. Hepatol. 2015, 2015, 624596. [Google Scholar] [CrossRef] [PubMed]
  7. Talwalkar, J.A.; Yin, M.; Fidler, J.L.; Sanderson, S.O.; Kamath, P.S.; Ehman, R.L. Magnetic resonance imaging of hepatic fibrosis: Emerging clinical applications. Hepatology 2008, 47, 332–342. [Google Scholar] [CrossRef]
  8. Castera, L.; Forns, X.; Alberti, A. Non-invasive evaluation of liver fibrosis using transient elastography. J. Hepatol. 2008, 48, 835–847. [Google Scholar] [CrossRef]
  9. Cui, X.-W.; Friedrich-Rust, M.; De Molo, C.; Ignee, A.; Schreiber-Dietrich, D.; Dietrich, C.F. Liver elastography, comments on EFSUMB elastography guidelines 201. World J. Gastroenterol. 2013, 19, 6329–6347. [Google Scholar] [CrossRef]
  10. Han, D.; Liu, Q.; Fan, W. A new image classification method using CNN transfer learning and web data augmentation. Expert Syst. Appl. 2018, 95, 43–56. [Google Scholar] [CrossRef]
  11. Borro, P.; Dellepiane, S.; Pellicano, R.; Gemme, L.; Fagoonee, S.; Testino, G. Quantification of ultrasound imaging in the staging of hepatic fibrosis. Panminerva Medica 2018, 60, 44–51. [Google Scholar] [CrossRef] [PubMed]
  12. Borro, P.; Ziola, S.; Pasta, A.; Trombini, M.o.; Labanca, S.; Marenco, S.; Solarna, D.; Pisciotta, L.; Baldissarro, I.; Picciotto, A.; et al. Hepatic Elastometry and Glissonian Line in the Assessment of Liver Fibrosis. Ultrasound Med. Biol. 2021, 47, 947–959. [Google Scholar] [CrossRef]
  13. Yadav, S.; Jadhav, S. Deep convolutional neural network based medical image classification for disease diagnosis. J. Big Data 2019, 6, 113. [Google Scholar] [CrossRef]
  14. Varshni, D.; Thakral, K.; Agarwal, L.; Nijhawan, R.; Mittal, A. Pneumonia Detection Using CNN based Feature Extraction. In Proceedings of the 2019 IEEE International Conference on Electrical, Computer and Communication Technologies (ICECCT), Coimbatore, Tamil Nadu, India, 20–22 February 2019; pp. 1–7. [Google Scholar] [CrossRef]
  15. Ken, W.; Tanveer, S.M.; Mehdi, M. Building medical image classifiers with very limited data using segmentation networks. Med. Image Anal. 2018, 49, 105–116. [Google Scholar] [CrossRef]
  16. Obunguta, F.; Hanpasith, S.; Sasai, K.; Kaito, K. Segregation Method for Pothole and Manhole Features Segmented in Pavement Smartphone Images Through Deep Learning. In Proceedings of the 2024 International Conference on Digital Image Computing: Techniques and Applications (DICTA), Perth, Australia, 27–29 November 2024; pp. 538–544. [Google Scholar] [CrossRef]
  17. Kagadis, G.C.; Drazinos, P.; Gatos, I.; Tsantis, S.; Papadimitroulas, P.; Spiliopoulos, S.; Karnabatidis, D.; Theotokas, I.; Zoumpoulis, P.; Hazle, J.D. Deep learning networks on chronic liver disease assessment with fine-tuning of shear wave elastography image sequences. Phys. Med. Biol. 2020, 65, 215027. [Google Scholar] [CrossRef]
  18. Brattain, L.J.; Ozturk, A.; Telfer, B.A.; Dhyani, M.; Grajo, J.R.; Samir, A.E. Image Processing Pipeline for Liver Fibrosis Classification Using Ultrasound ShearWave Elastography. Ultrasound Med. Biol. 2020, 46, 2667–2676. [Google Scholar] [CrossRef]
  19. Kavya, T.M.; Anjani, S.S.; Gagana, K.R.; Sanjana, S.; Varsha, V. Detection and Staging of Liver Fibrosis using Deep Learning. In Proceedings of the 2024 Second International Conference on Advances in Information Technology (ICAIT), Chikkamagaluru, Karnataka, India, 24–27 July 2024; Volume 1, pp. 1–5. [Google Scholar] [CrossRef]
  20. Feng, X.; Chen, X.; Dong, C.; Liu, Y.; Liu, Z.; Ding, R.; Huang, Q. Multi-scale information with attention integration for classification of liver fibrosis in B-mode US image. Comput. Methods Programs Biomed. 2022, 215, 106598. [Google Scholar] [CrossRef]
  21. Trombini, M.; Borro, P.; Ziola, S.; Dellepiane, S. A Digital Image Processing Approach for Hepatic Diseases Staging based on the Glisson’s Capsule. In Proceedings of the 2020 2nd International Conference on Electrical, Control and Instrumentation Engineering (ICECIE), Kuala Lumpur, Malaysia, 28 November 2020; pp. 1–6. [Google Scholar] [CrossRef]
  22. Park, H.-C.; Choi, J.-H.; Yoon, S.-Y.; Kim, H.-J.; Kim, K.-S.; Lee, S.-Y. Automated classification of liver fibrosis stages using ultrasound imaging. BMC Med. Imaging 2024, 24, 36. [Google Scholar] [CrossRef]
  23. Bedossa, P.; Poynard, T. An algorithm for the grading of activity in chronic hepatitis C. Hepatology 1996, 24, 289–293. [Google Scholar] [CrossRef]
  24. Cherry, K.; Baljit Singh, S. Enhancing Performance of Deep Learning Models with different Data Augmentation Techniques: A Survey. In Proceedings of the 2020 International Conference on Intelligent Engineering and Management (ICIEM), London, UK, 17–19 June 2020; pp. 79–85. [Google Scholar] [CrossRef]
  25. Greenleaf, V.D.J.F. Adaptive speckle reduction filter for log-compressed B-scan images. IEEE Trans. Med. Imaging 1996, 15, 802–813. [Google Scholar] [CrossRef]
  26. Krissian, K.; Kikinis, R.; Westin, C.-F.; Vosburgh, K. Speckle-constrained filtering of ultrasound images. In Proceedings of the 2005 IEEE Computer Society Conference on Computer Vision and Pattern Recognition (CVPR’05), San Diego, CA, USA, 20–26 June 2005; Volume 2, pp. 547–552. [Google Scholar] [CrossRef]
  27. Khan, A.; Sohail, A.; Zahoora, U.; Qureshi, A.S. A survey of the recent architectures of deep convolutional neural networks. Artif. Intell. Rev. 2020, 53, 5455–5516. [Google Scholar] [CrossRef]
  28. Zhang, Y.; Zhang, Y.; Zhang, Y.; Wang, D.; Peng, F.; Cui, S.; Yang, Z. Ultrasonic image fibrosis staging based on machine learning for chronic liver disease. In Proceedings of the 2021 IEEE International Conference on Medical Imaging Physics and Engineering (ICMIPE), Online, 13–14 November 2021; pp. 1–5. [Google Scholar] [CrossRef]
  29. Yeh, W.-C.; Huang, S.-W.; Li, P.-C. Liver fibrosis grade classification with B-mode ultrasound. Ultrasound Med. Biol. 2003, 29, 1229–1235. [Google Scholar] [CrossRef] [PubMed]
  30. Gotra, A.; Sivakumaran, L.; Chartrand, G.; Vu, K.N.; Vandenbroucke-Menu, F.; Kauffmann, C.; Kadoury, S.; Gallix, B.; de Guise, J.A.; Tang, A. Liver segmentation: Indications, techniques and future directions. Insights Imaging 2017, 8, 377–392. [Google Scholar] [CrossRef] [PubMed]
  31. Dan, M.; Libo, Z.; Guitao, C.; Wenming, C.; Guixu, Z.; Bing, H. Liver Fibrosis Classification Based on Transfer Learning and FCNet for Ultrasound Images. IEEE Access 2017, 5, 5804–5810. [Google Scholar] [CrossRef]
  32. Liu, Z.; Huang, B.; Wen, H.; Lu, Z.; Huang, Q.; Jiang, M.; Dong, C.; Liu, Y.; Chen, X.; Lin, H. Automatic Diagnosis of Significant Liver Fibrosis from Ultrasound B-Mode Images Using a Handcrafted-Feature-Assisted Deep Convolutional Neural Network. IEEE J. Biomed. Health Inform. 2023, 27, 4938–4949. [Google Scholar] [CrossRef]
  33. Lee, J.H.; Joo, I.; Kang, T.W.; Paik, Y.H.; Sinn, D.H.; Ha, S.Y.; Kim, K.; Choi, C.; Lee, G.; Yi, J.; et al. Deep learning with ultrasonography: Automated classification of liver fibrosis using a deep convolutional neural network. Eur. Radiol. 2020, 30, 1264–1273. [Google Scholar] [CrossRef]
Figure 1. US original images from Esaote M y L a b T M X 9 ultrasound scanner. From left to right, the stages correspond to fibrosis progression from F0–F1 to F4.
Electronics 14 01534 g001
Figure 2. Piecewise histogram contrast transform. In abscissa, the original gray levels I i n : ( x , y ) U are shown; in the ordinate axis, the output intensity I o u t : ( x , y ) V is shown.
Electronics 14 01534 g002
Figure 3. Architecture of the proposed convolutional neural network model: two convolutional layers with kernel 3 × 3, ReLU, max pooling (2 × 2) and dropout (0.4). A sigmoid function was used for binary classification and a softmax function was used for multiclass classification. Cross-entropy was used as a loss function. The model was optimized using the Adam algorithm, with a learning rate of 0.001. The network was trained for 30 epochs.
Electronics 14 01534 g003
Table 1. Performance metrics of the CNN trained on original ROI ultrasound scans for binary (two-class) and three-class classification.
Classification Results
Class TypeMetricsTrainingValidationTest
2-ClassAccuracy0.89500.91230.8602
MAE0.12030.11540.1956
3-ClassAccuracy0.81920.83330.5789
MAE0.17340.16441.1933
Table 2. Performance metrics of ROI-trained CNN transformations with focus-of-attention mechanism for binary and three-class classification.
Classification Results
Class TypeMetricsTrainingValidationTest
2-ClassAccuracy0.96500.95230.9402
MAE0.10030.10240.1736
3-ClassAccuracy0.92140.88730.7010
MAE0.10200.11810.2233
Table 3. Performance comparison of models for binary classification: values of overall accuracy, precision (macro), and recall (macro) for distinguishing between patients with and without disease. The best values are shown in bold.
Binary Classification (No Disease vs. Disease)
Overall AccuracyPrecision (Macro)Recall (Macro)Model
0.800.750.78ResNet
0.850.820.84VGG16
0.990.950.92DenseNet
0.940.910.97Proposed Model
Table 4. Performance comparison of models: values of overall accuracy, precision (macro) and recall (macro) obtained from transfer learning models classification with focus-of-attention mechanism. The best values are shown in bold.
Low/Advance/Cirrhotic Stage
Overall AccuracyPrecision (Macro)Recall (Macro)Model
0.58940.62430.6408ResNet
0.72630.72380.6663VGG16
0.65260.64600.6818DenseNet
0.7010.7120.91Proposed Model
Disclaimer/Publisher’s Note: The statements, opinions and data contained in all publications are solely those of the individual author(s) and contributor(s) and not of MDPI and/or the editor(s). MDPI and/or the editor(s) disclaim responsibility for any injury to people or property resulting from any ideas, methods, instructions or products referred to in the content.

