


Test Case Prioritization Using Dragon Boat Optimization for Software Quality Testing

Abstract
1. Introduction
- The TCP-DBOA model strategically prioritizes test cases to optimize the testing process, effectively mitigating the total execution time. Focusing on an efficient test case order improves overall testing efficiency. This approach ensures faster fault detection and enhanced resource utilization during testing.
- The TCP-DBOA approach aims to optimize the APFD, increasing the chances of identifying faults early in the testing cycle. Prioritizing test cases based on APFD improves fault detection efficiency. This approach results in quicker defect identification, improving the overall efficiency of the testing process.
- The TCP-DBOA methodology implements the DBOA model to improve TCP, allowing the model to navigate large search spaces effectively. By employing DBOA, optimal test case orders are identified, enhancing testing efficiency. This method ensures a more streamlined process, prioritizing test cases that maximize fault detection.
- The TCP-DBOA technique uniquely utilizes the APFD as an objective function to capture coverage velocity, giving a novel approach to TCP. This method effectively balances fault detection and test case selection (TCS). By optimizing APFD, it ensures a faster and more effective testing process. The novelty is its ability to handle large search spaces while prioritizing fault detection and coverage speed.
2. Related Works
3. The Proposed Method
3.1. Design of DBOA
| Algorithm 1: DBOA Technique |
|
3.1.1. Social Behavior Patterns
3.1.2. Acceleration Factor
3.1.3. Attenuation Factor
3.1.4. Imbalance Rate of Paddlers
3.1.5. Strategies for Updating Crew State
3.1.6. Comparative Analysis of DBOA vs. Other Models
3.2. Process Involved in TCP-DBOA Technique
4. Result Analysis and Discussion
5. Conclusions
Funding
Data Availability Statement
Conflicts of Interest
References
- Nazir, M.; Mehmood, A.; Aslam, W.; Park, Y.; Choi, G.S.; Ashraf, I. A Multi-Goal Particle Swarm Optimizer for Test Case Prioritization. IEEE Access 2023, 11, 90683–90697. [Google Scholar] [CrossRef]
- Silega, N.; Aguilar, G.F.; Alcívar, I.A.; Colombo, K.M. Applying Neutrosophic Iadov Technique for assessing an MDD-based approach to support software design. Int. J. Neutrosophic Sci. (IJNS) 2022, 19, 80–86. [Google Scholar] [CrossRef]
- Yang, B.; Li, H.; Xing, Y.; Zeng, F.; Qian, C.; Shen, Y.; Wang, J. Directed Search Based on Improved Whale Optimization Algorithm for Test Case Prioritization. Int. J. Comput. Commun. Control 2023, 18, 5049. [Google Scholar] [CrossRef]
- Rao, K.K.; Rao, M.B.; Kavitha, C.; Kumari, G.L.; Surekha, Y. Prioritization of Test Cases in Software Testing Using M2 H2 Optimization. Int. J. Mod. Educ. Comput. Sci. 2022, 14, 56. [Google Scholar]
- Li, X.; Yang, Q.; Hong, M.; Pan, C.; Liu, R. Test case prioritization approah based on historical data and multi-objective optimization. J. Comput. Appl. 2023, 43, 221. [Google Scholar]
- Gupta, P.K. K-Step Crossover Method based on Genetic Algorithm for Test Suite Prioritization in Regression Testing. J. Univers. Comput. Sci. 2021, 27, 170–189. [Google Scholar] [CrossRef]
- Juneja, K. Design of a Novel Weighted-Multicriteria Analysis Model for Effective Test Case Prioritization for Network and Robotic Projects. Wirel. Pers. Commun. 2022, 123, 2505–2532. [Google Scholar] [CrossRef]
- Singhal, S.; Jatana, N.; Subahi, A.F.; Gupta, C.; Khalaf, O.I.; Alotaibi, Y. Fault Coverage-Based Test Case Prioritization and Selection Using African Buffalo Optimization. Comput. Mater. Contin. 2023, 74, 6755–6774. [Google Scholar] [CrossRef]
- Raamesh, L.; Jothi, S.; Radhika, S. Test case minimization and prioritization for regression testing using SBLA-based adaboost convolutional neural network. J. Supercomput. 2022, 78, 18379–18403. [Google Scholar] [CrossRef]
- Rajagopal, M.; Sivasakthivel, R.; Loganathan, K.; Sarris, L.E. An Automated Path-Focused Test Case Generation with Dynamic Parameterization Using Adaptive Genetic Algorithm (AGA) for Structural Program Testing. Information 2023, 14, 166. [Google Scholar] [CrossRef]
- Sheikh, R.; Babar, M.I.; Butt, R.; Abdelmaboud, A.; Eisa, T.A.E. An Optimized Test Case Minimization Technique Using Genetic Algorithm for Regression Testing. Comput. Mater. Contin. 2023, 74, 6789–6806. [Google Scholar] [CrossRef]
- Hamza, M.A.; Abdelmaboud, A.; Larabi-Marie-Sainte, S.; Alshahrani, H.M.; Al Duhayyim, M.; Ibrahim, H.A.; Rizwanullah, M.; Yaseen, I. Modified Harris hawks optimization based Test Case Prioritization for software testing. CMC-Comput. Mater. Contin. 2022, 72, 1951–1965. [Google Scholar]
- Nayak, S.; Kumar, C.; Tripathi, S.; Mohanty, N.; Baral, V. Regression test optimization and prioritization using Honey Bee optimization algorithm with fuzzy rule base. Soft Comput. 2021, 25, 9925–9942. [Google Scholar] [CrossRef]
- Priya, T.; Prasanna, M. Component-Based Test Case Generation and Prioritization Using an Improved Genetic Algorithm. Int. J. Coop. Inf. Syst. 2023, 34, 2350017. [Google Scholar] [CrossRef]
- Iqbal, S.; Al-Azzoni, I. Test Case Prioritization for model transformations. J. King Saud Univ. -Comput. Inf. Sci. 2022, 34, 6324–6338. [Google Scholar] [CrossRef]
- Pathik, B.; Pathik, N.; Sharma, M. Test Case Prioritization for changed code using nature inspired optimizer. J. Intell. Fuzzy Syst. 2023, 44, 5711–5718. [Google Scholar] [CrossRef]
- Chandra, S.V.; Sankar, S.S.; Anand, H.S. Smell Detection Agent Optimization Approach to Path Generation in Automated Software Testing. J. Electron. Test. 2022, 38, 623–636. [Google Scholar] [CrossRef]
- Singh, M.; Chauhan, N.; Popli, R. Test Case Reduction and SWOA Optimization for Distributed Agile Software Development Using Regression Testing. Multimed. Tools Appl. 2023, 84, 7065–7090. [Google Scholar] [CrossRef]
- Li, X.; Lan, L.; Lahza, H.; Yang, S.; Wang, S.; Yang, W.; Liu, H.; Zhang, Y. A Novel Human-Based Meta-Heuristic Algorithm: Dragon Boat Optimization. arXiv 2023, arXiv:2311.15539. [Google Scholar]


| Ref. Number | Objective | Methods | Dataset | Measures |
|---|---|---|---|---|
| Sheikh et al. [11] | To propose the TestReduce technique for minimizing and prioritizing RT cases. | GA | Web application requirements | Test case minimization, prioritization using 100-Dollar approach. Quality criteria conformance evaluation |
| Hamza et al. [12] | To propose the MHHO-TCP technique for maximizing APFD and minimizing execution time in software testing. | MHHO-based TCP technique | GZIP, GREP, TCAS, and CSTCAS | APFD, ET, FDR |
| Nayak et al. [13] | To propose a BA-based technique for enhancing fault detection. | BA with Fuzzy Rule Base, Scout And Forager Bees Behavior | Standard Dataset | APFD, FDR, TCP performance |
| Priya and Prasanna [14] | To propose an efficient MTCGP-IGA for Component-based software development. | Improved GA, Nondominated Sorting GS-II | Component-based Software Development Test Scenarios | TCP, PCC, Fault-Finding Capability (FFC), TIC |
| Iqbal and Al-Azzoni [15] | To propose a test prioritization approach for the RT model transformations using rule coverage information. | Rule Coverage-based TCP, Empirical Study and Tool Implementation | Model Transformation Test Cases | FDR, TCP Efficiency, Test Case Orderings |
| Pathik, Pathik, and Sharma [16] | To propose a hybrid technique for RT through TCP using clustering and optimization. | Kernel-based FCM Clustering, GWO for Prioritization | RT Cases for Software Modifications | FDR, TCP Efficiency |
| Chandra, Sankar, and Anand [17] | To propose a SDA approach for selecting and prioritizing paths in software testing. | SDA, CFG, Cyclomatic Complexity | Ten Benchmarked Applications | Path Coverage Increase, Time Complexity Reduction |
| Singh, Chauhan, and Popli [18] | To propose a TCR and SWOA for RT in distributed agile software development. | TCP and Selection, SWOA, Clustering and Sorting of Test Cases | Distributed Agile Software Projects | TCS Performance, Coverage and Failure Rate |
| Algorithm | Search Space Diversity | Convergence Rate | Computational Complexity | Success Rate | Computational Cost |
|---|---|---|---|---|---|
| GA | Moderate | Slow | High | Medium | High |
| HHO | Low | Moderate | Moderate | High | Moderate |
| PSO | High | Fast | Moderate | High | Moderate |
| DE | Moderate | Moderate | Moderate | High | Moderate |
| DBOA | Very High | Fast | Low | Very High | Low |
| GZIP Dataset | ||||||
|---|---|---|---|---|---|---|
| Number of Iterations | TCP-DBOA | MHHO-TCP | FA Techniques | PSD Techniques | LBS Techniques | Greedy |
| 1 | 96.88 | 95.36 | 95.15 | 94.05 | 94.05 | 92.39 |
| 2 | 96.59 | 95.21 | 94.80 | 94.19 | 94.82 | 92.49 |
| 3 | 96.91 | 95.31 | 94.80 | 94.03 | 93.87 | 93.22 |
| 4 | 97.18 | 95.61 | 95.37 | 93.62 | 95.39 | 93.10 |
| 5 | 97.17 | 95.51 | 95.17 | 94.28 | 94.74 | 92.38 |
| 6 | 97.20 | 95.56 | 95.36 | 93.06 | 93.78 | 92.59 |
| 7 | 96.66 | 95.33 | 95.15 | 94.98 | 95.06 | 93.56 |
| 8 | 96.49 | 95.17 | 94.82 | 94.35 | 94.52 | 93.38 |
| 9 | 97.23 | 95.59 | 95.37 | 94.14 | 94.62 | 92.37 |
| 10 | 97.02 | 95.56 | 95.33 | 94.91 | 95.30 | 93.29 |
| 11 | 96.69 | 95.48 | 94.55 | 93.89 | 93.81 | 93.57 |
| 12 | 96.97 | 95.64 | 95.51 | 93.83 | 95.06 | 93.38 |
| 13 | 96.94 | 95.37 | 94.83 | 93.41 | 93.76 | 94.24 |
| 14 | 96.76 | 95.44 | 95.00 | 94.55 | 94.79 | 93.12 |
| 15 | 96.79 | 95.56 | 95.20 | 93.15 | 94.59 | 93.56 |
| 16 | 97.16 | 95.58 | 95.28 | 93.72 | 93.83 | 92.29 |
| 17 | 97.07 | 95.57 | 95.05 | 94.03 | 94.80 | 93.22 |
| 18 | 97.24 | 95.86 | 95.72 | 94.78 | 94.43 | 92.56 |
| 19 | 97.29 | 95.85 | 95.71 | 94.29 | 94.93 | 93.53 |
| 20 | 97.13 | 95.59 | 95.01 | 94.56 | 95.13 | 94.39 |
| 21 | 97.02 | 95.69 | 94.78 | 94.06 | 93.93 | 93.28 |
| 22 | 96.85 | 95.59 | 95.40 | 93.64 | 95.42 | 93.11 |
| 23 | 96.85 | 95.48 | 95.21 | 94.36 | 94.77 | 92.41 |
| 24 | 96.97 | 95.57 | 95.27 | 93.12 | 93.81 | 92.56 |
| 25 | 97.19 | 95.49 | 95.08 | 95.01 | 95.02 | 93.52 |
| 26 | 97.10 | 95.65 | 95.52 | 93.83 | 95.09 | 93.34 |
| 27 | 97.27 | 95.57 | 94.80 | 93.40 | 93.78 | 94.23 |
| 28 | 97.22 | 95.74 | 95.52 | 93.76 | 95.11 | 93.39 |
| 29 | 97.21 | 95.55 | 94.82 | 93.34 | 93.74 | 94.26 |
| 30 | 97.24 | 95.56 | 94.98 | 94.60 | 94.79 | 93.09 |
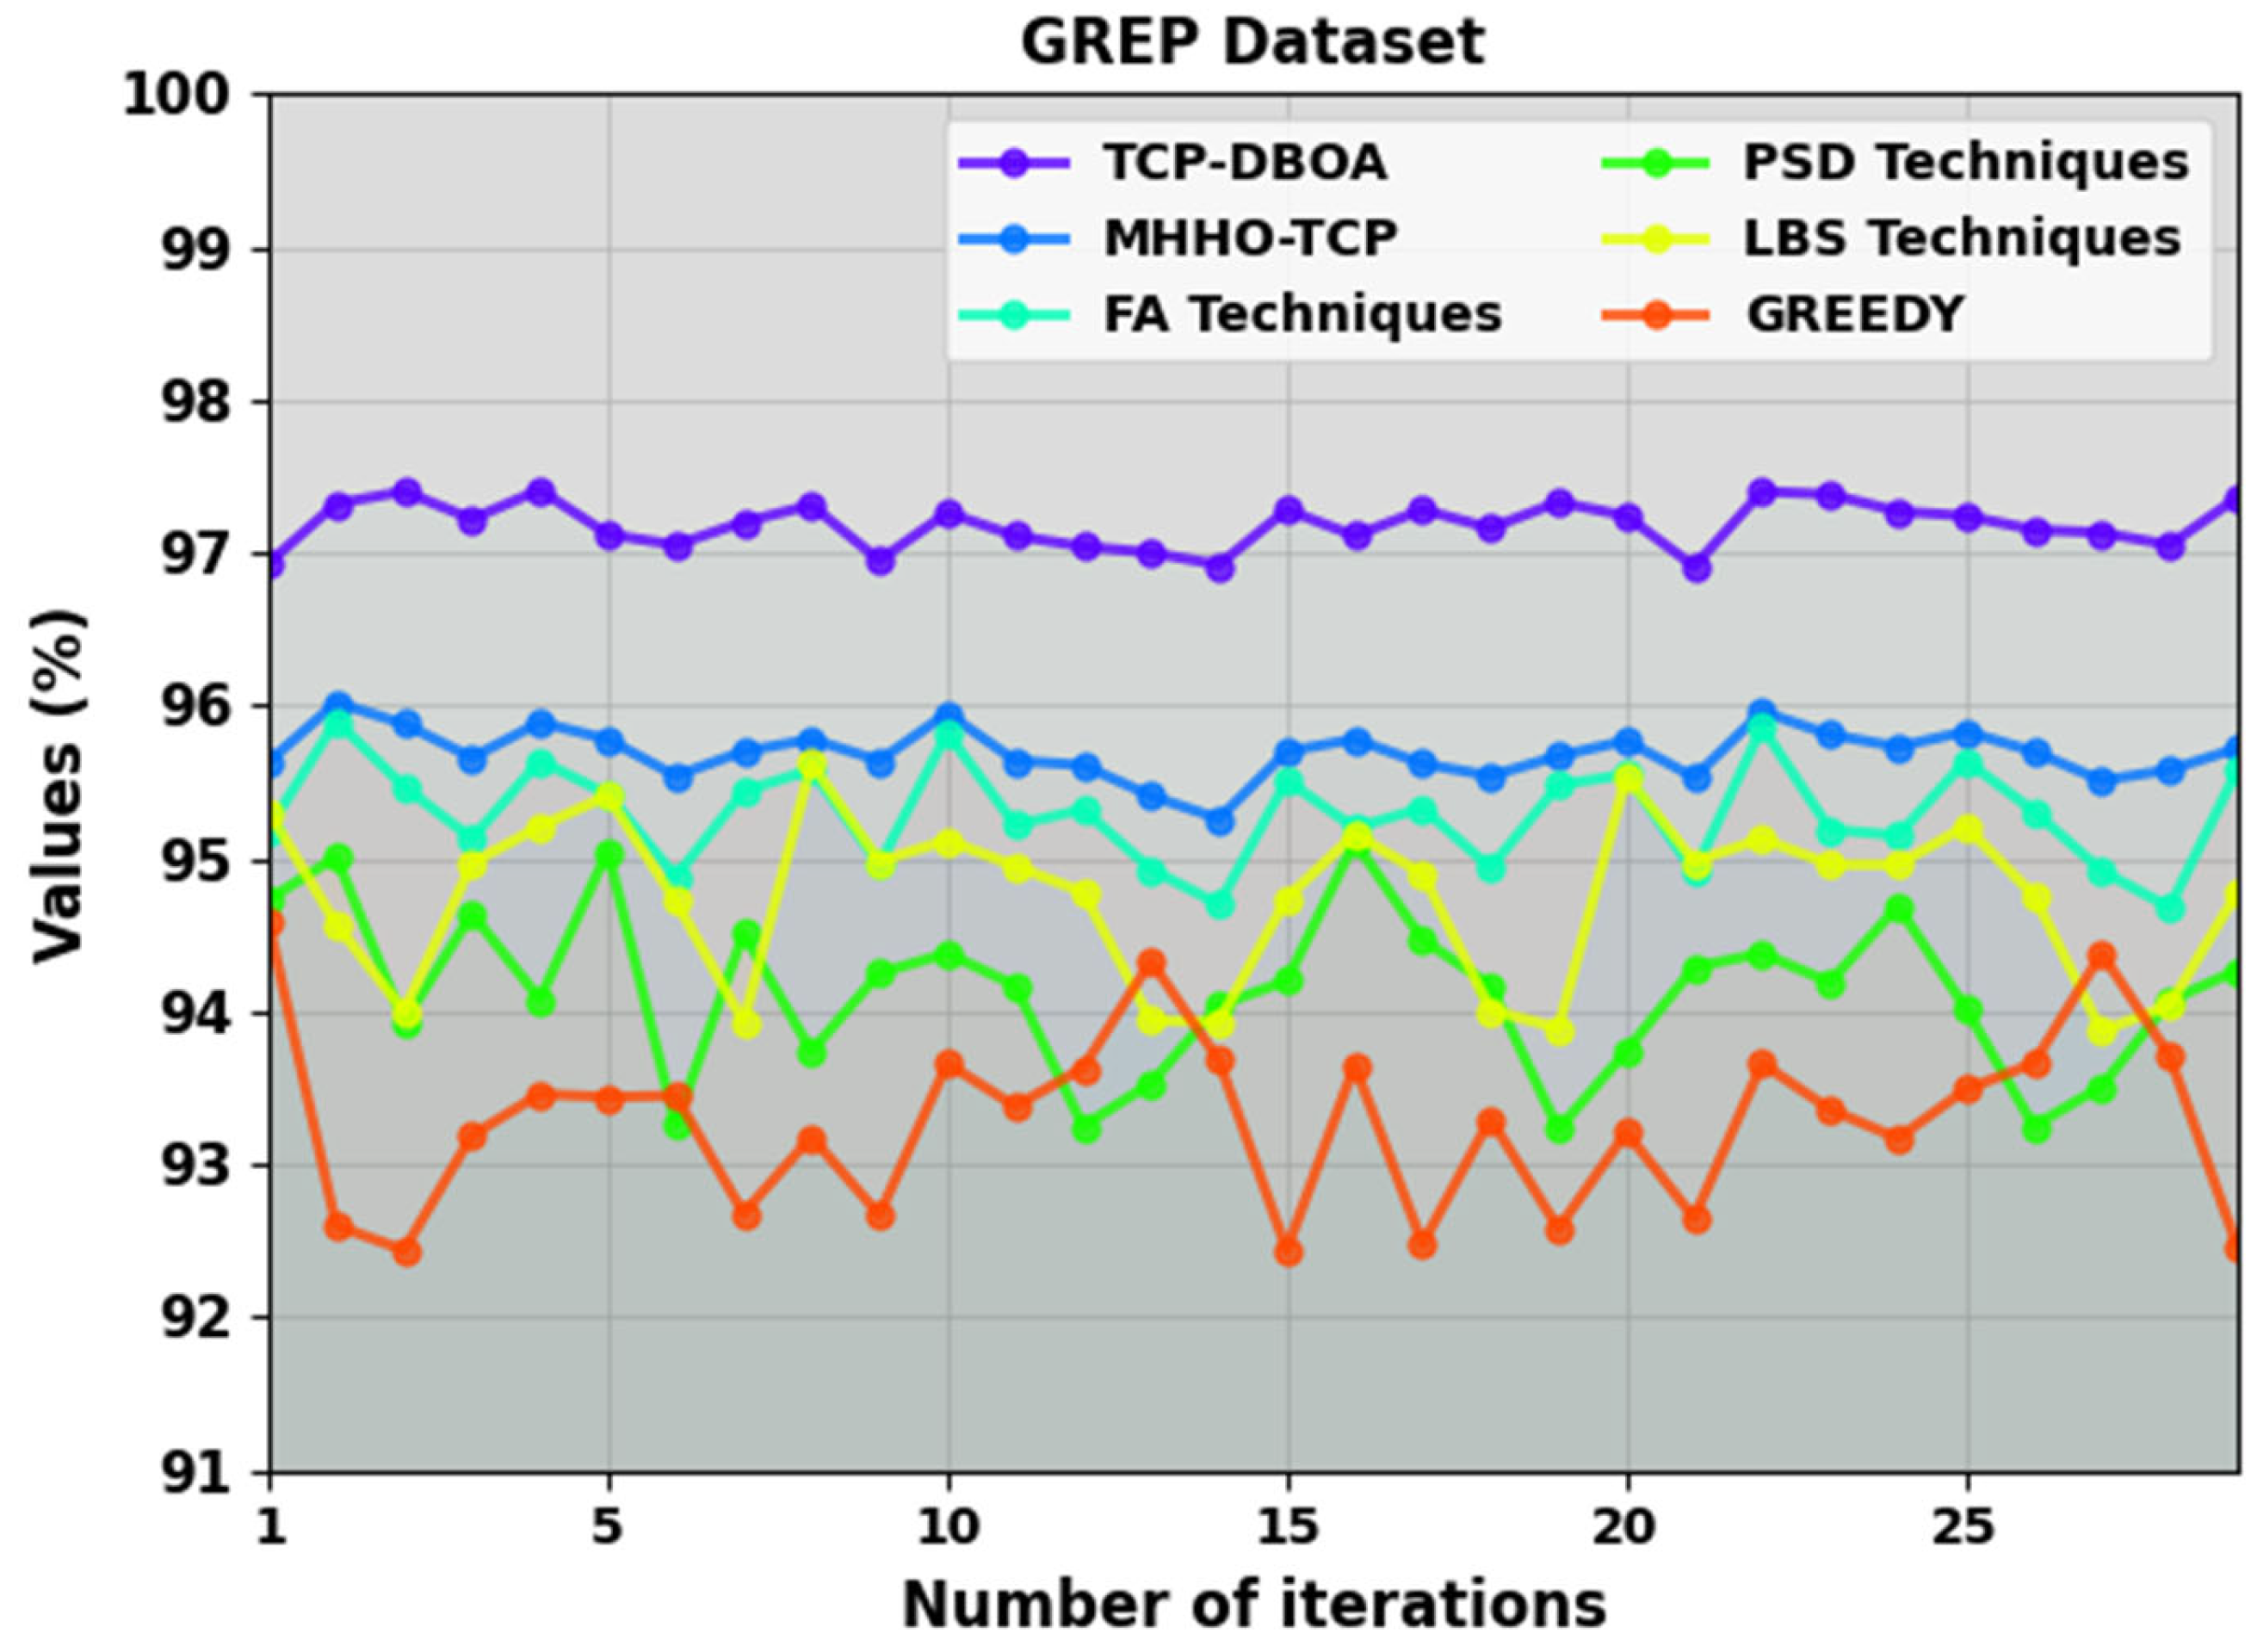
| GREP Dataset | ||||||
|---|---|---|---|---|---|---|
| Number of Iterations | TCP-DBOA | MHHO-TCP | FA Techniques | PSD Techniques | LBS Techniques | Greedy |
| 1 | 96.93 | 95.63 | 95.19 | 94.73 | 95.31 | 94.59 |
| 2 | 97.32 | 96.02 | 95.90 | 95.01 | 94.57 | 92.60 |
| 3 | 97.40 | 95.88 | 95.47 | 93.93 | 94.00 | 92.44 |
| 4 | 97.22 | 95.66 | 95.13 | 94.64 | 94.97 | 93.19 |
| 5 | 97.41 | 95.89 | 95.64 | 94.08 | 95.21 | 93.46 |
| 6 | 97.12 | 95.78 | 95.42 | 95.05 | 95.41 | 93.44 |
| 7 | 97.05 | 95.54 | 94.88 | 93.26 | 94.72 | 93.45 |
| 8 | 97.20 | 95.70 | 95.44 | 94.51 | 93.93 | 92.68 |
| 9 | 97.31 | 95.78 | 95.58 | 93.74 | 95.62 | 93.18 |
| 10 | 96.95 | 95.64 | 94.96 | 94.25 | 94.98 | 92.67 |
| 11 | 97.26 | 95.95 | 95.82 | 94.38 | 95.12 | 93.66 |
| 12 | 97.11 | 95.64 | 95.22 | 94.17 | 94.95 | 93.38 |
| 13 | 97.04 | 95.61 | 95.32 | 93.25 | 94.78 | 93.63 |
| 14 | 97.00 | 95.41 | 94.93 | 93.53 | 93.94 | 94.33 |
| 15 | 96.92 | 95.26 | 94.70 | 94.04 | 93.93 | 93.68 |
| 16 | 97.28 | 95.70 | 95.51 | 94.20 | 94.74 | 92.44 |
| 17 | 97.11 | 95.78 | 95.20 | 95.11 | 95.16 | 93.65 |
| 18 | 97.28 | 95.62 | 95.33 | 94.47 | 94.90 | 92.48 |
| 19 | 97.16 | 95.54 | 94.94 | 94.17 | 94.01 | 93.30 |
| 20 | 97.33 | 95.67 | 95.48 | 93.23 | 93.89 | 92.58 |
| 21 | 97.24 | 95.77 | 95.55 | 93.74 | 95.54 | 93.21 |
| 22 | 96.91 | 95.53 | 94.91 | 94.29 | 94.98 | 92.65 |
| 23 | 97.40 | 95.96 | 95.86 | 94.38 | 95.13 | 93.66 |
| 24 | 97.38 | 95.81 | 95.19 | 94.19 | 94.96 | 93.36 |
| 25 | 97.27 | 95.73 | 95.15 | 94.69 | 94.96 | 93.17 |
| 26 | 97.24 | 95.83 | 95.64 | 94.02 | 95.21 | 93.49 |
| 27 | 97.15 | 95.70 | 95.31 | 93.25 | 94.76 | 93.66 |
| 28 | 97.13 | 95.51 | 94.92 | 93.51 | 93.87 | 94.38 |
| 29 | 97.05 | 95.58 | 94.68 | 94.07 | 94.04 | 93.71 |
| 30 | 97.36 | 95.72 | 95.58 | 94.27 | 94.78 | 92.46 |
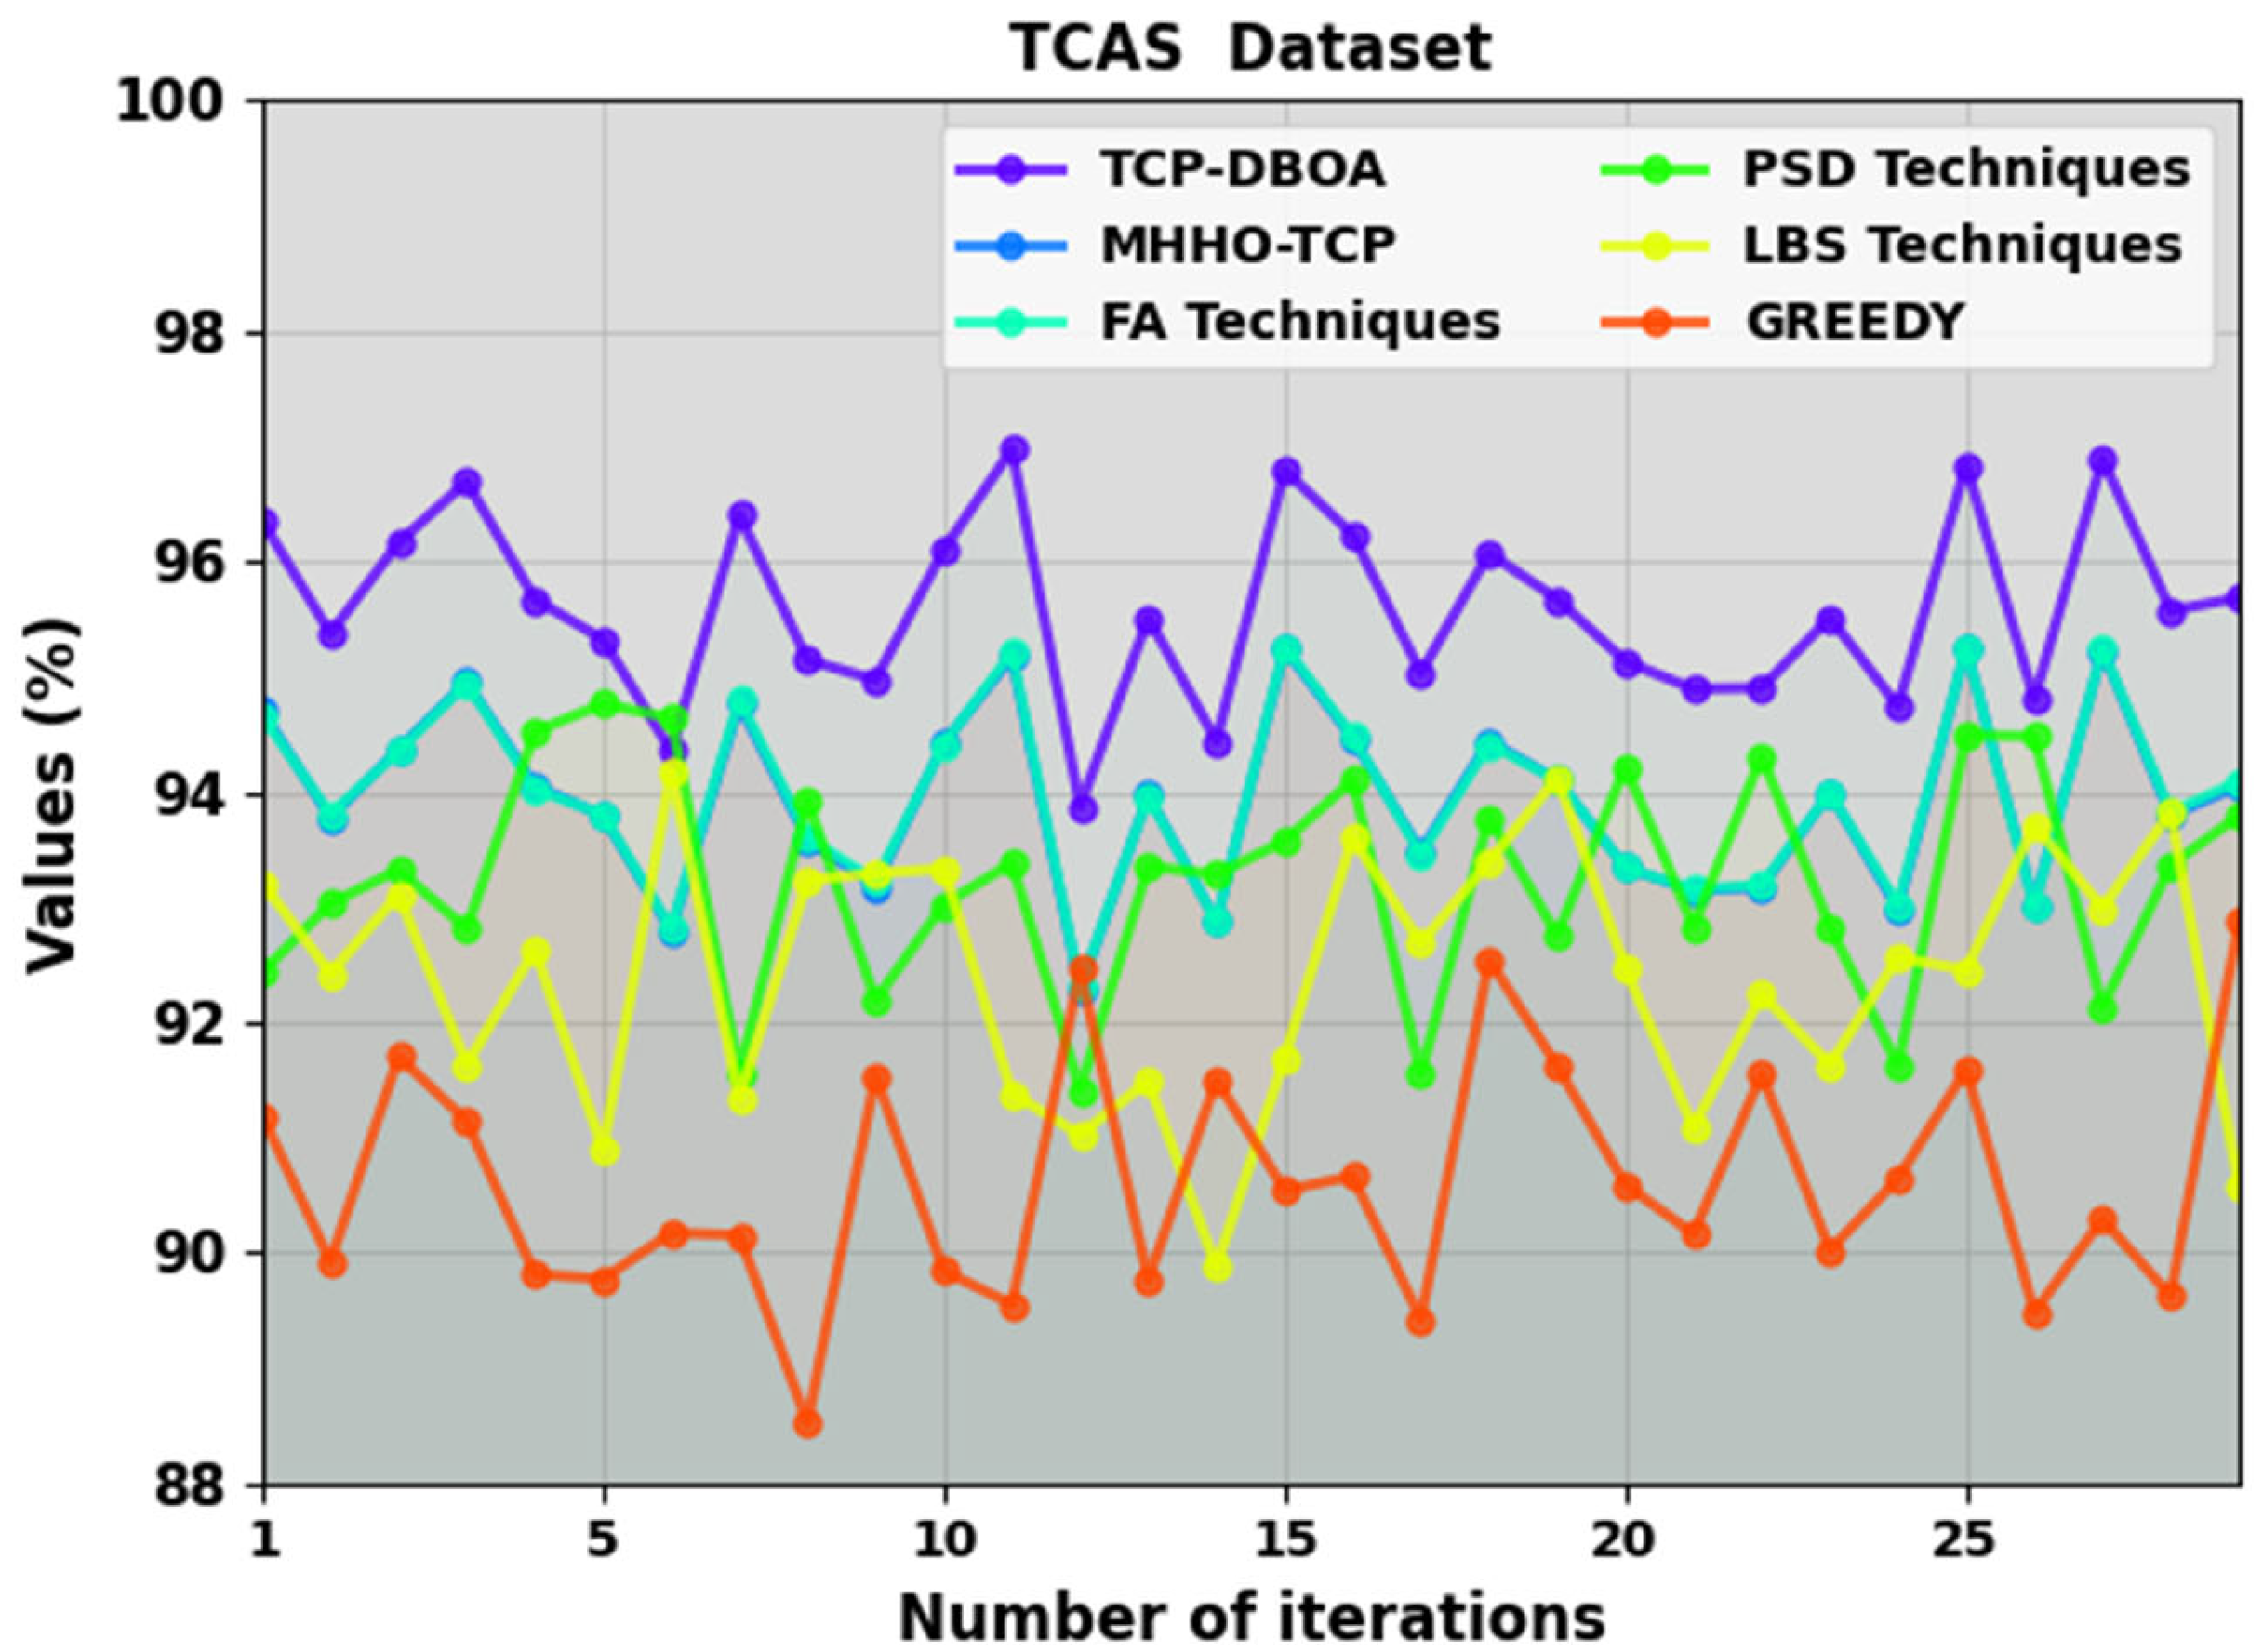
| TCAS Dataset | ||||||
|---|---|---|---|---|---|---|
| Number of Iterations | TCP-DBOA | MHHO-TCP | FA Techniques | PSD Techniques | LBS Techniques | Greedy |
| 1 | 96.35 | 94.70 | 94.66 | 92.43 | 93.21 | 91.19 |
| 2 | 95.37 | 93.77 | 93.80 | 93.03 | 92.42 | 89.92 |
| 3 | 96.16 | 94.37 | 94.35 | 93.32 | 93.11 | 91.70 |
| 4 | 96.69 | 94.95 | 94.94 | 92.81 | 91.63 | 91.14 |
| 5 | 95.67 | 94.05 | 94.02 | 94.52 | 92.63 | 89.81 |
| 6 | 95.32 | 93.79 | 93.80 | 94.76 | 90.89 | 89.77 |
| 7 | 94.35 | 92.79 | 92.81 | 94.64 | 94.18 | 90.17 |
| 8 | 96.40 | 94.76 | 94.80 | 91.55 | 91.34 | 90.15 |
| 9 | 95.14 | 93.58 | 93.61 | 93.93 | 93.23 | 88.52 |
| 10 | 94.97 | 93.18 | 93.22 | 92.19 | 93.29 | 91.54 |
| 11 | 96.10 | 94.42 | 94.41 | 93.02 | 93.33 | 89.84 |
| 12 | 96.97 | 95.17 | 95.21 | 93.38 | 91.38 | 89.55 |
| 13 | 93.87 | 92.28 | 92.30 | 91.41 | 91.02 | 92.46 |
| 14 | 95.51 | 93.97 | 93.96 | 93.35 | 91.49 | 89.76 |
| 15 | 94.44 | 92.87 | 92.87 | 93.28 | 89.87 | 91.50 |
| 16 | 96.79 | 95.24 | 95.26 | 93.57 | 91.69 | 90.54 |
| 17 | 96.23 | 94.46 | 94.48 | 94.10 | 93.60 | 90.66 |
| 18 | 95.03 | 93.48 | 93.45 | 91.55 | 92.68 | 89.42 |
| 19 | 96.07 | 94.44 | 94.41 | 93.78 | 93.39 | 92.54 |
| 20 | 95.67 | 94.10 | 94.10 | 92.75 | 94.12 | 91.62 |
| 21 | 95.13 | 93.34 | 93.34 | 94.22 | 92.47 | 90.59 |
| 22 | 94.89 | 93.14 | 93.15 | 92.83 | 91.08 | 90.16 |
| 23 | 94.90 | 93.17 | 93.19 | 94.31 | 92.24 | 91.55 |
| 24 | 95.51 | 93.99 | 93.99 | 92.83 | 91.63 | 90.02 |
| 25 | 94.74 | 92.98 | 93.02 | 91.62 | 92.56 | 90.64 |
| 26 | 96.84 | 95.25 | 95.25 | 94.49 | 92.45 | 91.59 |
| 27 | 94.80 | 93.02 | 93.00 | 94.48 | 93.71 | 89.48 |
| 28 | 96.89 | 95.23 | 95.24 | 92.13 | 92.99 | 90.29 |
| 29 | 95.57 | 93.79 | 93.82 | 93.36 | 93.82 | 89.62 |
| 30 | 95.68 | 94.05 | 94.09 | 93.79 | 90.58 | 92.87 |
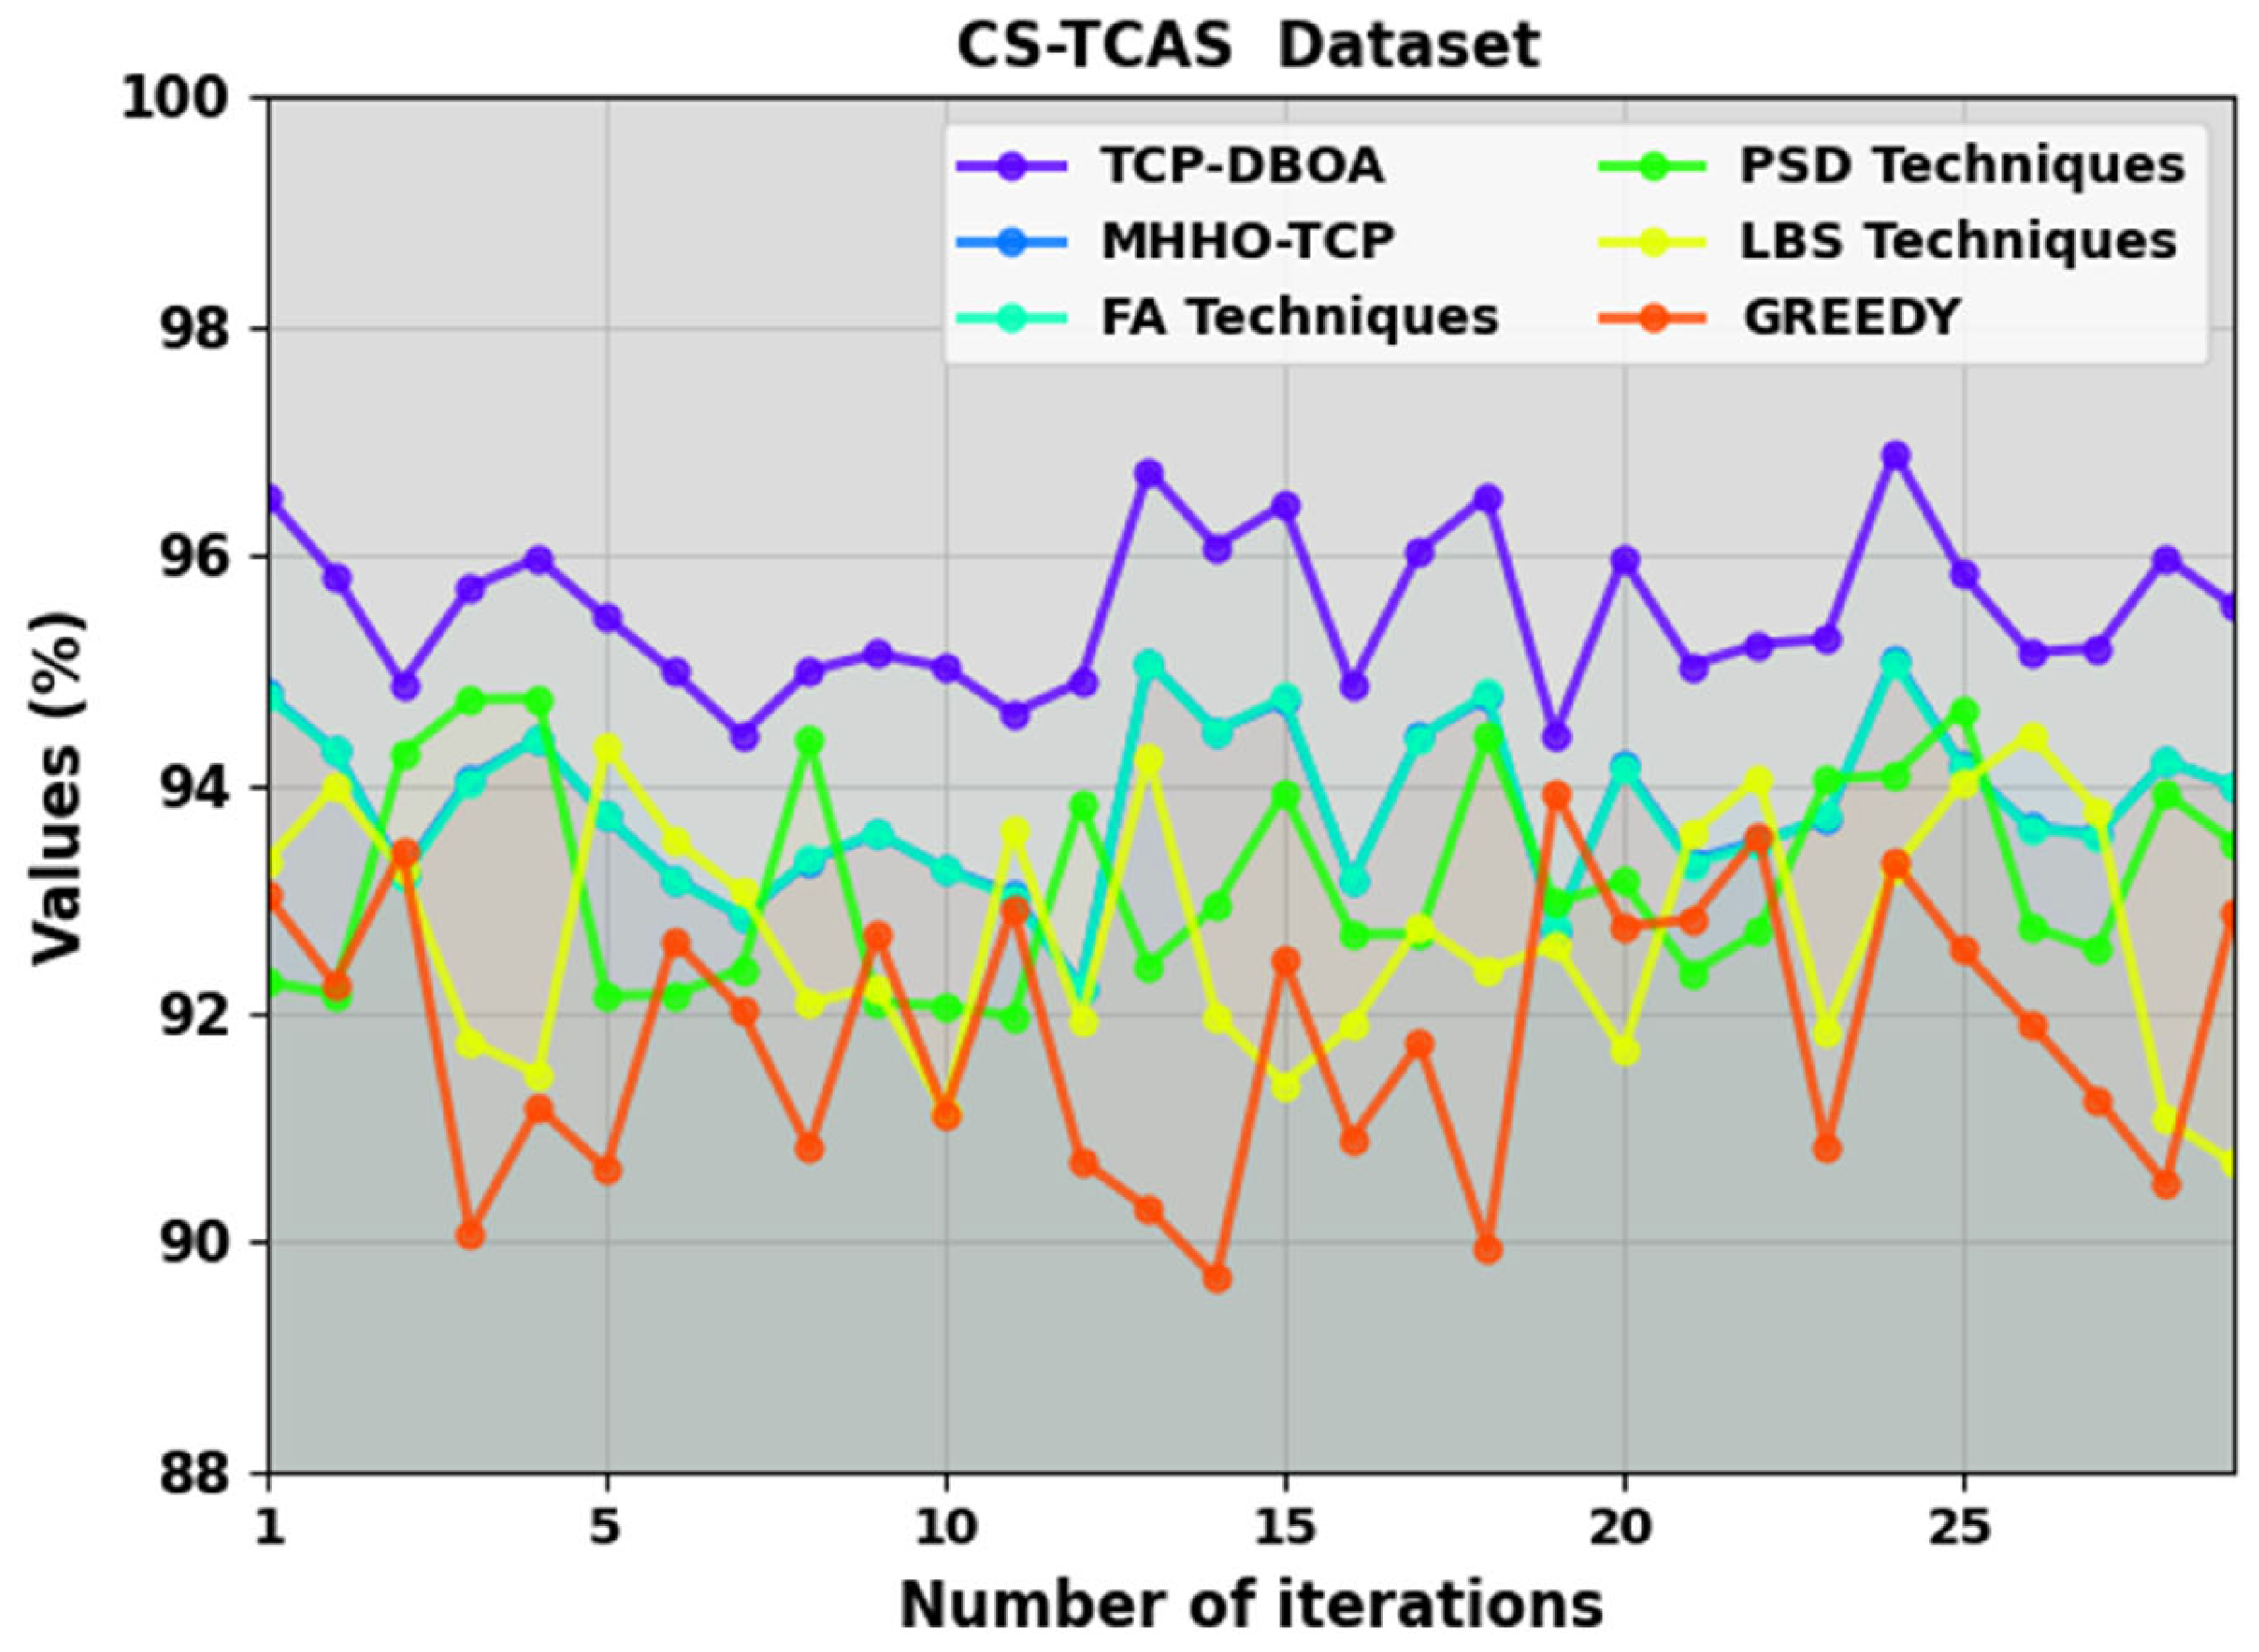
| CS-TCAS Dataset | ||||||
|---|---|---|---|---|---|---|
| Number of Iterations | TCP-DBOA | MHHO-TCP | FA Techniques | PSD Techniques | LBS Techniques | Greedy |
| 1 | 96.51 | 94.79 | 94.77 | 92.27 | 93.33 | 93.03 |
| 2 | 95.83 | 94.3 | 94.29 | 92.17 | 93.98 | 92.26 |
| 3 | 94.88 | 93.22 | 93.19 | 94.27 | 93.25 | 93.42 |
| 4 | 95.72 | 94.06 | 94.03 | 94.74 | 91.75 | 90.08 |
| 5 | 95.97 | 94.4 | 94.4 | 94.75 | 91.47 | 91.18 |
| 6 | 95.46 | 93.72 | 93.73 | 92.15 | 94.33 | 90.64 |
| 7 | 94.98 | 93.18 | 93.16 | 92.16 | 93.52 | 92.64 |
| 8 | 94.43 | 92.85 | 92.86 | 92.38 | 93.06 | 92.03 |
| 9 | 94.99 | 93.33 | 93.34 | 94.39 | 92.09 | 90.82 |
| 10 | 95.14 | 93.57 | 93.58 | 92.09 | 92.23 | 92.69 |
| 11 | 95.02 | 93.26 | 93.25 | 92.06 | 91.14 | 91.13 |
| 12 | 94.62 | 93.04 | 93.01 | 91.97 | 93.61 | 92.92 |
| 13 | 94.89 | 92.23 | 92.22 | 93.83 | 91.93 | 90.72 |
| 14 | 96.74 | 95.07 | 95.07 | 92.41 | 94.24 | 90.29 |
| 15 | 96.08 | 94.47 | 94.46 | 92.94 | 91.98 | 89.68 |
| 16 | 96.44 | 94.73 | 94.76 | 93.93 | 91.38 | 92.48 |
| 17 | 94.86 | 93.16 | 93.15 | 92.69 | 91.89 | 90.9 |
| 18 | 96.04 | 94.42 | 94.41 | 92.69 | 92.77 | 91.74 |
| 19 | 96.52 | 94.76 | 94.79 | 94.42 | 92.37 | 89.95 |
| 20 | 94.43 | 92.73 | 92.74 | 92.96 | 92.6 | 93.93 |
| 21 | 95.97 | 94.17 | 94.15 | 93.15 | 91.67 | 92.75 |
| 22 | 95.04 | 93.33 | 93.3 | 92.35 | 93.56 | 92.82 |
| 23 | 95.22 | 93.5 | 93.47 | 92.71 | 94.06 | 93.55 |
| 24 | 95.27 | 93.69 | 93.72 | 94.04 | 91.85 | 90.82 |
| 25 | 96.9 | 95.1 | 95.06 | 94.08 | 93.27 | 93.32 |
| 26 | 95.84 | 94.16 | 94.15 | 94.66 | 94.01 | 92.55 |
| 27 | 95.15 | 93.63 | 93.62 | 92.76 | 94.43 | 91.91 |
| 28 | 95.19 | 93.56 | 93.55 | 92.55 | 93.77 | 91.25 |
| 29 | 95.98 | 94.2 | 94.2 | 93.92 | 91.07 | 90.51 |
| 30 | 95.56 | 93.99 | 93.99 | 93.49 | 90.69 | 92.89 |
| ATE (min) | ||||
|---|---|---|---|---|
| Methods | GZIP | GREP | TCAS | CS-TCAS |
| TCP-DBOA | 1.50 | 1.95 | 4.69 | 7.53 |
| MHHO-TCP | 3.12 | 3.75 | 6.37 | 9.29 |
| FA Techniques | 4.05 | 4.76 | 7.67 | 10.63 |
| PSD Techniques | 5.92 | 6.88 | 14.38 | 21.09 |
| LBS Techniques | 3.96 | 4.89 | 7.61 | 10.95 |
| Greedy | 4.57 | 4.96 | 8.73 | 11.76 |
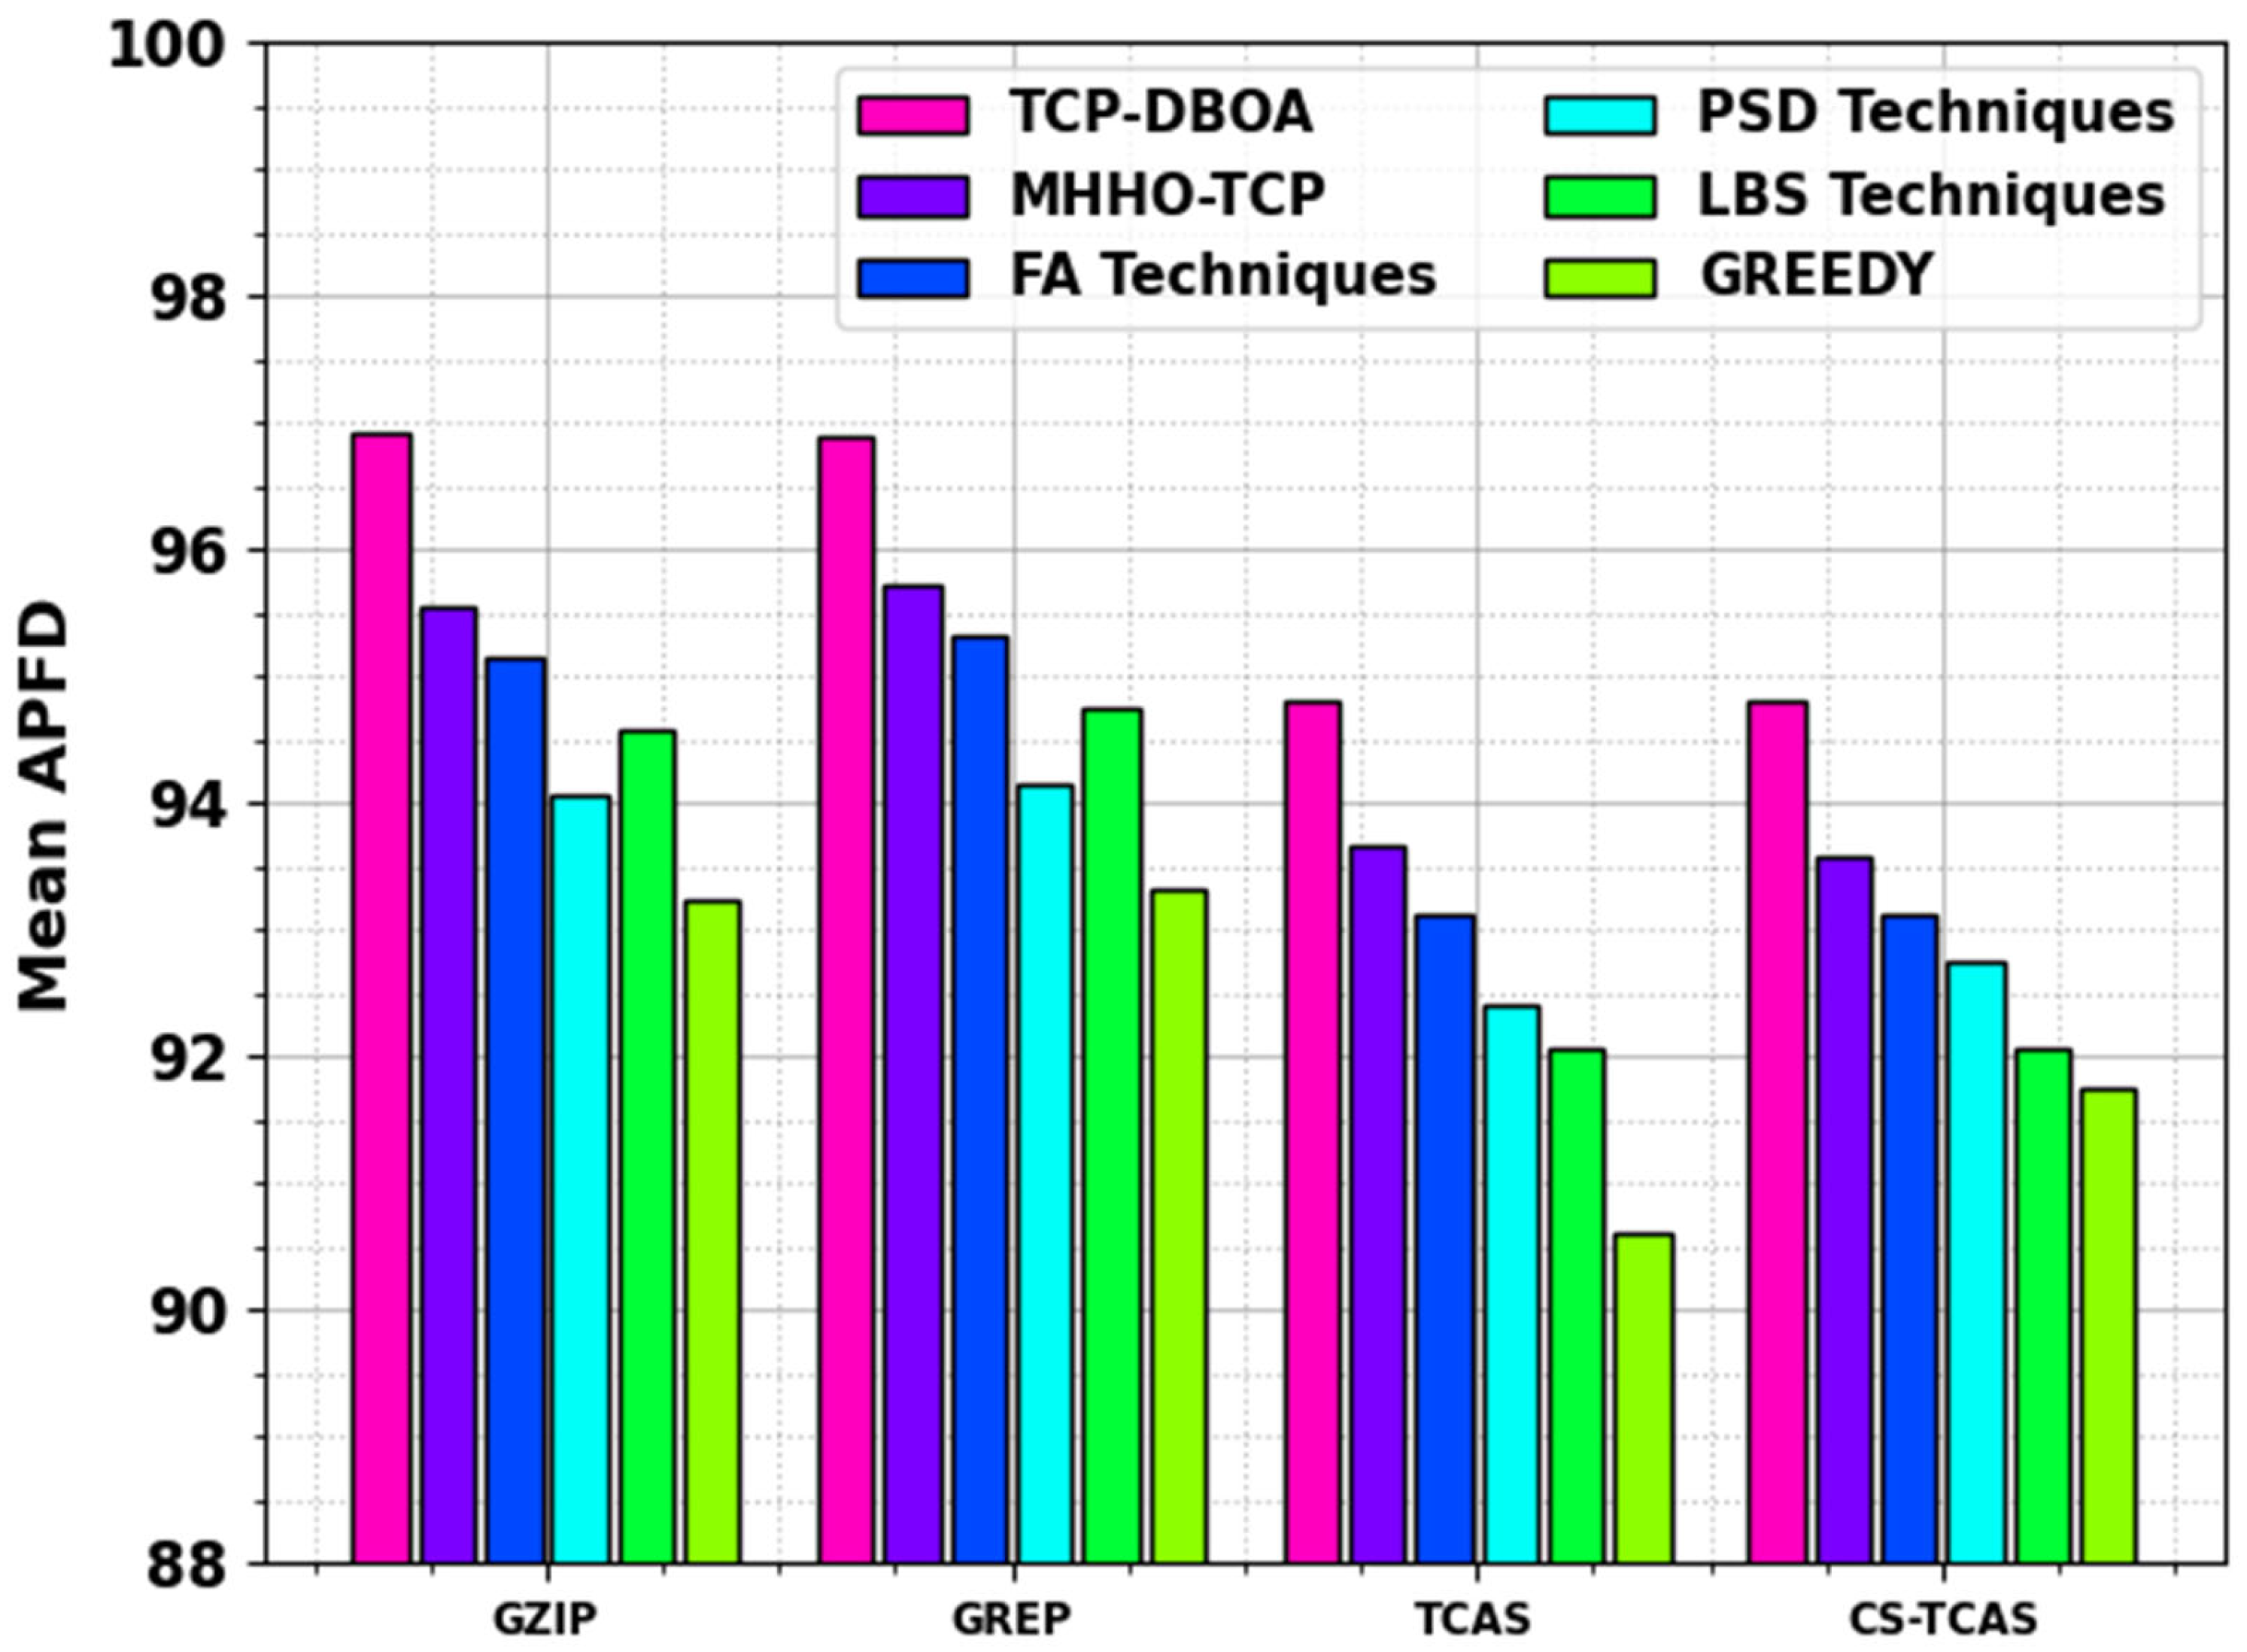
| Mean APFD | ||||
|---|---|---|---|---|
| Methods | GZIP | GREP | TCAS | CS-TCAS |
| TCP-DBOA | 96.92 | 96.90 | 94.80 | 94.80 |
| MHHO-TCP | 95.56 | 95.72 | 93.65 | 93.57 |
| FA Techniques | 95.16 | 95.32 | 93.12 | 93.13 |
| PSD Techniques | 94.05 | 94.16 | 92.40 | 92.74 |
| LBS Techniques | 94.57 | 94.76 | 92.07 | 92.07 |
| Greedy | 93.22 | 93.33 | 90.60 | 91.74 |
| CT (s) | ||||
|---|---|---|---|---|
| Methods | GZIP | GREP | TCAS | CS-TCAS |
| TCP-DBOA | 7.95 | 6.34 | 8.23 | 6.40 |
| MHHO-TCP | 10.97 | 14.42 | 22.83 | 19.88 |
| FA Techniques | 13.43 | 15.73 | 10.51 | 22.06 |
| PSD Techniques | 23.86 | 17.85 | 12.35 | 11.72 |
| LBS Techniques | 19.34 | 27.21 | 12.36 | 23.68 |
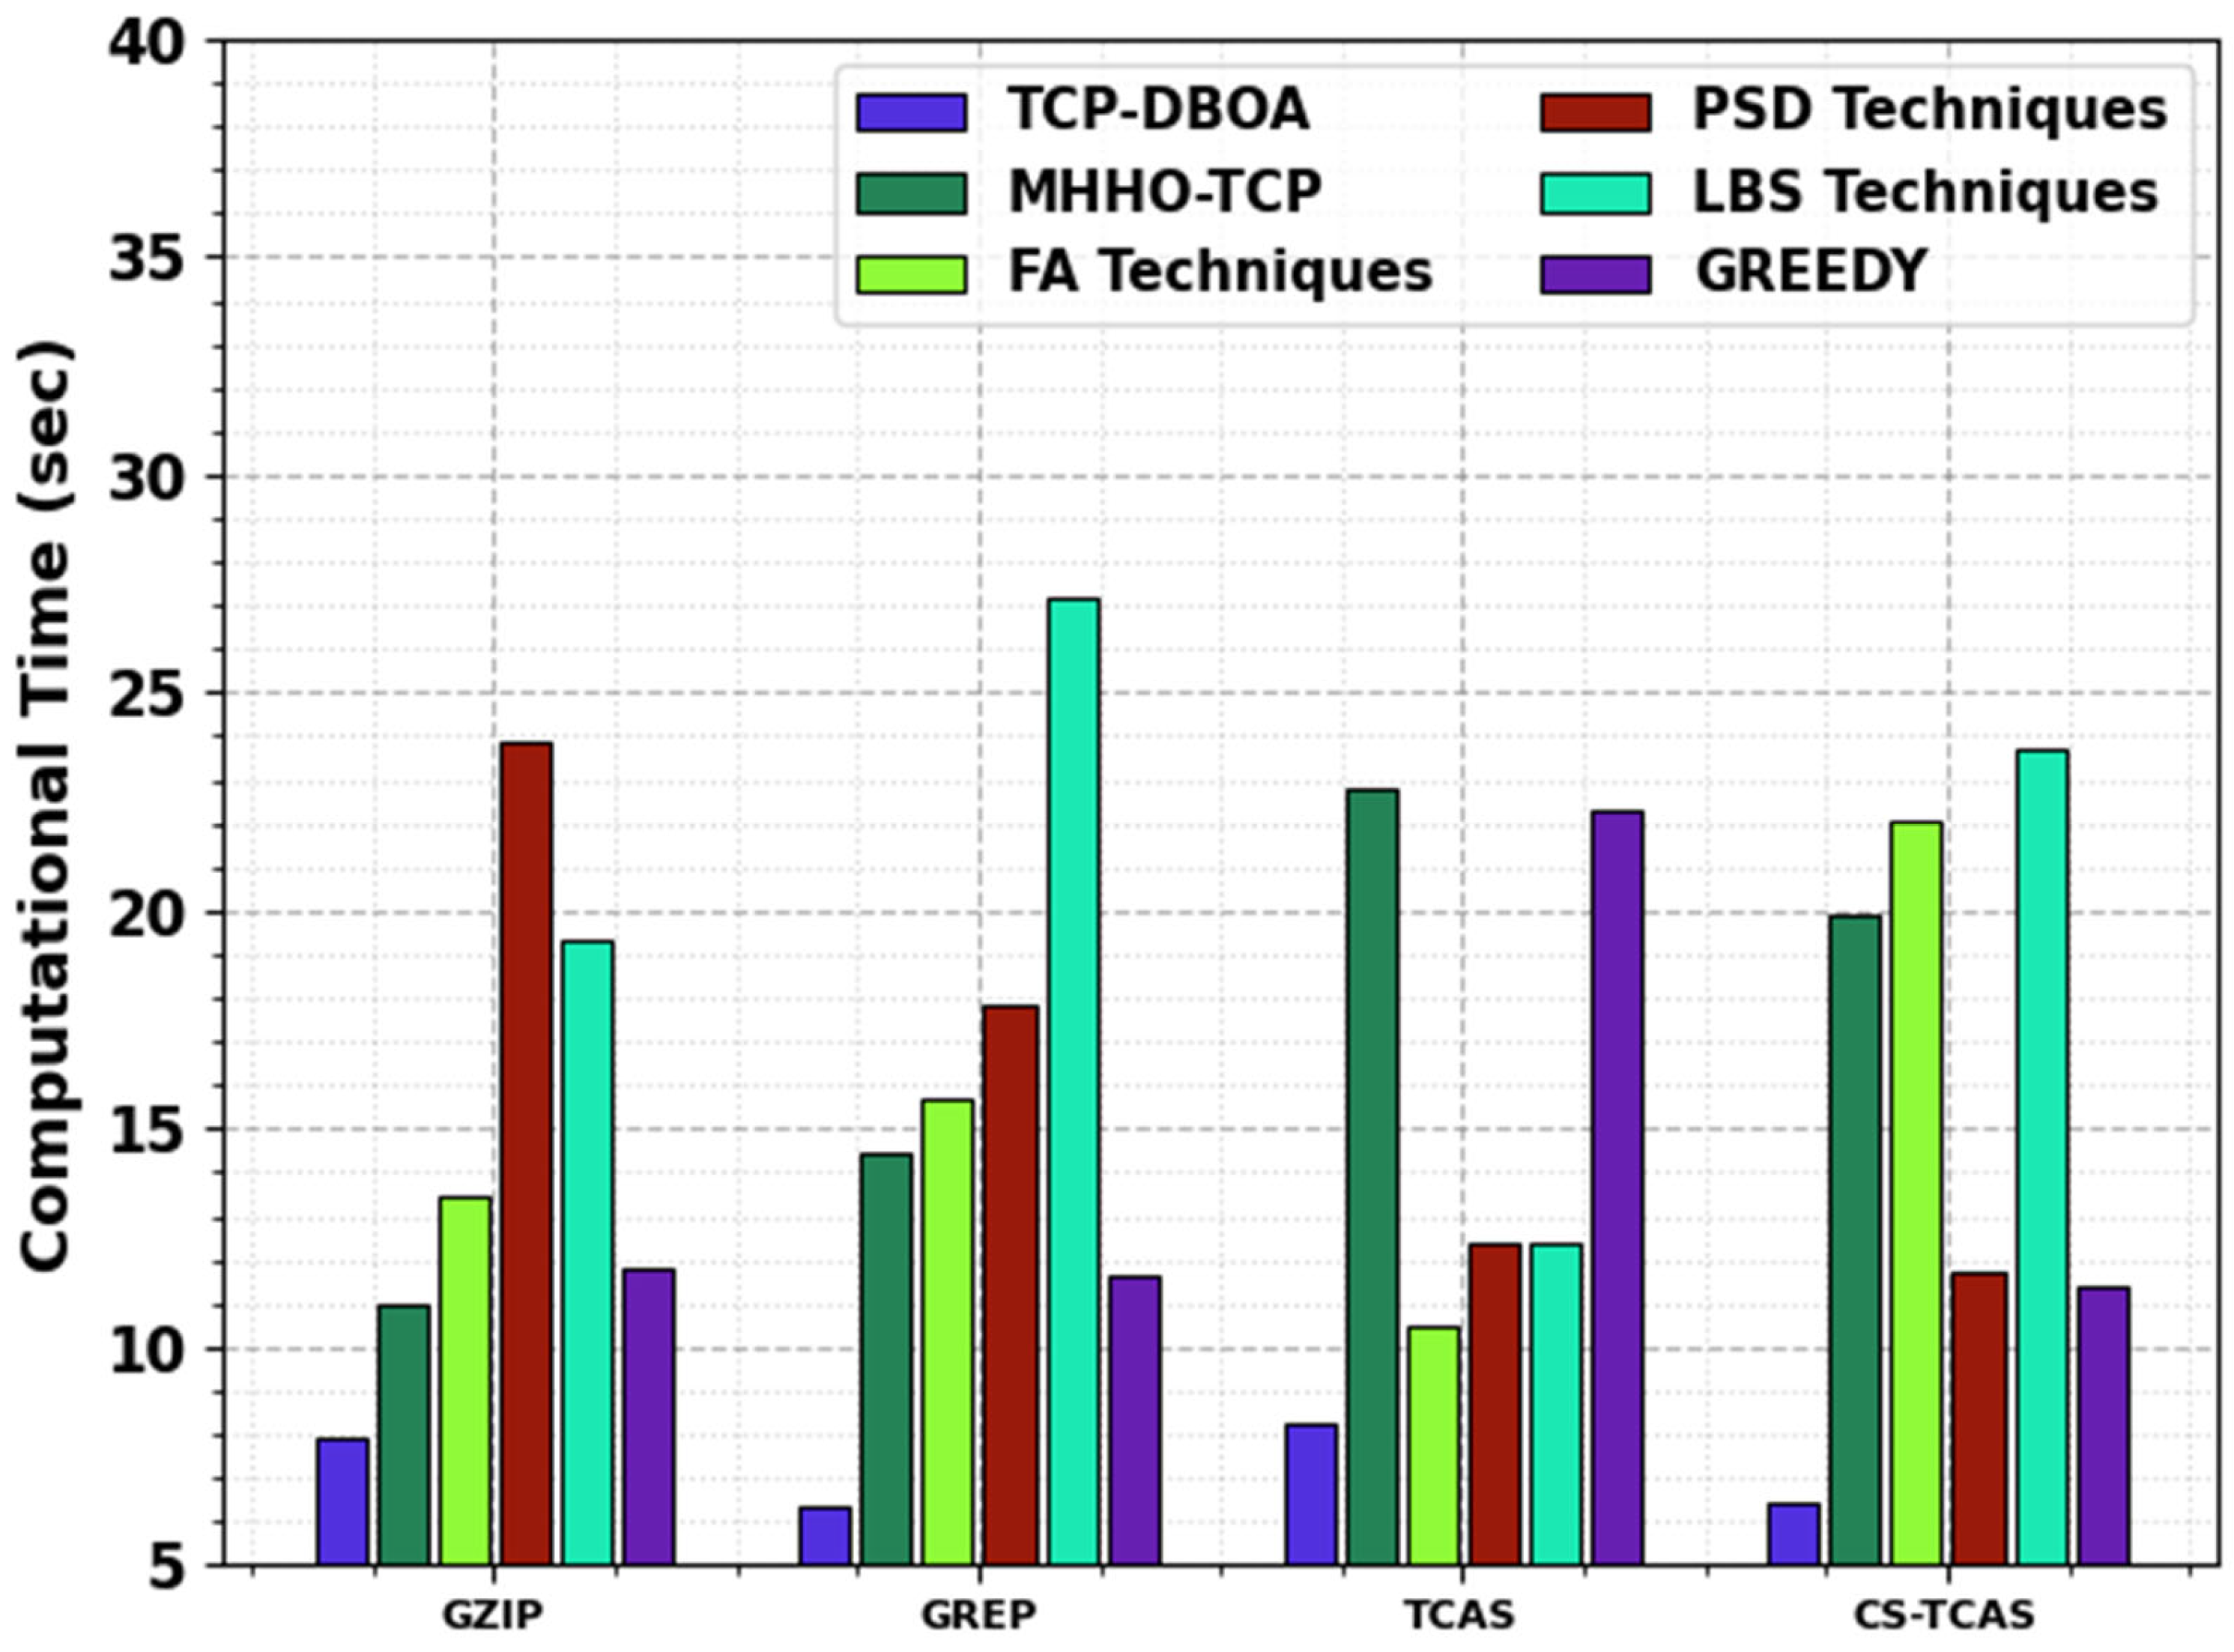
| Greedy | 11.84 | 11.61 | 22.29 | 11.35 |
Disclaimer/Publisher’s Note: The statements, opinions and data contained in all publications are solely those of the individual author(s) and contributor(s) and not of MDPI and/or the editor(s). MDPI and/or the editor(s) disclaim responsibility for any injury to people or property resulting from any ideas, methods, instructions or products referred to in the content. |
© 2025 by the author. Licensee MDPI, Basel, Switzerland. This article is an open access article distributed under the terms and conditions of the Creative Commons Attribution (CC BY) license (https://creativecommons.org/licenses/by/4.0/).
Share and Cite
Assiri, M. Test Case Prioritization Using Dragon Boat Optimization for Software Quality Testing. Electronics 2025, 14, 1524. https://doi.org/10.3390/electronics14081524
Assiri M. Test Case Prioritization Using Dragon Boat Optimization for Software Quality Testing. Electronics. 2025; 14(8):1524. https://doi.org/10.3390/electronics14081524
Chicago/Turabian StyleAssiri, Mohammed. 2025. "Test Case Prioritization Using Dragon Boat Optimization for Software Quality Testing" Electronics 14, no. 8: 1524. https://doi.org/10.3390/electronics14081524
APA StyleAssiri, M. (2025). Test Case Prioritization Using Dragon Boat Optimization for Software Quality Testing. Electronics, 14(8), 1524. https://doi.org/10.3390/electronics14081524