
Artificial Intelligence-Driven Optimal Charging Strategy for Electric Vehicles and Impacts on Electric Power Grid


Abstract
1. Introduction
2. Methods
2.1. EV Charging Data Preprocessing
2.1.1. Spearman’s Correlation Coefficient
2.1.2. Feature Selection
2.2. Quality Control of Data
2.3. Artificial Intelligence Model
Feedforward Fully Connected ANN Model
2.4. Model Evaluation
2.5. Optimization
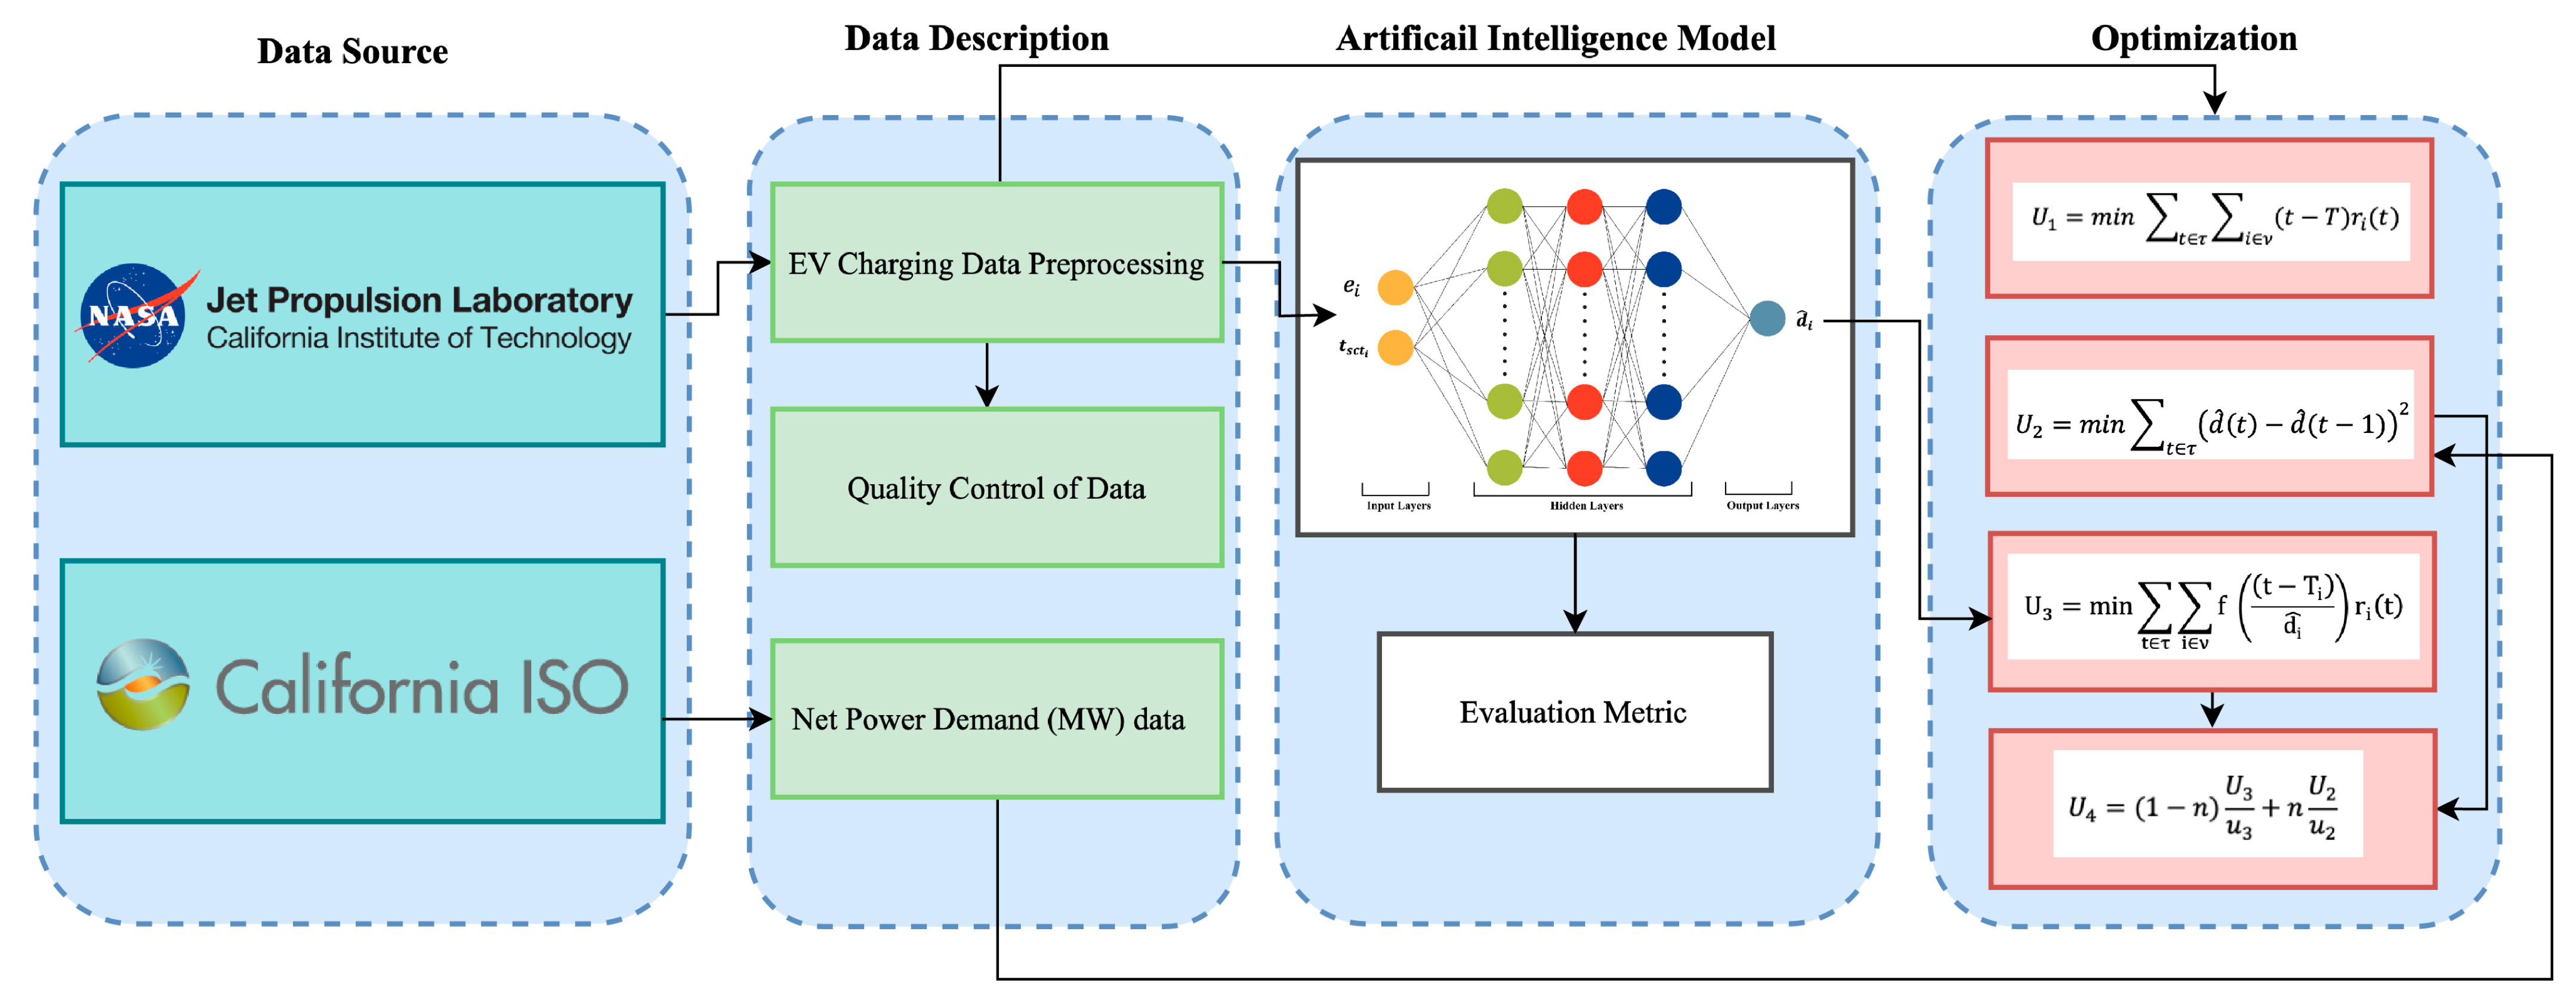
2.6. Computational Framework
3. Results and Discussion
- (a)
- Correlation analysis;
- (b)
- Data visualization for quality control;
- (c)
- Prediction of charging duration by FFC-ANN model;
- (d)
- Comparison of the FFC-ANN model with other AI models;
- (e)
- Optimization of power by different objective functions;
- (f)
- Impacts of EV integration on electric power grid.
3.1. Correlation Analysis
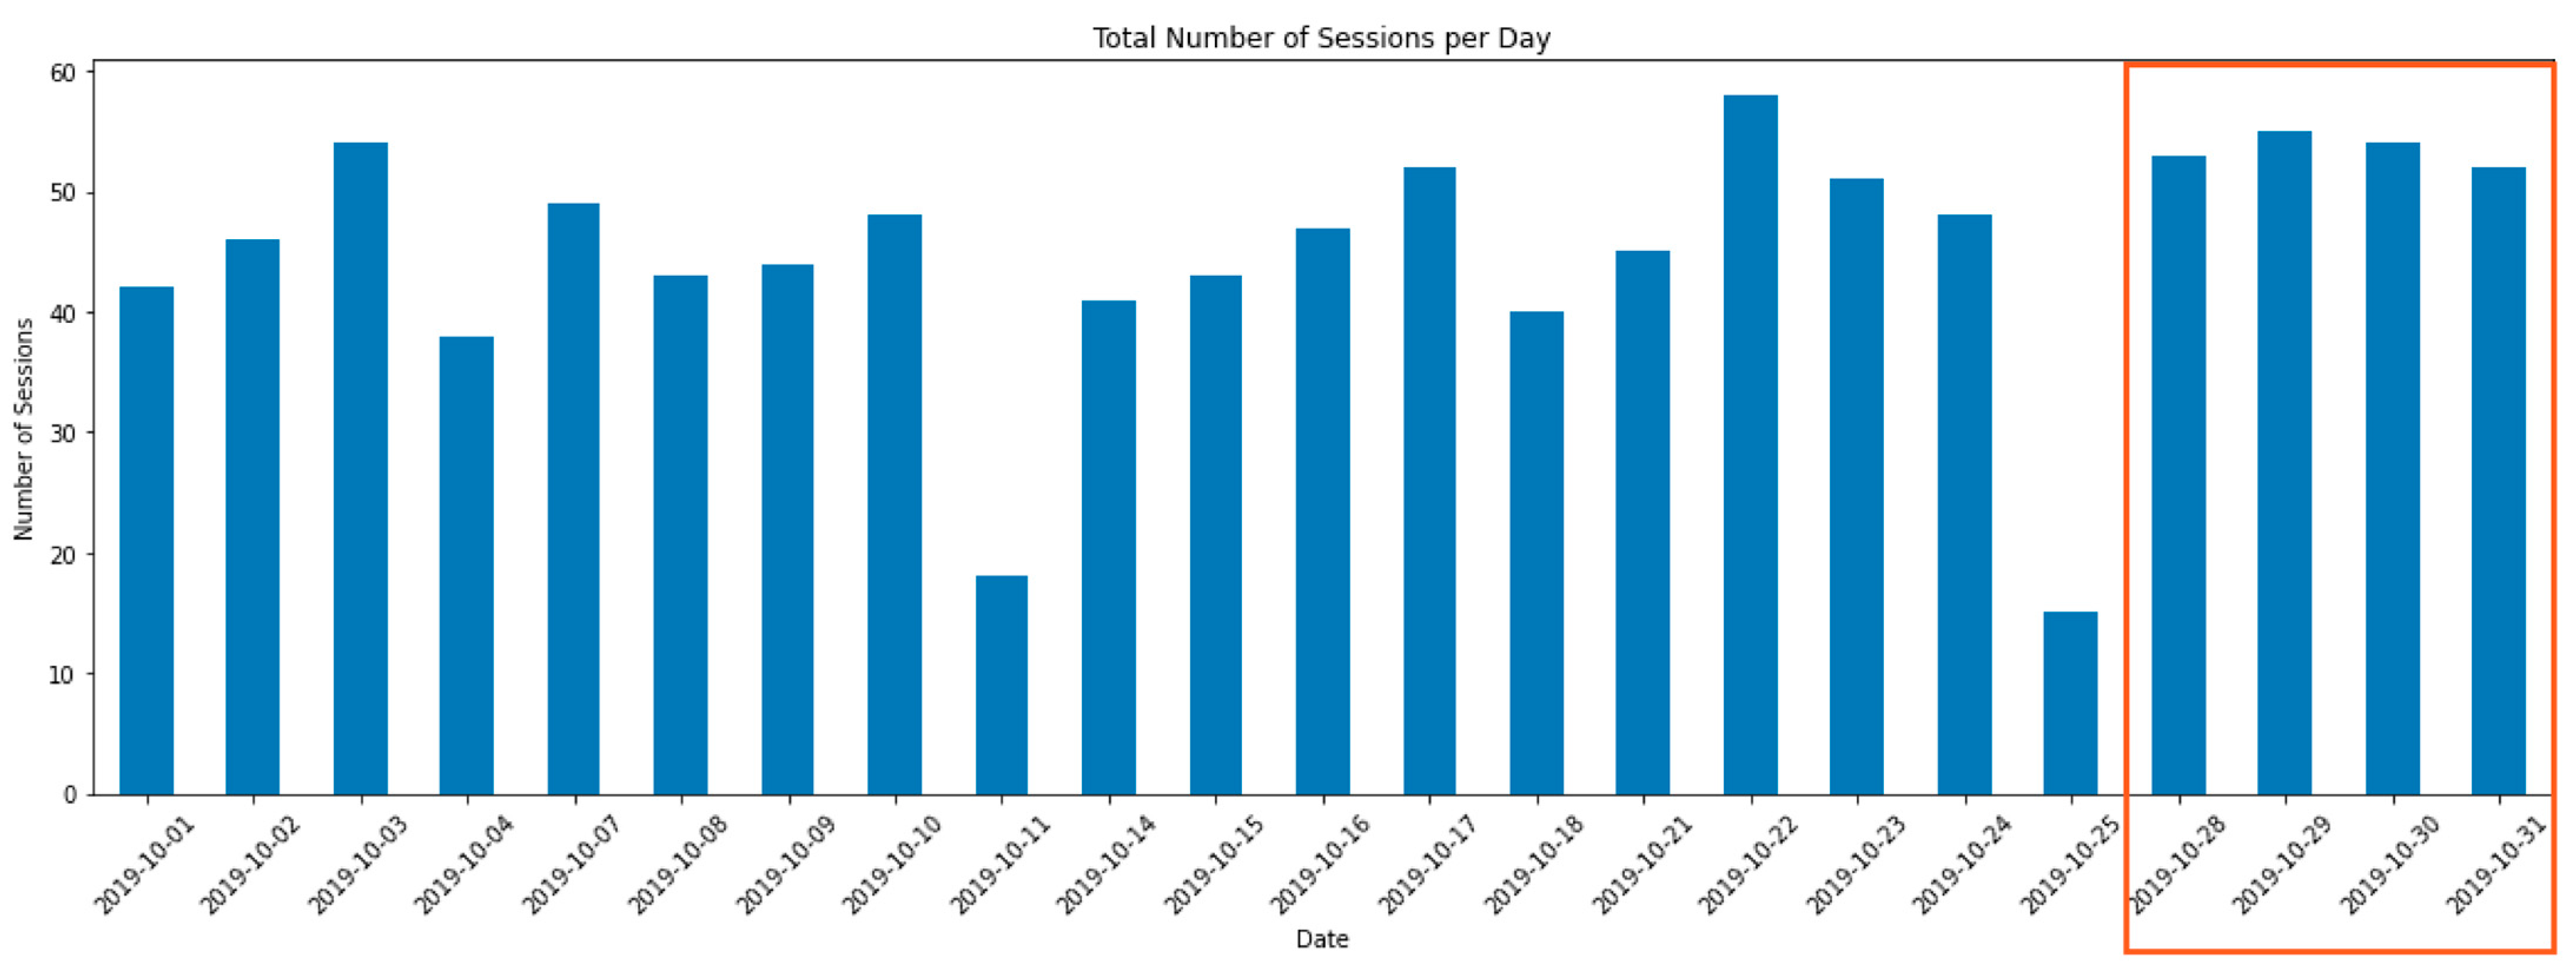
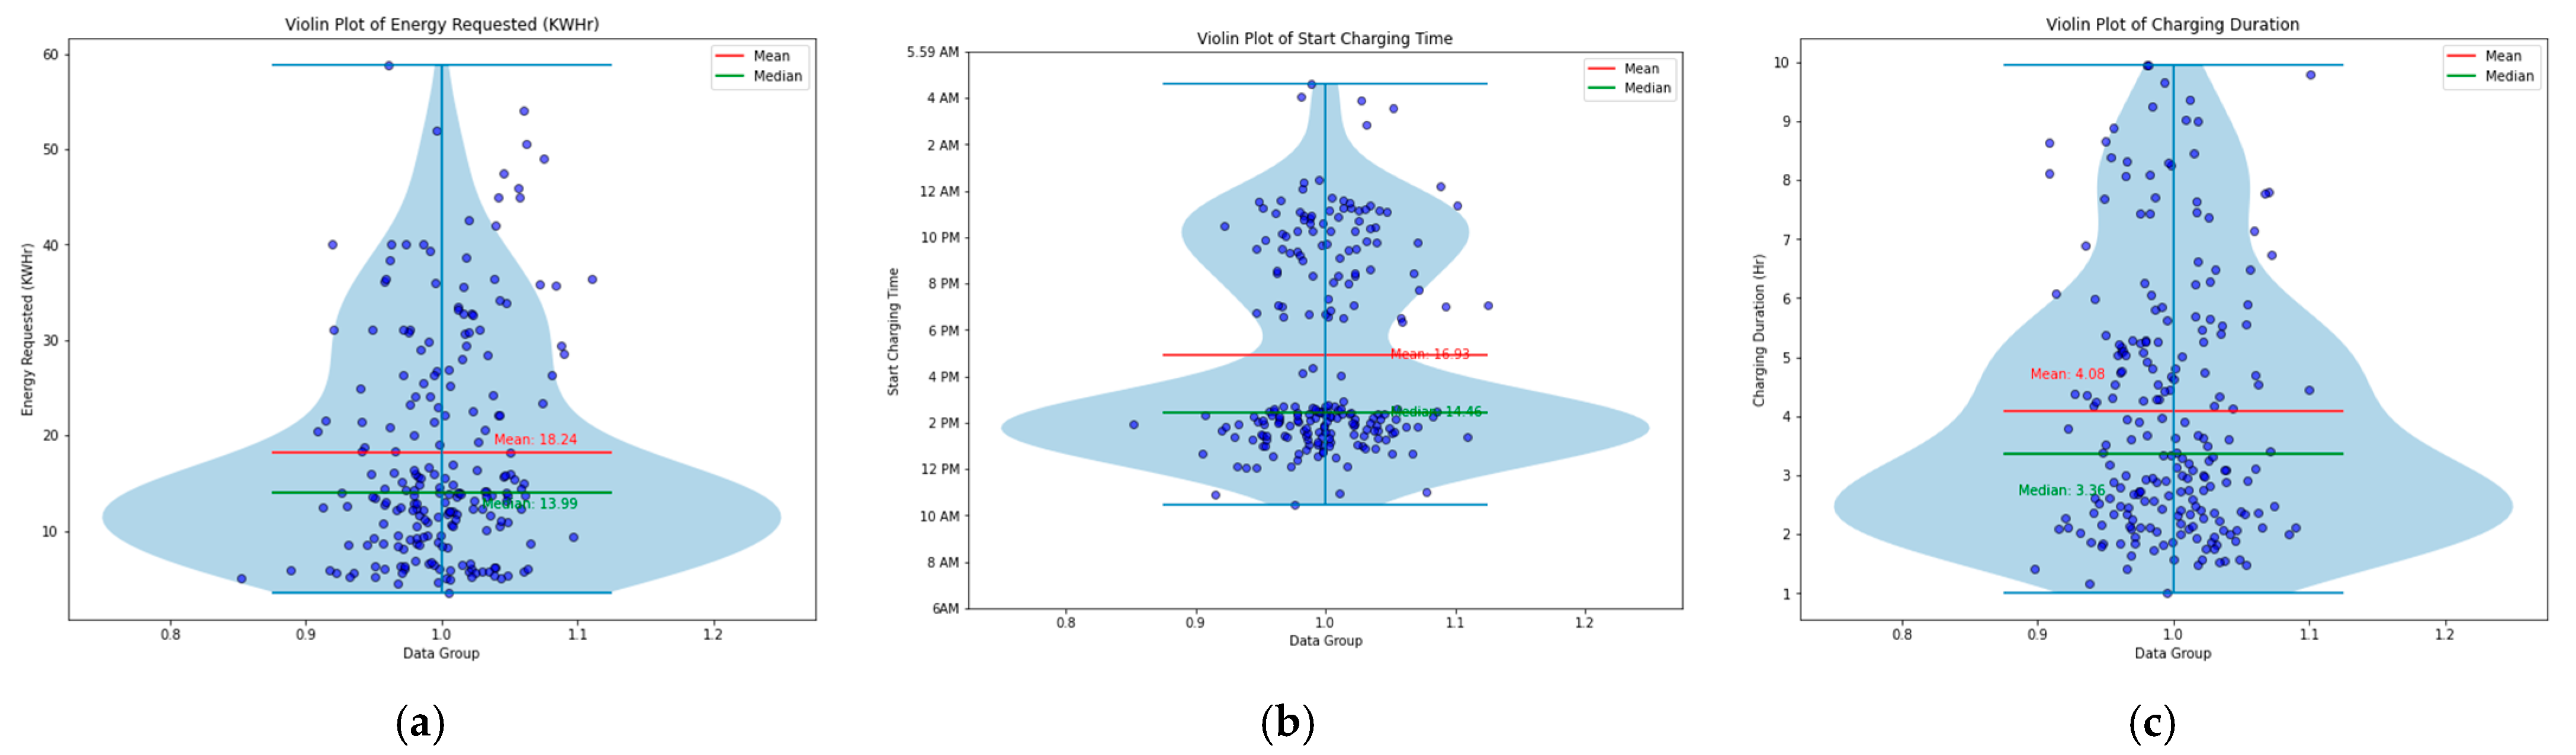
3.2. Data Visualization for Quality Control
3.3. Prediction of Charging Duration by FFC-ANN Model
3.4. Comparison of the FFC-ANN Model with Other AI Models
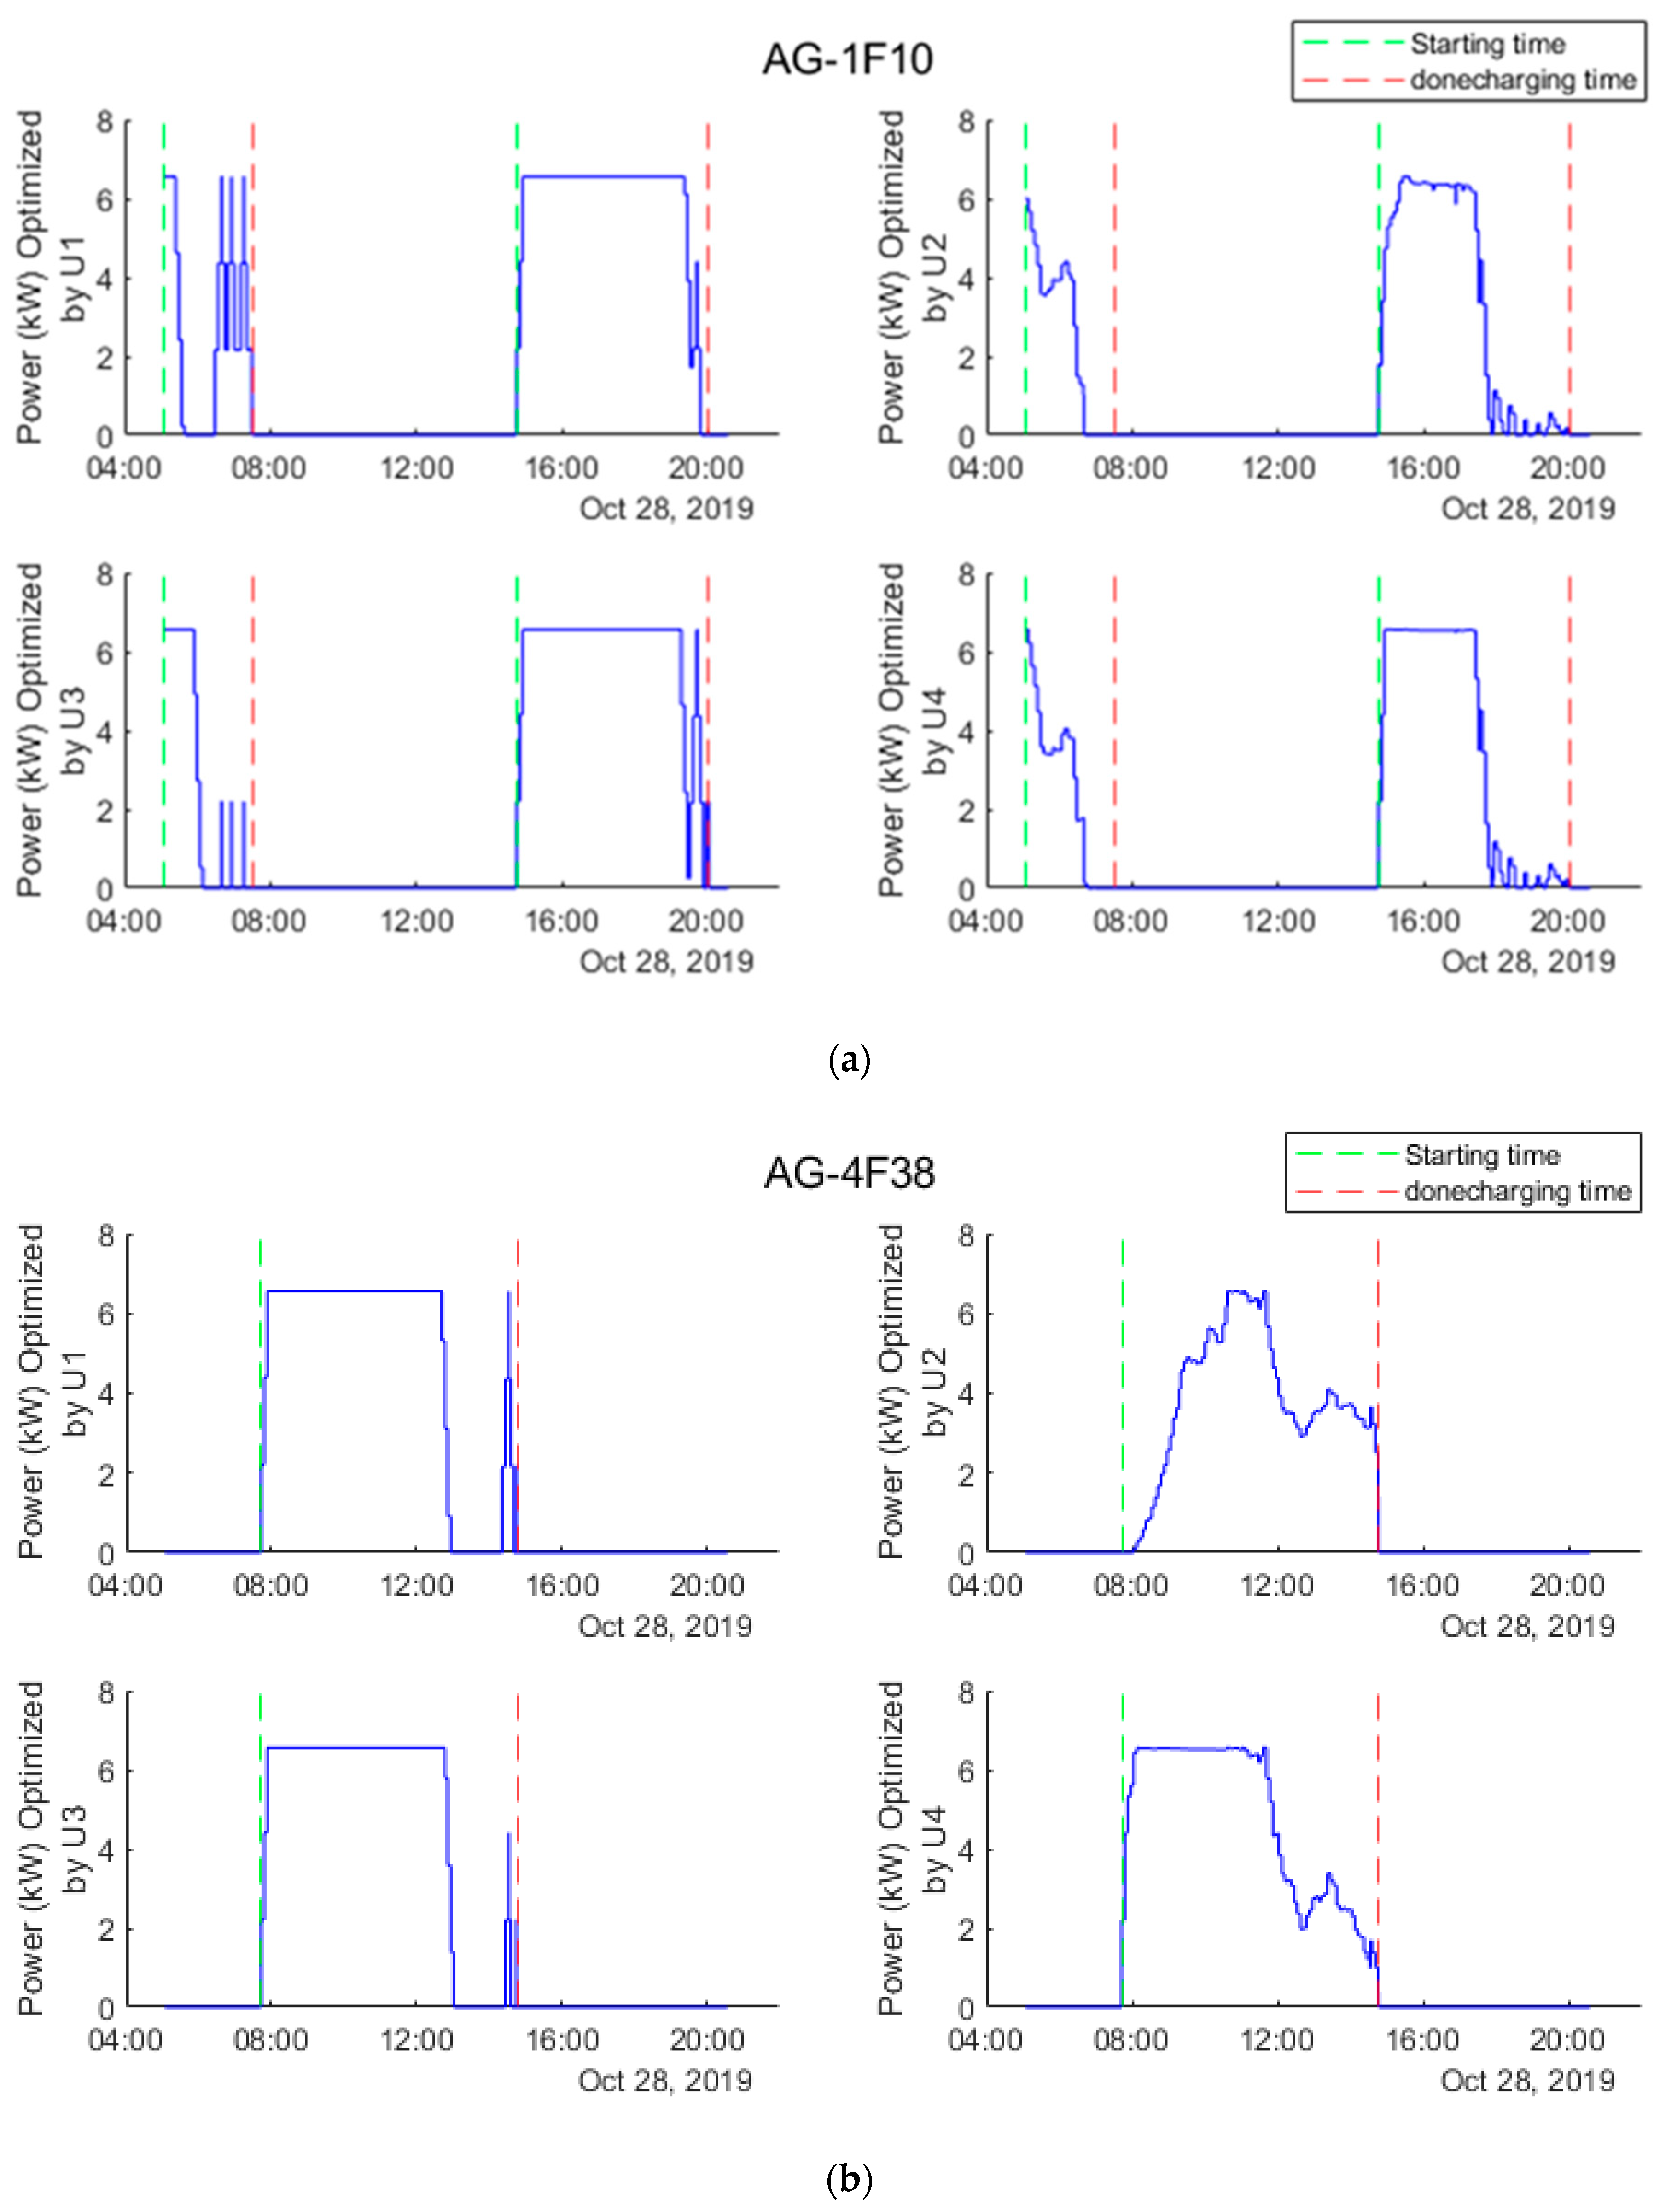
3.5. Optimization of Power by Different Objective Functions
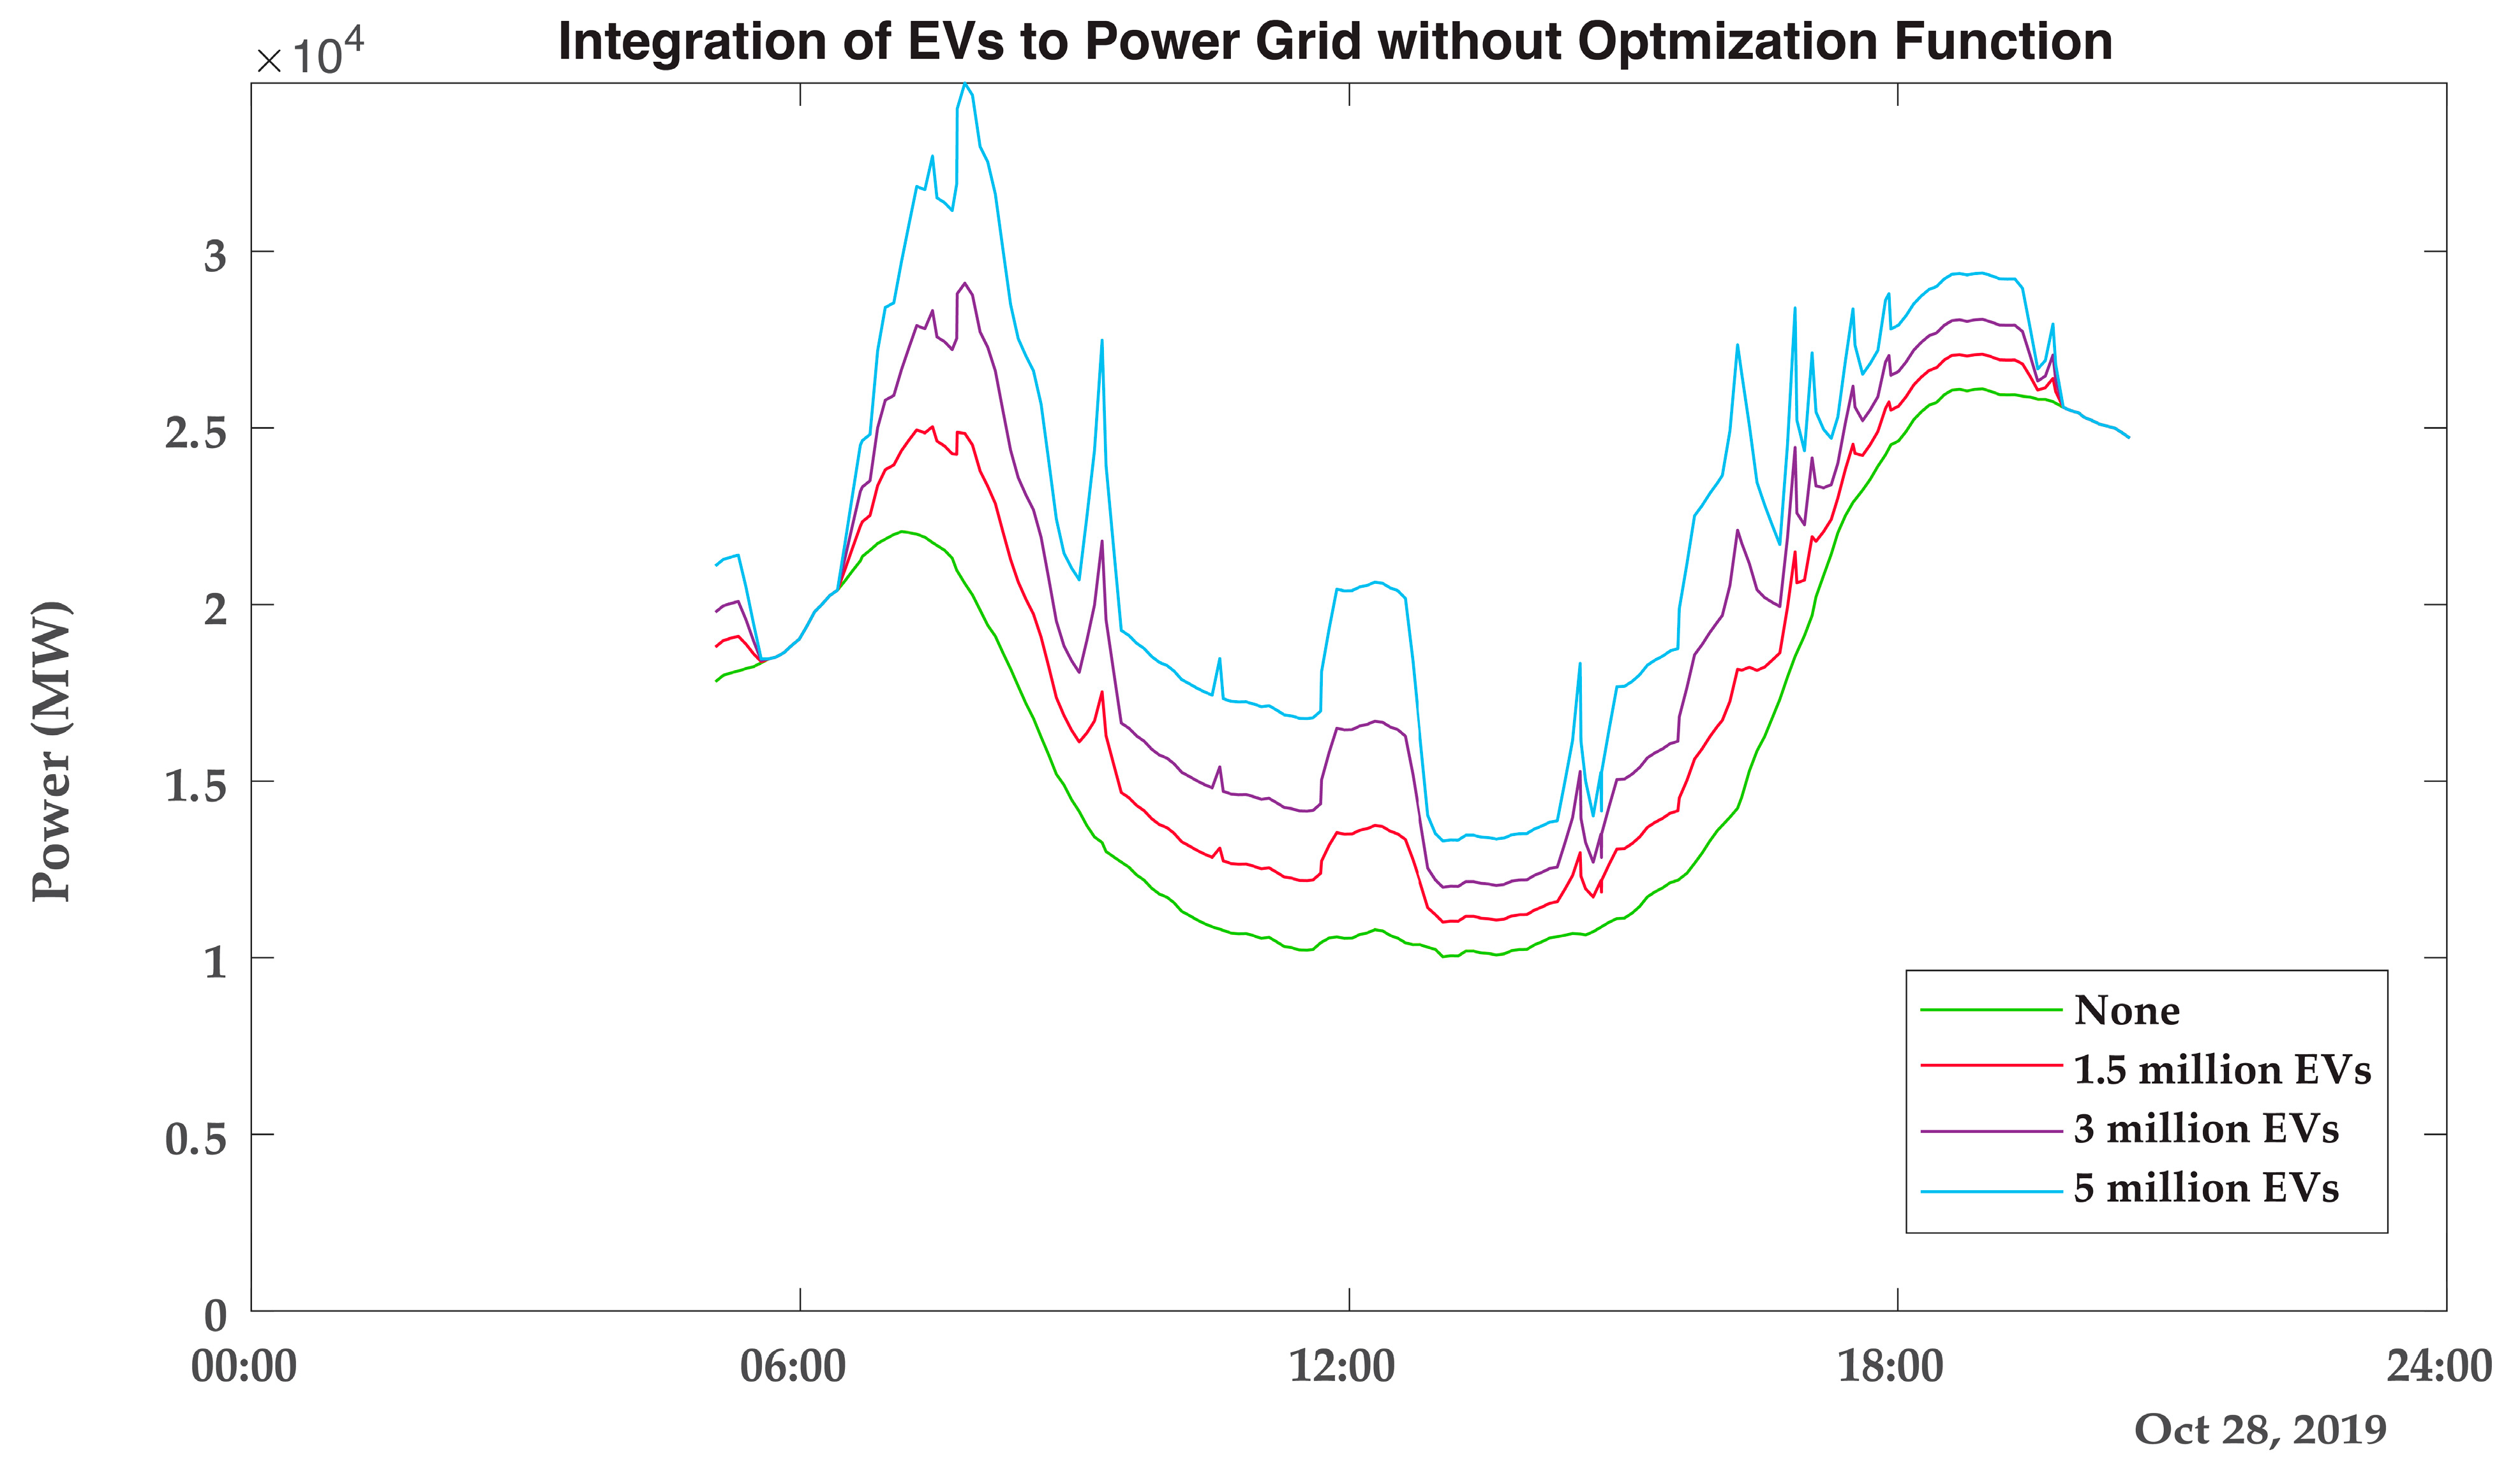
3.6. Impacts of EV Integration on Electric Power Grid
4. Conclusions
Author Contributions
Funding
Data Availability Statement
Conflicts of Interest
References
- U.S. Energy Information Administration. Use of Energy Explained. Available online: https://www.eia.gov/energyexplained/use-of-energy/transportation-in-depth.php (accessed on 12 January 2025).
- Mohanty, S.; Panda, S.; Parida, S.M.; Rout, P.K.; Sahu, B.K.; Bajaj, M.; Zawbaa, H.M.; Kumar, N.M.; Kamel, S. Demand side management of electric vehicles in smart grids: A survey on strategies, challenges, modeling, and optimization. Energy Rep. 2022, 8, 12466–12490. [Google Scholar]
- Das, H.S.; Rahman, M.M.; Li, S.; Tan, C. Electric vehicles standards, charging infrastructure, and impact on grid integration: A technological review. Renew. Sustain. Energy Rev. 2020, 120, 109618. [Google Scholar] [CrossRef]
- Rajper, S.Z.; Albrecht, J. Prospects of electric vehicles in the developing countries: A literature review. Sustainability 2020, 12, 1906. [Google Scholar] [CrossRef]
- Rapson, D.S.; Muehlegger, E. The economics of electric vehicles. Rev. Environ. Econ. Policy 2023, 17, 274–294. [Google Scholar] [CrossRef]
- Ahmad, A.; Khalid, M.; Ullah, Z.; Ahmad, N.; Aljaidi, M.; Malik, F.A.; Manzoor, U. Electric vehicle charging modes, technologies and applications of smart charging. Energies 2022, 15, 9471. [Google Scholar] [CrossRef]
- Tie, S.F.; Tan, C.W. A review of energy sources and energy management system in electric vehicles. Renew. Sustain. Energy Rev. 2013, 20, 82–102. [Google Scholar]
- Hussain, M.T.; Sulaiman, N.B.; Hussain, M.S.; Jabir, M. Optimal Management strategies to solve issues of grid having Electric Vehicles (EV): A review. J. Energy Storage 2021, 33, 102114. [Google Scholar]
- Elghanam, E.; Abdelfatah, A.; Hassan, M.S.; OSMAN, A. Optimization techniques in electric vehicle charging scheduling, routing and spatio-temporal demand coordination: A systematic review. IEEE Open J. Veh. Technol. 2024, 5, 1294–1313. [Google Scholar]
- Zhao, Y.; Guo, Y.; Guo, Q.; Zhang, H.; Sun, H. Deployment of the electric vehicle charging station considering existing competitors. IEEE Trans. Smart Grid 2020, 11, 4236–4248. [Google Scholar]
- Xiong, Y.; An, B.; Kraus, S. Electric vehicle charging strategy study and the application on charging station placement. Auton. Agents Multi-Agent Syst. 2021, 35, 1–19. [Google Scholar]
- Moghaddam, Z.; Ahmad, I.; Habibi, D.; Phung, Q.V. Smart charging strategy for electric vehicle charging stations. IEEE Trans. Transp. Electrif. 2017, 4, 76–88. [Google Scholar] [CrossRef]
- Hanemann, P.; Behnert, M.; Bruckner, T. Effects of electric vehicle charging strategies on the German power system. Appl. Energy 2017, 203, 608–622. [Google Scholar] [CrossRef]
- Soliman, I.A.; Tulsky, V.; Abd el-Ghany, H.A.; ElGebaly, A.E. Efficient allocation of capacitors and vehicle-to-grid integration with electric vehicle charging stations in radial distribution networks. Appl. Energy 2025, 377, 124745. [Google Scholar] [CrossRef]
- Ramkumar, A.; Rajesh, K. A design analysis of EV charging using multiport converter and control strategy using MWOA. J. Energy Storage 2025, 106, 114735. [Google Scholar]
- Lepolesa, L.J.; Adetunji, K.E.; Ouahada, K.; Liu, Z.; Cheng, L. Optimal EV Charging Strategy for Distribution Networks Load Balancing in a Smart Grid Using Dynamic Charging Price. IEEE Access 2024, 12, 47421–47432. [Google Scholar] [CrossRef]
- Khan, M.R.; Haider, Z.M.; Malik, F.H.; Almasoudi, F.M.; Alatawi, K.S.S.; Bhutta, M.S. A comprehensive review of microgrid energy management strategies considering electric vehicles, energy storage systems, and AI techniques. Processes 2024, 12, 270. [Google Scholar] [CrossRef]
- Yadav, K.; Singh, M. A novel energy management of public charging stations using attention-based deep learning model. Electr. Power Syst. Res. 2025, 238, 111090. [Google Scholar] [CrossRef]
- Arévalo, P.; Ochoa-Correa, D.; Villa-Ávila, E. A systematic review on the integration of artificial intelligence into energy management systems for electric vehicles: Recent advances and future perspectives. World Electr. Veh. J. 2024, 15, 364. [Google Scholar] [CrossRef]
- Recalde, A.; Cajo, R.; Velasquez, W.; Alvarez-Alvarado, M.S. Machine Learning and Optimization in Energy Management Systems for Plug-In Hybrid Electric Vehicles: A Comprehensive Review. Energies 2024, 17, 3059. [Google Scholar] [CrossRef]
- Alansari, M.; Al-Sumaiti, A.S.; Abughali, A. Optimal placement of electric vehicle charging infrastructures utilizing deep learning. IET Intell. Transp. Syst. 2024, 18, 1529–1544. [Google Scholar] [CrossRef]
- Shern, S.J.; Sarker, M.T.; Ramasamy, G.; Thiagarajah, S.P.; Al Farid, F.; Suganthi, S. Artificial Intelligence-Based Electric Vehicle Smart Charging System in Malaysia. World Electr. Veh. J. 2024, 15, 440. [Google Scholar] [CrossRef]
- Cavus, M.; Dissanayake, D.; Bell, M. Next Generation of Electric Vehicles: AI-Driven Approaches for Predictive Maintenance and Battery Management. Energies 2025, 18, 1041. [Google Scholar] [CrossRef]
- Khan, M.A.; Saleh, A.M.; Waseem, M.; Sajjad, I.A. Artificial intelligence enabled demand response: Prospects and challenges in smart grid environment. Ieee Access 2022, 11, 1477–1505. [Google Scholar]
- Lin, J.; Qiu, J.; Liu, G.; Yao, Z.; Yuan, Z.; Lu, X. A Fuzzy Logic Approach to Power System Security with Non-Ideal Electric Vehicle Battery Models in Vehicle-to-Grid Systems. IEEE Internet Things J. 2025. [Google Scholar] [CrossRef]
- Tian, X.; Zhou, S.; Hao, H.; Ruan, H.; Gaddam, R.R.; Dutta, R.C.; Zhu, T.; Wang, H.; Wu, B.; Brandon, N.P. Machine learning and density functional theory for catalyst and process design in hydrogen production. Chain 2024, 1, 150–166. [Google Scholar]
- Hassan, Q.; Azzawi, I.D.; Sameen, A.Z.; Salman, H.M. Hydrogen fuel cell vehicles: Opportunities and challenges. Sustainability 2023, 15, 11501. [Google Scholar] [CrossRef]
- Bree, G.; Hao, H.; Stoeva, Z.; Low, C.T.J. Monitoring state of charge and volume expansion in lithium-ion batteries: An approach using surface mounted thin-film graphene sensors. RSC Adv. 2023, 13, 7045–7054. [Google Scholar] [CrossRef]
- Dini, P.; Saponara, S.; Colicelli, A. Overview on battery charging systems for electric vehicles. Electronics 2023, 12, 4295. [Google Scholar] [CrossRef]
- Cadete, E.; Alva, R.; Zhang, A.; Ding, C.; Xie, M.; Ahmed, S.; Jin, Y. Deep learning tackles temporal predictions on charging loads of electric vehicles. In Proceedings of the 2022 IEEE Energy Conversion Congress and Exposition (ECCE), Detroit, MI, USA, 9–13 October 2022; pp. 1–6. [Google Scholar]
- Siddiqui, J.; Ahmed, U.; Amin, A.; Alharbi, T.; Alharbi, A.; Aziz, I.; Khan, A.R.; Mahmood, A. Electric Vehicle charging station load forecasting with an integrated DeepBoost approach. Alex. Eng. J. 2025, 116, 331–341. [Google Scholar] [CrossRef]
- Shanmuganathan, J.; Victoire, A.A.; Balraj, G.; Victoire, A. Deep learning LSTM recurrent neural network model for prediction of electric vehicle charging demand. Sustainability 2022, 14, 10207. [Google Scholar] [CrossRef]
- Almaghrebi, A.; Aljuheshi, F.; Rafaie, M.; James, K.; Alahmad, M. Data-driven charging demand prediction at public charging stations using supervised machine learning regression methods. Energies 2020, 13, 4231. [Google Scholar] [CrossRef]
- Li, C.; Dong, Z.; Chen, G.; Zhou, B.; Zhang, J.; Yu, X. Data-driven planning of electric vehicle charging infrastructure: A case study of Sydney, Australia. IEEE Trans. Smart Grid 2021, 12, 3289–3304. [Google Scholar] [CrossRef]
- Boulakhbar, M.; Farag, M.; Benabdelaziz, K.; Kousksou, T.; Zazi, M. A deep learning approach for prediction of electrical vehicle charging stations power demand in regulated electricity markets: The case of Morocco. Clean. Energy Syst. 2022, 3, 100039. [Google Scholar]
- Ran, J.; Gong, Y.; Hu, Y.; Cai, J. EV load forecasting using a refined CNN-LSTM-AM. Electr. Power Syst. Res. 2025, 238, 111091. [Google Scholar] [CrossRef]
- Straka, M.; De Falco, P.; Ferruzzi, G.; Proto, D.; Van Der Poel, G.; Khormali, S.; Buzna, L. Predicting popularity of electric vehicle charging infrastructure in urban context. IEEE Access 2020, 8, 11315–11327. [Google Scholar]
- Soldan, F.; Bionda, E.; Mauri, G.; Celaschi, S. Short-term forecast of electric vehicle charging stations occupancy using big data streaming analysis. In Proceedings of the 2021 IEEE International Conference on Environment and Electrical Engineering and 2021 IEEE Industrial and Commercial Power Systems Europe (EEEIC/I&CPS Europe), Bari, Italy, 7–10 September 2021; pp. 1–6. [Google Scholar]
- Mouaad, B.; Farag, M.; Kawtar, B.; Tarik, K.; Malika, Z. A deep learning approach for electric vehicle charging duration prediction at public charging stations: The case of Morocco. ITM Web Conf. 2022, 43, 01024. [Google Scholar]
- Ullah, I.; Liu, K.; Yamamoto, T.; Zahid, M.; Jamal, A. Prediction of electric vehicle charging duration time using ensemble machine learning algorithm and Shapley additive explanations. Int. J. Energy Res. 2022, 46, 15211–15230. [Google Scholar]
- Lu, X.; Qiu, J.; Lei, G.; Zhu, J. State of health estimation of lithium iron phosphate batteries based on degradation knowledge transfer learning. IEEE Trans. Transp. Electrif. 2023, 9, 4692–4703. [Google Scholar] [CrossRef]
- U.S. Department of Transportation. Charger Types and Speeds. Available online: https://www.transportation.gov/rural/ev/toolkit/ev-basics/charging-speeds (accessed on 23 October 2024).


| Reference | Artificial Intelligence Technique | Optimal Charging Strategy | EVs Impact on Power Grid |
|---|---|---|---|
| [10,11] | × | ✓ | × |
| [12,13,14,15,16] | × | ✓ | ✓ |
| [18,21,22,30,31,32,33,34,35,36,37,38,39,40] | ✓ | × | × |
| Proposed Work | ✓ | ✓ | ✓ |
| Charging Site | Location | No. of EVSE | No. of EV Charging Sessions | ||||
|---|---|---|---|---|---|---|---|
| 2018 | 2019 | 2020 | 2021 | Total | |||
| JPL | A national research lab in La Canada, California | 52 | 4775 | 17,411 | 5576 | 5876 | 33,638 |
| Caltech | Research university in Pasadena, California | 54 | 15,297 | 10,617 | 2472 | 3038 | 31,424 |
| Office 1 | An office building situated in the Silicon Valley area, California | 8 | 0 | 922 | 436 | 325 | 1683 |
| Data Features | Description | Data Type | Unit |
|---|---|---|---|
| Connection Time | The time when the EV is first plugged in and begins the charging session. | datetime | N/A |
| Disconnect Time | The time when the EV is unplugged, ending the charging session. | datetime | N/A |
| Done Charging Time | The time when the EV records its last instance of drawing a non-zero current, indicating that charging is complete. | datetime | N/A |
| Energy Requested | The amount of energy requested by the user for the charging session. | float | kWh |
| Charging Occupancy | The total time an EV remains connected to a charging station(Difference between disconnect charging time and connection time). | float | h |
| Charging Duration | The total time taken for the EV to reach the requested charge level (Difference between done charging time and connection time). | float | h |
| Power | The rate at which electrical energy is transferred to the EV battery during charging (Ratio between energy requested and charging duration). | float | kW |
| Start Charging Time | The connection time converted to hours after removing the date and zone information from timestamps. | float | h |
| AI Model | LR | GMR | RFR | FFC-ANN |
|---|---|---|---|---|
| Type | Simple regression | Probabilistic model with mixture components | Ensemble-based regression | Neural network |
| Characteristics | Linear relationship only, baseline models | Models complex, multimodal, and nonlinear relationships | Nonlinear relationships via ensemble trees | Models complex, nonlinear relationships |
| Handling Nonlinearity | Cannot capture nonlinearity without transformations | Captures multimodal and nonlinear relationships | Good for complex, nonlinear relationships | Highly capable of modeling nonlinearity |
| Training Complexity | Low | Moderate to high; EM algorithm can be intensive | Medium | High, especially with deep architectures |
| Scalability | High | Moderate; not as scalable for large datasets | Fairly high, but slows with more trees | High computational demand |
| Sr. No. | Neuron | Learning Rate | Layer | Epochs | Activation Function | Batch Size | MSE | MAE | R2 |
|---|---|---|---|---|---|---|---|---|---|
| 1 | 32 | 0.001 | 3 | 150 | tanh | 64 | 0.3733 | 0.4270 | 0.9066 |
| 2 | 32 | 0.001 | 3 | 150 | tanh | 32 | 0.8171 | 0.6538 | 0.8788 |
| 3 | 32 | 0.001 | 3 | 150 | tanh | 16 | 0.6328 | 0.6095 | 0.8732 |
| 4 | 32 | 0.001 | 3 | 100 | tanh | 64 | 0.6410 | 0.5977 | 0.8732 |
| 5 | 32 | 0.001 | 3 | 50 | tanh | 64 | 0.7409 | 0.7082 | 0.7189 |
| 6 | 32 | 0.01 | 3 | 150 | tanh | 64 | 0.9583 | 0.7484 | 0.8444 |
| 7 | 32 | 0.1 | 3 | 150 | tanh | 64 | 0.9231 | 0.7439 | 0.8284 |
| 8 | 64 | 0.001 | 3 | 150 | tanh | 64 | 0.6405 | 0.6427 | 0.8396 |
| 9 | 128 | 0.001 | 3 | 150 | tanh | 64 | 0.6635 | 0.6283 | 0.8832 |
| 10 | 32 | 0.001 | 1 | 150 | tanh | 64 | 1.5557 | 1.0830 | 0.6931 |
| 11 | 32 | 0.001 | 2 | 150 | tanh | 64 | 0.7623 | 0.7250 | 0.8228 |
| 12 | 32 | 0.001 | 3 | 150 | ReLU | 64 | 0.7494 | 0.6116 | 0.9010 |
| 13 | 64 | 0.001 | 3 | 150 | ReLU | 64 | 0.3316 | 0.4886 | 0.9023 |
| 14 | 128 | 0.001 | 3 | 150 | ReLU | 64 | 0.6167 | 0.6381 | 0.8759 |
| 15 | 32 | 0.001 | 3 | 100 | ReLU | 64 | 0.6603 | 0.6952 | 0.8593 |
| Sr. No. | Neuron | Learning Rate | Layer | Epochs | Activation Function | Batch Size | MSE | MAE | R2 |
|---|---|---|---|---|---|---|---|---|---|
| 1 | 32 | 0.001 | 3 | 150 | tanh | 64 | 0.1656 | 0.3723 | 0.9139 |
| 2 | 32 | 0.001 | 3 | 150 | tanh | 32 | 0.1704 | 0.3582 | 0.9121 |
| 3 | 32 | 0.001 | 3 | 150 | tanh | 16 | 0.1661 | 0.3459 | 0.9136 |
| 4 | 32 | 0.001 | 3 | 100 | tanh | 64 | 0.1909 | 0.3991 | 0.9001 |
| 5 | 32 | 0.001 | 3 | 50 | tanh | 64 | 0.2392 | 0.4127 | 0.8133 |
| 6 | 32 | 0.01 | 3 | 150 | tanh | 64 | 0.1894 | 0.3829 | 0.9185 |
| 7 | 32 | 0.1 | 3 | 150 | tanh | 64 | 0.2457 | 0.3767 | 0.8162 |
| 8 | 64 | 0.001 | 3 | 150 | tanh | 64 | 0.2238 | 0.4326 | 0.8871 |
| 9 | 128 | 0.001 | 3 | 150 | tanh | 64 | 0.1600 | 0.3562 | 0.9159 |
| 10 | 32 | 0.001 | 1 | 150 | tanh | 64 | 0.5241 | 0.5769 | 0.7168 |
| 11 | 32 | 0.001 | 2 | 150 | tanh | 64 | 0.1712 | 0.3606 | 0.8778 |
| 12 | 32 | 0.001 | 3 | 150 | ReLU | 64 | 0.1268 | 0.3340 | 0.9313 |
| 13 | 64 | 0.001 | 3 | 150 | ReLU | 64 | 0.1163 | 0.3118 | 0.9355 |
| 14 | 128 | 0.001 | 3 | 150 | ReLU | 64 | 0.1010 | 0.2665 | 0.9433 |
| 15 | 32 | 0.001 | 3 | 100 | ReLU | 64 | 0.0873 | 0.2566 | 0.9214 |
| Dataset | |||||||||||||
|---|---|---|---|---|---|---|---|---|---|---|---|---|---|
| Hyperparameter No. | #12 | #13 | #12 | #13 | |||||||||
| Evaluation Metrics | MSE | MAE | R2 | MSE | MAE | R2 | MSE | MAE | R2 | MSE | MAE | R2 | |
| Data Partitions | 1 | 0.7494 | 0.6116 | 0.9010 | 0.423 | 0.5037 | 0.9118 | 0.1268 | 0.3340 | 0.9313 | 0.1008 | 0.2913 | 0.9498 |
| 2 | 0.4459 | 0.5143 | 0.8992 | 0.3316 | 0.4886 | 0.9023 | 0.1007 | 0.2770 | 0.9477 | 0.0893 | 0.2621 | 0.9389 | |
| 3 | 0.6100 | 0.6119 | 0.8793 | 0.5694 | 0.6525 | 0.8972 | 0.1092 | 0.2968 | 0.9428 | 0.1049 | 0.2769 | 0.9455 | |
| 4 | 0.7640 | 0.6663 | 0.8733 | 0.4072 | 0.5206 | 0.9175 | 0.1278 | 0.3321 | 0.9396 | 0.1065 | 0.2768 | 0.9446 | |
| 5 | 0.5665 | 0.6093 | 0.8800 | 0.5372 | 0.6034 | 0.9036 | 0.0766 | 0.2432 | 0.9268 | 0.1622 | 0.3578 | 0.9168 | |
| 6 | 0.7352 | 0.7118 | 0.8625 | 0.5929 | 0.6377 | 0.8918 | 0.1378 | 0.3354 | 0.9054 | 0.1180 | 0.3093 | 0.9508 | |
| 7 | 0.7619 | 0.7159 | 0.8629 | 0.4734 | 0.5490 | 0.8901 | 0.1332 | 0.3435 | 0.9074 | 0.1361 | 0.3024 | 0.9247 | |
| 8 | 0.6965 | 0.6945 | 0.8752 | 0.4638 | 0.5382 | 0.8945 | 0.1551 | 0.3417 | 0.9070 | 0.0943 | 0.2638 | 0.9061 | |
| 9 | 0.6081 | 0.6569 | 0.8622 | 0.6628 | 0.6093 | 0.8841 | 0.1455 | 0.3297 | 0.9016 | 0.0693 | 0.2202 | 0.9465 | |
| 10 | 0.8462 | 0.7908 | 0.8779 | 0.5349 | 0.5987 | 0.8950 | 0.1590 | 0.3080 | 0.9332 | 0.1300 | 0.3151 | 0.9240 | |
| Mean | 0.6784 | 0.6583 | 0.8774 | 0.4997 | 0.5702 | 0.8988 | 0.1272 | 0.3141 | 0.9243 | 0.1111 | 0.2876 | 0.9348 | |
| Standard Deviation | 0.1189 | 0.0764 | 0.0139 | 0.0985 | 0.0575 | 0.0102 | 0.0255 | 0.0330 | 0.01737 | 0.0265 | 0.0371 | 0.0157 | |
| Dataset | |||||||
|---|---|---|---|---|---|---|---|
| Evaluation Metrics | MSE | MAE | R2 | MSE | MAE | R2 | |
| Data Partitions | 1 | 0.5318 | 0.5719 | 0.8713 | 0.2000 | 0.3700 | 0.9352 |
| 2 | 0.7899 | 0.7251 | 0.8738 | 0.2122 | 0.4095 | 0.9155 | |
| 3 | 0.4518 | 0.5540 | 0.8672 | 0.1672 | 0.3544 | 0.8978 | |
| 4 | 0.5655 | 0.5766 | 0.8944 | 0.2042 | 0.4095 | 0.9250 | |
| 5 | 0.5672 | 0.6373 | 0.8878 | 0.1648 | 0.3531 | 0.8908 | |
| 6 | 0.7885 | 0.6401 | 0.8657 | 0.3825 | 0.3664 | 0.8975 | |
| 7 | 0.4154 | 0.5154 | 0.9110 | 0.3019 | 0.4353 | 0.9044 | |
| 8 | 0.7778 | 0.6546 | 0.8640 | 0.1879 | 0.3619 | 0.9057 | |
| 9 | 0.6308 | 0.6432 | 0.8600 | 0.1867 | 0.3328 | 0.9122 | |
| 10 | 0.6355 | 0.6403 | 0.9208 | 0.1897 | 0.3776 | 0.9276 | |
| Mean | 0.6154 | 0.6159 | 0.8816 | 0.2197 | 0.3771 | 0.9112 | |
| Standard Deviation | 0.1358 | 0.0608 | 0.0211 | 0.0689 | 0.0315 | 0.0146 | |
| Dataset | |||||||
|---|---|---|---|---|---|---|---|
| Evaluation Metrics | MSE | MAE | R2 | MSE | MAE | R2 | |
| Data Partitions | 1 | 0.7715 | 0.6505 | 0.8757 | 0.1886 | 0.3860 | 0.8554 |
| 2 | 0.9996 | 0.7745 | 0.8478 | 0.2059 | 0.4129 | 0.8418 | |
| 3 | 1.1700 | 0.8586 | 0.8077 | 0.1527 | 0.3696 | 0.8625 | |
| 4 | 1.0084 | 0.7906 | 0.8086 | 0.1527 | 0.3522 | 0.8883 | |
| 5 | 0.8264 | 0.7527 | 0.8518 | 0.2032 | 0.4026 | 0.8722 | |
| 6 | 0.9030 | 0.8001 | 0.8137 | 0.1548 | 0.3452 | 0.8903 | |
| 7 | 0.6175 | 0.6245 | 0.8598 | 0.1625 | 0.3529 | 0.9092 | |
| 8 | 0.8206 | 0.7199 | 0.8606 | 0.1641 | 0.3704 | 0.8974 | |
| 9 | 0.8677 | 0.7458 | 0.8135 | 0.1276 | 0.3181 | 0.9353 | |
| 10 | 1.1941 | 0.8494 | 0.8032 | 0.1128 | 0.2967 | 0.9112 | |
| Mean | 0.9179 | 0.7567 | 0.8342 | 0.1625 | 0.3607 | 0.8864 | |
| Standard Deviation | 0.1694 | 0.0725 | 0.0260 | 0.0286 | 0.0340 | 0.0272 | |
| Dataset | |||||||
|---|---|---|---|---|---|---|---|
| Evaluation Metrics | MSE | MAE | R2 | MSE | MAE | R2 | |
| Data Partitions | 1 | 1.0034 | 0.8142 | 0.8114 | 0.2711 | 0.3979 | 0.8639 |
| 2 | 1.1024 | 0.9153 | 0.8086 | 0.3355 | 0.4788 | 0.8048 | |
| 3 | 0.7135 | 0.6805 | 0.8705 | 0.3422 | 0.5282 | 0.8353 | |
| 4 | 1.0761 | 0.7332 | 0.8332 | 0.2167 | 0.3740 | 0.8048 | |
| 5 | 1.1896 | 0.7592 | 0.8136 | 0.3085 | 0.4268 | 0.8047 | |
| 6 | 0.5784 | 0.6214 | 0.8695 | 0.3792 | 0.5211 | 0.8161 | |
| 7 | 0.7303 | 0.7001 | 0.8395 | 0.4096 | 0.5367 | 0.8080 | |
| 8 | 0.9089 | 0.7975 | 0.8516 | 0.2344 | 0.3806 | 0.8385 | |
| 9 | 1.0557 | 0.8240 | 0.8275 | 0.2369 | 0.4214 | 0.8386 | |
| 10 | 0.7636 | 0.6743 | 0.8371 | 0.2072 | 0.3879 | 0.8166 | |
| Mean | 0.9122 | 0.752 | 0.8363 | 0.2941 | 0.4453 | 0.8231 | |
| Standard Deviation | 0.1936 | 0.0831 | 0.0212 | 0.0676 | 0.0615 | 0.0190 | |
| Dataset | |||||||
|---|---|---|---|---|---|---|---|
| Evaluation Metrics | MSE | MAE | R2 | MSE | MAE | R2 | |
| Data Partitions | 1 | 0.5973 | 0.5847 | 0.8756 | 0.1559 | 0.3446 | 0.9193 |
| 2 | 0.6240 | 0.6339 | 0.8941 | 0.1927 | 0.3705 | 0.8921 | |
| 3 | 0.8293 | 0.7137 | 0.8638 | 0.2627 | 0.4520 | 0.8857 | |
| 4 | 0.4969 | 0.4997 | 0.8838 | 0.2396 | 0.4048 | 0.8789 | |
| 5 | 0.5932 | 0.5428 | 0.8783 | 0.1909 | 0.3433 | 0.8805 | |
| 6 | 0.6726 | 0.6320 | 0.8363 | 0.1529 | 0.2877 | 0.9303 | |
| 7 | 0.9886 | 0.7718 | 0.8336 | 0.2348 | 0.3897 | 0.8654 | |
| 8 | 0.7870 | 0.6085 | 0.8624 | 0.1820 | 0.3461 | 0.8999 | |
| 9 | 0.9238 | 0.6911 | 0.8279 | 0.2150 | 0.3665 | 0.8812 | |
| 10 | 0.8105 | 0.6712 | 0.8711 | 0.1887 | 0.3021 | 0.8689 | |
| Mean | 0.7323 | 0.6349 | 0.8627 | 0.2015 | 0.3607 | 0.8902 | |
| Standard Deviation | 0.1514 | 0.0771 | 0.0216 | 0.0342 | 0.0456 | 0.0199 | |
Disclaimer/Publisher’s Note: The statements, opinions and data contained in all publications are solely those of the individual author(s) and contributor(s) and not of MDPI and/or the editor(s). MDPI and/or the editor(s) disclaim responsibility for any injury to people or property resulting from any ideas, methods, instructions or products referred to in the content. |
© 2025 by the authors. Licensee MDPI, Basel, Switzerland. This article is an open access article distributed under the terms and conditions of the Creative Commons Attribution (CC BY) license (https://creativecommons.org/licenses/by/4.0/).
Share and Cite
Jamil, U.; Alva, R.J.; Ahmed, S.; Jin, Y.-F. Artificial Intelligence-Driven Optimal Charging Strategy for Electric Vehicles and Impacts on Electric Power Grid. Electronics 2025, 14, 1471. https://doi.org/10.3390/electronics14071471
Jamil U, Alva RJ, Ahmed S, Jin Y-F. Artificial Intelligence-Driven Optimal Charging Strategy for Electric Vehicles and Impacts on Electric Power Grid. Electronics. 2025; 14(7):1471. https://doi.org/10.3390/electronics14071471
Chicago/Turabian StyleJamil, Umar, Raul Jose Alva, Sara Ahmed, and Yu-Fang Jin. 2025. "Artificial Intelligence-Driven Optimal Charging Strategy for Electric Vehicles and Impacts on Electric Power Grid" Electronics 14, no. 7: 1471. https://doi.org/10.3390/electronics14071471
APA StyleJamil, U., Alva, R. J., Ahmed, S., & Jin, Y.-F. (2025). Artificial Intelligence-Driven Optimal Charging Strategy for Electric Vehicles and Impacts on Electric Power Grid. Electronics, 14(7), 1471. https://doi.org/10.3390/electronics14071471