Abstract
This paper presents a comprehensive investigation into the phenomenon of gamut boundary distortion that occurs during the gamut conversion process in LED full-color display systems. This phenomenon is influenced by the electro-optical transfer function. First, a CIE-xyY colorimetric framework specifically designed for LEDs is developed and established as the foundation for gamut conversion in LED applications. Next, the principles of gamut conversion based on this model are detailed. Additionally, a set of indices, including the Laplacian operator, entropy function, and magnitude of deviation of distorted color points, is integrated to form a comprehensive descriptive methodology. This methodology enables a thorough quantification of distribution patterns and effectively illustrates the outcomes of distortion. The findings of this research are significant for improving color conversion strategies and enhancing the color performance of display devices, making meaningful contributions to related fields.
1. Introduction
In the field of color science, the concept of color gamut holds significant importance and serves as a critical benchmark for evaluating color precision. For example, in the digital imaging process—which includes capturing an image with a digital camera and displaying it on various terminal devices—this process can be likened to a meticulous relay race of color transmission, where the color gamut plays a key role in ensuring seamless transitions at each stage. Each device, such as digital cameras, computers, mobile phones, or tablets, has its own unique range of color gamuts. When image data are transmitted between these devices, an inability to effectively match and convert the color gamuts can lead to semantic deviations akin to those in translation processes, resulting in significant discrepancies in the colors represented by the image. Such color mismatches, caused by incompatible color gamuts, can be detrimental in fields requiring precise color reproduction—such as professional photography, digital painting, and film and television production. These discrepancies disrupt the color balance established by the creator, causing visual information perceived by audiences or users to deviate from the original intent, thereby compromising both coherence and accuracy. Consequently, color gamut conversion technology has emerged as a pivotal mechanism for maintaining the stability of the color system. This technology allows devices to accurately reproduce colors, ensuring that the final output aligns with the creator’s vision while preserving harmonious color unity across different device systems.
The electro-optical transfer function plays a vital role in the process of color gamut conversion, The electro-optical transfer function (EOTF) functions as the fundamental quantitative framework within display systems, facilitating a non-linear transformation of digital electrical signals (such as RGB-encoded values) into absolute luminance outputs (measured in cd/m²) of display devices. This transformation is designed to correspond with the non-linear perceptual attributes of human vision. By establishing the EOTF, the system attains physical linearity in luminance regulation through digital encoding values, even within the limitations of bit depth, thereby ensuring accurate brightness reproduction while preserving perceptual uniformity throughout the dynamic range [1]. Variations in these transfer functions exhibit unique curve characteristics directly linked to the accuracy of electrical-to-optical signal conversion. During color gamut conversion, the control system evaluates the original primary colors based on the selected electro-optical transfer function and executes color mixing by modifying relevant parameters. This generates a new combination of primary colors corresponding to the specified target color gamut [2].
As application scenarios become increasingly complex and the demand for visual quality continues to rise, color gamut standards are also evolving [3]. In 1996, Hewlett-Packard (HP) and Microsoft created the sRGB standard for displays, printers, and the internet, which was in line with high-definition television (HDTV) specifications. This standard established a gamma value of 2.2 for its electro-optical transfer function (EOTF), designed to align with human visual perception. Later, the International Telecommunication Union (ITU) introduced the ITU-R BT.709 [4] color gamut standard, known as BT.709, which utilized a higher EOTF value of 2.4. This change allowed for richer color transitions, better contrast ratios, and an overall improved viewing experience. The BT.709 standard is widely regarded as the standard for high-definition television and has become essential for contemporary display technologies and content production processes. Several common electro-optical transfer functions are shown in Figure 1 [5]. In recent years, High Dynamic Range (HDR) technology has emerged and developed rapidly [6,7]. The Consumer Technology Association (CTA) in the United States announced the HDR10 standard [8], which presents a challenge to the sRGB standard. This new standard mandates the use of the BT.2020 color gamut and requires that the electro-optical transfer function curve of display devices adhere to the Perceptual Quantizer (PQ) curve defined by the Batton model [9]. This imposes stricter requirements on the accuracy of color reproduction during the color gamut conversion process at the display.
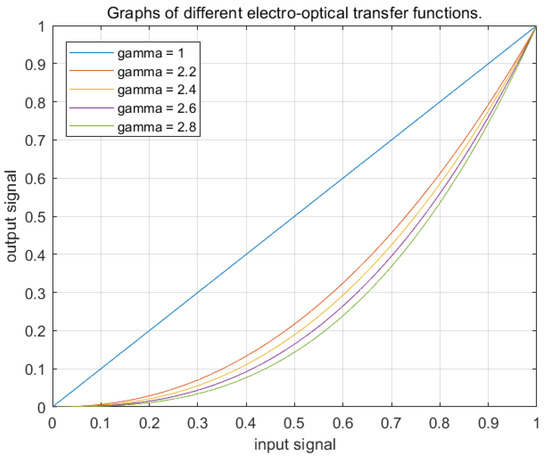
Figure 1.
Different electro-optical transfer functions.
Concurrently, as the sRGB standard continues to dominate display terminals, there is an urgent need to address the challenge of effectively presenting wide-gamut images on these devices. Consequently, LED display terminals are increasingly confronted with challenges related to color reproduction accuracy during the color gamut conversion process. The intrinsic nonlinearity differences present among various electro-optical transfer functions lead to an uneven distribution of tonal resources across different grayscale levels. In conjunction with the fundamental physical limitations of pixel units, this phenomenon inevitably results in varying quantization errors that propagate throughout the color rendering pipeline. Consequently, this leads to inconsistent color blending and perceptible color variations, which substantially impact the overall viewing experience.
In light of the aforementioned issues, this study undertakes a comprehensive investigation into the impact of the electro-optical transfer function on the distortion of the gamut boundary during the gamut conversion process. This research begins with the development of a model representing the gamut space for display terminals, followed by an exposition of the fundamental principles underlying gamut conversion. Subsequently, a cohesive descriptive framework is established, utilizing metrics such as the Laplacian operator, entropy function, and deviation of distorted color points to quantitatively evaluate distribution patterns and articulate the resultant distortions. The outcomes of this research provide both theoretical insights and practical recommendations aimed at improving the accuracy of color reproduction in display technologies.
2. Establishment of the Gamut Conversion Boundary Model
2.1. Equationte the Gamut Boundary Model
According to Grassmann’s law of color matching, which is fundamental to the field of colorimetry, a wide array of colors observed in nature can be synthesized. Based on this principle, a specific white balance is established as a standard reference for calculating the relative luminance units of the three primary colors [10]. Consequently, any light within the visible spectrum can be generated by combining varying proportions of these three primary color lights. The specific quantities of each primary color required to produce different colors of light are referred to as the tristimulus values of the colored light [11]. In the practical application of this color mixing on display terminals, it is essential to first perform nonlinear processing on the colored light signals, as illustrated in the following equation:
where R denotes the luminance associated with the input red primary color, while signifies the luminance of the red primary color within the display system, and represents the electro-optical transfer function. Through this process, the conversion of linear light signals is generated by the device into nonlinear signals that align with human visual perception [12]. Building upon this foundation, nonlinear colored lights are employed for the purpose of color mixing [13]. Based on the aforementioned information, the expression for the color gamut white balance is articulated as follows:
where are the brightnesses of the three primary colors of a certain pixel in the display; is the white balance brightness of this pixel; and are the proportional relationships of the brightnesses of the three primary colors under a given white field.
Furthermore, in accordance with the principles of CIE colorimetry, the brightness and chromaticity of a specific light source can be quantitatively represented by the following colorimetric equation [14]:
In the equation, denote the tristimulus values. The tristimulus values of a mixed color are derived from the summation of the tristimulus values of each constituent color. Notably, the Y primary color simultaneously represents both chromaticity and brightness, whereas exclusively represent the chromaticity of the color. In the CIE-XYZ system, the color matching functions are expressed as . Additionally, it is stipulated that is consistent with the photopic spectral luminous efficiency function . Then the spectral tristimulus values are
For any light source with a spectral power distribution of , the tristimulus values in this system are
In the equation, k is an adjustment factor, and . The objective is to establish that the upper limit of Y is 100. In actual calculations, the summation method is usually used to replace the integral form, that is,
Then the corresponding chromaticity coordinates in the CIE-XYZ system are
This paper performs a linear transformation on the equation to establish the relationship between white balance and the three primary colors in the color space [15]. To make the form of the transformation matrix simple and easy to solve, let
Then
are the chromaticity coordinates of the red primary color in the CIE-xyY color space; are the chromaticity coordinates of the green primary color in the CIE-xyY color space; and are the chromaticity coordinates of the blue primary color in the CIE-xyY color space. Their values vary according to the differences in the wavelengths of the color purities of the three primary colors in different display standards. are coefficients to be determined. Substituting them into the equation can obtain [16]
Converting the tristimulus values into color space coordinates can obtain
In practical applications, the standardization of color performance analysis across various displays necessitates the normalization of chromaticity values. The projection of the color gamut polyhedron onto the XYZ coordinate plane delineates the commonly recognized closed area of the color triangle [17]. The three vertices of this planar projection triangle correspond to the coordinate values representing the most saturated states of the red, green, and blue primary colors that can be rendered within the display’s color gamut. The interior region of the triangle encompasses any color that can theoretically be synthesized from these three primary colors. Additionally, the white point located at the center of the triangle signifies the white balance color coordinate of the display. The color coordinates extend along the z-axis, thereby establishing the brightness sequence of the display system, with the endpoints of this sequence aligning with the peak brightness achievable by the display. In the display control system, the upper limit of system control precision determines the bit depth of the display color, which serves as an indicator of the brightness levels that the display can achieve. By varying the brightness of the primary colors, intermediate color points can be generated within the color gamut. The brightness levels of all primary colors are combined in a random manner, ultimately resulting in a set of color points that can be rendered on the screen. Thus, the color gamut of the display terminal is fundamentally a collection of geometric points defined by the precision of the control system [18], as illustrated in Figure 2.
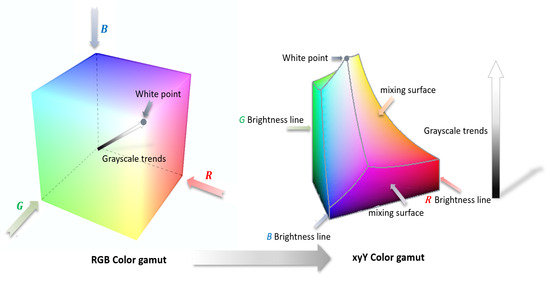
Figure 2.
Conversion from the RGB model to the xyY model.
2.2. Gamut Conversion Based on the xyY Model
In the realm of display technologies, distinct sets of primary colors can produce varying tristimulus values and chromaticity coordinates for identical colors. To prevent distortion, it is essential to understand the conversion relationship between different color systems when reproducing the same color across various display terminals. This understanding allows for the transformation of stimulus values and chromaticity coordinates of a specific color from one system to values that correspond to another display terminal system. For instance, when converting an image with a wide color gamut, such as BT.2020, into a narrower color gamut, such as sRGB, it is necessary to map the colors from the wide color gamut to the nearest corresponding colors in the smaller color gamut. Within the same color system, the process of transforming the original color gamut space into the target space is referred to as color gamut conversion [19]. This process can be delineated into two primary steps: the adjustment of chromaticity coordinates and the modification of brightness values. The adjustment of chromaticity coordinates involves converting the discrete chromaticity coordinate values of the original color gamut into those of the target gamut. This adjustment entails mixing two additional colors into each of the primary colors of the original color gamut. Specifically, when displaying red, green, and blue, base colors are combined; when displaying green, red, and blue, base colors are combined; and when displaying blue, red, and green, base colors are combined. The modification of brightness values occurs in a direction that is perpendicular to the chromaticity plane, where the change in brightness value represents an adjustment of the brightness difference when the same base color is displayed. The flow chart of gamut conversion is shown in Figure 3.
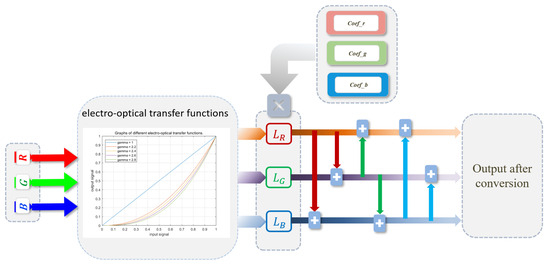
Figure 3.
The actual flow chart of gamut conversion for display terminals.
The mathematical equations for the standard color space represented by the three primary colors X, Y, and Z of the original color gamut are as follows:
Similarly, the expression for the target color gamut is
are the conversion parameter values that ensure that the equality holds during color gamut conversion. Let . After converting the original three primary colors, their tristimulus values should be equal to the corresponding tristimulus values of the target space, that is,
Then the conversion matrix G from the original space to the target space can be obtained as
If the polyhedron representing the target color gamut is entirely encompassed within the polyhedron of the original color gamut, it follows that all colors within the target color gamut can be accurately represented by the color points found in the original color gamut.
3. Establishment of a Distribution Regularity Model
This study investigates the influence of quantization errors generated by the electro-optical transfer function on the boundaries of the target color gamut during the color gamut conversion process. To address the issue of overflow distortion, which arises when the target color gamut is not fully encompassed within the original gamut space, the conversion from the wide color gamut (BT.2020) to sRGB has been selected [20]. Initially, 100 color points within an acceptable color difference range of the three primary color coordinate points are randomly selected in proximity to the primary color coordinates of the BT.2020 color gamut to establish the original color gamut families. The aim is to analyze the characteristic patterns of the G matrix families when these color gamut families are converted to the narrower sRGB gamut, thereby reducing the influence of the G matrix during this conversion. This analysis serves as a critical foundation for enhancing the focus on the key parameter of the electro-optical transfer function. According to the conversion equation presented in Section 2, the color gamut conversion matrix for each pixel is determined by nine parameters. These parameters depend on the original color gamut of the primary colors and the designated target conversion color gamut. The parameters are discrete, with values in the range of [0, 1]. The specific coefficients—RR, RG, RB, GR, GG, GB, BR, BG, and BB—within each G matrix have been identified, and distribution diagrams for these coefficients across the matrix families are provided in Figure 4.
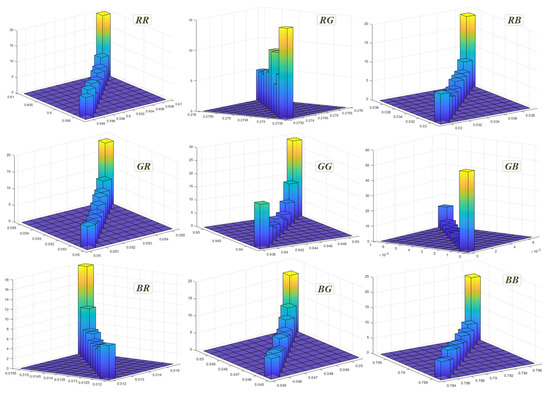
Figure 4.
Distributiondiagram of conversion matrix coefficients.
An analysis of these diagrams indicates that the coefficients are predominantly concentrated within an error margin of three thousandths, with discernible key distribution areas. This concentration implies that the parameters do not significantly affect the experimental outcomes presented in this study. Consequently, the mode parameter values for each matrix are adopted as the values for the conversion matrix G in the subsequent experiments.
3.1. Quantization Error Analysis Based on the xyY Color Model
In contemporary display technology, display terminals are composed of individual pixel points. During the process of color gamut conversion at the display terminal, the color difference function model for each pixel point remains constant. A complete set of color gamut conversion parameters consists of nine distinct parameters associated with each pixel point. For instance, the red conversion parameters for a given pixel point can be expressed as . The color gamut conversion matrix for each pixel point is intrinsically linked to these nine parameters, whose values are contingent upon the original color gamut of the primary colors and the specified target conversion color gamut. It is important to note that these nine parameters are discrete, with their value range constrained to [0, 1] [21]. When executing color gamut conversion calculations, the discrete nature of the control system necessitates the quantization of the computed data. The quantization process is shown in Figure 5.

Figure 5.
The generation process of quantization error.
The specific quantization precision is determined by the control precision of the display device. In this experiment, an 8-bit precision, which is commonly employed, has been selected. It is assumed that the form of the correction parameter for each pixel point can be articulated as follows:
Based on the conversion relationships outlined in Section 2, the theoretical correction parameters for each pixel can be calculated. Subsequently, the actual representation of the color for each pixel following the color gamut conversion can be derived as follows:
is designed to simulate the truncation error produced by the control system. Due to the effects of quantization errors, discrepancies arise between the actual color and the theoretical color during the process of color gamut conversion. The mathematical representation of the difference between these two colors is as follows:
The magnitude of the values directly correlates with the prominence of quantization errors. Such errors can lead to a failure in achieving the desired color uniformity on the display screen following color gamut conversion, thereby not meeting established viewing standards [22]. Consequently, to enhance the visual quality of the display screen’s color after conversion, it is imperative to minimize the differential value between the two parameters. By integrating the aforementioned equations, we can derive the following:
3.2. Analysis of Distortion Indicators
- a.
- Entropy Function
Entropy serves as a quantitative measure of uncertainty within a system. It reflects the extent of uncertainty associated with the distortion points of the system following color gamut conversion in the experiment. Given that the color gamut after conversion constitutes a discrete system, the methodology for calculating the entropy of such a discrete system is delineated. For a discrete random variable, its probability distribution is defined as follows:
The calculation equation for entropy is
- b.
- Laplace Operator
The Laplace Operator is frequently employed by researchers due to its significant geometric implications in elucidating the objective laws evidenced by experimental findings. When discrete distortion points manifest on the boundary of the color gamut, the Laplace Operator can effectively identify locations where the values of these color points exhibit substantial variations. Consequently, by applying the Laplace Operator to the boundary of the color gamut, one can delineate the regions characterized by pronounced changes, which correspond to the aggregation of distortion points. In the discourse surrounding the Laplace Operator, it is imperative to first consider the concept of the gradient. In three-dimensional space, the gradient is articulated as follows:
represent the vector components on the axes. The above equation is in the form of partial differentiation. For engineering applications and computational purposes, it is typically represented in the form of differences. For instance, the representation of differences along the x-axis is as follows:
Under normal circumstances, , so the above equation can be expressed as
Therefore, for the y-axis and the z-axis, the equations are as follows:
Therefore, it can be intuitively seen that the geometric meaning represented by the gradient operator is the slope of a certain point on the coordinate axes.
Expanding from the gradient, the rate of change of the gradient is the Laplace Operator, and its physical meaning is just like solving for the acceleration in classical mechanics [23]. In three-dimensional space, the Laplace Operator is usually defined by scalars . The defining equation of the Laplace Operator is as follows:
This specific combination of partial derivatives is quite special. The meaning of this set of defining equations is the sum of the second-order differentials in the x-direction, y-direction, and z-direction. Thus, in the discrete case of three-dimensional space, for a point , its Laplace definition is approximated as
- c.
- Ratio of Distortion Points and the Average Distance from All Distorted Color Points to the Centroid
According to the color difference equation under the CIE-xyY coordinate system, calculate the Euclidean distance between the target color points and the actual color points after conversion [24,25]. The calculation equation is as follows [26]:
Up to now, the tolerance for the color difference coordinates of standard LED displays is 3‰ [27,28]. Therefore, in this paper, the minimum value of the color difference rate is set as 3‰ to measure the color difference of the converted color points. When the color difference rate is less than or equal to 3‰, it is considered that there is no color difference for that color; when the color coordinate difference rate is greater than 3‰, it is considered that the uniformity fails to meet the standard. Calculate the average value of the color differences of all distortion points to obtain the Mean Distance parameter, and calculate the ratio of the number of all distortion points to the number of color points in the entire color gamut body to obtain the Out-Gamut Ratio parameter [29]. Based on the above multiple indicator parameters, combine them to construct a unified description method to comprehensively quantify the distribution law, as follows:
H denotes the entropy function, signifies the distortion rate of the Laplace Operator, indicates the average color difference, and refers to the ratio of distortion points. are the weights of each indicator for the quantified distribution. These values need to be selected in combination with the actual experimental results, and the corresponding values will be given in the discussion of the results in Section 4.
4. Result Analysis
4.1. Results Description
An experimental analysis was conducted to investigate the impact of the electro-optical transfer function on the boundary distortion problem associated with color gamut conversion. In this study, the original color gamut was defined according to the BT.2020 standard established by High Dynamic Range (HDR) specifications, while the target color gamut after conversion was aligned with the sRGB standard, which is specified for Standard Dynamic Range (SDR). The electro-optical transfer functions selected for this experiment included common values of 2.2, 2.4, 2.6, and 2.8, which are frequently utilized in practical applications. Additionally, a series of linear transformations were performed to provide a comparative analysis against the nonlinear transformations employed. The results of the color gamut conversion, represented by the color gamut triangles under various electro-optical transfer functions, are illustrated in the accompanying Figure 6. The grayscale area indicates the theoretical position of the color gamut after conversion, forming a three-dimensional range that projects as a triangle. The red points represent the conversion results when quantization errors exist in the actual situation. It is clear that the distortion points are concentrated in the low grayscale area, which cannot be compressed into the theoretical value region.
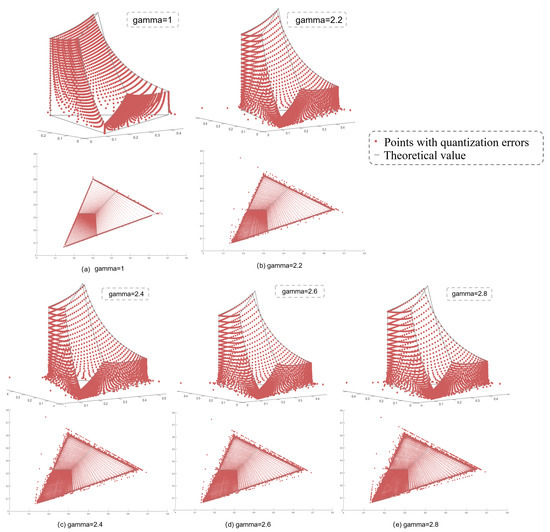
Figure 6.
Boundary color points under different electro-optical transfer functions.
In Table 1 are provided details of discrepancies between the primary color coordinates after conversion and the target primary color coordinates across different electro-optical transfer functions.

Table 1.
The difference in the base color coordinates under different electro-optical transfer functions.
The primary focus of this experiment is on the boundary point sets that exhibit non-convergence. Utilizing the unified description method outlined in Section 3, the values of each parameter within the calculation equation were determined. Initially, the entropy values of the distortion points corresponding to the different electro-optical transfer functions were computed to assess the degree of chaos present among the distortion points. An elevated entropy value signifies an increased level of disorder, which in turn intensifies the effects on conversion accuracy. Table 2 presents the entropy values corresponding to each transfer function. Subsequently, the distribution of the Laplace Operator associated with each transfer function was calculated. An analysis was conducted on the color points located along the peripheries of each color gamut, focusing on the sets of distortion points that did not converge within the volume of the color gamut after undergoing conversion via the transfer function. Utilizing the methodology outlined in Section 3, distortion points exhibiting color differences that exceeded the acceptable tolerance range were identified. The distribution of these distortion points in relation to the electro-optical transfer function is illustrated in the accompanying Figure 7.

Table 2.
The numerical table of distribution quantization parameters under different electro-optical functions.
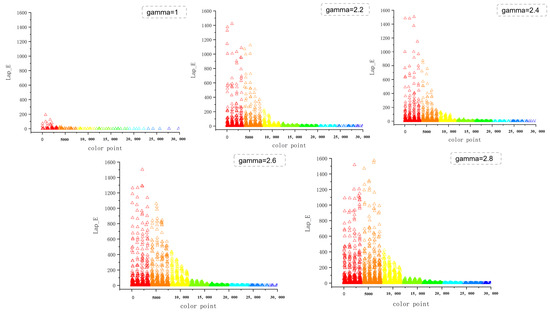
Figure 7.
Lap-E distribution diagrams under different electro-optical transfer functions.
Under varying parameters of the electro-optic transfer function, the numerical values are presented in Table 2.
This observation suggests that as the parameters of the electro-optic transfer function increase, the ratio correspondingly increases. In Figure 6, the three-dimensional graph illustrates that nearly all singularities are concentrated in the low-grayscale-levels region, indicating that the effect of control accuracy on the conversion of high-grayscale-levels color spaces is minimal. It is evident that elevated grayscale levels diminish the impact of quantization error on the conversion process. As the parameters of the electrical light transfer function increase, greater emphasis is placed on low grayscale levels during nonlinear transformation. Since low grayscale levels are significantly affected by quantization errors, this results in a more pronounced distortion of the color gamut boundary following color gamut conversion.
In conclusion, the Out-Gamut Ratio and Mean Distance parameters within the distribution law function were computed. The color differences were determined using the color difference equation to identify the sets of distortion points that surpassed the tolerance threshold of the human eye. The Out-Gamut Ratio parameter was derived by calculating the ratio of the number of distortion points present in the distortion point set to the total number of color points. The average color difference among the distortion points within the distortion point set was computed to derive the Mean Distance (mean square deviation), which serves as an indicator of the degree of dispersion of the distortion points following conversion.
Based on the data of each parameter in the table, and with that , assign weights according to the magnitudes of the parameters. Finally, the final expression of the D(gamma) function is as follows:
Ultimately, the values corresponding to each electro-optical transfer function have been determined, and the results are presented in Table 3.

Table 3.
The values of the D(gamma) function under different electro-optical transfer functions.
Figure 8 illustrates a positive correlation between the variable D(gamma) and the electro-optical transfer function value, suggesting that the distortion of the color gamut boundary intensifies as the latter increases. The various values associated with different parameters of the electro-optical transfer function are detailed in Table 2.
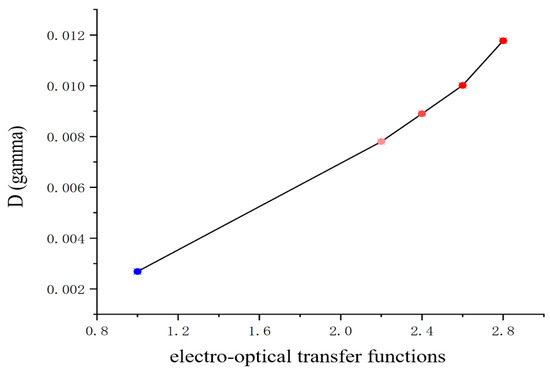
Figure 8.
The changing trend of the D function under different electro-optical functions.
4.2. Analysis of the Color Gamut Boundary Distortion Issue
The findings presented in Section 4.1 indicate that boundary distortion occurring during color gamut conversion can lead to specific colors surpassing the capacity limits of the display system, which significantly impacts the quality of the displayed outcomes. Below, comparison graphs are provided that illustrate the distortion values and target values following conversion for several key color points. The chosen key colors are determined by the color gamut boundary. Initially, the three primary colors—red, green, and blue—are selected, along with colors created by mixing one of the primary colors with another at ratios of 1/4, 1/2, and 3/4 along the line connecting each pair of primary colors. Ultimately, a test color band is created for display. The image identifies the three main colors. Each chosen test color is located at the same spot on the color strip. The image is created through color gamut conversion, influenced by various electro-optical transfer functions, as illustrated in Figure 9.
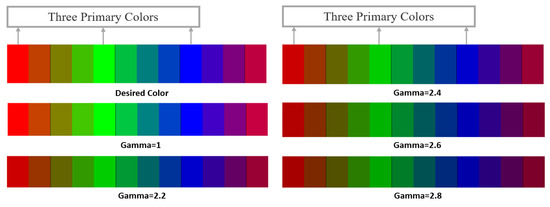
Figure 9.
Comparison of the main boundary colors under different electro-optical transfer functions.
In conducting a quantitative distribution analysis of boundary distortion within the context of color gamut conversion, it becomes evident that while linear transformations yield optimal results, the visual characteristics of the human eye necessitate the adoption of nonlinear transformations, particularly those with an electro-optical transfer function (EOTF) value exceeding 2.2. This requirement imposes specific constraints on the selection of the EOTF by the display system. A comprehensive analysis of the experimental results reveals that, despite efforts to enhance contrast, the distortion issues arising from quantization errors must not be disregarded. Furthermore, the Perceptual Quantizer (PQ) function, as defined by High Dynamic Range (HDR) standards, allocates a greater amount of information to the low-grayscale regions, thereby increasing the precision demands on the control system. The outcomes of this experiment provide a robust foundation for display terminal systems to more effectively balance various performance indicators associated with display quality following color gamut conversion.
5. Conclusions
This paper investigates the conversion of color gamut in display terminals under various electro-optical transfer functions, as well as the resultant boundary distortion issues that arise after conversion. Initially, a geometric model of the color gamut of the display terminal is developed based on principles of colorimetry and the characteristics of the display. The primary parameters involved in the color gamut conversion are thoroughly analyzed and computed. Following this, the actual operation of the control system during the color gamut conversion process is simulated utilizing the established geometric model, and the color difference attributable to the quantization error of the system is assessed. By incorporating specific functions, a detailed quantitative distribution law regarding the boundary distortion of the color gamut under different electro-optical transfer functions is examined, thereby providing significant insights for the improvement of color gamut conversion quality.
This study focuses exclusively on the conversion from the target color gamut to the original color gamut under consistent white-point conditions. It specifically considers cases in which the target color gamut is entirely contained within the original color gamut. Scenarios in which the target color gamut is not fully encompassed and displays non-overlapping regions are not addressed. In such cases, the conversion results are significantly influenced by the characteristics of the primary color that has the closest coordinates between the two color gamuts.
As discussed in Section 3, quantization precision is intricately linked to the conversion precision of the control system, which has a direct impact on the complexity of the driving circuit within the display system. An increase in quantization precision may lead to heightened circuit complexity and manufacturing costs, potentially compromising reliability. Consequently, it is inadvisable to indiscriminately enhance the precision of the control system in an effort to improve quantization.
Moreover, with the advancement of the High Dynamic Range (HDR) standard and the increasing viewing demands of audiences, the specified Perceptual Quantizer (PQ) function allocates a greater amount of information to the low-grayscale regions. The complex nature of color-point distribution along the boundary of the color gamut poses a significant challenge in selecting the appropriate electro-optical transfer function for system alignment, which must be tailored to meet various scene requirements and the specifications of the display terminal. Accurately evaluating the impact of these parameters on the boundary color points remains a considerable challenge, and identifying the optimal solution to reduce boundary distortion caused by quantization errors is equally intricate. Future research should explore these issues in greater depth to enhance understanding and develop effective strategies.
Author Contributions
J.L.: conceptualization, methodology, validation, investigation, writing—original draft. X.Z.: term, conceptualization, writing—review and editing, supervision, funding. Y.C. (Yu Chen): term, conceptualization, methodology, writing—review and editing, supervision. F.L.: writing—review and editing, supervision. D.H.: investigation, visualization. H.C.: funding acquisition, supervision. J.C.: software. Y.C. (Yufeng Chen): validation. All authors have read and agreed to the published version of the manuscript.
Funding
This work was supported by the Changchun Science and Technology Talent SpeProject—Research on Key Technologies of Full-Size Inverted COB LED Dome Display System. Task No. 23YQ15.
Data Availability Statement
Data underlying the results presented in this paper are not publicly available at this time but may be obtained from the authors upon reasonable request.
Acknowledgments
The authors would like to thank Hui Cao from Changchun Cedar Electronics Technology for his helpful comments on the manuscript. This work was financially supported by the Changchun Science and Technology Talent SpeProject—Research on Key Technologies of Full-Size Inverted COB LED Dome Display System. Task No. 23YQ15.
Conflicts of Interest
Authors Xifeng Zheng, Yufeng Chen, Hui Cao and Yu Chen were employed by the company Changchun Cedar Electronics Technology Co., Ltd. The remaining authors declare that the research was conducted in the absence of any commercial or financial relationships that could be construed as a potential conflict of interest.
References
- Ajito, T.; Ohsawa, K.; Obi, T.; Yamaguchi, M.; Ohyama, N. Color conversion method for multiprimary display using matrix switching. Opt. Rev. 2001, 8, 191–197. [Google Scholar] [CrossRef]
- Mantiuk, R.; Daly, S.; Kerofsky, L. Display adaptive tone mapping. ACM Trans. Graph. 2008, 27, 1–10. [Google Scholar] [CrossRef]
- International Commission on Illumination. Recommendations on Uniform Color Spaces, Color-Difference Equations, Psychometric Color Terms; Bureau central de la CIE: Vienna, Austria, 1978. [Google Scholar]
- ITU-R BT.709; Parameter Values for the HDTV Standards for Production and International Programme Exchange. ITU: Geneva, Switzerland, 2002.
- Subramani, B.; Veluchamy, M. Bilateral tone mapping scheme for color correction and contrast adjustment in nearly invisible medical images. Color Res. Appl. 2023, 48, 748–760. [Google Scholar] [CrossRef]
- Wen, Z.; Zhou, Z.; Liu, H.; Wang, Z.; Li, X.; Fang, F.; Wang, K.; Teo, K.L.; Sun, X.W. Color revolution: Toward ultra-wide color gamut displays. J. Phys. D Appl. Phys. 2021, 54, 213002. [Google Scholar] [CrossRef]
- Chen, H.W.; Lee, J.H.; Lin, B.Y.; Chen, S.; Wu, S.T. Liquid crystal display and organic light-emitting diode display: Present status and future perspectives. Light-Sci. Appl. 2018, 7, 17168. [Google Scholar] [CrossRef]
- Borer, T.; Cotton, A.; Wilson, P. Perceptual Uniformity for High-Dynamic-Range Television Systems. SMPTE Motion Imaging J. 2016, 125, 75–84. [Google Scholar]
- Sugawara, M.; Choi, S.Y.; Wood, D. Ultra-High-Definition Television (Rec. ITU-R BT.2020): A Generational Leap in the Evolution of Television [Standards in a Nutshell]. IEEE Signal Process. Mag. 2014, 31, 170–174. [Google Scholar] [CrossRef]
- Vrhel, M.; Trussell, H. Color device calibration: A mathematical formulation. IEEE Trans. Image Process. 1999, 8, 1796–1806. [Google Scholar] [CrossRef]
- Takeuchi, M.; Sakamoto, Y.; Yokoyama, R.; Sun, H.; Matsuo, Y.; Katto, J. Gamut-Extension Methods Considering Color Information Restoration. IEEE Access 2019, 7, 80146–80158. [Google Scholar] [CrossRef]
- Huang, S.C.; Cheng, F.C.; Chiu, Y.S. Efficient Contrast Enhancement Using Adaptive Gamma Correction With Weighting Distribution. IEEE Trans. Image Process. 2013, 22, 1032–1041. [Google Scholar] [CrossRef] [PubMed]
- Stiles, W.; Burch, J.M. Interim Report to the Commission Internationale de l’Eclairage, Zurich, 1955, on the National Physical Laboratory’s Investigation of Colour-matching (1955). Opt. Acta Int. J. Opt. 1955, 2, 168–181. [Google Scholar] [CrossRef]
- Sharma, G.; Rodriguez-Pardo, C.E. Geometry of Multiprimary Display Colors I: Gamut and Color Control. IEEE Access 2021, 9, 96573–96597. [Google Scholar] [CrossRef]
- Wyszecki, G.; Stiles, W.S. Color Science: Concepts and Methods, Quantitative Data and Formulae; John Wiley & Sons: Hoboken, NJ, USA, 2000. [Google Scholar]
- Li, T.; Yao, B.; Zhu, L.; Deng, L.; Yang, Y.; Chen, Y.; Xu, L.; Gu, C. Color gamut extension algorithm for various images based on laser display. Opt. Express 2024, 32, 3891–3911. [Google Scholar] [CrossRef]
- Rodriguez-Pardo, C.E.; Sharma, G.; Speigle, J.; Feng, X.F.; Sezan, I. Efficient Computation of Display Gamut Volumes in Perceptual Spaces. In Proceedings of the 19th Color and Imaging Conference—Color Science and Engineering Systems, Technologies, and Applications, San Jose, CA, USA, 7–11 November 2011; pp. 132–138. [Google Scholar]
- Tsai, T.H.; Lin, S.W. FPGA-based control system for real-time driving of UHD Micro-LED display with color calibration. Integration 2024, 98, 102237. [Google Scholar] [CrossRef]
- He, G.; Zheng, L. A model for LED spectra at different drive currents. Chin. Opt. Lett. 2010, 8, 1090–1094. [Google Scholar] [CrossRef]
- Liu, F.; Zheng, X.; Chen, Y.; Chen, J.; Huang, D.; Wang, Y.; Cao, H.; Mao, X. Effect of the spatial location of boundary on colour overflow in Gamut conversion. Displays 2023, 80, 102556. [Google Scholar] [CrossRef]
- Liang, W.; Bingwen, W.; Yiping, G. Analyzing Quantization Effect of Digital Control System by Cell Mapping Method. In Proceedings of the 2007 Chinese Control Conference, Zhangjiajie, China, 26–31 July 2007; pp. 97–99. [Google Scholar] [CrossRef]
- Luo, M.R.; Xu, Q.; Pointer, M.; Melgosa, M.; Cui, G.; Li, C.; Xiao, K.; Huang, M. A comprehensive test of colour-difference formulae and uniform colour spaces using available visual datasets. Color Res. Appl. 2023, 48, 267–282. [Google Scholar] [CrossRef]
- Liu, D.; Xu, G.; Zhang, Q. A discrete scheme of Laplace–Beltrami operator and its convergence over quadrilateral meshes. Comput. Math. Appl. 2008, 55, 1081–1093. [Google Scholar] [CrossRef][Green Version]
- Brainard, D.H. Color Appearance and Color Difference Specification. In The Science of Color, 2nd ed.; Elsevier: Amsterdam, The Netherlands, 2003; pp. 191–216. [Google Scholar] [CrossRef]
- Xiaoyu, S.; Min, H.; Gong, X.; Wang, D.; Li, X.; Liu, Y. Optimization and Calculation of Acceptable Color Difference for Printed Samples. Acta Opt. Sin. 2025, 45, 0133001. [Google Scholar] [CrossRef]
- Xu, Z.; Jiang, W.; Chen, W. Locate Color Tolerance for Mapping Mode Based on Human Visual and Color Difference Formula. In Proceedings of the Advanced Graphic Communications, Packaging Technology and Materials; Ouyang, Y., Xu, M., Yang, L., Ouyang, Y., Eds.; Springer: Singapore, 2016; pp. 163–169. [Google Scholar]
- Wang, H.; Cui, G.; Luo, M.R.; Xu, H. Evaluation of colour-difference formulae for different colour-difference magnitudes. Color Res. Appl. 2012, 37, 316–325. [Google Scholar] [CrossRef]
- Kaiser, P.K.; Boynton, R.M. Human Color Vision; Optical Society of America: Washington, DC, USA, 1996. [Google Scholar]
- Tansley, B.W.; Boynton, R. Chromatic border perception: The role of red- and green-sensitive cones. Vis. Res. 1978, 18, 683–697. [Google Scholar] [CrossRef] [PubMed]
Disclaimer/Publisher’s Note: The statements, opinions and data contained in all publications are solely those of the individual author(s) and contributor(s) and not of MDPI and/or the editor(s). MDPI and/or the editor(s) disclaim responsibility for any injury to people or property resulting from any ideas, methods, instructions or products referred to in the content. |
© 2025 by the authors. Licensee MDPI, Basel, Switzerland. This article is an open access article distributed under the terms and conditions of the Creative Commons Attribution (CC BY) license (https://creativecommons.org/licenses/by/4.0/).