

Multimodal Guidance for Enhancing Cyclist Road Awareness

 , , and
Abstract
1. Introduction
2. Related Works
2.1. Information Awareness in Transportation
2.2. Haptic Displays in Traffic Environments
2.3. Multimodal Displays in Traffic Environments
3. Study 1: Visual Feedback for Enhancing Cyclist Awareness
3.1. Study Design
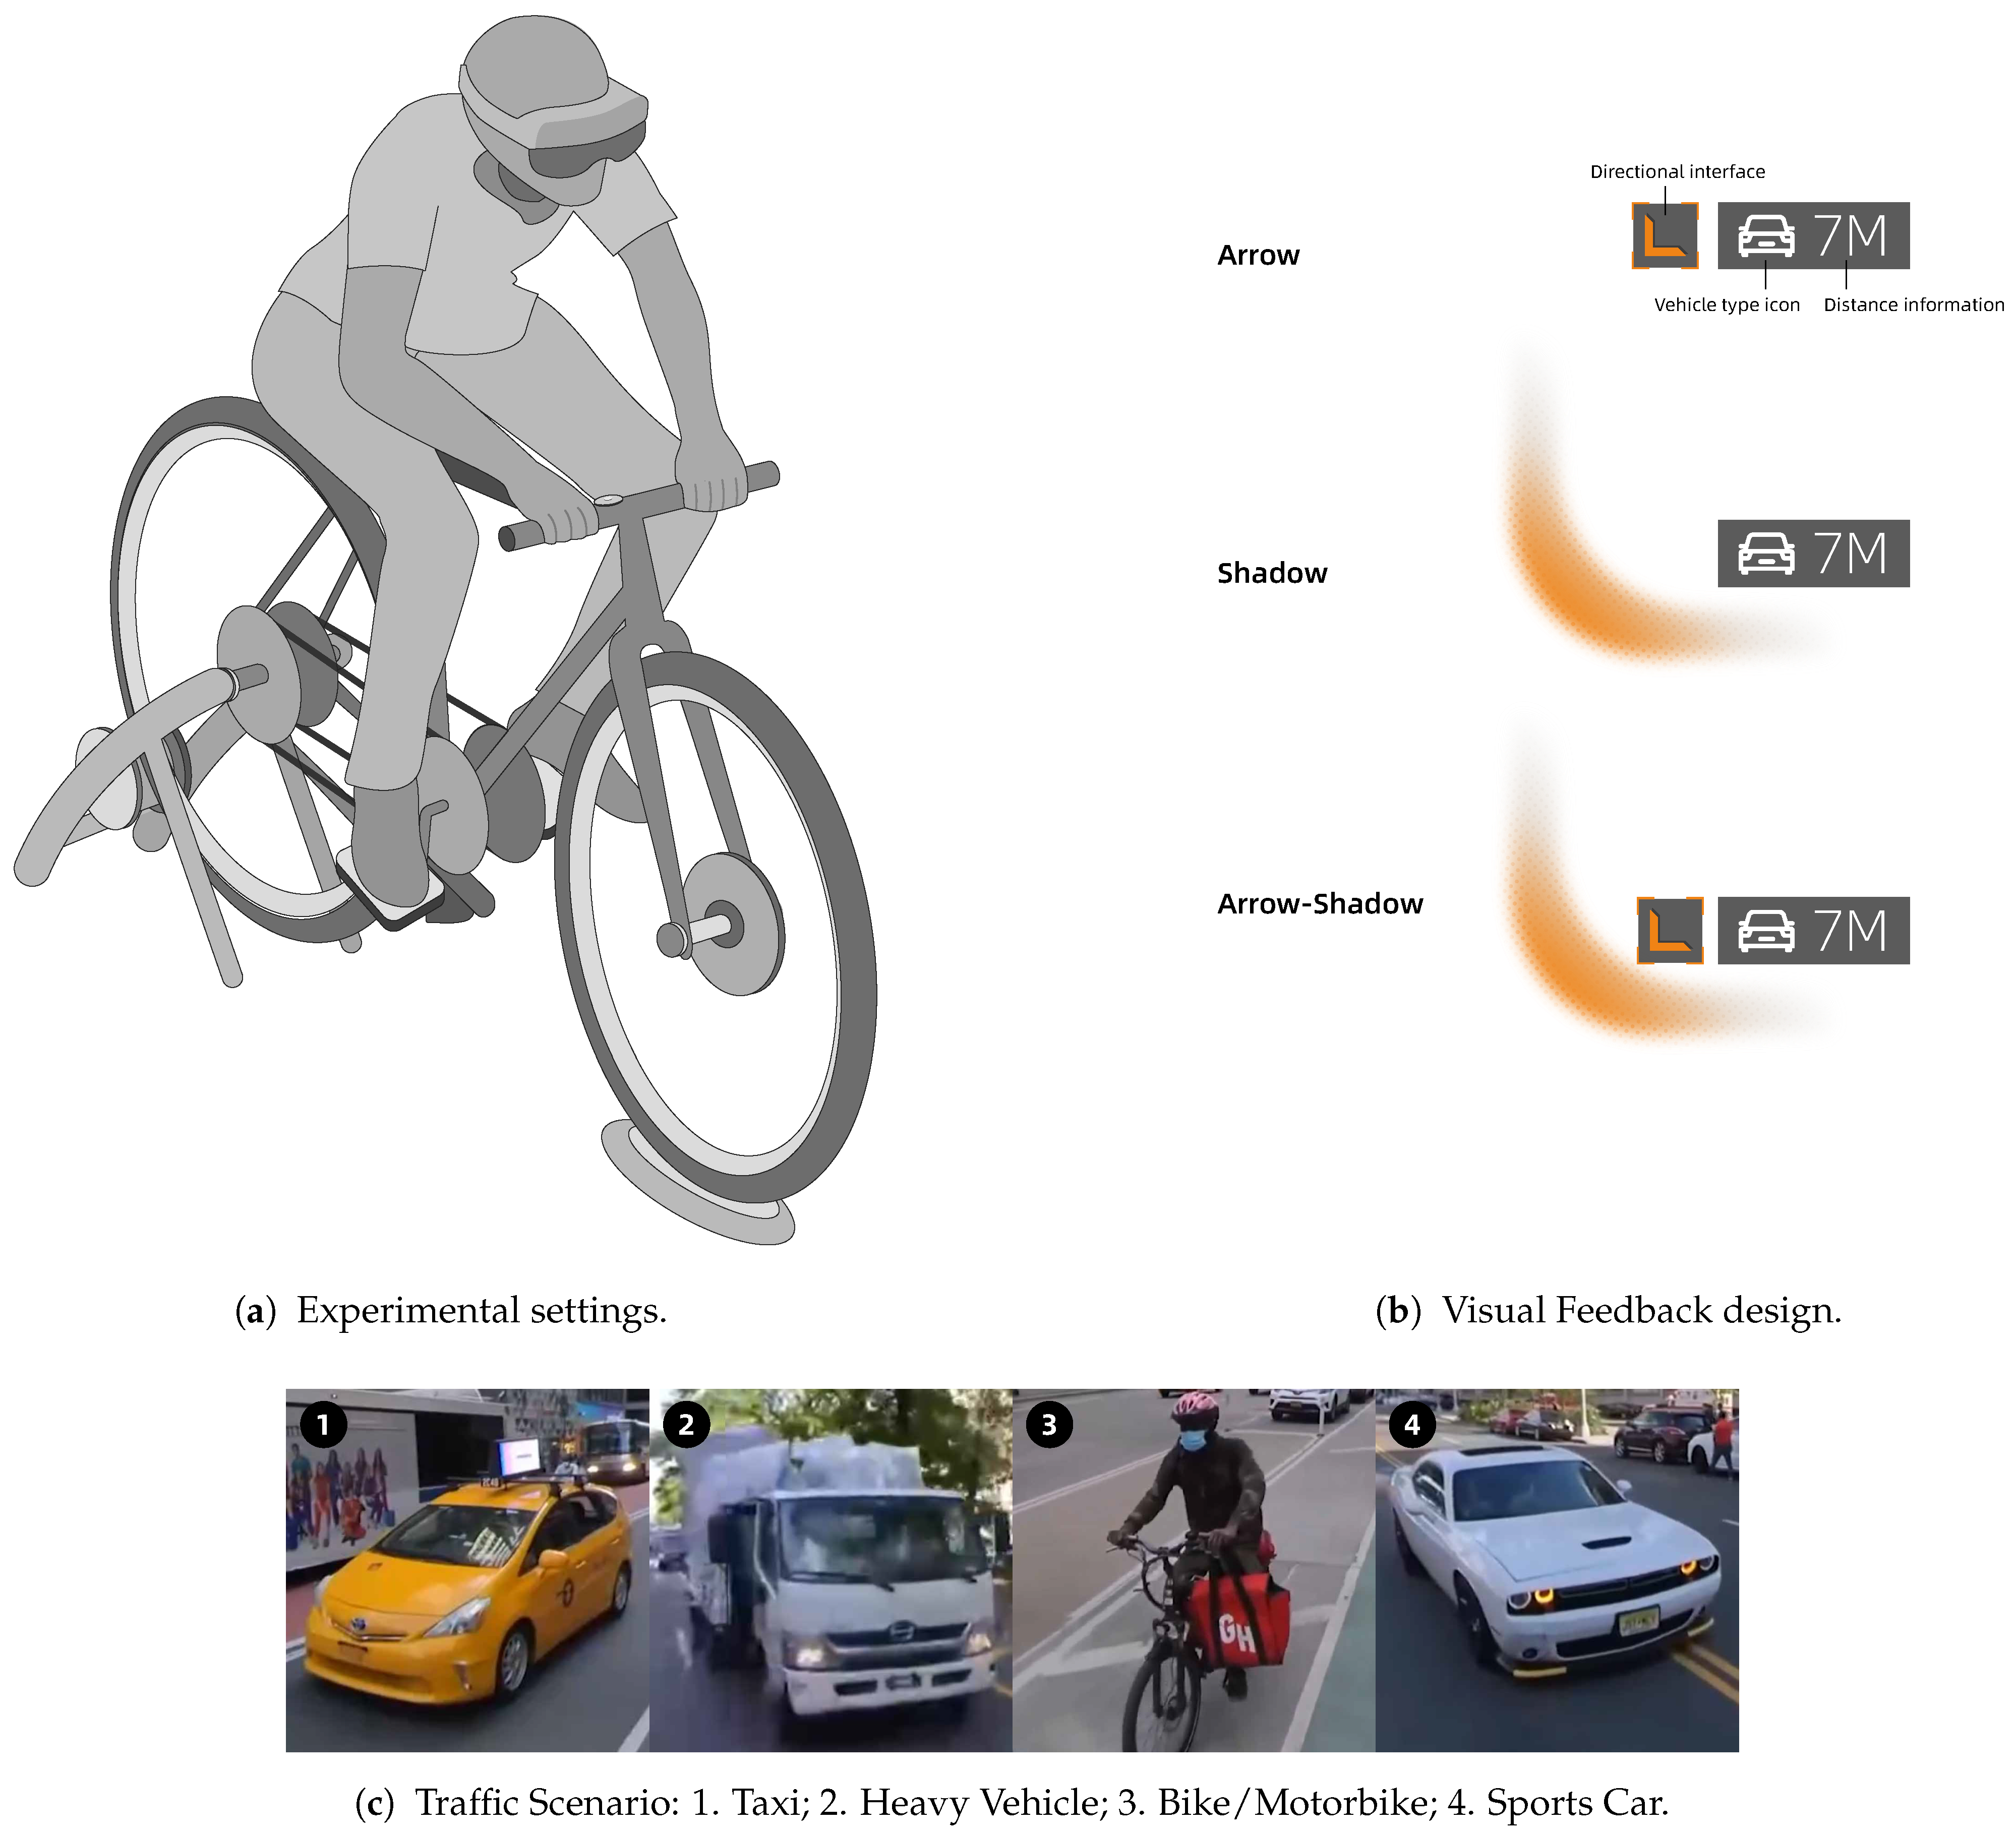
3.1.1. Visual Feedback Design
3.1.2. Experimental Settings
3.1.3. Independent Variables
- Visual Feedback (3 levels): Arrow, Shadow, and Arrow-Shadow;
- Traffic Scenario (4 levels): 1 (Taxi); 2 (Heavy Vehicle); 3 (Bike/Motorbike); 4 (Sports Car);
- Vehicle Distance (2 levels): Near (less than 4 m); far (4 m–8 m).
3.1.4. Experimental Design
3.1.5. Participants and Procedure
3.2. Results
3.2.1. Reaction Time, Search Time, and User Behavior Data in the Primary Task of Study 1
Reaction Time
Search Time
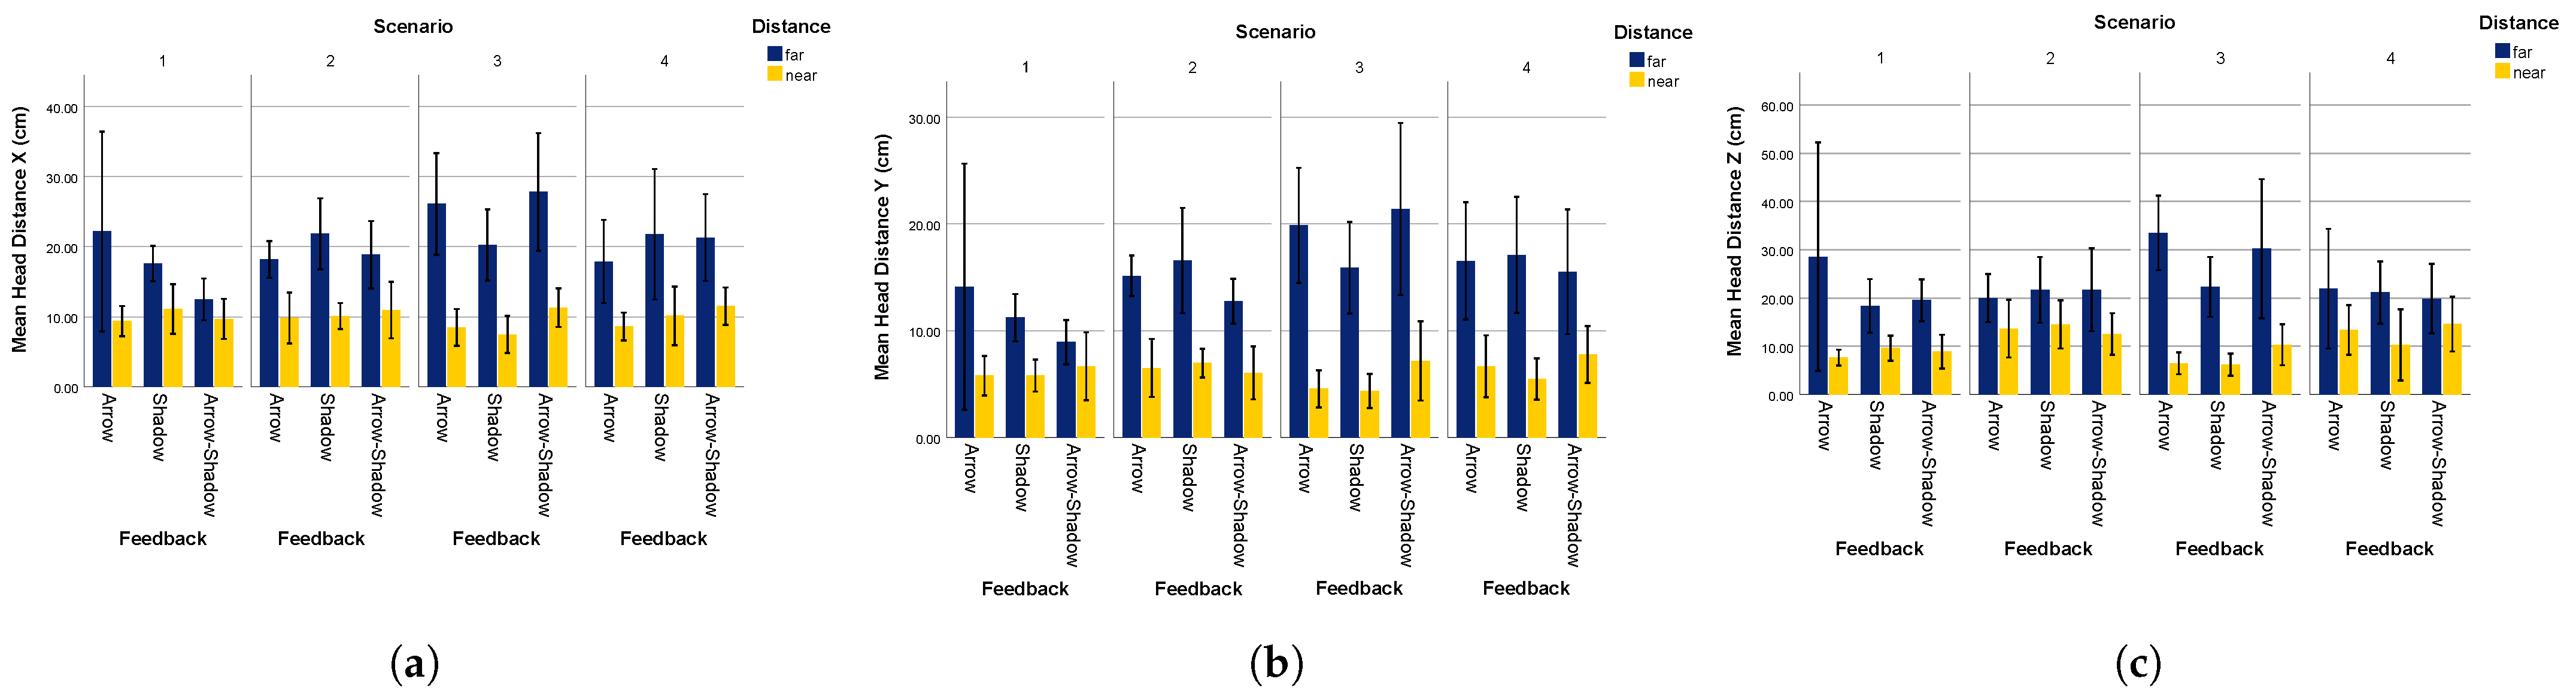
Head Rotation Angle
Head Movement Distance
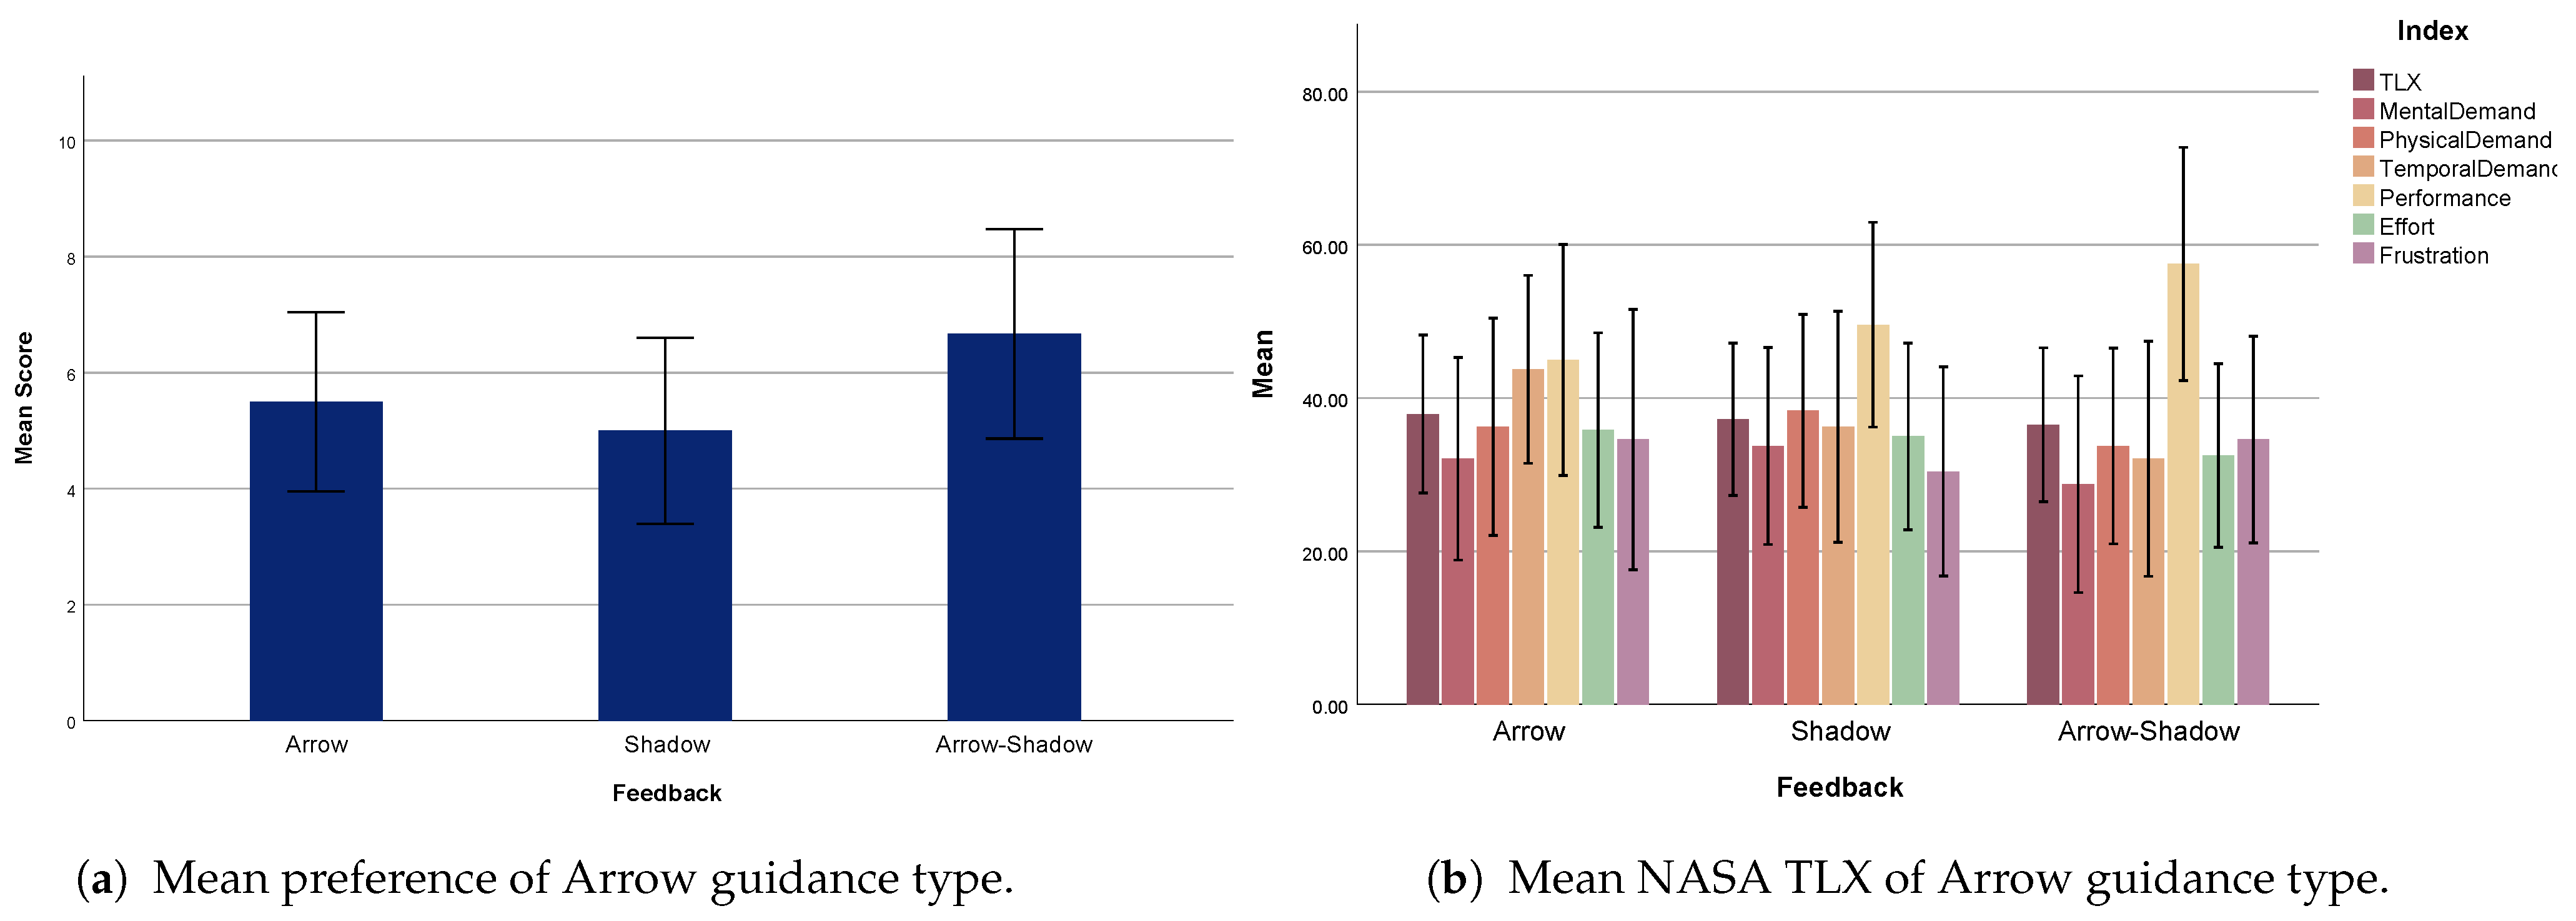
3.2.2. User Preference and Task Load
4. Study 2: Visual-Haptic Guidance Design and Evaluation
4.1. Haptic Feedback Design for Target Searching Task
4.2. Study Design
4.2.1. Experimental Settings
4.2.2. Independent Variables
- Feedback Modality (3 levels): Visual Feedback, Haptic Feedback, and Visual-Haptic Feedback;
- Traffic Scenario (4 levels): 1 (Taxi); 2 (Heavy Vehicle); 3 (Bike/Motorbike); 4 (Sports Car);
- Vehicle Distance (2 levels): Near (less than 4 m); far (4 m–8 m).
4.2.3. Experimental Design
4.2.4. Participants and Procedure
4.3. Results
4.3.1. Reaction Time, Search Time, and User Behavior Data for Study 2
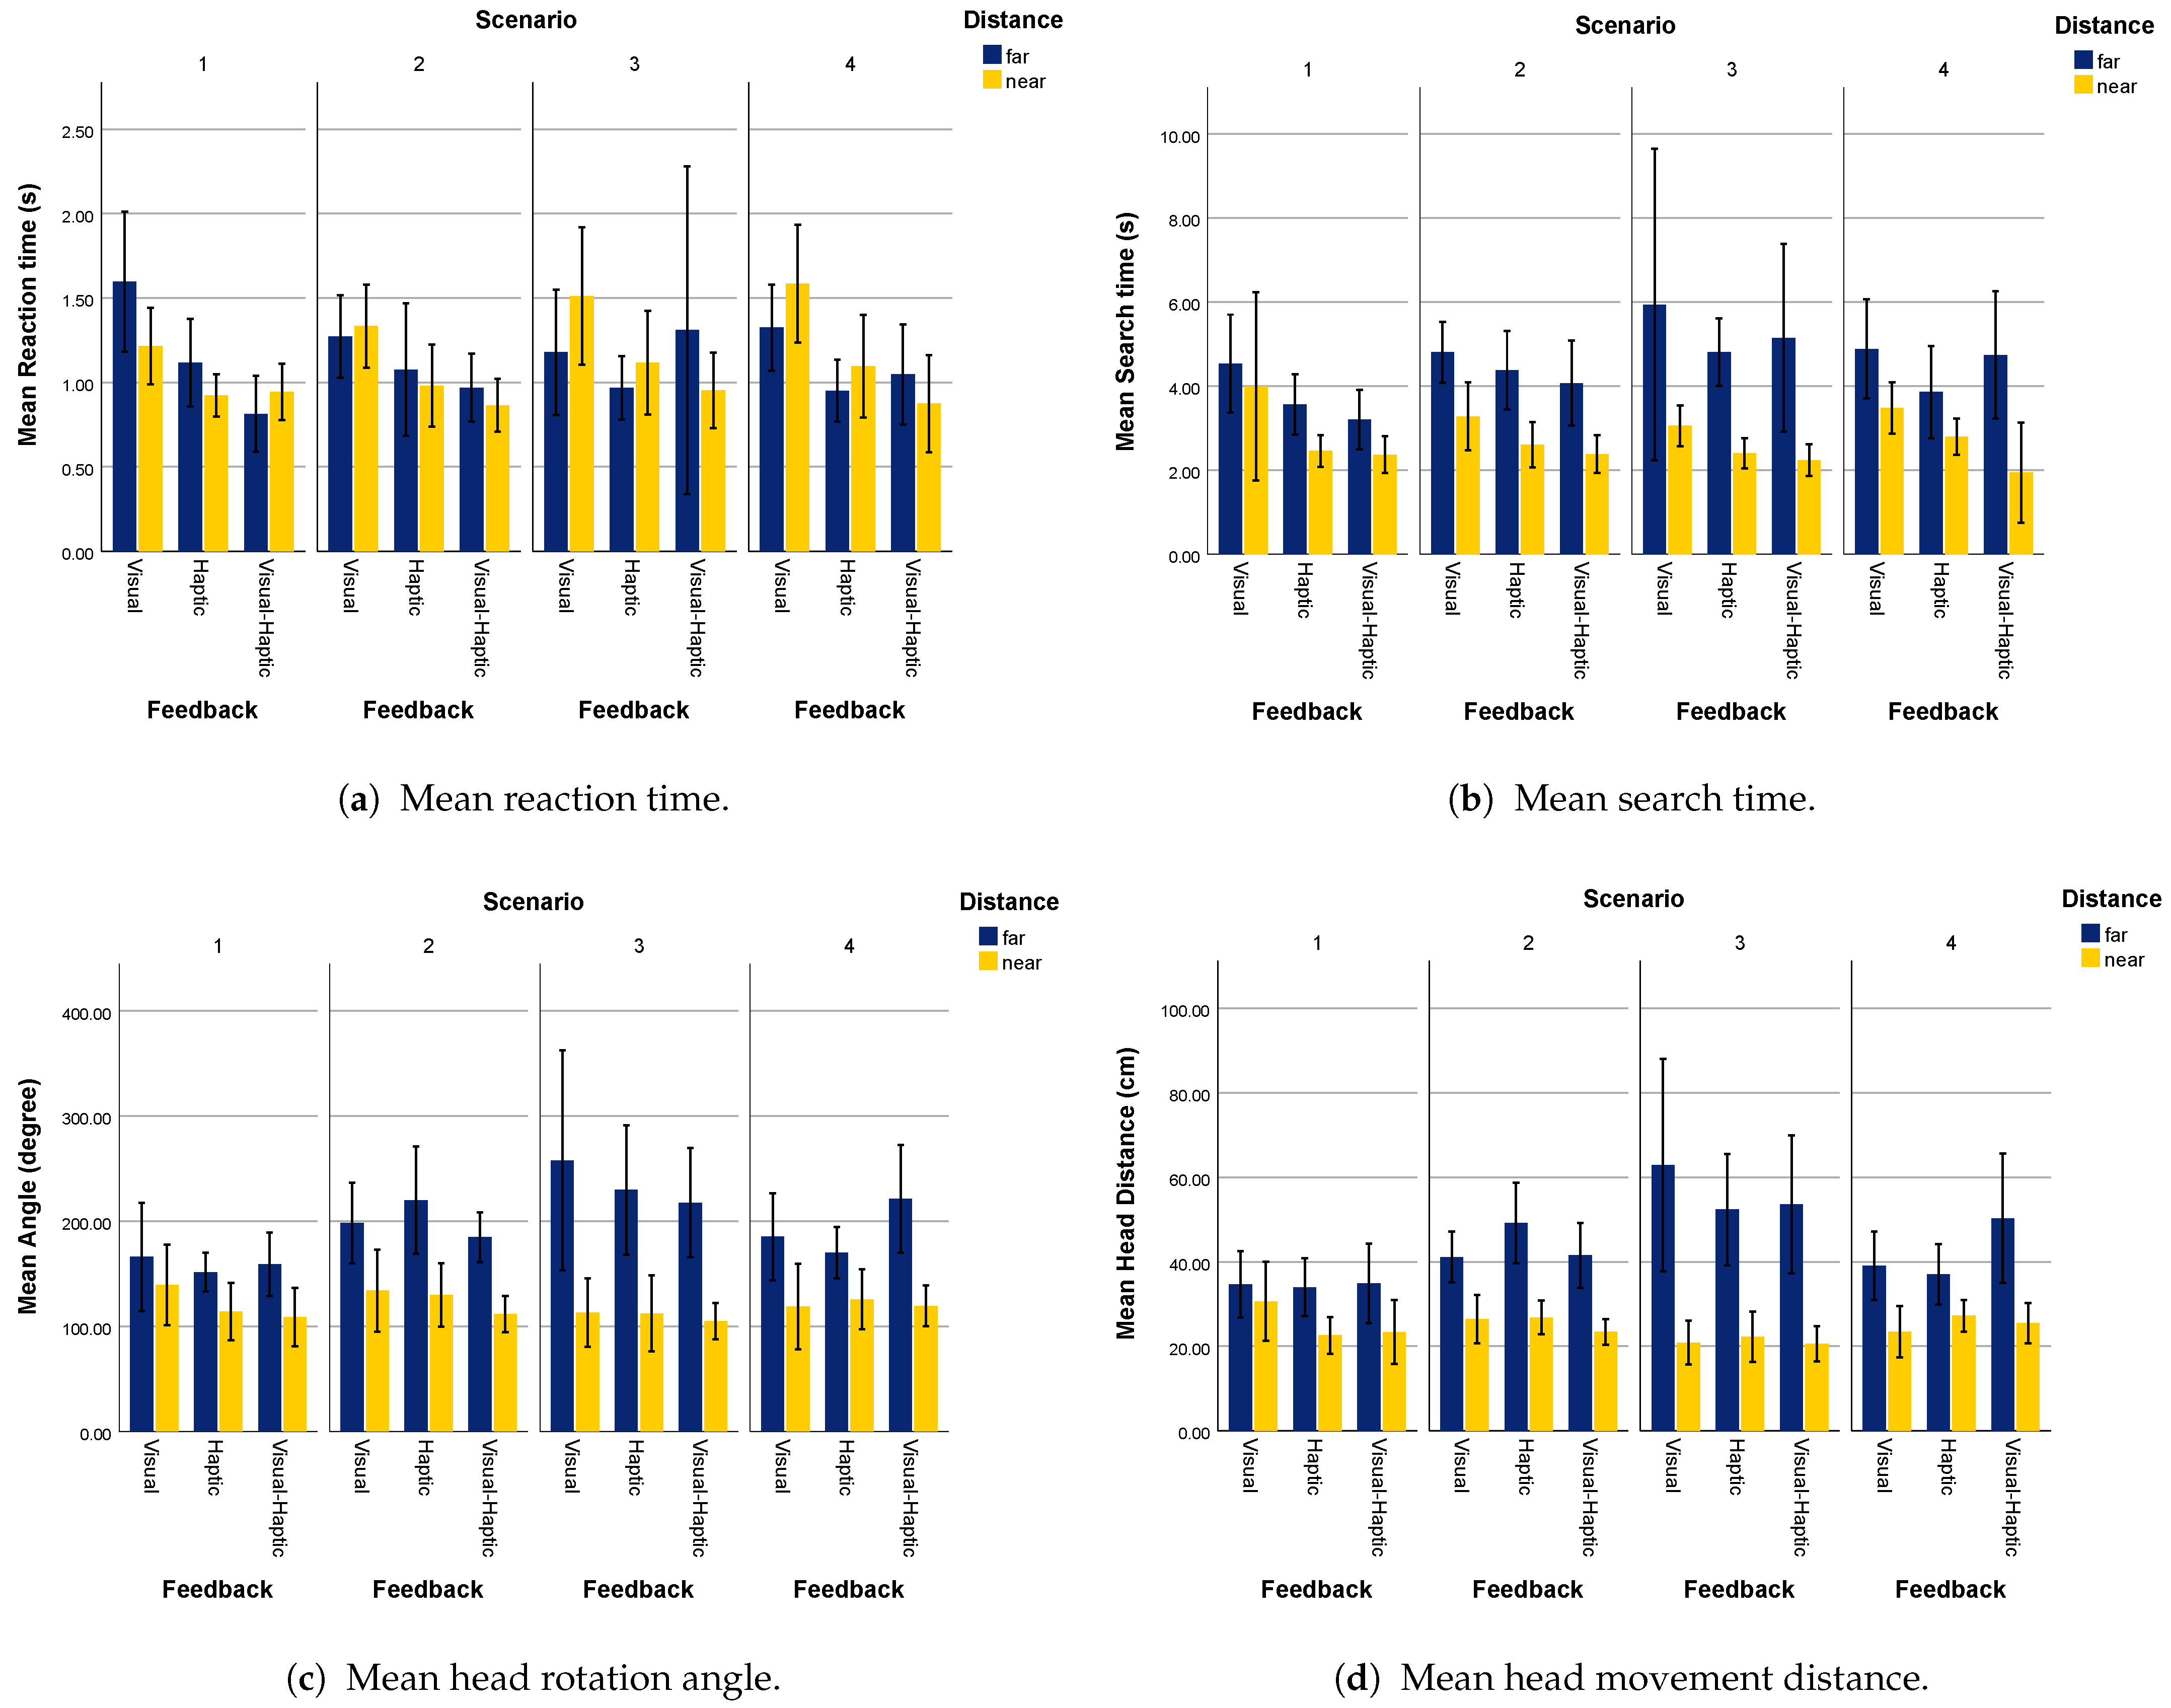
Reaction Time
Search Time
Head Rotation Angle
Head Movement Distance
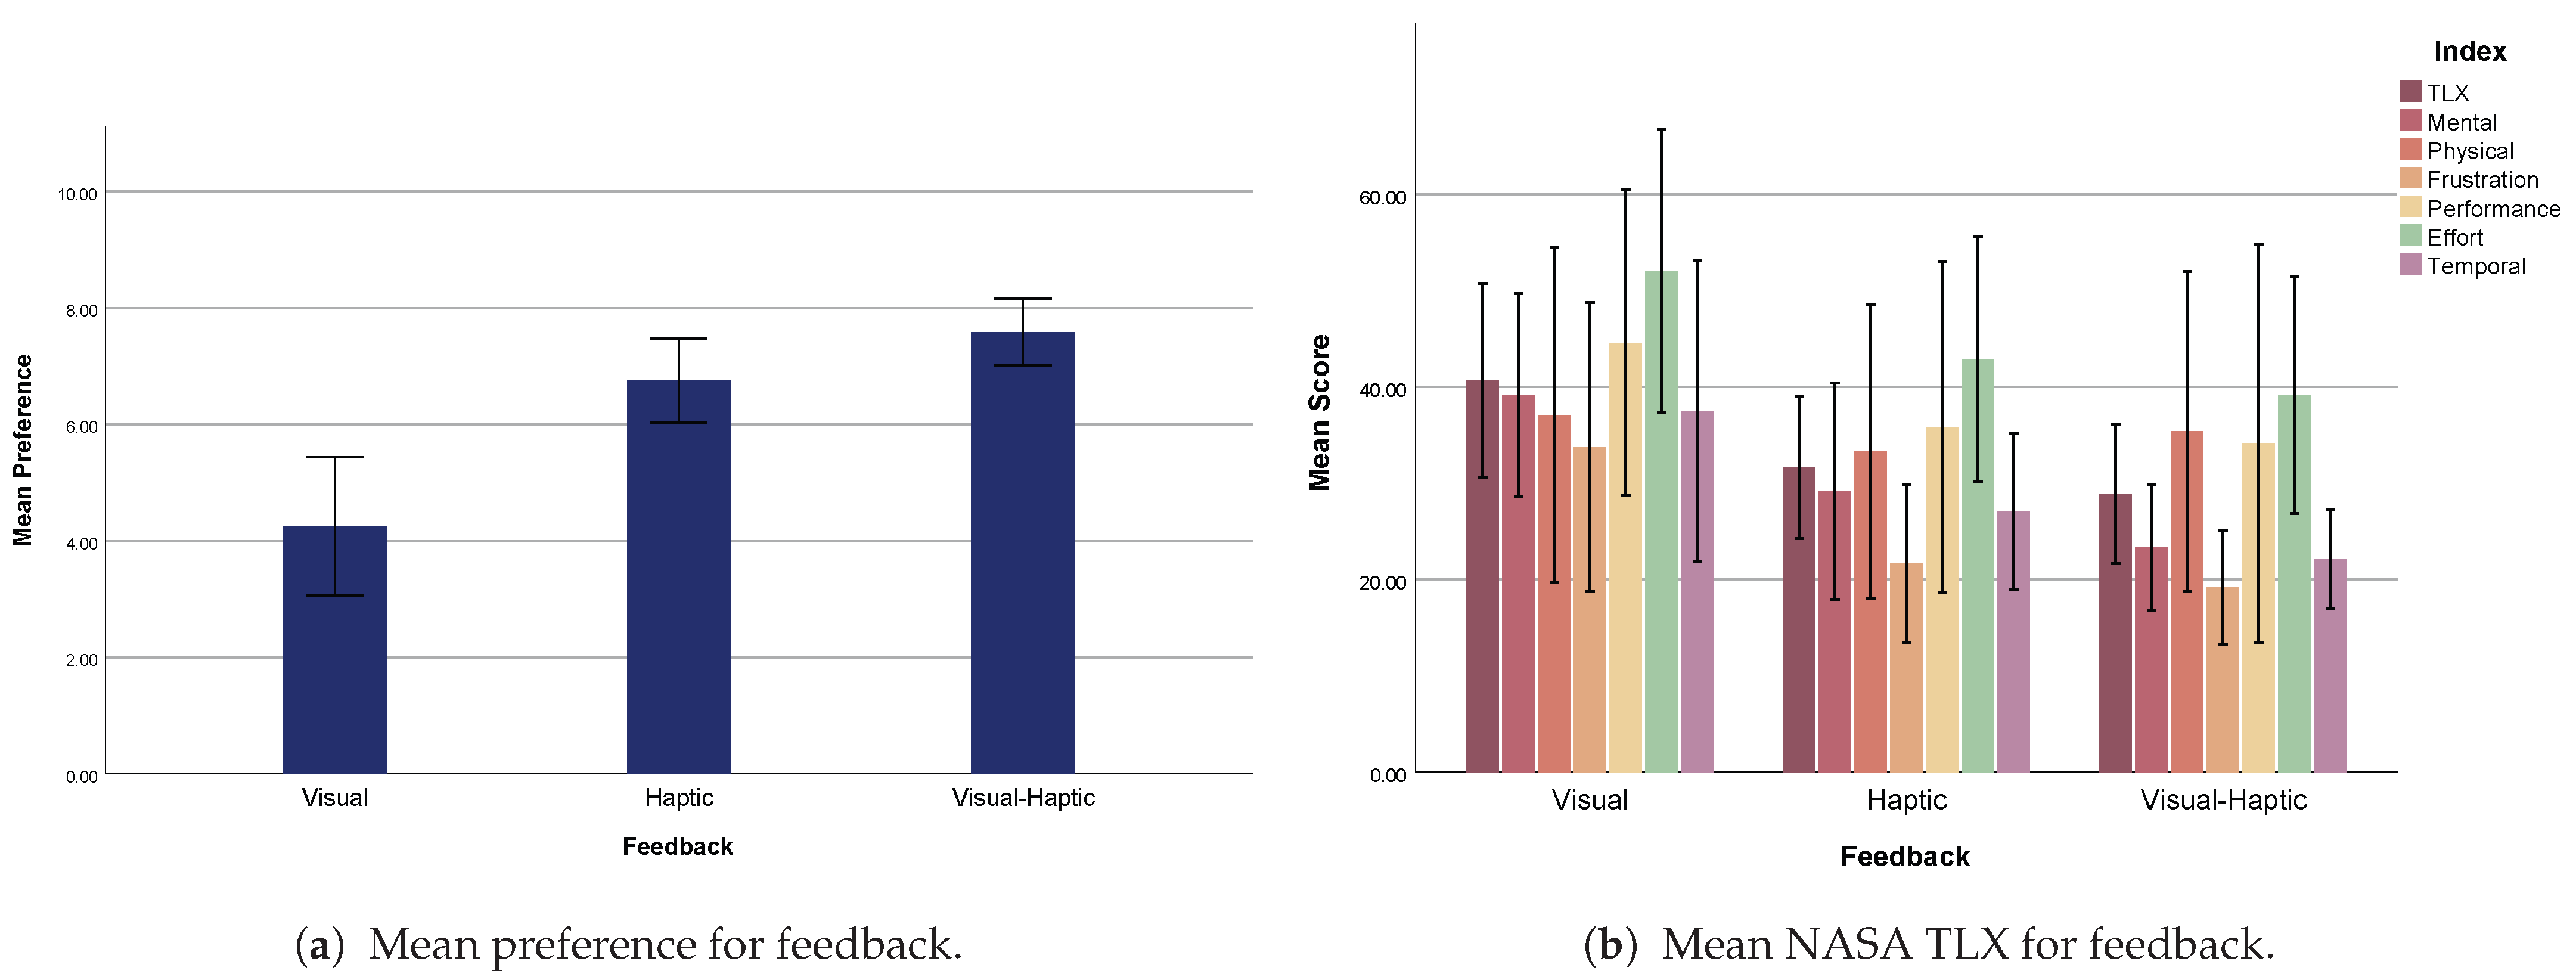
4.3.2. User Preference
5. Discussion
5.1. Effect of Visual Guidance
5.2. Effect of Haptic Feedback
5.3. Effect of Traffic Environment
6. Conclusions
Author Contributions
Funding
Institutional Review Board Statement
Informed Consent Statement
Data Availability Statement
Acknowledgments
Conflicts of Interest
Abbreviations
| VR | Virtual reality |
| HMDs | Head-mounted displays |
| MRTK | Mixed Reality Toolkit |
| 3D | Three-dimensional |
References
- World Health Organization. Global Status Report on Road Safety 2023; Technical Report; World Health Organization: Geneva, Switzerland, 2023. [Google Scholar]
- Xie, D.; Duan, X.; Ma, L.; Zhao, M.; Lu, J.; Li, C. Mixed Reality Assisted Orbital Reconstruction Navigation System for Reduction Surgery of Orbital Fracture. In Proceedings of the 2022 IEEE International Conference on Real-time Computing and Robotics (RCAR), Kunming, China, 17–21 July 2022; pp. 316–321. [Google Scholar] [CrossRef]
- Hammady, R.; Ma, M.; AL-Kalha, Z.; Strathearn, C. A framework for constructing and evaluating the role of MR as a holographic virtual guide in museums. Virtual Real. 2021, 25, 895–918. [Google Scholar] [CrossRef]
- Xiao, J.; Qian, Y.; Du, W.; Wang, Y.; Jiang, Y.; Liu, Y. VR/AR/MR in the Electricity Industry: Concepts, Techniques, and Applications. In Proceedings of the 2023 IEEE Conference on Virtual Reality and 3D User Interfaces Abstracts and Workshops (VRW), Shanghai, China, 25–26 March 2023; pp. 82–88. [Google Scholar] [CrossRef]
- Renner, P.; Pfeiffer, T. Attention guiding techniques using peripheral vision and eye tracking for feedback in augmented-reality-based assistance systems. In Proceedings of the 2017 IEEE Symposium on 3D User Interfaces (3DUI), Los Angeles, CA, USA, 18–19 March 2017; pp. 186–194. [Google Scholar] [CrossRef]
- Baudisch, P.; Rosenholtz, R. Halo: A technique for visualizing off-screen objects. In Proceedings of the SIGCHI Conference on Human Factors in Computing Systems (CHI ’03), Fort Lauderdale, FL, USA, 5–10 April 2003; Association for Computing Machinery: New York, NY, USA, 2003; pp. 481–488. [Google Scholar] [CrossRef]
- Gruenefeld, U.; Ali, A.E.; Heuten, W.; Boll, S. Visualizing out-of-view objects in head-mounted augmented reality. In Proceedings of the 19th International Conference on Human-Computer Interaction with Mobile Devices and Services (MobileHCI ’17), Vienna, Austria, 47 September 2017; Association for Computing Machinery: New York, NY, USA, 2017; pp. 1–7. [Google Scholar] [CrossRef]
- Bolton, A.; Burnett, G.; Large, D.R. An investigation of augmented reality presentations of landmark-based navigation using a head-up display. In Proceedings of the 7th International Conference on Automotive User Interfaces and Interactive Vehicular Applications (AutomotiveUI ’15), Nottingham, UK, 1–3 September 2015; Association for Computing Machinery: New York, NY, USA, 2015; pp. 56–63. [Google Scholar] [CrossRef]
- Patel, R.V.; Atashzar, S.F.; Tavakoli, M. Haptic Feedback and Force-Based Teleoperation in Surgical Robotics. Proc. IEEE 2022, 110, 1012–1027. [Google Scholar] [CrossRef]
- Jeong, S.; Yun, H.H.; Lee, Y.; Han, Y. Glow the Buzz: A VR Puzzle Adventure Game Mainly Played Through Haptic Feedback. In Proceedings of the CHI ’23: CHI Conference on Human Factors in Computing Systems, Hamburg, Germany, 23–28 April 2023. [Google Scholar]
- Jeong, C.; Kim, E.; Hwang, M.H.; Cha, H.R. Enhancing Drivers’ Perception of Traffic Lights through Haptic Alerts on the Brake Pedal. In Proceedings of the 2023 IEEE 6th International Conference on Knowledge Innovation and Invention (ICKII), Jeju Island, Republic of Korea, 27–30 July 2023; pp. 131–135. [Google Scholar] [CrossRef]
- Racat, M.; Plotkina, D. Sensory-enabling Technology in M-commerce: The Effect of Haptic Stimulation on Consumer Purchasing Behavior. Int. J. Electron. Commer. 2023, 27, 354–384. [Google Scholar] [CrossRef]
- Beheshti, E.; Borgos-Rodriguez, K.; Piper, A.M. Supporting Parent-Child Collaborative Learning through Haptic Feedback Displays. In Proceedings of the 18th ACM International Conference on Interaction Design and Children (IDC ’19), Boise, ID, USA, 12–15 June 2019; Association for Computing Machinery: New York, NY, USA, 2019; pp. 58–70. [Google Scholar] [CrossRef]
- Pacchierotti, C.; Magdanz, V.; Medina-Sánchez, M.; Schmidt, O.G.; Prattichizzo, D.; Misra, S. Intuitive control of self-propelled microjets with haptic feedback. J. Micro-Bio Robot. 2015, 10, 37–53. [Google Scholar] [CrossRef]
- Luzuriaga, M.; Aydogdu, S.; Schick, B. Boosting Advanced Driving Information: A Real-world Experiment About the Effect of HUD on HMI, Driving Effort, and Safety. Int. J. Intell. Transp. Syst. Res. 2022, 20, 181–191. [Google Scholar] [CrossRef]
- Chen, W.; Song, J.; Wang, Y.; Wu, C.; Ma, S.; Wang, D.; Yang, Z.; Li, H. Inattentional blindness to unexpected hazard in augmented reality head-up display assisted driving: The impact of the relative position between stimulus and augmented graph. Traffic Inj. Prev. 2023, 24, 344–351. [Google Scholar] [CrossRef]
- Kim, H.; Isleib, J.D.; Gabbard, J.L. Virtual Shadow: Making Cross Traffic Dynamics Visible through Augmented Reality Head Up Display. Proc. Hum. Factors Ergon. Soc. Annu. Meet. 2016, 60, 2093–2097. [Google Scholar] [CrossRef]
- Jing, C.; Shang, C.; Yu, D.; Chen, Y.; Zhi, J. The impact of different AR-HUD virtual warning interfaces on the takeover performance and visual characteristics of autonomous vehicles. Traffic Inj. Prev. 2022, 23, 277–282. [Google Scholar] [CrossRef]
- Irwin, C.; Mollica, J.A.; Desbrow, B. Sensitive and Reliable Measures of Driver Performance in Simulated Motor-Racing. Int. J. Exerc. Sci. 2019, 12, 971. [Google Scholar] [CrossRef]
- Carsten, O.; Brookhuis, K. Issues arising from the HASTE experiments. Transp. Res. Part F Traffic Psychol. Behav. 2005, 8, 191–196. [Google Scholar] [CrossRef]
- Hwang, J. A Study on the Location of Bicycle Crossing considering Safety of Bicycle Users at Intersection. J. Korean Soc. Road Eng. 2014, 16, 91–98. [Google Scholar] [CrossRef]
- Waldner, M.; Le Muzic, M.; Bernhard, M.; Purgathofer, W.; Viola, I. Attractive Flicker—Guiding Attention in Dynamic Narrative Visualizations. IEEE Trans. Vis. Comput. Graph. 2014, 20, 2456–2465. [Google Scholar] [CrossRef] [PubMed]
- Dziennus, M.; Kelsch, J.; Schieben, A. Ambient light based interaction concept for an integrative driver assistance system—A driving simulator study. In Proceedings of the 2015 IEEE 18th International Conference on Intelligent Transportation Systems (ITSC), Las Palmas, Spain, 15–18 September 2015. [Google Scholar]
- Van Veen, T.; Karjanto, J.; Terken, J. Situation Awareness in Automated Vehicles through Proximal Peripheral Light Signals. In Proceedings of the 9th International Conference on Automotive User Interfaces and Interactive Vehicular Applications, Oldenburg, Germany, 24–27 September 2017; ACM: Oldenburg, Germany, 2017; pp. 287–292. [Google Scholar] [CrossRef]
- Von Sawitzky, T.; Grauschopf, T.; Riener, A. “Attention! A Door Could Open.”—Introducing Awareness Messages for Cyclists to Safely Evade Potential Hazards. Multimodal Technol. Interact. 2021, 6, 3. [Google Scholar] [CrossRef]
- Schinke, T.; Henze, N.; Boll, S. Visualization of off-screen objects in mobile augmented reality. In Proceedings of the 12th International Conference on Human Computer Interaction With Mobile Devices and Services, Lisbon, Portugal, 7–10 September 2010; ACM: Lisbon, Portugal, 2010; pp. 313–316. [Google Scholar] [CrossRef]
- Warden, A.C.; Wickens, C.D.; Mifsud, D.; Ourada, S.; Clegg, B.A.; Ortega, F.R. Visual Search in Augmented Reality: Effect of Target Cue Type and Location. Proc. Hum. Factors Ergon. Soc. Annu. Meet. 2022, 66, 373–377. [Google Scholar] [CrossRef]
- Wieland, J.; Garcia, R.C.H.; Reiterer, H.; Feuchtner, T. Arrow, Bézier Curve, or Halos?—Comparing 3D Out-of-View Object Visualization Techniques for Handheld Augmented Reality. In Proceedings of the 2022 IEEE International Symposium on Mixed and Augmented Reality (ISMAR), Singapore, 17–21 October 2022; IEEE: Singapore, 2022; pp. 797–806. [Google Scholar] [CrossRef]
- Woodworth, J.W.; Yoshimura, A.; Lipari, N.G.; Borst, C.W. Design and Evaluation of Visual Cues for Restoring and Guiding Visual Attention in Eye-Tracked VR. In Proceedings of the 2023 IEEE Conference on Virtual Reality and 3D User Interfaces Abstracts and Workshops (VRW), Shanghai, China, 25–26 March 2023; pp. 442–450, ISBN 9798350348392. [Google Scholar] [CrossRef]
- Matviienko, A.; Mehmedovic, D.; Müller, F.; Mühlhäuser, M. “Baby, You can Ride my Bike”: Exploring Maneuver Indications of Self-Driving Bicycles using a Tandem Simulator. Proc. ACM Hum.-Comput. Interact. 2022, 6, 1–21. [Google Scholar] [CrossRef]
- Tseng, H.Y.; Liang, R.H.; Chan, L.; Chen, B.Y. LEaD: Utilizing Light Movement as Peripheral Visual Guidance for Scooter Navigation. In Proceedings of the 17th International Conference on Human-Computer Interaction with Mobile Devices and Services, Copenhagen, Denmark, 24–27 August 2015; pp. 323–326. [Google Scholar] [CrossRef]
- Matviienko, A.; Ananthanarayan, S.; Brewster, S.; Heuten, W.; Boll, S. Comparing unimodal lane keeping cues for child cyclists. In Proceedings of the 18th International Conference on Mobile and Ubiquitous Multimedia, Pisa, Italy, 27–30 November 2019; pp. 1–11, ISBN 9781450376242. [Google Scholar] [CrossRef]
- Von Sawitzky, T.; Grauschopf, T.; Riener, A. No Need to Slow Down! A Head-up Display Based Warning System for Cyclists for Safe Passage of Parked Vehicles. In Proceedings of the 12th International Conference on Automotive User Interfaces and Interactive Vehicular Applications, Virtual Event, 21–22 September 2020; pp. 1–3, ISBN 9781450380669. [Google Scholar] [CrossRef]
- Chen, H.; Zendehdel, N.; Leu, M.C.; Yin, Z. Fine-grained activity classification in assembly based on multi-visual modalities. J. Intell. Manuf. 2024, 35, 2215–2233. [Google Scholar] [CrossRef]
- Herslund, M.B.; Jørgensen, N.O. Looked-but-failed-to-see-errors in traffic. Accid. Anal. Prev. 2003, 35, 885–891. [Google Scholar] [CrossRef]
- Shakeri, G.; Ng, A.; Williamson, J.H.; Brewster, S.A. Evaluation of Haptic Patterns on a Steering Wheel. In Proceedings of the 8th International Conference on Automotive User Interfaces and Interactive Vehicular Applications, Ann Arbor, MI, USA, 24–26 October 2016; pp. 129–136, ISBN 9781450345330. [Google Scholar] [CrossRef]
- Van Erp, J.B.; Van Veen, H.A. Vibrotactile in-vehicle navigation system. Transp. Res. Part F Traffic Psychol. Behav. 2004, 7, 247–256. [Google Scholar] [CrossRef]
- Birrell, S.A.; Young, M.S.; Weldon, A.M. Vibrotactile pedals: Provision of haptic feedback to support economical driving. Ergonomics 2013, 56, 282–292. [Google Scholar] [CrossRef]
- Matviienko, A.; Müller, F.; Schön, D.; Fayard, R.; Abaspur, S.; Li, Y.; Mühlhäuser, M. E-ScootAR: Exploring Unimodal Warnings for E-Scooter Riders in Augmented Reality. In Proceedings of the CHI Conference on Human Factors in Computing Systems Extended Abstracts (CHI ’22), New Orleans, LA, USA, 30 April–5 May 2022; pp. 1–7. [Google Scholar] [CrossRef]
- Bial, D.; Appelmann, T.; Rukzio, E.; Schmidt, A. Improving Cyclists Training with Tactile Feedback on Feet. In Haptic and Audio Interaction Design Series Title: Lecture Notes in Computer Science; Springer: Berlin/Heidelberg, Germany, 2012; Volume 7468, pp. 41–50. [Google Scholar] [CrossRef]
- Poppinga, B.; Pielot, M.; Boll, S. Tacticycle: A tactile display for supporting tourists on a bicycle trip. In Proceedings of the 11th International Conference on Human-Computer Interaction with Mobile Devices and Services, Bonn, Germany, 15–18 September 2009; ACM: Bonn, Germany, 2009; pp. 1–4. [Google Scholar] [CrossRef]
- Pielot, M.; Poppinga, B.; Heuten, W.; Boll, S. Tacticycle: Supporting exploratory bicycle trips. In Proceedings of the 14th International Conference on Human-Computer Interaction With Mobile Devices and Services (MobileHCI ’12), San Francisco, CA, USA, 21–24 September 2012; pp. 369–378, ISBN 9781450311052. [Google Scholar] [CrossRef]
- Bial, D.; Kern, D.; Alt, F.; Schmidt, A. Enhancing outdoor navigation systems through vibrotactile feedback. In Proceedings of the CHI ’11 Extended Abstracts on Human Factors in Computing Systems, Vancouver, BC, Canada, 7–12 May 2011; pp. 1273–1278, ISBN 9781450302685. [Google Scholar] [CrossRef]
- Prasad, M.; Taele, P.; Goldberg, D.; Hammond, T.A. HaptiMoto: Turn-by-turn haptic route guidance interface for motorcyclists. In Proceedings of the SIGCHI Conference on Human Factors in Computing Systems (CHI ’14), Toronto, ON, Canada, 26 April–1 May 2014; pp. 3597–3606. [Google Scholar] [CrossRef]
- Steltenpohl, H.; Bouwer, A. Vibrobelt: Tactile navigation support for cyclists. In Proceedings of the 2013 International Conference on Intelligent User Interfaces, Santa Monica, CA, USA, 19–22 March 2013; ACM: Santa Monica, CA, USA, 2013; pp. 417–426. [Google Scholar] [CrossRef]
- Kiss, F.; Boldt, R.; Pfleging, B.; Schneegass, S. Navigation Systems for Motorcyclists: Exploring Wearable Tactile Feedback for Route Guidance in the Real World. In Proceedings of the 2018 CHI Conference on Human Factors in Computing Systems (CHI ’18), Montreal, QC, Canada, 21–26 April 2018; pp. 1–7, ISBN 9781450356206. [Google Scholar] [CrossRef]
- Matviienko, A.; Ananthanarayan, S.; El Ali, A.; Heuten, W.; Boll, S. NaviBike: Comparing Unimodal Navigation Cues for Child Cyclists. In Proceedings of the 2019 CHI Conference on Human Factors in Computing Systems (CHI ’19), Glasgow, UK, 4–9 May 2019; pp. 1–12, ISBN 9781450359702. [Google Scholar] [CrossRef]
- Vo, D.B.; Saari, J.; Brewster, S. TactiHelm: Tactile Feedback in a Cycling Helmet for Collision Avoidance. In Proceedings of the Extended Abstracts of the 2021 CHI Conference on Human Factors in Computing Systems (CHI ’21), Yokohama, Japan, 8–13 May 2021; pp. 1–5, ISBN 9781450380959. [Google Scholar] [CrossRef]
- Geitner, C.; Biondi, F.; Skrypchuk, L.; Jennings, P.; Birrell, S. The comparison of auditory, tactile, and multimodal warnings for the effective communication of unexpected events during an automated driving scenario. Transp. Res. Part F Traffic Psychol. Behav. 2019, 65, 23–33. [Google Scholar] [CrossRef]
- Ho, C.; Gray, R.; Spence, C. Reorienting Driver Attention with Dynamic Tactile Cues. IEEE Trans. Haptics 2014, 7, 86–94. [Google Scholar] [CrossRef] [PubMed]
- Wu, C.; Wu, H.; Lyu, N.; Zheng, M. Take-Over Performance and Safety Analysis Under Different Scenarios and Secondary Tasks in Conditionally Automated Driving. IEEE Access 2019, 7, 136924–136933. [Google Scholar] [CrossRef]
- Petermeijera, M.; Cielerb, S.; Winterc, J.C.F.D. Comparing spatially static and dynamic vibrotactile take-over requests in the driver seat. In Proceedings of the 9th International Conference on Automotive User Interfaces and Interactive Vehicular Applications (AutomotiveUI ’17), Oldenburg, Germany, 24–27 September 2017; pp. 287–292. [Google Scholar] [CrossRef]
- Petermeijer, S.; Bazilinskyy, P.; Bengler, K.; De Winter, J. Take-over again: Investigating multimodal and directional TORs to get the driver back into the loop. Appl. Ergon. 2017, 62, 204–215. [Google Scholar] [CrossRef] [PubMed]
- Huang, G.; Pitts, B.J. To Inform or to Instruct? An Evaluation of Meaningful Vibrotactile Patterns to Support Automated Vehicle Takeover Performance. IEEE Trans. Hum.-Mach. Syst. 2023, 53, 678–687. [Google Scholar] [CrossRef]
- Petermeijer, S.M.; De Winter, J.C.F.; Bengler, K.J. Vibrotactile Displays: A Survey With a View on Highly Automated Driving. IEEE Trans. Intell. Transp. Syst. 2016, 17, 897–907. [Google Scholar] [CrossRef]
- Prewett, M.S.; Elliott, L.R.; Walvoord, A.G.; Coovert, M.D. A Meta-Analysis of Vibrotactile and Visual Information Displays for Improving Task Performance. IEEE Trans. Syst. Man Cybern. Part C (Appl. Rev.) 2012, 42, 123–132. [Google Scholar] [CrossRef]
- Matviienko, A.; Ananthanarayan, S.; Borojeni, S.S.; Feld, Y.; Heuten, W.; Boll, S. Augmenting bicycles and helmets with multimodal warnings for children. In Proceedings of the 20th International Conference on Human-Computer Interaction with Mobile Devices and Services (MobileHCI ’18), Barcelona, Spain, 3–6 September 2018; pp. 1–13, ISBN 9781450358989. [Google Scholar] [CrossRef]
- Wang, M.; Liao, Y.; Lyckvi, S.L.; Chen, F. How drivers respond to visual vs. auditory information in advisory traffic information systems. Behav. Inf. Technol. 2020, 39, 1308–1319. [Google Scholar] [CrossRef]
- Pietra, A.; Vazquez Rull, M.; Etzi, R.; Gallace, A.; Scurati, G.W.; Ferrise, F.; Bordegoni, M. Promoting eco-driving behavior through multisensory stimulation: A preliminary study on the use of visual and haptic feedback in a virtual reality driving simulator. Virtual Real. 2021, 25, 945–959. [Google Scholar] [CrossRef]
- Fitch, G.M.; Kiefer, R.J.; Hankey, J.M.; Kleiner, B.M. Toward Developing an Approach for Alerting Drivers to the Direction of a Crash Threat. Hum. Factors J. Hum. Factors Ergon. Soc. 2007, 49, 710–720. [Google Scholar] [CrossRef]
- Yu, D.; Park, C.; Choi, H.; Kim, D.; Hwang, S.H. Takeover Safety Analysis with Driver Monitoring Systems and Driver–Vehicle Interfaces in Highly Automated Vehicles. Appl. Sci. 2021, 11, 6685. [Google Scholar] [CrossRef]
- Matviienko, A.; Ananthanarayan, S.; Kappes, R.; Heuten, W.; Boll, S. Reminding child cyclists about safety gestures. In Proceedings of the 9TH ACM International Symposium on Pervasive Displays, Virtual Event, 4–5 June 2020; pp. 1–7. [Google Scholar] [CrossRef]
- Müller, A.; Ogrizek, M.; Bier, L.; Abendroth, B. Design concept for a visual, vibrotactile and acoustic take-over request in a conditional automated vehicle during non-driving-related tasks. In Proceedings of the 10th International Conference on Automotive User Interfaces and Interactive Vehicular Applications (AutomotiveUI ’18), Toronto, ON, Canada, 23–25 September 2018; pp. 210–220. [Google Scholar] [CrossRef]
- Bazilinskyy, P.; Petermeijer, S.; Petrovych, V.; Dodou, D.; De Winter, J. Take-over requests in highly automated driving: A crowdsourcing survey on auditory, vibrotactile, and visual displays. Transp. Res. Part F Traffic Psychol. Behav. 2018, 56, 82–98. [Google Scholar] [CrossRef]
- Cobus, V.; Meyer, H.; Ananthanarayan, S.; Boll, S.; Heuten, W. Towards reducing alarm fatigue: Peripheral light pattern design for critical care alarms. In Proceedings of the 10th Nordic Conference on Human-Computer Interaction, Oslo, Norway, 29 September–3 October 2018; pp. 654–663. [Google Scholar] [CrossRef]
- Gruenefeld, U.; Stratmann, T.C.; Jung, J.; Lee, H.; Choi, J.; Nanda, A.; Heuten, W. Guiding Smombies: Augmenting Peripheral Vision with Low-Cost Glasses to Shift the Attention of Smartphone Users. In Proceedings of the 2018 IEEE International Symposium on Mixed and Augmented Reality Adjunct (ISMAR-Adjunct), Munich, Germany, 16–20 October 2018; pp. 127–131. [Google Scholar] [CrossRef]
- Yun, H.; Yang, J.H. Multimodal warning design for take-over request in conditionally automated driving. Eur. Transp. Res. Rev. 2020, 12, 34. [Google Scholar] [CrossRef]
- Calvi, A.; D’Amico, F.; Ferrante, C.; Bianchini Ciampoli, L. Evaluation of augmented reality cues to improve the safety of left-turn maneuvers in a connected environment: A driving simulator study. Accid. Anal. Prev. 2020, 148, 105793. [Google Scholar] [CrossRef]
- Wu, Y.; Abdel-Aty, M.; Zheng, O.; Cai, Q.; Yue, L. Developing a Crash Warning System for the Bike Lane Area at Intersections with Connected Vehicle Technology. Transp. Res. Rec. 2019, 2673, 47–58. [Google Scholar] [CrossRef]
- Kim, H.; Gabbard, J.L. Assessing Distraction Potential of Augmented Reality Head-Up Displays for Vehicle Drivers. Hum. Factors 2022, 64, 852–865. [Google Scholar] [CrossRef]
- Wang, J.; Yang, J.; Fu, Q.; Zhang, J.; Zhang, J. A new dynamic spatial information design framework for AR-HUD to evoke drivers’ instinctive responses and improve accident prevention. Int. J. Hum.-Comput. Stud. 2024, 183, 103194. [Google Scholar] [CrossRef]
- You, F.; Liang, Y.; Fu, Q.; Zhang, J. Exploring the Role of AR Cognitive Interface in Enhancing Human-Vehicle Collaborative Driving Safety: A Design Perspective. Int. J. Hum.–Comput. Interact. 2024, 41, 115–135. [Google Scholar] [CrossRef]
- Virtanen, K.; Mansikka, H.; Kontio, H.; Harris, D. Weight watchers: NASA-TLX weights revisited. Theor. Issues Ergon. Sci. 2022, 23, 725–748. [Google Scholar] [CrossRef]
- Noyes, J.M.; Bruneau, D.P.J. A self-analysis of the NASA-TLX workload measure. Ergonomics 2007, 50, 514–519. [Google Scholar] [CrossRef]
- Astin, A.; Nussbaum, M.A. Interactive Effects of Physical and Mental Workload on Subjective Workload Assessment. Proc. Hum. Factors Ergon. Soc. Annu. Meet. 2002, 46, 1100–1104. [Google Scholar] [CrossRef]
- Trepkowski, C.; Marquardt, A.; Eibich, T.D.; Shikanai, Y.; Maiero, J.; Kiyokawa, K.; Kruijff, E.; Schoning, J.; Konig, P. Multisensory Proximity and Transition Cues for Improving Target Awareness in Narrow Field of View Augmented Reality Displays. IEEE Trans. Vis. Comput. Graph. 2022, 28, 1342–1362. [Google Scholar] [CrossRef] [PubMed]
- Marquardt, A.; Trepkowski, C.; Eibich, T.D.; Maiero, J.; Kruijff, E. Non-Visual Cues for View Management in Narrow Field of View Augmented Reality Displays. In Proceedings of the 2019 IEEE International Symposium on Mixed and Augmented Reality (ISMAR), Beijing, China, 14–18 October 2019; pp. 190–201. [Google Scholar] [CrossRef]
- Marquardt, A.; Trepkowski, C.; Eibich, T.D.; Maiero, J.; Kruijff, E.; Schoning, J. Comparing Non-Visual and Visual Guidance Methods for Narrow Field of View Augmented Reality Displays. IEEE Trans. Vis. Comput. Graph. 2020, 26, 3389–3401. [Google Scholar] [CrossRef] [PubMed]
- Lehtinen, V.; Oulasvirta, A.; Salovaara, A.; Nurmi, P. Dynamic tactile guidance for visual search tasks. In Proceedings of the 25th Annual ACM Symposium on User Interface Software and Technology, Cambridge, MA, USA, 7–10 October 2012; Association for Computing Machinery: New York, NY, USA, 2012; pp. 445–452. [Google Scholar]
- Israr, A.; Zhao, S.; Schwalje, K.; Klatzky, R.; Lehman, J. Feel Effects: Enriching Storytelling with Haptic Feedback. ACM Trans. Appl. Percept. 2014, 11, 11:1–11:17. [Google Scholar] [CrossRef]
- Schneider, O.S.; Israr, A.; MacLean, K.E. Tactile Animation by Direct Manipulation of Grid Displays. In Proceedings of the 28th Annual ACM Symposium on User Interface Software & Technology (UIST ’15), Charlotte, NC, USA, 8–11 November 2015; Association for Computing Machinery: New York, NY, USA, 2015; pp. 21–30. [Google Scholar] [CrossRef]
- Gaffary, Y.; Lécuyer, A. The Use of Haptic and Tactile Information in the Car to Improve Driving Safety: A Review of Current Technologies. Front. ICT 2018, 5, 5. [Google Scholar]
- Tivadar, R.I.; Arnold, R.C.; Turoman, N.; Knebel, J.F.; Murray, M.M. Digital haptics improve speed of visual search performance in a dual-task setting. Sci. Rep. 2022, 12, 9728. [Google Scholar] [CrossRef]
- Israr, A.; Poupyrev, I. Tactile brush: Drawing on skin with a tactile grid display. In Proceedings of the SIGCHI Conference on Human Factors in Computing Systems, Vancouver, BC, Canada, 7–12 May 2011; ACM: Vancouver, BC, Canada, 2011; pp. 2019–2028. [Google Scholar] [CrossRef]
- Israr, A.; Poupyrev, I. Control space of apparent haptic motion. In Proceedings of the 2011 IEEE World Haptics Conference, Istanbul, Turkey, 21–24 June 2011; pp. 457–462. [Google Scholar] [CrossRef]
- Ren, G.; Wei, S.; O’Neill, E.; Chen, F. Towards the Design of Effective Haptic and Audio Displays for Augmented Reality and Mixed Reality Applications. Adv. Multimed. 2018, 2018, 4517150. [Google Scholar] [CrossRef]
- Kim, J.; Kim, H.; Park, C.; Choi, S. Human Recognition Performance of Simple Spatial Vibrotactile Patterns on the Torso. In Proceedings of the 2023 IEEE World Haptics Conference (WHC), Delft, The Netherlands, 10–13 July 2023; pp. 20–27, ISBN 9798350399936. [Google Scholar] [CrossRef]


| Visual Feedback | Visual-Haptic Feedback | Improvement (%) | |
|---|---|---|---|
| Reaction Time | 1.38 s | 0.97 s | 29.71% |
| User Preference | 4.25 | 7.75 | 82.35% |
| Task load | 34.31 | 23.89 | 30.37% |
Disclaimer/Publisher’s Note: The statements, opinions and data contained in all publications are solely those of the individual author(s) and contributor(s) and not of MDPI and/or the editor(s). MDPI and/or the editor(s) disclaim responsibility for any injury to people or property resulting from any ideas, methods, instructions or products referred to in the content. |
© 2025 by the authors. Licensee MDPI, Basel, Switzerland. This article is an open access article distributed under the terms and conditions of the Creative Commons Attribution (CC BY) license (https://creativecommons.org/licenses/by/4.0/).
Share and Cite
Ren, G.; Huang, Z.; Lin, W.; Miao, N.; Huang, T.; Wang, G.; Lee, J.-H. Multimodal Guidance for Enhancing Cyclist Road Awareness. Electronics 2025, 14, 1363. https://doi.org/10.3390/electronics14071363
Ren G, Huang Z, Lin W, Miao N, Huang T, Wang G, Lee J-H. Multimodal Guidance for Enhancing Cyclist Road Awareness. Electronics. 2025; 14(7):1363. https://doi.org/10.3390/electronics14071363
Chicago/Turabian StyleRen, Gang, Zhihuang Huang, Wenshuo Lin, Ning Miao, Tianyang Huang, Gang Wang, and Jee-Hang Lee. 2025. "Multimodal Guidance for Enhancing Cyclist Road Awareness" Electronics 14, no. 7: 1363. https://doi.org/10.3390/electronics14071363
APA StyleRen, G., Huang, Z., Lin, W., Miao, N., Huang, T., Wang, G., & Lee, J.-H. (2025). Multimodal Guidance for Enhancing Cyclist Road Awareness. Electronics, 14(7), 1363. https://doi.org/10.3390/electronics14071363