Abstract
The automatic segmentation of cell images plays a critical role in medicine and biology, as it enables faster and more accurate analysis and diagnosis. Traditional machine learning faces challenges since it requires transferring sensitive data from laboratories to the cloud, with possible risks and limitations due to patients’ privacy, data-sharing regulations, or laboratory privacy guidelines. Federated learning addresses data-sharing issues by introducing a decentralized approach that removes the need for laboratories’ data sharing. The learning task is divided among the participating clients, with each training a global model situated on the cloud with its local dataset. This guarantees privacy by only transmitting updated model weights to the cloud. In this study, the centralized learning approach for cell segmentation is compared with the federated one, demonstrating that they achieve similar performances. Stemming from a benchmarking of available cell segmentation models, Cellpose, having shown better recall and precision () than U-Net () and StarDist (), was used as the baseline for a federated learning testbench implementation. The results show that both binary segmentation and multi-class segmentation metrics remain high when employing both the centralized solution () and the federated solution (). These results were also stable across an increasing number of clients and a reduced number of local data samples (, ), proving the effectiveness of central aggregation on the cloud of locally trained models.
1. Introduction
Microscopy plays an important role in biomedical research: Advanced techniques enable biologists to acquire numerous time-lapse images to visualize the dynamic characteristics of tissues, cells, or molecules. Precise analysis and statistical quantification are needed to better understand the biological mechanisms underlying these image sequences, which has become a major challenge [1]. Many cell lines currently used in medical research (such as cancer cells or stem cells) grow in confluent sheets or colonies. The biology of individual cells provides valuable information, so the separation of touching cells in microscopy images is critical for counting, identifying, and measuring them. They can also have diverse migration patterns or cell shapes and can express different proteins, therefore recognizing that phenotypes contribute to a better understanding of biological phenomena (tumor metastasis, stem cell differentiation, or cell plasticity) [2]. Microscopy image analysis provides quantitative support to improve the characterization of various diseases. Due to the large amount of image data, which increases every day, it is inefficient or sometimes impossible to manually process the data [3]. The amount and complexity of bioimages have increased exponentially, making it necessary to develop new processing tools, involving artificial intelligence (AI) methods. Deep learning (DL) is capable of independently extracting relevant features from images to perform specific tasks, often outperforming conventional strategies (such as threshold-based segmentation, region-based segmentation, and the watershed algorithm). These methods present limitations because they require manual optimization and human experience, thus being highly subjective. Therefore, DL methods have become widely employed in many image segmentation tasks because they provide simple, effective, and objective solutions. DL is used for high-performance image analysis tasks such as object detection, image segmentation, and restoration because of its ability to automatically recognize objects and features, thus revolutionizing how clinical samples are analyzed [4].
Common microscopic techniques include bright-field, fluorescent, confocal, and phase-contrast microscopy. Traditional cell segmentation methods are based on pixels intensity and spatial relationships that require manual optimization and experience with basic techniques. The core algorithms in 2D segmentation tools are gradually shifting to more complex deep learning networks [5]. CellProfiler is the first free open-source system designed for flexible, high-throughput cell image analysis. It addresses a variety of biological questions, including standard tasks (cell count, size, and protein levels) and complex ones (cell shape or subcellular patterns) and helps biologists collect thousands of samples per day using automation [6]. FogBank is a new automated segmentation method that accurately separates cells when they are confluent and touching each other. This technique is applied to phase contrast fluorescence microscopy and binary images and is based on morphological watershed principles, which improve accuracy and minimize noise levels [2].
As mentioned above, advances in microscopy have resulted in large amounts of image data: Each laboratory produces different data and focuses on different aspects based on their research, consequently requiring different kinds of software. The use of deep learning helps in this context because a DL model learns relevant features from the data; therefore, a single generic software that learns to adapt to the task could be implemented [7]. For example, in [8], the U-Net convolutional neural network (CNN) is implemented for the segmentation of images obtained from electron microscopy. This study shows how well a DL model can perform with a small amount of data and also how well it generalizes to different types of images. So, high-performance cell segmentation methods now exist for several applications, but those algorithms rely on large training datasets of human-labeled images and neural-network-based models trained to reproduce annotations. This means that DL models often struggle to generalize well on totally different data. The work presented in [9] introduces Cellpose, which includes an ensemble of diverse pre-trained models. They developed algorithms and software tools for adapting neural network segmentation models to new image categories with few new training data. Cellpose is a generalist model for cell segmentation tasks, which makes a “pre-trained models zoo” available so that it can be used as a starting point for the human-in-the-loop approach [10]. In their work, Stringer et al. introduced a DL approach that can segment many types of cells without requiring parameter adjustments, new training data, or further model retraining. They showed that their approach outperformed previous methods when trained and tested on specialized data, giving it the potential to realize new reproducible and scalable approaches in cell biology [9].
Existing DL approaches support a cloud-centric architecture, where data are stored and processed. This conventional method expects a continuous stream of data to be sent to the cloud, where models are trained on high-performance servers. However, it encounters some limitations: extremely high latency, high communication costs, and a lack of data privacy and security [11]. In addition, the need for large amounts of annotated data presents its own challenges [12], because labeling medical images requires specialized knowledge. The scarcity of labeled datasets constitutes a major bottleneck for the development and optimization of DL models [13].
Federated learning (FL), first introduced by Google in 2017 in [14], is a secure distributed machine learning (ML) technique that cooperatively performs DL algorithms on multiple clients under the condition that private information remains local. FL transfers the training task to each client, and the communication between one of them and the server is through parameter interaction rather than direct data interaction. This allows each node data to be protected, and it also saves cloud computing and storage resources [15]. Medical image analysis using deep neural networks (DNNs) has demonstrated state-of-the-art performance in image classification and segmentation tasks. The federated approach enables the use of local model’s parameters to train a global model, ensuring data privacy and security. The benefit of using FL is that it provides comparable results to centralized approaches while also ensuring data privacy. It has many applications in healthcare, including medical image segmentation [16]. Various studies, such as [12,13,14,15,16,17,18], have investigated the impact of using FL for image segmentation in a medical environment. All of them demonstrated that using decentralized training does not affect the model’s performances and also contributes to having a more secure deep learning framework.
The aim of our study is to apply federated learning to a cell segmentation task, using a cell segmentation model as the baseline model, and Flower, a novel FL framework that provides built-in tools for the rapid transition of existing ML training pipelines into a FL setup [19], to implement the decentralized environment. We evaluated the performance that can be obtained from a centralized learning and a federated approach, studying how and if the metrics change when the number of clients increases. In this work, preliminary benchmarking was carried out to determine the best cell segmentation model among the main ones available in the literature. Subsequently, we compared the performance between federated and centralized learning in terms of binary segmentation metrics and multi-class segmentation metrics. Moreover, based on computational cost and training loss, we compared the behavior of a DL model on the cloud when training with different multi-client distributed datasets. The contributions of our work include a detailed study on how, in a federated learning environment, cell segmentation models behave when trained across a high number of clients, where each of them has a low number of images. This simulates a real scenario where laboratories might not have access to a large amount of labeled microscopic images due to the complexity and time required for manual labeling. Additionally, we carefully compare our approach to centralized learning, profiling training and testing performance metrics, and potential performance variations in cell morphology analyses employing federated models.
The contributions of this paper are the following:
- Identification of a heterogeneous dataset for cell segmentation with images coming from various source types (also including user-submitted images);
- Benchmark to determine the best cell segmentation model to be implemented in a federated framework;
- Overall evaluation of all classical metrics used for this task in both federated and centralized settings, providing a complete evaluation of all models;
- Performance comparison between multi-client distribution;
- Performance comparison between federated and centralized model.
This paper is organized as follows. In Section 2, we first review the relevant literature in the fields of cell segmentation and federated learning. Section 3 explains the details of our methodology, including the datasets (Section 3.1), models (Section 3.2), and metrics (Section 3.3) used to realize the federated learning testbench (Section 3.4). In Section 4, we discuss the experimental results obtained. Finally, Section 5 concludes this paper, summarizing our key findings and potential future research.
2. Theoretical Background and Related Works
Cell segmentation is an important task in the field of medical image processing and is widely used in subjects such as life sciences and healthcare. It is applied to analyze the morphology and location of individual cells, to obtain single-cell gene counts, and to detect fine intracellular variations. Common microscopic techniques include bright-field microscopy, fluorescent microscopy, confocal microscopy, and phase-contrast microscopy [5]. Segmenting biological images can help identify the nature of the cell and its tendency to become something else (e.g., metastatic tumor cells), thus helping experts better diagnose pathologies. The standard process for cell analysis is the visual inspection of tissues under a microscope. Although still widely applied in clinical laboratories, manual segmentation is a highly subjective, qualitative, and non-scalable method [20]. A quantitative analysis provides a better understanding of the mechanisms of cells. Recent advances in AI and computer vision have revolutionized medical diagnostics and treatment planning. In fact, DL-based methodologies have become powerful tools in modern healthcare [21], allowing researchers to implement algorithms that are able to handle the increasing amount of microscopic images, while also helping biologists to assemble a more detailed description of cells. Therefore, there is a need for efficient semi-automated computer methods to complement manual examinations [20].
Existing segmentation methods can be divided into two categories: traditional computer vision techniques and deep learning-based approaches [22].
2.1. Traditional Cell Segmentation Techniques
Traditional segmentation methods are based on the intensity and spatial relationship of pixels [5]. They include threshold-based segmentation, region-based segmentation, the watershed algorithm and its variants, active contours, Chan–Vese segmentation, and graph-cut-based segmentation [22]. The watershed method is a classical image segmentation method widely used for cell segmentation. It transforms the gray image into a topographic map, only considering the location’s information. To solve its limitations caused by over-segmentation, Ji, X. et al. proposed an improvement in the traditional watershed, which can solve the cells’ adhesion problems [23].
In terms of cell segmentation tools, CellProfiler is the first free open-source system designed for flexible, high-throughput cell image analysis. The software contains already developed methods for the advanced analysis of numerous cell types [6]. Moreover, in [2], Chalfoun, J. et al. presented a new automated segmentation method called FogBank. It is an improved watershed algorithm that automatically detects distinct basins while minimizing over-segmentation and using geodetic distances to preserve cell shapes [2].
Traditional methods have limitations because they require manual optimization and experience in basic techniques, which are highly subjective. In recent years, machine learning and deep learning methods have been widely used, providing more accurate and efficient solutions for cell segmentation [5].
2.2. Deep Learning Cell Segmentation Techniques
Compared with traditional segmentation methods, DL algorithms can automatically generate optimal features for cell images without requiring researchers to identify features [24]. Deep-learning-based approaches include deep convolutional neural networks (CNNs) capable of learning the feature mapping of an image and then converting it into a vector for the segmentation task [22].
The U-Net encoder–decoder architecture is the basis of many DL models in biomedical image analysis [7]. It is known for its simplicity and effectiveness. In fact, it shows robust performance and promising results in quantification and segmentation tasks, such as cell detection or data geometry measurements in medical images [21]. U-Net is also applied to any pixel classification task, such as cell counting, the prediction of a single reference point per cell, and single-cell segmentation, which requires the identification of individual cell outlines [7]. The purpose of cell instance segmentation is to classify every pixel into classes and to group them into individual instances. Pixel grouping can be performed by finding connected components, but this approach is often problematic for images with crowded cell nuclei [25]. To contrast this problem, Schmidt et al. proposed StarDist, a DL method for object detection and segmentation, which can handle complex shapes and structures with high accuracy and robustness [5]. StarDist (a lightweight neural network based on U-Net) predicts shape representations using star-convex polygons that are well suited for approximating cell nuclei shapes in microscopy images [25]. While in natural images, objects tend to be vertically or horizontally aligned, microscopy objects have more complex and unique shapes. StarDist overcomes this problem by assuming that objects have star-convexity, but this implies worst performances when working with morphologically complex shapes [26]. DL leads to great progress, but most of the methods are specialized for images that have large training datasets. Fully automated methods have many advantages, but they are trained on specialized datasets and do not generalize well to other types of data, thus requiring new human-labeled images to achieve good performances. Stringer et al. introduced Cellpose [9], an open-source general purpose cell image segmentation software that can be applied to a wide range of biological imaging modalities and that is suitable for the identification of microorganisms, plants, and animal cell types [5]. Cellpose is suitable for solving problems caused by different cell shapes [9]. Traditional segmentation approaches use the grayscale values of an image to create a topological map [23]. Stringer et al. generated those maps through a simulated diffusion process, starting from the ground truth masks drawn by human annotators. They trained a neural network to predict horizontal and vertical gradients together with the binary map, indicating if a pixel is inside or outside of an ROI (region of interest). The model then predicts spatial gradients, and following them through the “gradient tracking” process, all pixels belonging to a cell can be routed to its center. The Cellpose network is based on the U-Net architecture that is slightly modified and adapted to the task [9]. Therefore, U-Net takes a microscopy image as input and returns gradients and cell probabilities, through which cells can be identified and recovered [27]. Additionally, Cellpose 2.0 provides a large dataset of “model zoos” containing pre-trained models where users can choose the most suitable one to evaluate their data [5].
2.3. Federated Learning for Image Segmentation
As data become increasingly numerous and diverse, their potential to nourish ML is vast. However, traditional centralized learning approaches face important limitations due to the need to aggregate data in a single location. Those challenges are privacy concerns, data protection regulations (e.g., GDPR), and the high cost of data transmissions. The most influenced fields are hospitals, financial institutions, and personal devices [28].
Federated learning is a framework that enables multiple decentralized nodes (such as mobile devices or servers) to collaboratively train a shared model while keeping data locally. In this manner, instead of centralizing the data, only model parameters are shared and updated between nodes to obtain a global aggregated model on the cloud from the parameters received by the clients’ local models. This approach is useful for applications involving sensitive information, where privacy and security are important [29].
Federated learning starts with the initialization of the global model (step 0 in Figure 1), and it comprises the repetition of a “round”, which consists of the following steps:
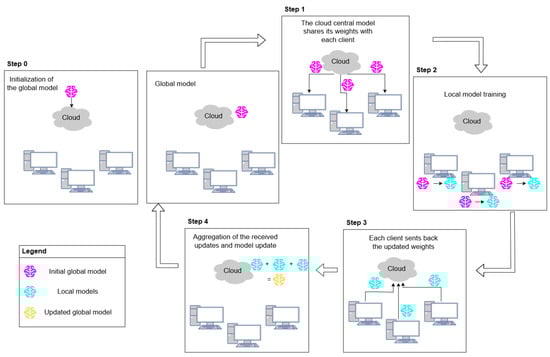
Figure 1.
The federated learning round comprises five total steps: initialization of the global model (step 0), cloud model weight sharing (step 1), local model training (step 2), local model weight sharing (step 3), and weight aggregation and cloud model update (step 4).
- Sending the model to the client nodes: The cloud model shares its weights with each client so that they start local training using the same parameters.
- Local model training: The client model becomes locally trained on the client’s dataset.
- Sending the updated weights back: Each client sends the updates back to the cloud.
- Aggregation and global model update: The cloud aggregates all received weights to upgrade the server model.
The training process must be repeated to eventually obtain a fully trained model that performs well across all client node data [30]. The initialization of the model and the repetition of the federated learning round is summarized in Figure 1.
Decentralized ecosystems enable collaboration and learning between different organizations without requiring them to share sensitive data. FL can capture a wider range of data distributions and characteristics, potentially leading to more robust and generalizable models [29]. A core principle of FL is its ability to handle non-independent and identically distributed (non-IID) data across devices. Unlike centralized systems that assume uniform data distributions, FL operates in areas where data may vary significantly, reflecting real-world scenarios [28]. The integration of cloud computing and deep learning technologies in medical data analysis shows that FL techniques retain model accuracy while improving privacy protection [31].
Recent studies have demonstrated the ability of FL to obtain comparable or even better performances than the centralized approach. Numerous researchers have developed a federated learning framework to evaluate how the medical image segmentation task acts when trained and tested in a decentralized environment. For example, Ullah et al., in [12], applied FL for brain tumor segmentation and demonstrated the effectiveness of federated learning. Their proposed approach outperforms existing CNN- and recurrent neural network (RNN)-based methods. Similarly, Yahiaoui et al. [13] implemented the FL approach to the task of segmenting brain tumor lesions using a 3D U-Net model. They presented a highly competitive and collaborative federated model that can successfully segment brain tumor images. Furthermore, Saeedi et al. in [17], examined the implementation of a U-Net model in a FL framework for the semantic segmentation of diabetic foot ulcers. Their results highlight the potential of federated learning, which parallels the performance of centralized models. Finally, in [18], Alhafiz et al. investigated the impact of data heterogeneity on FL performance in COVID-19 lung imaging. Their results give insights that guide future research towards achieving a balance between global generalization and local adaptation. An overview of the cited studies on federated learning for medical image segmentation is reported in Table 1, where, for each work, we extracted the dataset used, the methodology employed, and the chosen FL parameters and their limitations.

Table 1.
The relevant literature study overview.
3. Materials and Methods
3.1. Datasets
The evaluations in this paper were carried out using two datasets available in the Cellpose model’s zoo repository [32], namely the following [33]:
- “Cytoplasm”: a two-channel images dataset where the first channel is the cell segmentation channel and the second one is the nuclear channel (optional), consisting of training images and testing images;
- “Cytoplasm2”: an updated “Cytoplasm” dataset including user-submitted two-channel images, with the first as the channel to segment and the second as an optional nuclear channel, consisting of total training images.The initial “Cytoplasm” dataset was obtained by collecting images from a variety of sources, primarily through a search on the Internet for keywords such as “cytoplasm”, “cell microscopy”, “fluorescent cells”, and so on. The entire dataset consists of the following:
- −
- images of fluorescent-labeled proteins localized in the cytoplasm ( of the total dataset);
- −
- images of cells from bright-field microscopy ( of the total dataset);
- −
- images of membrane-labeled cells ( of the total dataset);
- −
- images from other types of microscopy ( of the total dataset);
- −
- non-microscopy images containing large numbers of repeated objects, e.g., fruits, rocks, jellyfish ( of the total dataset).
Both datasets can be downloaded from [34]. An image sample with its corresponding mask from each dataset considered is shown in Figure 2.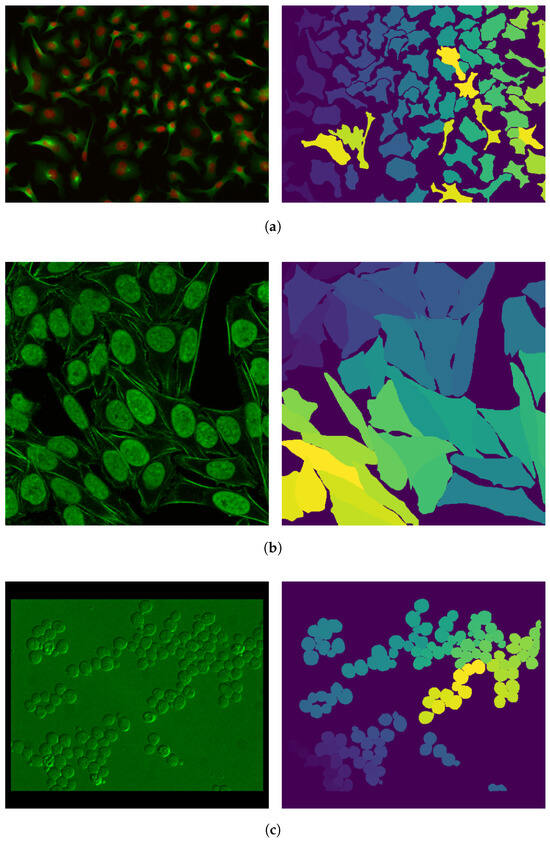 Figure 2. Sample images (on the left) and their corresponding masks (on the right) from the (a) “Cytoplasm” training set, (b) “Cytoplasm2” training set, and (c) “Cytoplasm” testing set, taken from [34]. The different shades and colors that can be observed in the masks are representative of the group of pixels identified to belong to a specific cell.
3.2. Models
Preliminary benchmarking was carried out to determine the best cell segmentation model to be implemented in a federated framework. The selected model will serve as the baseline model and will be used as the initial global model in the FL evaluation. The following models for cell segmentation were chosen as candidate baselines:
- U-Net [8]: a standard architecture with an encoder–decoder structure and skip connections, widely used for biomedical image segmentation and trained here for cell segmentation.
- StarDist [25]: a deep learning model with a U-Net backbone that is very effective for segmenting overlapping cells.
- Cellpose [9]: a cell segmentation model originally trained on diverse datasets, capable of segmenting various cell types without extensive retraining. It is based on a U-Net and used to predict gradient flows.
All models are available on ZeroCostDL4Mic [4,35]. This is a platform that allows researchers to train and apply DL networks to perform tasks such as segmentation, object detection, denoising, and so on in microscopy. For the segmentation task, it includes implementations of U-Net, StarDist, and Cellpose, which were used to test which model would be the best fit as the baseline model. The models were trained on the “Cytoplasm” training dataset available in [34] for 200 epochs, and then, they were tested on the “Cytoplasm” testing dataset. Table 2 includes a summary of the models, where the learning rate and batch size values are ZeroCost’s default ones, while the number of training epochs has been chosen by the authors in order to obtain a fair comparison between the models.
Table 2.
Model settings and parameters for the candidate baseline models.
All models were trained via Google Colaboratory using the NVIDIA Tesla T4 15GB GPU and 51GB RAM. We used Python v. 3.11 and the following libraries: TensorFlow v. 2.18, Keras v. 3.8, Stardist v. 0.9.1, PyTorch v. 2.4.0, Torchvision v.0.19, and Cellpose v. 3.1.
3.3. Loss and Performance Evaluation Metrics
For the cell segmentation models, training loss is computed as a combination of the mean squared error (MSE) and the binary cross-entropy (BCE) functions. This is because, as Stringer et al. explained in [9], the output layer of the Cellpose network consists of three convolutional maps: the first two predict horizontal and vertical gradients using the MSE loss, while the third predicts the probability that a pixel is inside or outside of a cell with (binary) cross-entropy loss.
MSE computes the error of multi-class segmentation.
It is calculated between each element in input x and the target y [36], which, in our study, are true labels (GT) and predicted values. The BCE calculates the error in binary segmentation:
where N is the batch size, y denotes the GT labels, x denotes the output of the model (0 for the background and 1 for the non-background), and denotes the predicted probabilities after the Sigmoid layer [37]. The total loss is .
Furthermore, in this study, we analyze binary segmentation metrics, which are shown in Table 3.
Table 3.
Binary segmentation metrics.
Precision (also analyzed in [12]), recall (used in [12,13]), accuracy (computed in [12,18]), dice coefficient (also used in [12,13,17]), and IoU range from 0 to 1, where 0 represents a mismatch (no overlap between pixels), while 1 is a perfect match (identical predicted mask and ground truth).
Additionally, for the multi-class segmentation task, we decided to work with the standard metrics for the cell segmentation task [40]. These are summarized in Table 4.
Table 4.
Multi-class segmentation metrics.
To compute these metrics, we used the code presented in [43], which also evaluates the AJI+ metric, an extension of the aggregated Jaccard index that does not suffer from over-penalization (which occurs when the model completely fails to detect the neighboring instance) [40].
Finally, the mask obtained as a model prediction can be used for further studies. Therefore, we evaluated a morphological analysis using the metric called the spindle index (SI). The spindle index (SI) is a novel measure of the spindle phenotype that is derived from the ratio of maximum length to maximum width of cells. It allows us to obtain an objective assessment of the phenotype of the detected cells [44]. In this context, if we consider that the contour approximating the cell is elliptical, the spindle Index can be obtained as follows:
Typically, the SI is useful for measuring whether the cell has an elongated shape () or a circular shape () [44].
For this study, all metrics were calculated on the entire test dataset ( images) so that the final value is a mean of all the values.
3.4. FL Testbench
Stemming from the benchmarking of the aforementioned cell segmentation models, an FL architecture was implemented, using the best model from the benchmark as the global baseline. The architecture was implemented using FlowerAI, a comprehensive federated learning framework that offers a stable language and ML-framework-agnostic implementation of the core components of an FL system [19].
Figure 3 illustrates the FL architecture, with an example of the total of two clients contributing to the training, corresponding to two laboratories. Each laboratory trains its model on its own cell image dataset without sharing sensitive data with the other. Instead, each of them only transmits updated model weights to the cloud. The cloud server then aggregates these weights and sends the updated global model back to the clients. This architecture is scalable, allowing additional clients to join in for training or, additionally, just for downloading the global model to perform local inference. These additional clients may have limited computational resources [45], relying on the global model for inference while contributing minimally to training. As mentioned, segmentation masks obtained through the downloaded models may then be used by final users to carry out laboratory or experiment-specific analyses. The cloud-based deployment facilitates model distribution, while the FL implementation removes the need for sensitive data sharing even towards clients that do not contribute to the collaborative training phase. Furthermore, a multi-cloud environment may also be employed, where different cloud providers collaborate and share models without transferring raw data [46]. So, the federated implementation allows overcoming the challenge of data scarcity for some clients while addressing patient privacy and legal and ethical issues in clinical data sharing.
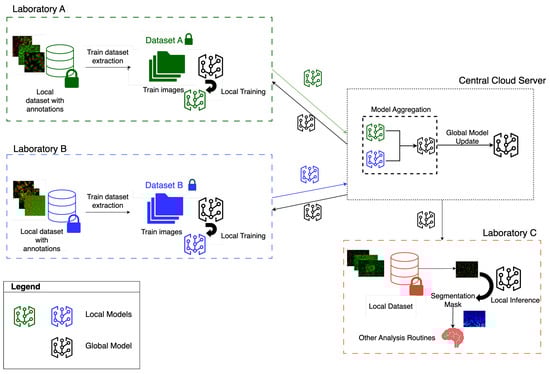
Figure 3.
FL learning framework for cell segmentation. Two laboratories contributing to the training are shown (Laboratory A and Laboratory B). A cloud server is responsible for aggregating the weights received from the laboratories. Other laboratories that are not contributing to the training (Laboratory C) may still download the cloud model.
Federated Learning Evaluation
With the purpose of evaluating whether the classic centralized learning approach and the federated learning approach have comparable performances under different client configurations, we developed a dedicated testbench. The experiment is implemented in Google Colaboratory, and the libraries used to build the federated learning framework are as follows: Flower v. 1.11.1, PyTorch v. 2.4.0, and Torchvision v. 0.19.0. We used Python v. 3.11 for our experiments. The configuration of the FL framework in Flower requires the definition of the following:
- The starting model used by the clients and the server, previously referred to as the “baseline” model;
- The training function used by every client for the local training with their local dataset;
- A Flower Client that describes the client’s structure, its train, and its test datasets;
- The strategy implementing the FL algorithm, which for this use case is FedAvg;
- Simulation parameters: number of rounds, number of clients, and number of epochs per client.
For this study, we decided to work with 20 epochs per client during local training; 10 rounds; and 2, 4, 8, and 16 clients to study the behavior of the FL framework when the number of participants changed. With respect to strategy, we chose to use the most implemented one; FedAvg is used, especially when working in a real-world scenario (diverse clients with heterogeneous data). This strategy allows researchers to build a robust approach to non-IID data and unbalanced distributions [14].
A summary of all chosen hyper-parameters is presented in Table 5.
Table 5.
FL framework hyper-parameters.
The baseline model is trained for 200 epochs on the dataset collected by Stringer et al. ( images). We then re-trained the baseline on the “Cytoplasm2” (cyto2) dataset ( images) using the two methods under evaluation: that is, centralized and federated. In the end, we obtained the following:
- A fully “centralized” model, which is the baseline re-trained on the new data for 200 epochs;
- A series of federated models, corresponding to the baseline re-trained using a fully distributed approach where each client trains the model for 20 epochs over 10 rounds. In this case, the cyto2 dataset is randomly and equally divided among the clients considered for a given simulation (IID data distribution).
Figure 4 shows a summary of the models obtained as described above. Each of these models (centralized and the federated models) is then exported and tested on unseen data (namely, “Cytoplasm” testing data). The performances of the model obtained from centralized training and the four models obtained from federated training performances are analyzed in terms of training and test loss and the binary segmentation metrics (precision, recall, accuracy, dice coefficient, and IoU) and multi-class segmentation metrics (DICE2, AJI, AJI+, DQ, SQ, and PQ), for which their definitions are provided in Section 3.3.
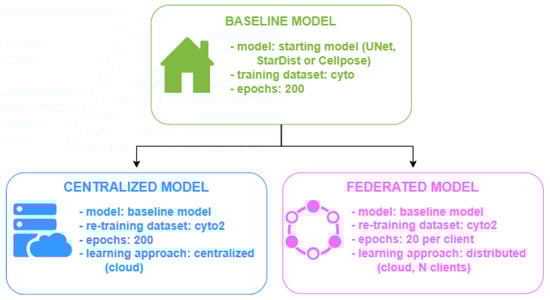
Figure 4.
Baseline, centralized, and federated models.
4. Results and Discussions
In this section, the results of the comparative analysis between the centralized and federated learning approaches for the cell segmentation task are provided. As mentioned above, the goal is to determine whether applying FL algorithms instead of traditional ones impacts performances and the quantification of possible performance losses due to the use of a decentralized approach.
4.1. Baseline Model Evaluation
Table 6 contains the results of the preliminary evaluation of the candidate baseline models. Cellpose consistently outperforms the other models across all metrics, making it the best choice for cell segmentation in this comparison. U-Net shows moderate performances, with high precision (0.91) but a worse precision/recall balance (0.50 dice coefficient), while StarDist struggles across all metrics, particularly in recall (0.07) and IoU (0.07), indicating that it may not be well suited for this specific task of segmentation. Additionally, Cellpose’s accuracy, dice coefficient, and IoU attest to overall better cell segmentation and recognition. Stemming from these considerations, Cellpose has been chosen as the baseline model in the implementation of federated learning for cell segmentation, and it will therefore be the model utilized in the following evaluations.
Table 6.
Comparison between DL models for cell segmentation.
In Figure 5, the training loss of the identified baseline model is presented.
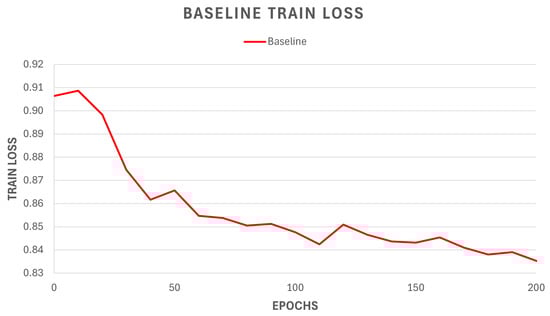
Figure 5.
Training loss of the Cellpose baseline model trained on the Cytoplasm dataset for 200 epochs.
4.2. Models Loss Evaluation
The centralized model, trained on the cyto2 dataset for a total of 200 epochs, shows a training loss trend that can be observed in Figure 6. We notice a typical decreasing and monotonous trend, with a “regular” decrease in the loss value. In order to compare it with the federated models, it can be useful to highlight the final value of the training loss, which is .
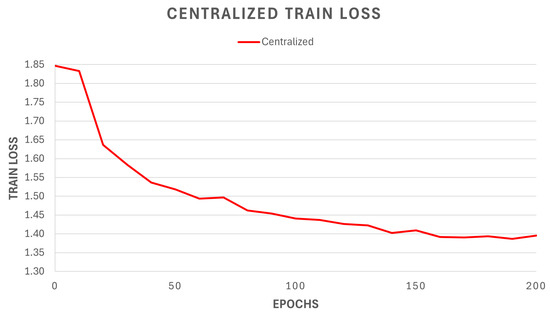
Figure 6.
Re-training loss of the centralized model, based on the previously identified and trained baseline model (Cellpose).
In terms of the FL framework, the experiment investigated how splitting the training task between different nodes would affect the model’s performance. Given that the original dataset was relatively small, we decided to observe how federated learning impacted four different cases: 2 clients (128 training images each), 4 clients (64 training images each), 8 clients (32 training images each), and 16 clients (16 training images each). To compare the training loss for a single client during local training with the centralized train loss, in Figure 7, we present a detailed illustration of each single-client training loss trend for the federated model with four clients.
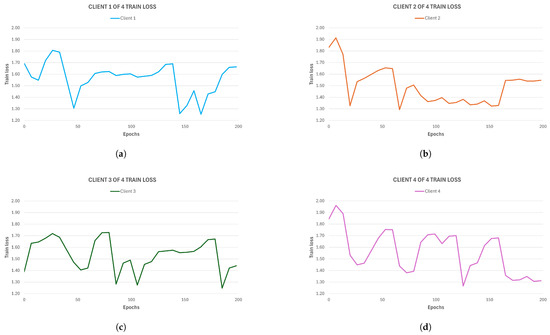
Figure 7.
Training loss of each single client for the 4-client federated model. (a) First client of four clients, (b) second client of four clients, (c) third client of four clients, and (d) fourth client of four clients.
It is important to note that while the results from individual nodes can be useful for understanding how a single client performs on its local dataset, the final performance is given by the aggregated model loss. Nevertheless, to carry out a first comparison, we can underline the final loss values for each client in this four-client configuration: In Figure 7a, the first client obtains ; in Figure 7b, the second client obtains ; in Figure 7c, the third obtains ; in Figure 7d, the fourth client obtains . Therefore, some of these clients’ training attain a local loss that is lower than the centralized model loss, but while the latter is stable across epochs, the federated clients’ models manifest lower stability and numerous peaks. This highlights the difficult dynamics of the federated learning framework, where different factors can influence individual clients (e.g., data instability or weight updates at each round change), as also observed in [13]. This is reflected in the non-convergence of the local model. As mentioned, a better performance evaluation can be carried out by observing how the global model performs, given the aggregated loss throughout each round. In Figure 8a, the training loss trend over rounds is presented for each federated model. The loss value for each round is obtained by aggregating the loss values that every participant achieves at the end of their round local training. Firstly, we can observe that the aggregated model, as opposed to the local ones, converges. Secondly, it is now noticeable how the federated model’s loss trend is comparable to that of the centralized one. This is confirmed by the final loss values achieved by the federated models: the 2-client model obtains , the 4-client model obtains , the 8-client model obtains , and finally, the 16-client model obtain , meaning that the final performances do not differ too much from the centralized approach despite the more unstable loss trends for each standalone client during training.
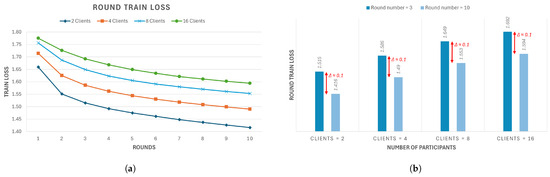
Figure 8.
(a) Training loss of the federated model with 2, 4, 8, and 16 clients; (b) zoom of the train loss of the federated model with 2, 4, 8, and 16 clients at rounds 3 and 10.
Additionally, given that in Figure 8a, it is noticeable that the descent occurs during the third round, we considered it interesting to analyze how the loss value varies from there to the tenth and final round. This is shown in Figure 8b, where, for all models, the variation is around , meaning that it is stable and does not depend on the number of clients.
Finally, from Figure 8, it is possible to highlight the behavior of the federated model when increasing the number of clients. In our study, the training dataset is set to images, which means that the more clients we consider, the smaller their local dataset. We can see from the training loss trend that the model’s performance is slightly affected by the number of participants considered; in particular, it proceeds from for 2 clients (local dataset size ) to for 16 clients (local dataset size ).
4.3. Comparison Between Centralized and Federated Learning
To better understand how federated learning performs compared to centralized learning, we analyzed other metrics using the test dataset ( images). Every test image is given as an input to each model so that they produce an output with the prediction, which then is juxtaposed to the ground truth image. From this comparison, we computed the values of the evaluation metrics previously identified for this task, which are useful for understanding how and if performances are influenced by different learning paradigms.
Firstly, we observed the test loss values obtained with each model compared to the training loss values commented above. This comparison is made in Table 7.
Table 7.
Training and test loss comparison for centralized and federated models.
From the table, it is possible to note that the loss metric obtains similar values during training and during testing for all models. This indicates that none of them overfits. Overall, in terms of loss performance, the centralized model performs better than the others, but the values are similar, meaning that using the federated approach does not worsen the performance too much. Furthermore, the results in Table 7 highlight that the federated performance is independent of the number of clients and the data used for training.
4.3.1. Binary Segmentation Metrics
In Table 8, all binary segmentation evaluation metrics are reported for each model considered in this study. From these values, we can only evaluate how well a model performs when it just needs to differentiate the background from the non-background (cells).
Table 8.
Binary segmentation evaluation metrics.
The results highlighted in Table 8 allow us to say that there is no obvious worsening of the performances when training a model with a federated approach rather than in a centralized way. This statement is reinforced by the observation of the metric values: The centralized model realizes higher performance in terms of precision, while other metrics show slightly higher values for the federated models. We can observe how each model achieves an equal and high value of accuracy. That is because, generally, cell image segmentation has imbalanced classes when evaluating regions and background due to a small percentage of pixels for each ROI, meaning that the remaining pixels are all annotated as a background [47]. Therefore, this metric could provide misleading results when the class representation is small within the image, because the measure is biased on how well the model identifies negative cases (class not present) [48]. Consequently, dice coefficient and IoU, which are the most observed metrics for the segmentation task, are more representative of the models’ performances because they penalize false positives (a common factor in imbalanced datasets). Furthermore, we can observe that when the number of clients increases, the results remain stable across each configuration. In particular, the difference in performance is minimal. For example, looking at the two-clients and four-client models, we can highlight a difference in IoU and a difference in precision and dice coefficient; for the two-client and eight-client models, only a difference is noticeable in recall and in IoU, and is noticeable in precision and dice coefficient. This helps us conclude that each model performs fairly well in binary segmentation and that centralized and federated models can be compared in terms of these evaluation metrics regardless of the number of participants.
4.3.2. Multi-Class Segmentation Metrics
Moreover, to better evaluate how the models perform when segmenting and predicting every region, the metrics in Table 9 are presented. Here, we collected all multi-class segmentation metrics that tell us how well each model is able to segment every region (cell) within a microscopy image.
Table 9.
Multi-class segmentation evaluation metrics.
In this case, the considerations that can be made are similar to the ones made for the binary segmentation metrics. DICE2 and AJI only provide an overall score of the multi-class segmentation’s quality, but these two metrics present limitations due to the over-penalization of overlapping regions. AJI+ and PQ, however, are improvements in the previous metrics, which means that they provide a more reliable measurement of the model’s segmentation performances. The results achieved here show comparable capabilities of the centralized model and the federated models, also in the multi-class segmentation task. Moreover, the values obtained here are similar to those presented in [40], which means that our models achieve good results.
While some variation was observed in training loss across experiments, the main testing metrics for multi-class and binary classification remain stable.
As anticipated in Section 3.3, we also evaluated the impact of employing federated models for morphological analysis routines, where predicted masks are employed to carry out additional processing. Therefore, a comparison is presented in Table 10, illustrating the percentage of circular cells () and elongated cells () detected using each model and those in the GT. Additionally, the third column of the Table 10 is the mean error per image made by a model in cell counting. It can be observed that while all models commit errors on average compared to the GT, performances also remain stable across centralized and federated models in this case.
Table 10.
Percentage of circular cells () and elongated cells () in each model’s prediction compared to the ground truth.
Furthermore, we investigated an additional metric that can be called “Paired IoU” to study how accurate the prediction of each cell is inside an image. This metric is computed by evaluating the IoU (which we have already observed in Table 8) for each pair of cells detected from the GT and the predicted mask. While the “binary IoU” is useful to determine the overall overlap between images, the “Paired IoU” determines how well each region detected in an image is segmented. Again, the results show comparable performances between the federated and centralized models and regardless of the number of clients considered.
In conclusion, a final consideration can be made by observing a comparison between the GT and the predicted masks. To carry this out, we randomly chose a test image, and we compared its ground truth to the prediction made by the following: the centralized model, the 2-client federated model, and the 16-client federated model. This is shown in Figure 9.
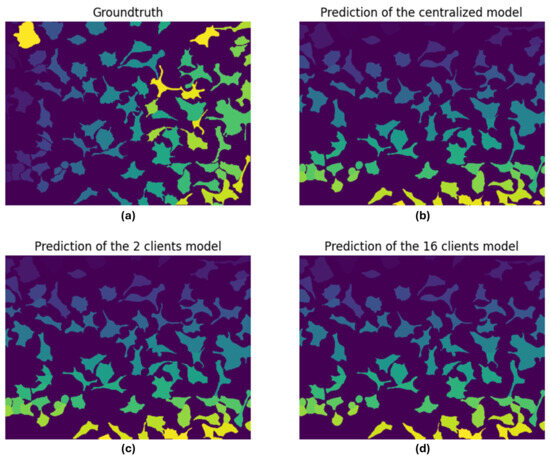
Figure 9.
Comparison between (a) ground truth, (b) centralized model predicted mask, (c) 2-client federated model predicted mask, and (d) 16-client federated model predicted mask. The different shades and colors in the masks are representative of the group of pixels identified to belong to a specific cell.
4.3.3. Computational Cost
In conclusion, another parameter we observed is the time required by every model to perform the simulation. For FL models, the time needed refers to the completion of the entire federated simulation, considering the local training of each participant. The simulation time gives us a measurement of the computational cost for the considered approaches.
The results shown in Table 11 highlight the trade-off requested by the employment of a federated learning framework in contexts where data privacy is essential. It is possible to notice a logarithmic proportionality in the federated approach; by doubling the number of clients, an increase of 0.77%, 5.34%, and 5.80% is obtained, respectively, by proceeding from 2 to 4, from 4 to 8, and from 8 to 16. We were able to obtain comparable performances between centralized and federated learning, but the latter, in order to ensure a secure training, requires more time and resources (as also discussed in [12]). This is partly due to the simulation time being a sum of different contributions: dataset loading, which is expensive when integrating Cellpose into FlowerAI because it needs to be repeated at the start of each local round; batch loading with a fixed size of 32 images per batch; and client training. Therefore, this results in longer times than those needed in centralized settings. More in general, we can also underline that, as the number of clients increases, the computational cost also increases, requiring longer training times due to the higher overhead.
Table 11.
Model simulation time.
5. Conclusions
This study investigated the effects of training federation on the task of the cell segmentation of microscopy images. In this field, data privacy and security are sensitive topics because it is not always possible to distribute patients’ data, or regulations may be in place for data sharing between laboratories. The experiments demonstrated that the federated approach has similar performances compared to “classic” centralized learning. Using Cellpose, the model that showed better metrics for cell segmentation, our results showed comparable metrics values between Cellpose implementation with fully centralized learning and decentralized learning distributed between laboratories and a central cloud server for aggregation. The work presented is proof of the efficacy of FL, for which its performance also remained high when increasing the number of clients and reducing the number of local data samples, therefore being useful in contexts that require both high accuracy and data safety and where local labeled data may be scarce. Furthermore, the outcome of this study shows that Cellpose can be used in an FL environment where the model’s performance remains stable across different simulation settings. This allows the distribution of the cell segmentation task, preserving data privacy and the patient’s safety and helping laboratories develop a more objective image segmentation technique. For future research and the development of the presented study, it would be interesting to collect different datasets containing images from different types of microscopy and simulate a scenario where each client has different amounts and different kinds of images. Finally, in terms of simulation times, it could be useful to investigate different FL frameworks with Cellpose in order to evaluate the model’s integration time.
Author Contributions
Conceptualization, S.B., M.E., S.R., A.B. and P.P.; methodology, S.B., M.E., S.R., A.B. and P.P.; software, S.B.; validation, S.B., M.E., S.R. and A.B.; formal analysis, S.B., M.E., S.R. and A.B.; investigation, S.B., M.E., S.R., A.B. and P.P.; writing—original draft preparation, S.B.; writing—review and editing, S.B., M.E., S.R. and A.B.; visualization, S.B. and M.E.; supervision, P.P.; project administration, P.P.; funding acquisition, P.P. All authors have read and agreed to the published version of the manuscript.
Funding
This research received no external funding.
Data Availability Statement
The data supporting the findings of this study are based on a publicly available dataset in the following reference: Cellpose at https://www.cellpose.org/dataset accessed on 7 January 2025.
Conflicts of Interest
The authors declare no conflicts of interest.
Abbreviations
The following abbreviations are used in this manuscript:
| AI | Artificial intelligence; |
| DL | Deep learning; |
| CNN | Convolutional neural network; |
| FL | Federated learning; |
| ML | Machine learning; |
| DNN | Deep neural network; |
| ROI | Region of interest; |
| Non-IID | Non-independent and identically distributed; |
| RNN | Recurrent neural network; |
| ZeroCost | ZeroCostDL4Mic; |
| GT | Ground truth; |
| MSE | Mean squared error; |
| BCE | Binary cross-entropy; |
| TP | True positives; |
| FP | False positives; |
| TN | True negatives; |
| FN | False negatives; |
| IoU | Intersection over union; |
| DICE2 | Ensemble dice; |
| AJI | Aggregated Jaccard index; |
| DQ | Detection quality; |
| SQ | Segmentation quality; |
| PQ | Panoptic quality; |
| SI | Spindle Index; |
| FedAvg | Federated averaging. |
References
- Liu, Z.; Jin, L.; Chen, J.; Fang, Q.; Ablameyko, S.; Yin, Z.; Xu, Y. A survey on applications of deep learning in microscopy image analysis. Comput. Biol. Med. 2021, 134, 104523. [Google Scholar] [CrossRef]
- Chalfoun, J.; Majurski, M.; Dima, A.; Stuelten, C.; Peskin, A.; Brady, M. FogBank: A single cell segmentation across multiple cell lines and image modalities. BMC Bioinform. 2014, 15, 431. [Google Scholar] [CrossRef]
- Xing, F.; Xie, Y.; Su, H.; Liu, F.; Yang, L. Deep learning in microscopy image analysis: A survey. IEEE Trans. Neural Netw. Learn. Syst. 2017, 29, 4550–4568. [Google Scholar] [CrossRef]
- von Chamier, L.; Laine, R.F.; Jukkala, J.; Spahn, C.; Krentzel, D.; Nehme, E.; Lerche, M.; Hernández-Pérez, S.; Mattila, P.K.; Karinou, E.; et al. Democratising deep learning for microscopy with ZeroCostDL4Mic. Nat. Commun. 2021, 12, 2276. [Google Scholar] [CrossRef] [PubMed]
- Liu, P.; Li, J.; Chang, J.; Hu, P.; Sun, Y.; Jiang, Y.; Zhang, F.; Shao, H. Software Tools for 2D Cell Segmentation. Cells 2024, 13, 352. [Google Scholar] [CrossRef]
- Carpenter, A.E.; Jones, T.R.; Lamprecht, M.R.; Clarke, C.; Kang, I.H.; Friman, O.; Guertin, D.A.; Chang, J.H.; Lindquist, R.A.; Moffat, J.; et al. CellProfiler: Image analysis software for identifying and quantifying cell phenotypes. Genome Biol. 2006, 7, R100. [Google Scholar] [CrossRef]
- Falk, T.; Mai, D.; Bensch, R.; Çiçek, Ö.; Abdulkadir, A.; Marrakchi, Y.; Böhm, A.; Deubner, J.; Jäckel., Z.; Seiwald, K.; et al. U-Net: Deep learning for cell counting, detection, and morphometry. Nat. Methods 2019, 16, 67–70. [Google Scholar] [CrossRef]
- Ronneberger, O.; Fischer, P.; Brox, T. U-net: Convolutional networks for biomedical image segmentation. In Medical Image Computing and Computer-Assisted Intervention–MICCAI 2015: 18th International Conference, Munich, Germany, 5–9 October 2015; Proceedings, Part III 18; Springer International Publishing: Cham, Switzerland, 2015; pp. 234–241. [Google Scholar]
- Stringer, C.; Wang, T.; Michaelos, M.; Pachitariu, M. Cellpose: A generalist algorithm for cellular segmentation. Nat. Methods 2021, 18, 100–106. [Google Scholar] [CrossRef]
- Pachitariu, M.; Stringer, C. Cellpose 2.0: How to train your own model. Nat. Methods 2022, 19, 1634–1641. [Google Scholar] [CrossRef]
- AbdulRahman, S.; Tout, H.; Ould-Slimane, H.; Mourad, A.; Talhi, C.; Guizani, M. A survey on federated learning: The journey from centralized to distributed on-site learning and beyond. IEEE Internet Things J. 2020, 8, 5476–5497. [Google Scholar] [CrossRef]
- Ullah, F.; Nadeem, M.; Abrar, M.; Amin, F.; Salam, A.; Khan, S. Enhancing brain tumor segmentation accuracy through scalable federated learning with advanced data privacy and security measures. Mathematics 2023, 11, 4189. [Google Scholar] [CrossRef]
- Yahiaoui, M.E.; Derdour., M.; Abdulghafor, R.; Turaev, S.; Gasmi, M.; Bennour, A.; Aborujilah, A.; Sarem, M.A. Federated Learning with Privacy Preserving for Multi-Institutional Three-Dimensional Brain Tumor Segmentation. Diagnostics 2024, 14, 2891. [Google Scholar] [CrossRef] [PubMed]
- McMahan, B.; Moore, E.; Ramage, D.; Hampson, S.; y Arcas, B.A. Communication-efficient learning of deep networks from decentralized data. In Proceedings of the 20th International Conference on Artificial Intelligence and Statistics, Fort Lauderdale, FL, USA, 20–22 April 2017. [Google Scholar]
- Wen, J.; Zhang, Z.; Lan, Y.; Cui, Z.; Cai, J.; Zhang, W. A survey on federated learning: Challenges and applications. Int. J. Mach. Learn. Cybern. 2023, 14, 513–535. [Google Scholar] [CrossRef] [PubMed]
- Nazir, S.; Kaleem, M. Federated learning for medical image analysis with deep neural networks. Diagnostics 2023, 13, 1532. [Google Scholar] [CrossRef]
- Saeedi, M.; Gorji, H.T.; Vasefi, F.; Tavakolian, K. Federated vs. Central Machine Learning on Diabetic Foot Ulcer Images: Comparative Simulations. IEEE Access 2024, 12, 58960–58971. [Google Scholar] [CrossRef]
- Alhafiz, F.; Basuhail, A. The Data Heterogeneity Issue Regarding COVID-19 Lung Imaging in Federated Learning: An Experimental Study. Big Data Cogn. Comput. 2025, 9, 11. [Google Scholar] [CrossRef]
- Beutel, D.J.; Topal, T.; Mathur, A.; Qiu, X.; Fernandez-Marques, J.; Gao, Y.; Sani, L.; Li, K.H.; Parcollet, T.; de Gusmão, P.P.B.; et al. Flower: A Friendly Federated Learning Framework. Open-Source, Mobile-Friendly Federated Learning Framework. 2022. Available online: https://hal.science/hal-03601230 (accessed on 19 March 2025).
- Vu, Q.D.; Graham, S.; Kurc, T.; To, M.N.N.; Shaban, M.; Qaiser, T.; Koohbanani, N.A.; Khurram, S.A.; Kalpathy-Cramer, J.; Zhao, T.; et al. Methods for segmentation and classification of digital microscopy tissue images. Front. Bioeng. Biotechnol. 2019, 7, 53. [Google Scholar] [CrossRef]
- Castro, S.; Pereira, V.; Silva, R. Improved Segmentation of Cellular Nuclei Using U-Net Architectures for Enhanced Pathology Imaging. Electronics 2024, 13, 3335. [Google Scholar] [CrossRef]
- Chen, H.; Murphy, R.F. Evaluation of cell segmentation methods without reference segmentations. Mol. Biol. Cell 2023, 34, ar50. [Google Scholar] [CrossRef]
- Ji, X.; Li, Y.; Cheng, J.; Yu, Y.; Wang, M. Cell image segmentation based on an improved watershed algorithm. In Proceedings of the 2015 8th International Congress on Image and Signal Processing (CISP), Shenyang, China, 14–16 October 2015. [Google Scholar]
- Wen, T.; Tong, B.; Liu, Y.; Pan, T.; Du, Y.; Chen, Y.; Zhang, S. Review of research on the instance segmentation of cell images. Comput. Methods Programs Biomed. 2022, 227, 107211. [Google Scholar] [CrossRef]
- Schmidt, U.; Weigert, M.; Broaddus, C.; Myers, G. Cell detection with star-convex polygons. In Proceedings of the Medical Image Computing and Computer Assisted Intervention–MICCAI 2018: 21st International Conference, Granada, Spain, 16–20 September 2018. [Google Scholar]
- Lalit, M.; Tomancak, P.; Jug, F. Embedding-based instance segmentation in microscopy. In Proceedings of the Medical Imaging with Deep Learning, PMLR, Lübeck, Germany, 7–9 July 2021; pp. 399–415. [Google Scholar]
- Lee, K.; Byun, H.; Shim, H. Cell Segmentation in Multi-modality High-Resolution Microscopy Images with Cellpose. In Proceedings of the Machine Learning Research, New Orleans, LA, USA, 28–29 December 2022. [Google Scholar]
- Lazaros, K.; Koumadorakis, D.E.; Vrahatis, A.G.; Kotsiantis, S. Federated Learning: Navigating the Landscape of Collaborative Intelligence. Electronics 2024, 13, 4744. [Google Scholar] [CrossRef]
- Marin Machado de Souza, R.; Holm, A.; Biczyk, M.; de Castro, L.N. A systematic literature review on the use of federated learning and bioinspired computing. Electronics 2024, 13, 3157. [Google Scholar] [CrossRef]
- What Is Federated Learning? Available online: https://flower.ai/docs/framework/tutorial-series-what-is-federated-learning.html (accessed on 8 January 2025).
- Shakor, M.Y.; Khaleel, M.I. Recent Advances in Big Medical Image Data Analysis Through Deep Learning and Cloud Computing. Electronics 2024, 13, 4860. [Google Scholar] [CrossRef]
- Models, Cellpose. Available online: https://cellpose.readthedocs.io/en/latest/models.html (accessed on 11 February 2025).
- Cellpose 2D ZeroCostDL4Mic. Available online: https://colab.research.google.com/github/HenriquesLab/ZeroCostDL4Mic/blob/master/Colab_notebooks/Cellpose_2D_ZeroCostDL4Mic.ipynb (accessed on 8 January 2025).
- Cellpose. Available online: https://www.cellpose.org/ (accessed on 17 January 2025).
- ZeroCostDL4Mic. Available online: https://github.com/HenriquesLab/ZeroCostDL4Mic/wiki (accessed on 11 February 2025).
- PyTorch: MSELoss. Available online: https://pytorch.org/docs/stable/generated/torch.nn.MSELoss.html (accessed on 5 February 2025).
- Pytorch: BCEWithLogitsLoss. Available online: https://pytorch.org/docs/stable/generated/torch.nn.BCEWithLogitsLoss.html (accessed on 12 February 2025).
- Hossin, M.; Sulaiman, M.N. A review on evaluation metrics for data classification evaluations. Int. J. Data Min. Knowl. Manag. Process 2015, 5, 1–11. [Google Scholar]
- Müller, D.; Soto-Rey, I.; Kramer, F. Towards a guideline for evaluation metrics in medical image segmentation. BMC Res. Notes 2022, 15, 210. [Google Scholar] [CrossRef] [PubMed]
- Graham, S.; Vu, Q.D.; Raza, S.E.A.; Azam, A.; Tsang, Y.W.; Kwak, J.T.; Rajpoot, N. Hover-net: Simultaneous segmentation and classification of nuclei in multi-tissue histology images. Med. Image Anal. 2019, 58, 101563. [Google Scholar] [CrossRef]
- Kumar, N.; Verma, R.; Sharma, S.; Bhargava, S.; Vahadane, A.; Sethi, A. A dataset and a technique for generalized nuclear segmentation for computational pathology. IEEE Trans. Med. Imaging 2017, 36, 1550–1560. [Google Scholar] [CrossRef]
- Kirillov, A.; He, K.; Girshick, R.; Rother, C.; Dollár, P. Panoptic segmentation. In Proceedings of the IEEE/CVF Conference on Computer Vision and Pattern Recognition, Long Beach, CA, USA, 16–20 June 2019. [Google Scholar]
- Simultaneous Nuclear Instance Segmentation and Classification in H&E Histology Images. Available online: https://github.com/vqdang/hover_net (accessed on 19 January 2025).
- Koo, V.; El Mekabaty, A.; Hamilton, P.; Maxwell, P.; Sharaf, O.; Diamond, J.; Watson, J.; Williamson, K. Novel in vitro assays for the characterization of EMT in tumourigenesis. Anal. Cell. Pathol. 2010, 32, 67–76. [Google Scholar] [CrossRef]
- Lee, S.; Zhang, T.; Prakash, S.; Niu, Y.; Avestimehr, S. Embracing Federated Learning: Enabling Weak Client Participation via Partial Model Training. IEEE Trans. Mob. Comput. 2024, 23, 11133–11143. [Google Scholar] [CrossRef]
- Ajao, A.; Jonathan, O.; Adetiba, E. The Applications of Federated Learning Algorithm in the Federated Cloud Environment: A Systematic Review. In Proceedings of the 2024 International Conference on Science, Engineering and Business for Driving Sustainable Development Goals (SEB4SDG), Omu-Aran, Nigeria, 2–4 April 2024; IEEE: Piscataway, NJ, USA, 2024; pp. 1–15. [Google Scholar]
- Kaggle: Understanding Evaluation Metrics in Segmentation. Available online: https://www.kaggle.com/code/nghihuynh/understanding-evaluation-metrics-in-segmentation (accessed on 19 March 2025).
- Jeremy Jordan: Evaluating Image Segmentation Models. Available online: https://www.jeremyjordan.me/evaluating-image-segmentation-models/ (accessed on 5 February 2025).
Disclaimer/Publisher’s Note: The statements, opinions and data contained in all publications are solely those of the individual author(s) and contributor(s) and not of MDPI and/or the editor(s). MDPI and/or the editor(s) disclaim responsibility for any injury to people or property resulting from any ideas, methods, instructions or products referred to in the content. |
© 2025 by the authors. Licensee MDPI, Basel, Switzerland. This article is an open access article distributed under the terms and conditions of the Creative Commons Attribution (CC BY) license (https://creativecommons.org/licenses/by/4.0/).