1. Introduction
Presently, unmanned aerial vehicles (UAVs) are increasing in popularity worldwide, with their endless capabilities leading to innovations in a diverse variety of domains [
1]. Ranging from stealthy monitoring missions for military purposes, to data collection and mapping missions for the enhancement of urban infrastructure, the UAV has proved itself to be a multifunctional, cost-effective and convenient tool [
1,
2].
The diversity of missions that a drone can undertake requires a certain versatility of the main systems that equip the UAV. For example, the energy source used to power the UAV in its entirety can vary depending on the desired flight range, the maximum take-off weight and many other factors. The three main power sources for UAVs that are currently found on the market are full-electric energy sources, hybrid fuel–electric power-generating systems and fuel-based energy generating systems [
3]. Full-electric UAVs have gained popularity for their reliability [
4], efficiency and lack of pollutant emissions. However, the low energy density provided by batteries, the main provider of electric energy, along with their long charging time, limits the flight range and operating duration of electric UAVs [
5]. This disadvantage makes this type of drone unsuitable for long-distance missions. Moreover, the desire to enhance the battery’s energy density leads to an increase in mass [
6], an outcome which can lead to even more limitations of the UAV’s operational range.
On the other hand, a fuel-based energy source provides higher energy density levels for an extended operating range. In [
7], Xing Huang et al. study the benefits of using a hydrogen fuel cell, a type of fuel that has gained popularity in the recent years, one of the reasons being that the maximum flight range of a UAV powered by this type of fuel is 1.5 times higher compared to that of a lithium battery-powered UAV. Even so, this type of fuel cell is still not fully accepted by the market, because of its present exploratory state and high implementation costs [
8].
For certain missions which require an extended flight range, fossil fuel-powered engines represent an effective alternative, especially for powering long-endurance UAVs [
9]. During cruise operations, thermal engines serve as the preferred choice for use, instead of batteries, due to the higher payload capacity, reduced “recharging” timespan and extended flight range that they provide [
10]. Fossil fuel-based power-generating sources for UAVs are divided into two main categories: piston engines (mainly internal combustion engines) and turboprop engines. The former category shows the highest performances at low altitudes and speed, whereas the latter category exhibits diametrically opposed properties. Furthermore, the fuel consumption rate is higher for a turboprop engine when compared to that of an internal combustion engine, which exhibits more efficient fuel use [
11]. Additionally, the noise frequency characteristics of the two types of thermal engines differ substantially as a result of their unique operational mechanisms and design features. While the turboprop engine’s primary source of noise originates from the high-frequency components of the compressor [
12], piston engines, conversely, produce noise at lower frequencies, mainly due to the mechanical nature of their operation [
11]. Purely fuel-based energy sources are not lacking in flaws, with drawbacks such as increasing the weight of the UAV, increasing pollutant emissions and delaying the response to commands issued by the UAV’s flight controller.
Fusing the advantages and disadvantages of the two aforementioned power-generating systems, a hybrid fuel–electric energy power source manages to integrate multiple energy systems to increase operational efficiency, endurance and flight range. The high energy density of the fossil fuel [
13], accompanied by the high-power density of the lithium batteries, enhances the flight duration of the UAV [
14]. Furthermore, the swift responsiveness to commands from the board computer due to the use of the electric component of the power source, accompanied by the high endurance exhibited by the fossil fuel unit, ensures superior performance during flight. The component elements of the hybrid power source vary according to the UAV’s mission. Solar cells or fuel cells exhibit potential in urban and rural applications. Conversely, for long-distance surveillance and other missions which serve military purposes, the usage of a fossil fuel-consuming power source, such as an internal combustion engine or a micro turboprop engine, is preferred. It is important to note that hybrid fossil fuel power sources are typically most efficient when integrated into larger UAVs. While these power sources offer the advantage of extended flight range, they also introduce additional mass. This drawback makes them less suitable for smaller drones, as the increased weight limits their feasibility for such applications. Presently, however, the implementation and testing of a hybrid power-generating source using a turboprop engine is still a new, undiscovered domain, which will be approached in this paper.
Equipping a UAV with a hybrid power system requires an efficient and complex energy management strategy (EMS) to optimize and coordinate the power distribution among hybrid energy sources [
15]. One of the most popular energy management controllers which assures the autonomy of a UAV is the fuzzy logic controller [
16]. According to research conducted by L.L.P. Aguilar et al., which is displayed in [
17], the implementation of an energy management strategy based on the fuzzy logic technique enhances power and fossil fuel control during specific flight stages, such as take-off or cruise regimes. Such a result is attainable due to the increased stability and responsiveness of the UAV’s power system [
18].
Although the fuzzy logic controller provides enhanced robustness against possible power fluctuations [
19] and increased stability, the adaptive aspect of this algorithm is, however, completely absent. Therefore, some researchers prefer using the Adaptive Neuro-Fuzzy Inference System (ANFIS). This method relies on artificial neural networks, and is structured around the Takagi–Sugeno fuzzy inference system [
20]. A particular benefit of the ANFIS revolves around its ability to adapt the rules and membership functions, resulting in a more dynamic and data-driven control system [
21].
Another approach to managing the power flow control of a hybrid power source features the Proportional–Integral–Derivative (PID) feedback algorithm. In [
22], this method was applied to an internal combustion engine coupled with a brushless electric generator, with the aim of regulating the rotational speed of the engine’s crankshaft. Additionally, a Luenberger estimator was utilized to estimate the rotational speed of the engine–generator assembly, thereby improving the control accuracy of the model. This method, however, despite its usually simple structure, is not recommended when operating with nonlinear characteristics, because of the increased complexity of the PID’s design and tuning [
23].
The development of an automatically controlled hybrid system, consisting of batteries and a micro turboprop engine (micro-turbogenerator), still represents a challenge for researchers, an obstacle which will be tackled in this paper using the fuzzy logic control method. To guarantee the effective and safe operation of the power-generation system, a stable and robust control algorithm is essential. For this reason, rather than relying on manual operation, which is prone to human error, this research paper proposes and explores a more reliable and automated control method for the power distribution process, which will be elaborated in detail in the subsequent sections. Relying on the results exhibited in a previously published article [
24], this paper targets the development, implementation, testing and optimization of an autonomous control algorithm, in order to optimize the power distribution of the hybrid energy source.
2. Materials and Methods
2.1. Test Bench Optimization
The research paper in [
24] addresses the integration of a hybrid power-generating system, a micro-turbogenerator, into a UAV platform, which is mainly used for multi-rotor drones. The hybrid power source described in [
24] consists of a micro-turboprop engine which is mechanically connected, via a flexible coupling, to a brushless electric motor, a component which plays the role of a generator. This main element acts as the electric power supplier of the UAV and its integrant modules.
The micro-engine that equips this test bench is a KingTech K45TPG4 turboprop engine. It delivers a power output of 5.2 kW, which is attained at a combustion gas temperature of 700 °C. The maximum turbine speed of the micromotor is measured at 170,000 RPM. To adjust the shaft speed to 10,000 rpm (the rotational speed typically employed when a propeller is connected to the micro-engine), a reducing gear with a 1:17 reduction ratio is seamlessly incorporated into the test bench. This micromotor can be powered up by using two types of fossil fuel, like Diesel and Jet A1. Furthermore, oil is added to the fuel mixture to ensure proper lubrication for the bearings and gears within the reduction gear box.
The aforementioned research article proposes an analysis of two distinct testing configurations of the micro-turbogenerator, their main difference revolving around the electric consumption methods utilized. An array of parallel connected electric resistors represents the first option approached in [
24]. The resistor group is regulated by a relay system that methodically opens and closes the test bench circuit to ensure control during operation. This configuration is, however, disadvantageous, due to the increased mass of the high number of resistors and relays needed. That being the case, this option will not be further analyzed in the current research paper. The second method, however, replaces the resistor system with an electric motor equipped with a ducted fan, a component which enables the recreation of the exact, authentic infrastructure of a UAV platform, thereby mirroring the real-world scenario. The true-to-life aspect, accompanied by the reduced mass, favor this second configuration of the micro-turbogenerator test bench, which will further be exploited throughout this research article.
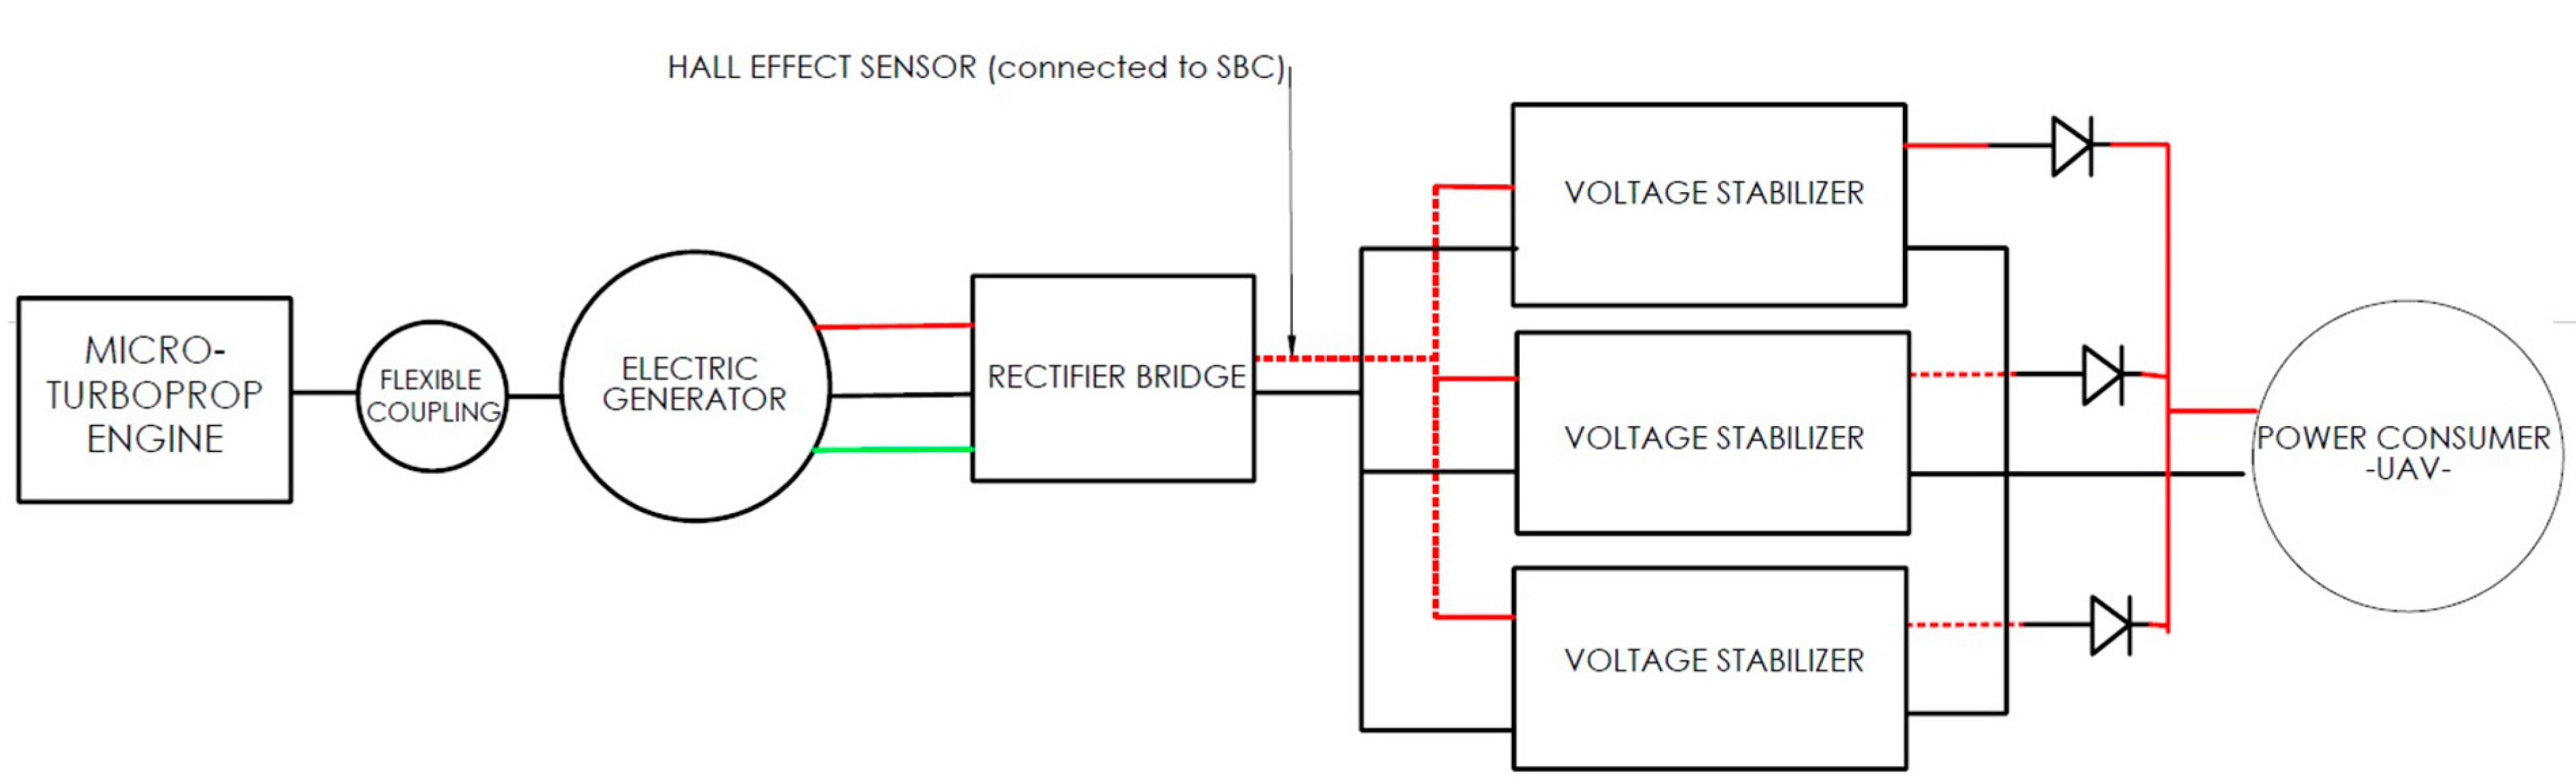
Some components of the electric system, however, maintained their position in the optimized configuration of the micro-turbogenerator test bench. The rectifier bridge, for example, was still a requirement, due to the need to transform the generated alternative current (AC) into direct current (DC) for further use inside the electric system of the test bench. Some other components which were not removed from the testing platform were the Electric Ducted Fan (EDF) and its electronic speed controller (ESC), as well as the Raspberry Pi 4, which was the Single-Board Computer (SBC), and its energy supply.
There were several additional electric components added to the configurations of the electric system. For more thorough control, the need to record the values of the intensity and DC voltage required the installation of a sensor, which measured the two desired parameters using the Hall effect. Therefore, the micro-turbogenerator test bench was equipped with MATEKSYS’ Hall effect current sensor (country of origin: China).
Figure 1 provides a representation of the test bench, showcasing all its constituent components along with their respective spatial arrangement.
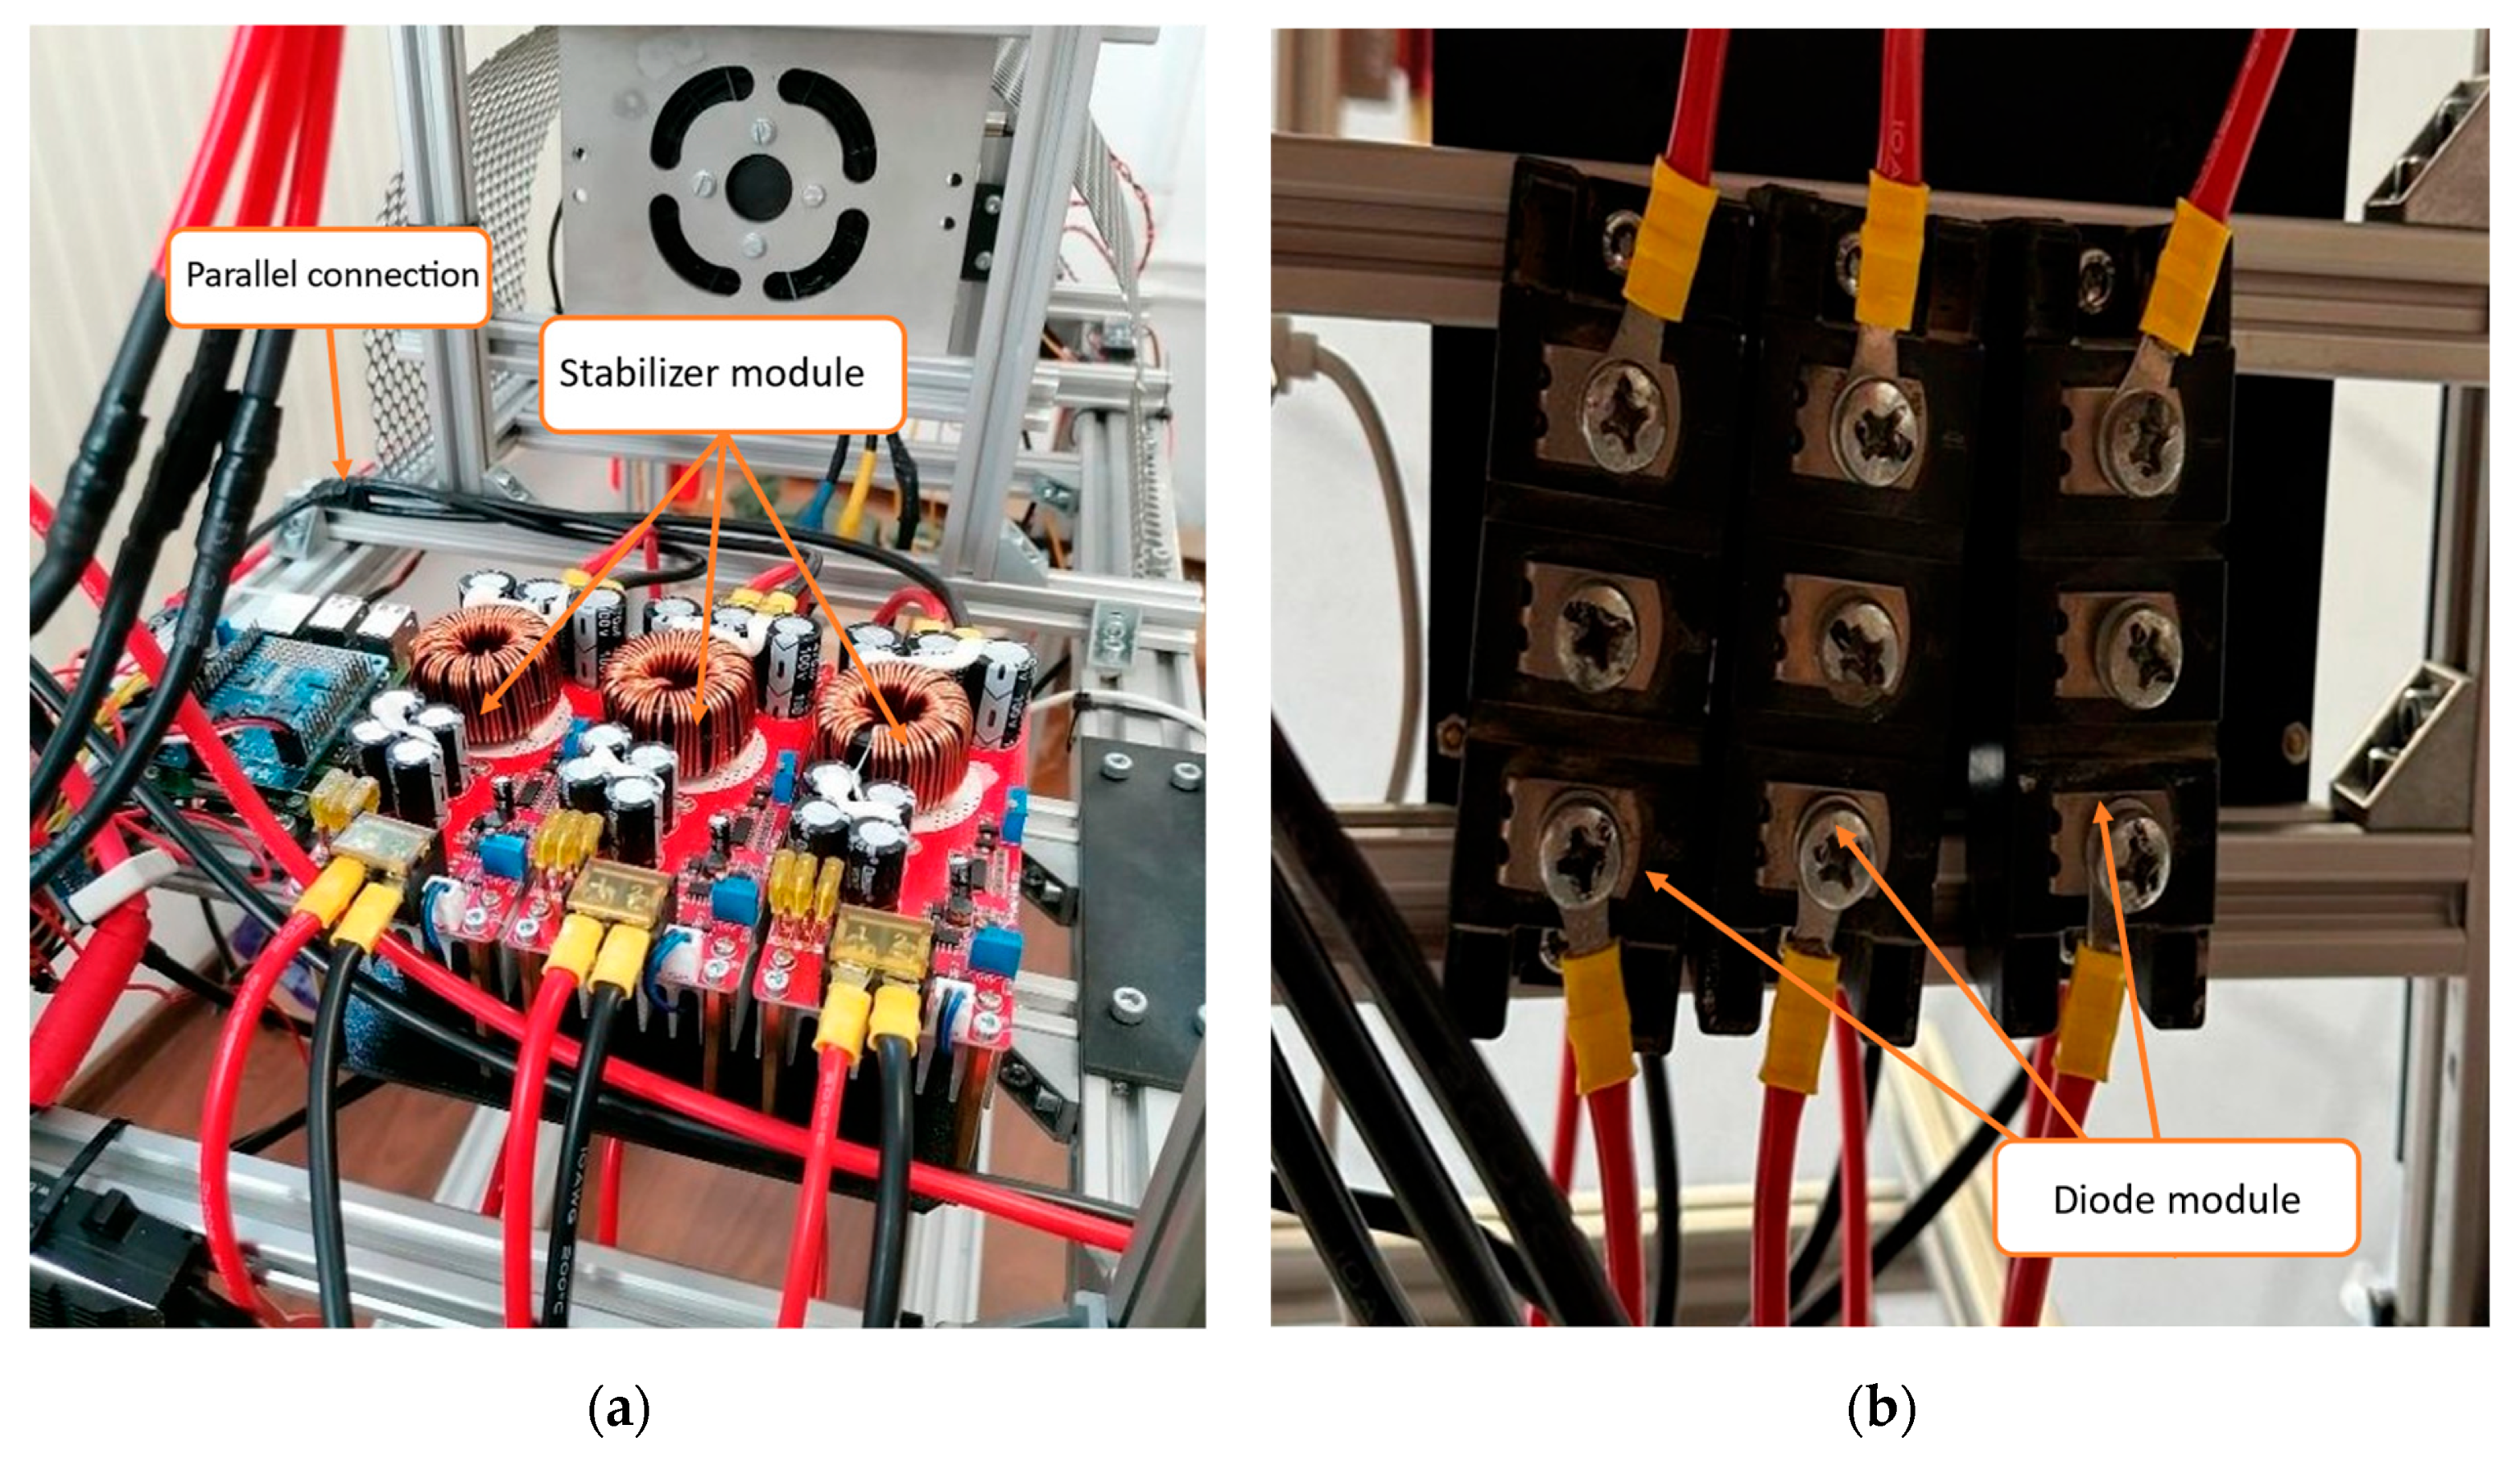
Furthermore, in order to reduce voltage fluctuations in the system, and, also, to act as a safety feature, a voltage stabilizer was essential for the testing platform. Consequently, a configuration containing three voltage stabilizers (
Figure 2a) was installed on the test bench, positioned between the rectifier bridge and the ESC of the EDF. This High-Power DC-DC Step-Up Boost Convertor (country of origin: China) was designed to stabilize the input voltage to a predetermined value within the range of 12 to 97 VDC. For the UAV equipped with a micro-turbogenerator system, a stabilization voltage of approximately 48 VDC was selected. Considering both the current intensity recorded across the entire system and the values measured at the terminals of the voltage stabilizers, a parallel connection of three adjustable power sources was implemented. Consequently, the measured intensity of the generator (approximately 100 A) was evenly distributed across the three stabilizers, with the values aligning with the specifications provided by the manufacturer. Furthermore, it is worth mentioning that, in order to ensure the proper functioning of the alternative electrical configuration, unidirectional conductivity had to be guaranteed. For this reason, three dual rectifier diodes were installed downstream of the voltage stabilizer system (
Figure 2b).
By incorporating the aforementioned components into the revised configuration of the test bench, the structural layout of the micro-turbogenerator testing platform was as depicted in
Figure 3.
An alternative approach to voltage stabilization involves the implementation of a more sophisticated control method. This algorithm should be designed, among other functions, to prioritize the mitigation of voltage variations by enforcing stricter constraints on their permissible range. Therefore, the test bench control system required a more advanced, autonomous algorithm.
2.2. Fuzzy Logic Control Algorithm
Although the micro-turbogenerator test platform largely retained its original structure and core electrical components, certain modifications were implemented regarding the control system of the test platform of the micro-turbogenerator. The hybrid power source alone required a more advanced control algorithm which could handle, among other things, the dynamic nature of the power distribution management. Therefore, the algorithm implemented in the SBC revolves around the fuzzy logic technique, a mathematical method which presents the “multiple truth” approach, in which, unlike the binary version, any value between 0 and 1 can be assigned to a certain variable [
25]. The fuzzy logic method can also be described as a language processing method [
26] which facilitates “easier” communication between the computer and its user.
That being said, the fuzzy control algorithm consists of these key steps:
Fuzzification—this step involves converting the input values into fuzzy linguistic terms that align with the fuzzy logic framework.
Base Rule formation—this stage establishes a set of if–then rules, utilizing predefined membership functions, to adjust or correct the analyzed parameter as needed.
Defuzzification—this final step converts the fuzzy linguistic output values back into their corresponding real-world physical values.
Fuzzification, the first step in the implementation of a fuzzy control algorithm, involves establishing the meaning of the values obtained through the input data by associating them with words. The mathematical entities which facilitate these correlations are known as membership functions (MFs). The fractional values allocated to the analyzed variables in question are called membership grades.
There are multiple types of membership functions, some of them being triangular, trapezoidal, singleton and gaussian. This research paper proposes using triangular membership functions, due to their simplicity and time efficiency. A function
can be characterized as a triangular MF if, and only if, it can be written as follows:
where
b is a point inside the definition domain, at which the function reaches its maximum value.
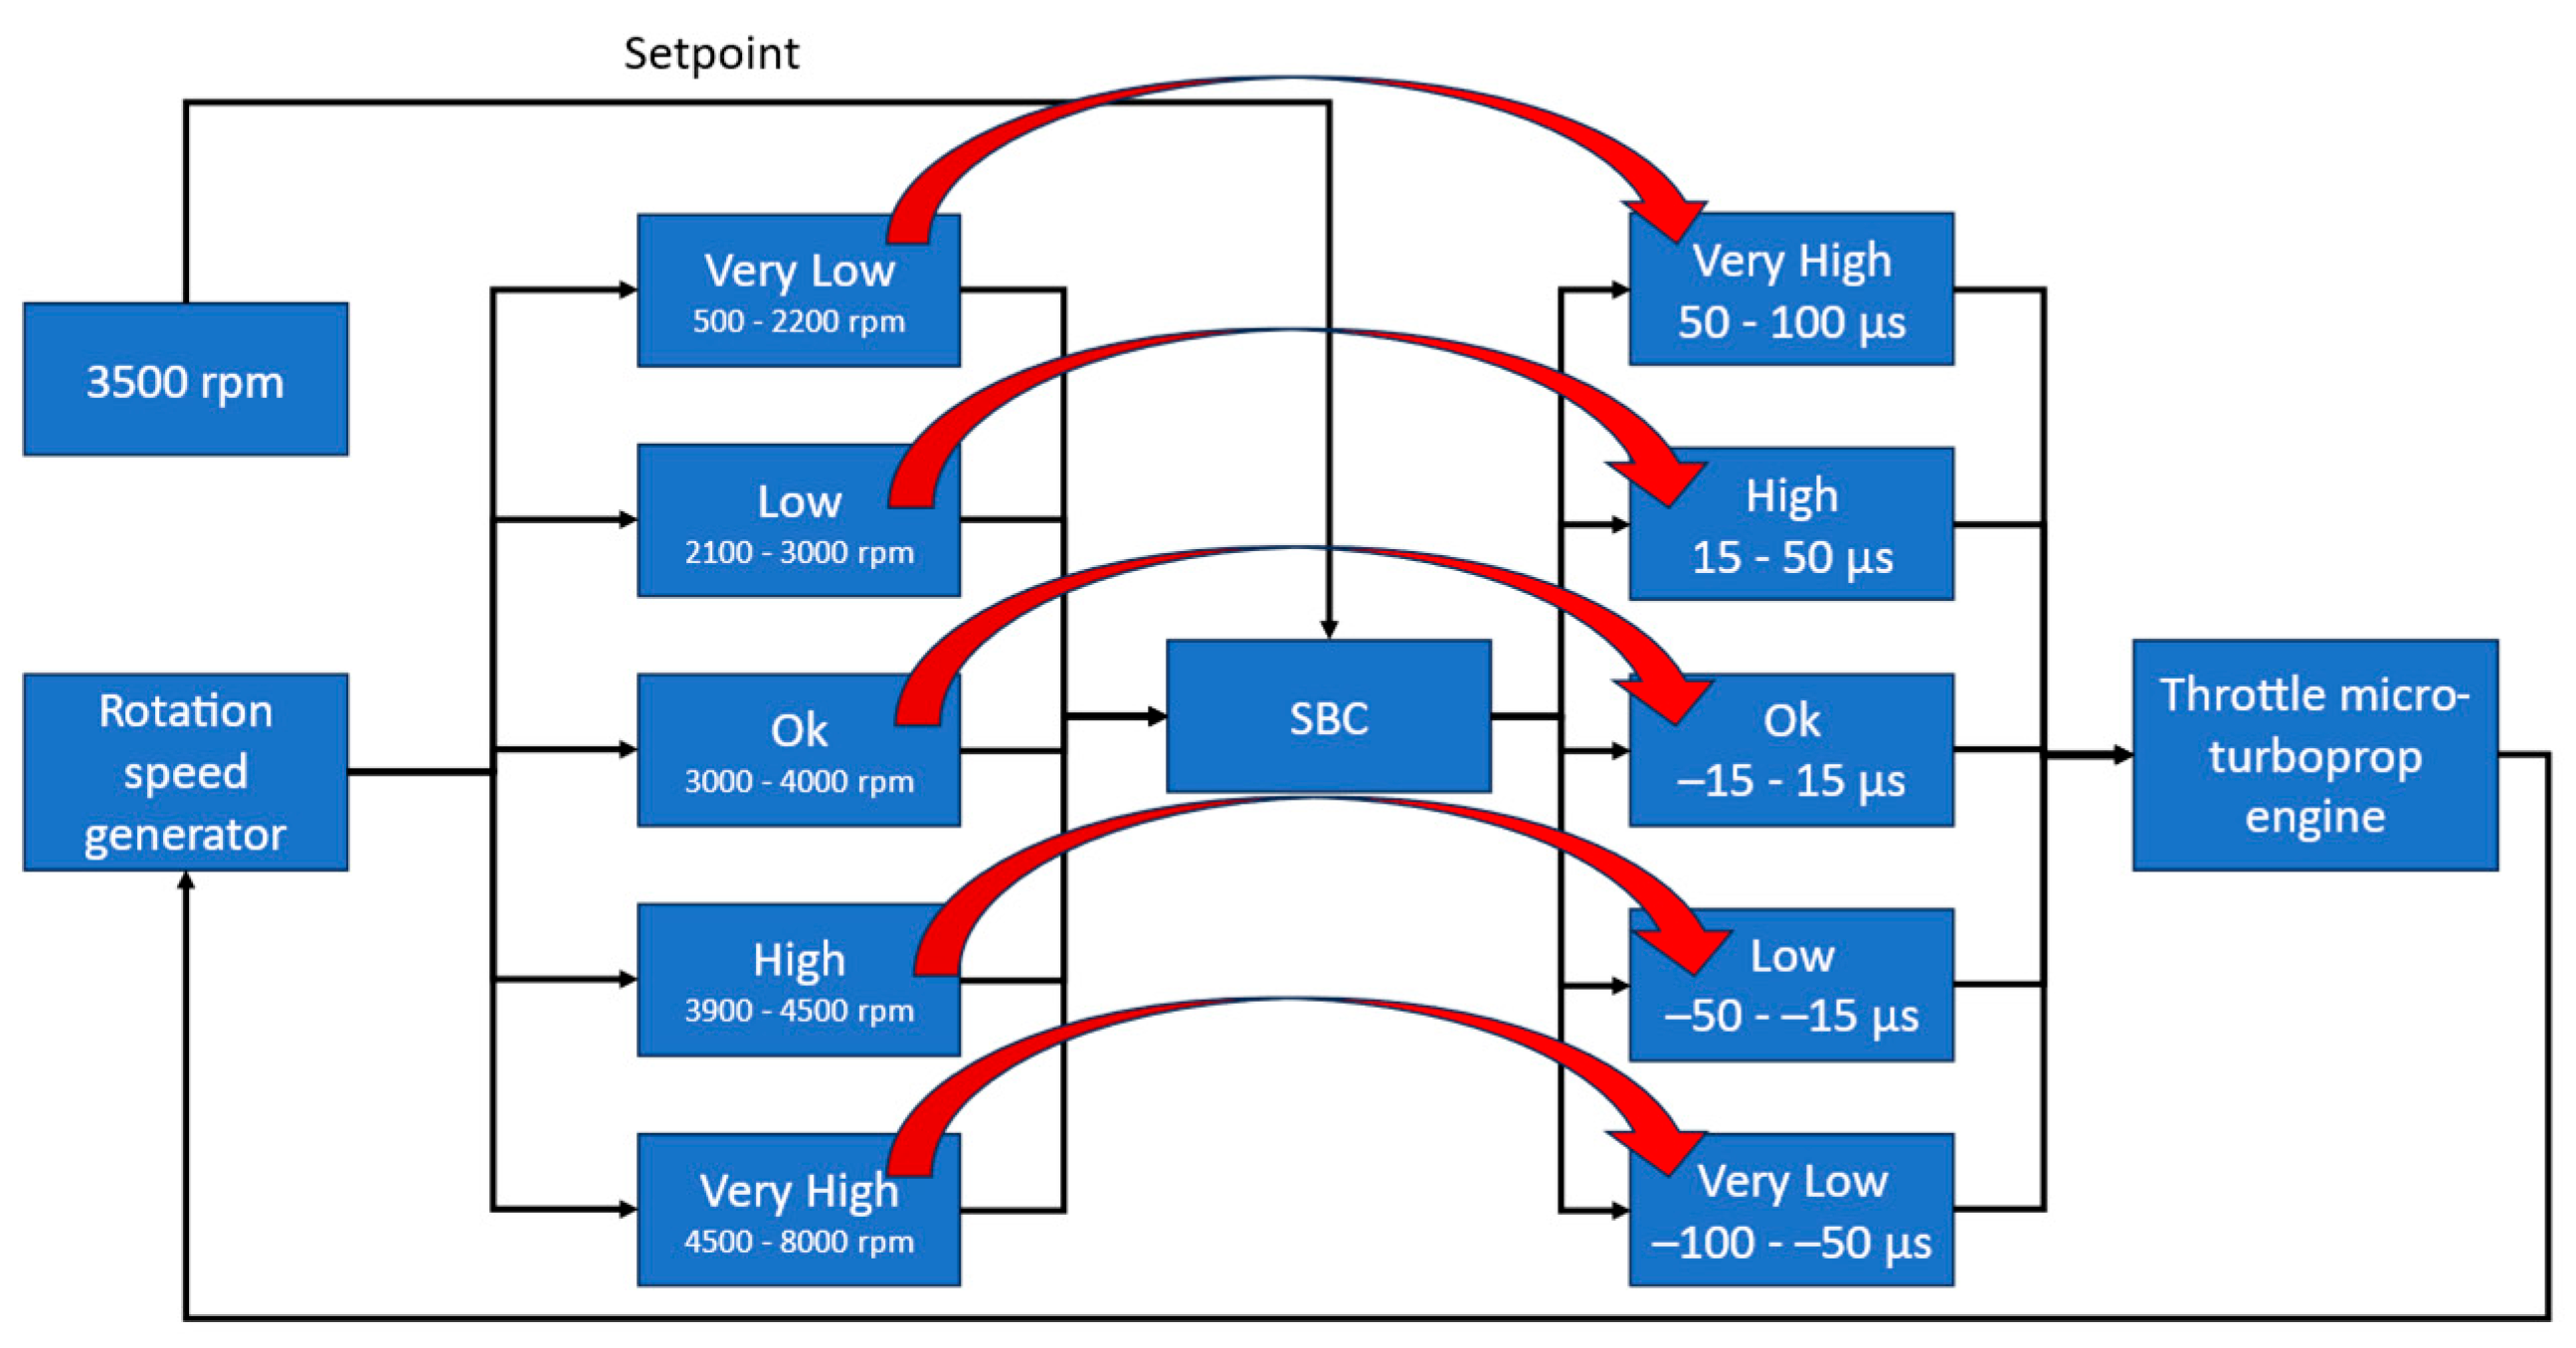
Shifting the focus from a theoretical framework to the practical application of this study, the main membership functions used for the control management of the micro-turbogenerator were the following:
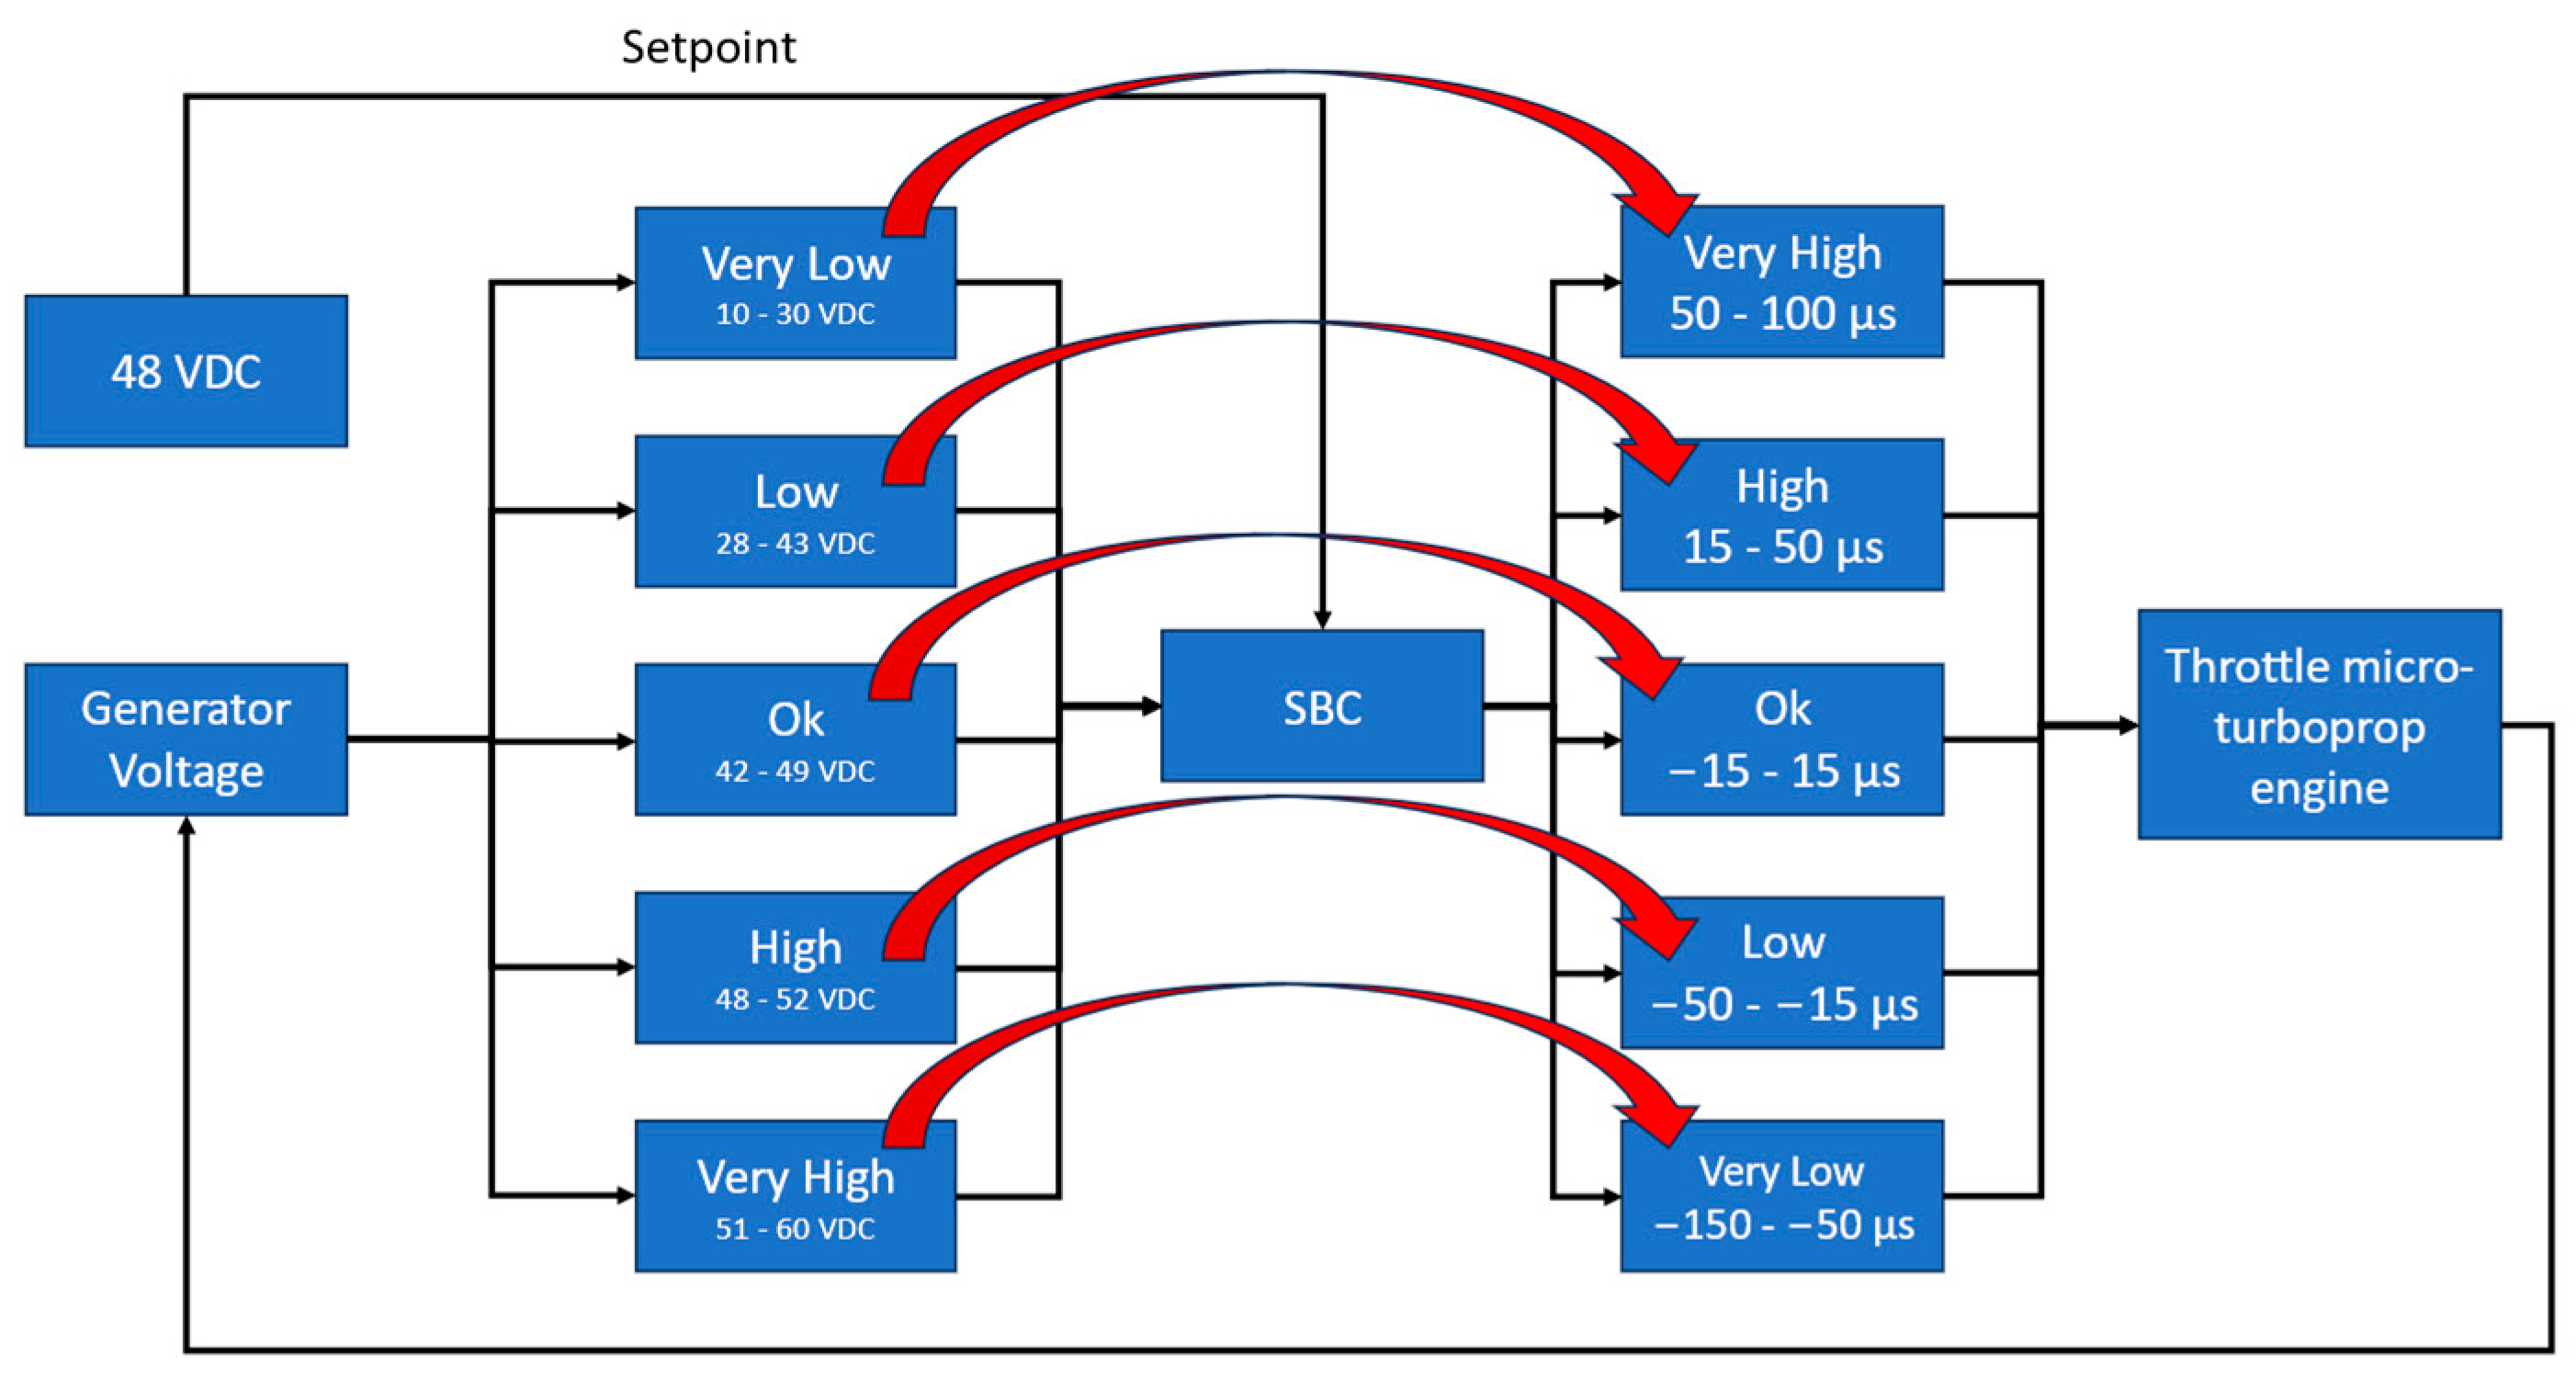
“VERY LOW” relates to a significant negative error, the setpoint being notably higher than the actual value of the analyzed parameter;
“LOW” is associated with a smaller but noticeable negative error between the measured and the reference values;
“OK” is associated with a small, acceptable error between the target and real values;
“HIGH” is associated with a noticeable positive error, the recorded value being higher in comparison to the desired output;
“VERY HIGH” relates to a notable positive error between the empirical measurement and the desired value.
The two main variables that are defined according to these membership functions are the rotation speed error and the PWM signal, the parameter used to correct that error. To be able to correlate these 2 variables, a set of five “fuzzy rules” was defined: a “VERY LOW” rotation speed error requires a “VERY HIGH” PWM signal correction; likewise, a “LOW” speed error correlates with a “HIGH” PWM signal adjustment, and the list goes on. This phase of the algorithm is the so-called Base Rule formation, a step which was briefly mentioned previously. To enhance comprehension of the algorithm’s operational principles,
Figure 4 provides a visual representation of the five membership rules, accompanied by the corresponding operating ranges of the two variables for each rule. For instance, when the rotational speed falls within the range of 500 to 2200 rpm, the SBC (System Basis Chip) will adjust the PWM (Pulse Width Modulation) signal by incrementing it by 50 to 100 µs, as dictated by the first rule of the fuzzy logic controller.
After the correlations between the adjustable variable and the parameter to be adjusted have been established, the entire control process needs to be transposed into the real elements of the experiment. This procedure is known as defuzzification, and it can be accomplished through various methods. Among the most widely used approaches are the Centroid method, the Bisector method, and the Middle of Maximum (MOM), Smallest of Maximum (SOM) and Largest of Maximum (LOM) techniques [
27].
This research paper opts to employ the Centroid method due to its versatile nature, as it is applicable across a wide range of scenarios and can be effectively utilized in nearly every practical application. This particular method returns the center of gravity of the area described by the set of membership functions used. The coordinate on the x-axis of the centroid can be computed utilizing the following approach [
27]:
To summarize, the principle of the fuzzy logic controller can be outlined as follows:
The operator specifies the desired rotational speed setpoint as the input.
The fuzzy logic controller compares the setpoint with the actual rotational speed, measured by the tachometer, by calculating an error between the two parameters and “fuzzyficating” it.
Based on the error calculated in the previous step and on the defined Base Rules, the SBC provides the appropriate PWM signal values and sends them, “defuzzyficated”, to the micro-turboprop engine system, thereby adjusting its rotational speed.
This iterative process continues until the rotational speed achieves the target setpoint or converges to a value within its proximate range.
During the initial set of tests conducted on the experimental hybrid system model test bench with a micro-turboprop engine, the rotation speed of the electric generator was adopted as the primary control parameter in the fuzzy logic algorithm. However, during this testing phase, issues relating to a series of incorrect readings of the generator’s rotation speed were identified. Unusual values were detected within the recorded data vector, affecting the performance and accuracy of the micro-turboprop engine’s automatic control. The initial implementation of the rotational speed-reading process proved to be inadequate, even after adjusting the reading timing. Even though the magnitude errors were reduced, the issues remained quite noticeable. These reading errors contributed to instability in the micro-turboprop engine’s control during the autonomous operation.
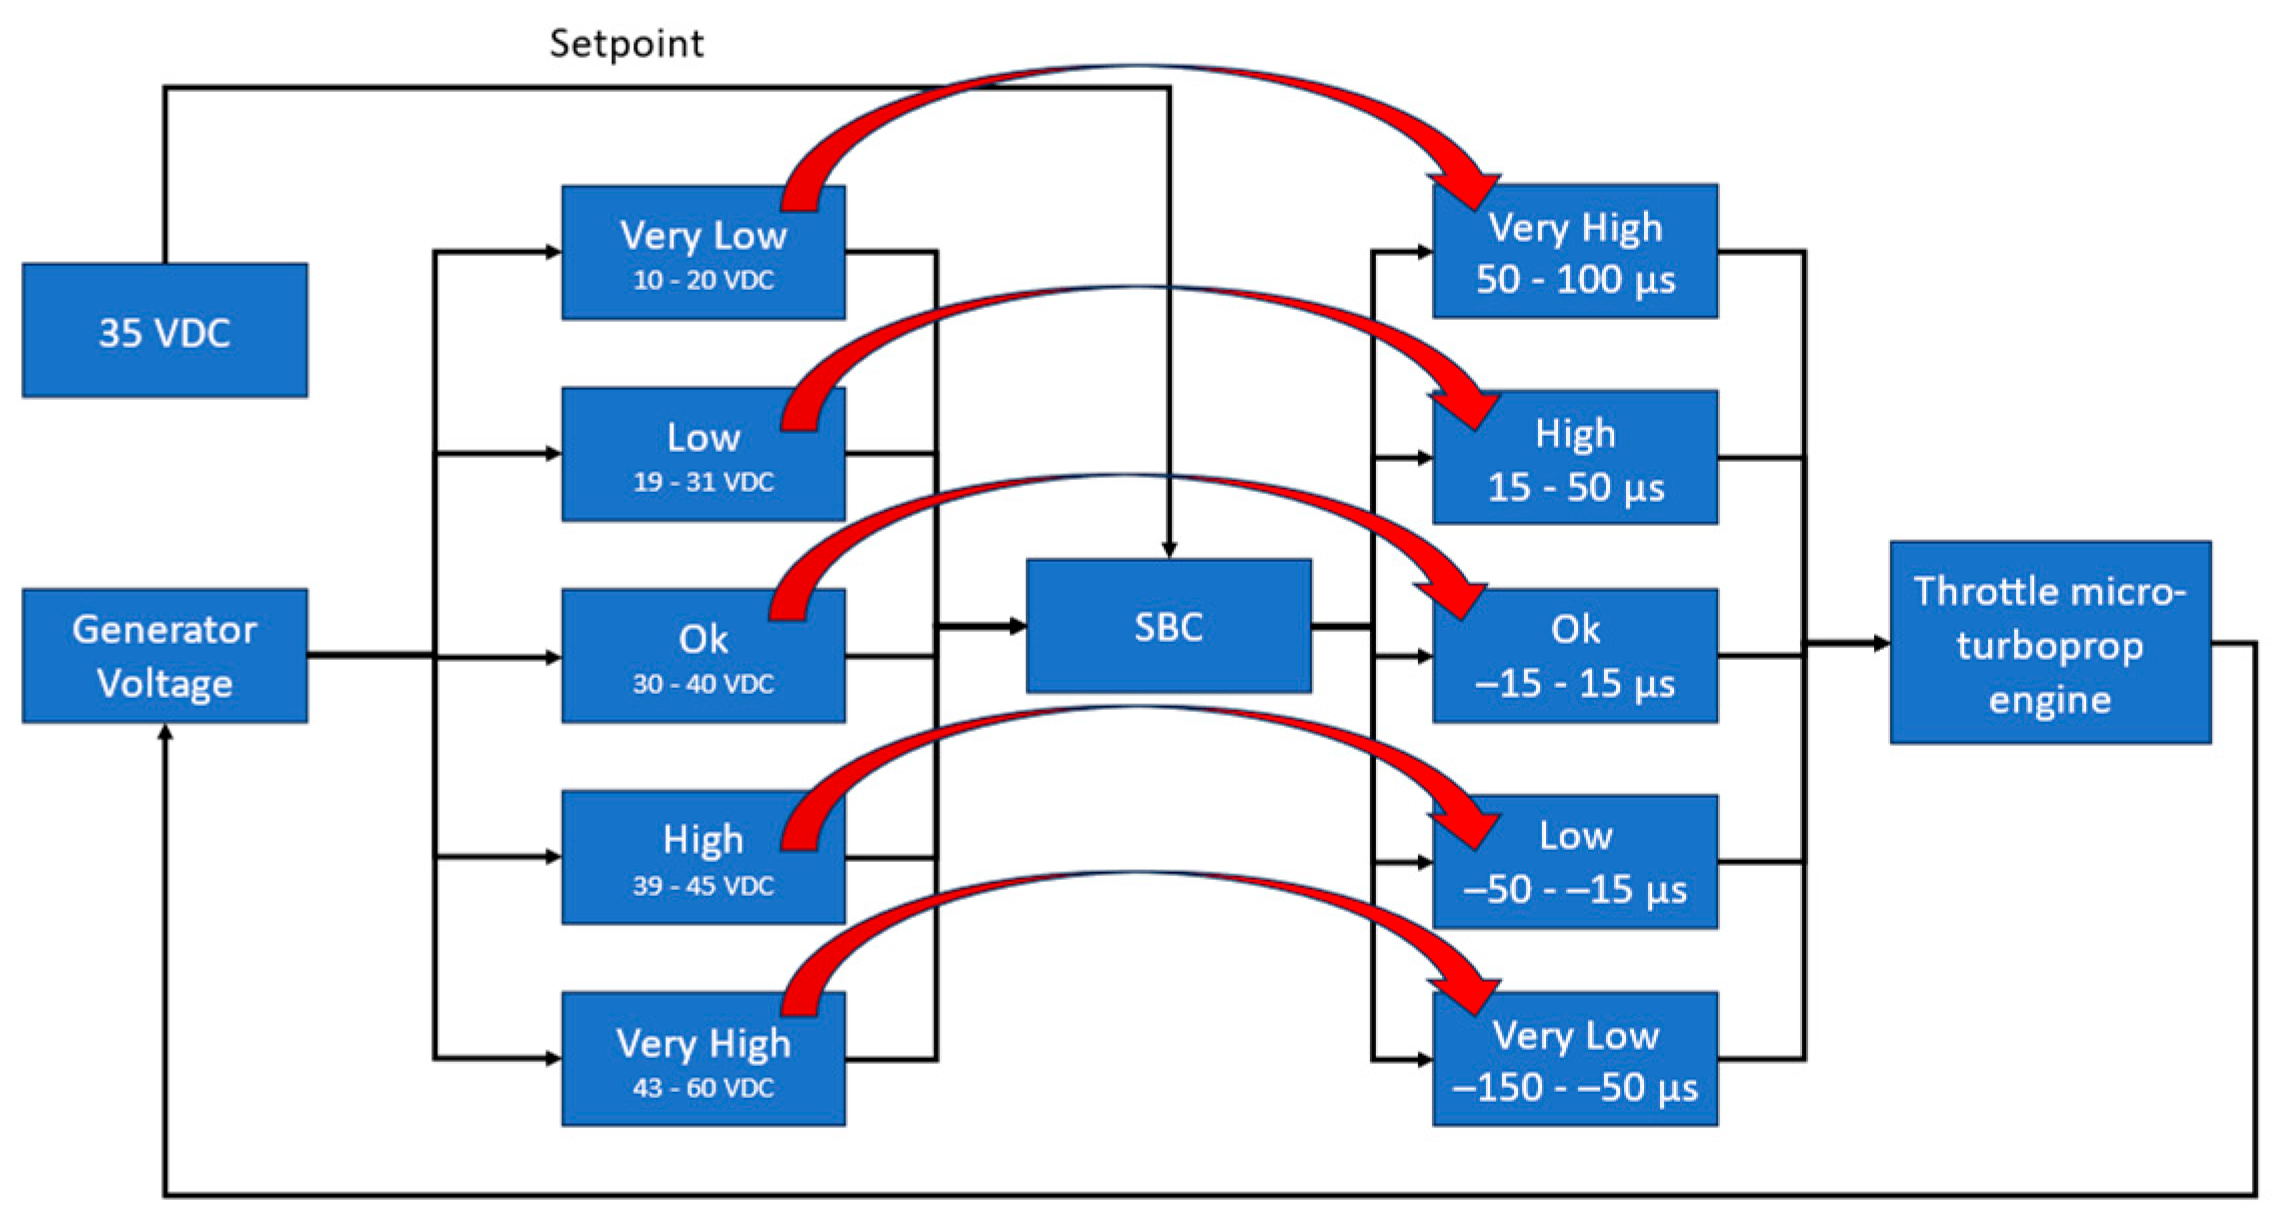
Knowing that one of the key parameters of the fuzzy logic controller, the rotational speed of the generator, was not properly recorded, this called for a change in the variable used in the control law. Since the generator’s rotation speed is directly proportional to its output voltage, the project team decided to replace speed readings with voltage monitoring. Consequently, the controller’s input parameter was changed from the generator’s rotation speed to its output voltage, change which can be observed in
Figure 5.
To implement this solution, the installation of a voltage and current sensor utilizing the Hall effect was required. This sensor was mounted on the positive cable (+) exiting the rectifier bridge, enabling the collection of data on the generated DC. This approach enhanced the system stability and precision in hybrid control, optimizing the operation of the micromotor and ensuring enhanced reliable adjustments of the rotational speed based on the generated electrical load. This methodology not only improved the data accuracy, but also contributed to the overall efficiency of the automatic control system.
The shift in the control parameter from generator speed to output voltage led to the necessity of making significant adjustments to the hybrid system’s control software. This adaptation involved reconfiguring the control algorithm implemented on the SBC to align with the new voltage-based monitoring and regulation methodology. These changes reflect the dynamicity and adaptability of this approach to the management and control of hybrid systems, enhancing operational stability and efficiency by utilizing voltage data as the primary indicator of system performance. This transformation not only improved the control accuracy, but also contributed to the overall efficiency of the hybrid system.
2.3. Testing Strategy
Given the limitations associated with implementing a control law based on rotational speed, as discussed in the previous section, voltage was selected as the primary control parameter for the presented testing strategy. Furthermore, the following test results were obtained for the test bench configuration that excluded the stabilizing module. The rationale for this will be discussed in greater detail later on.
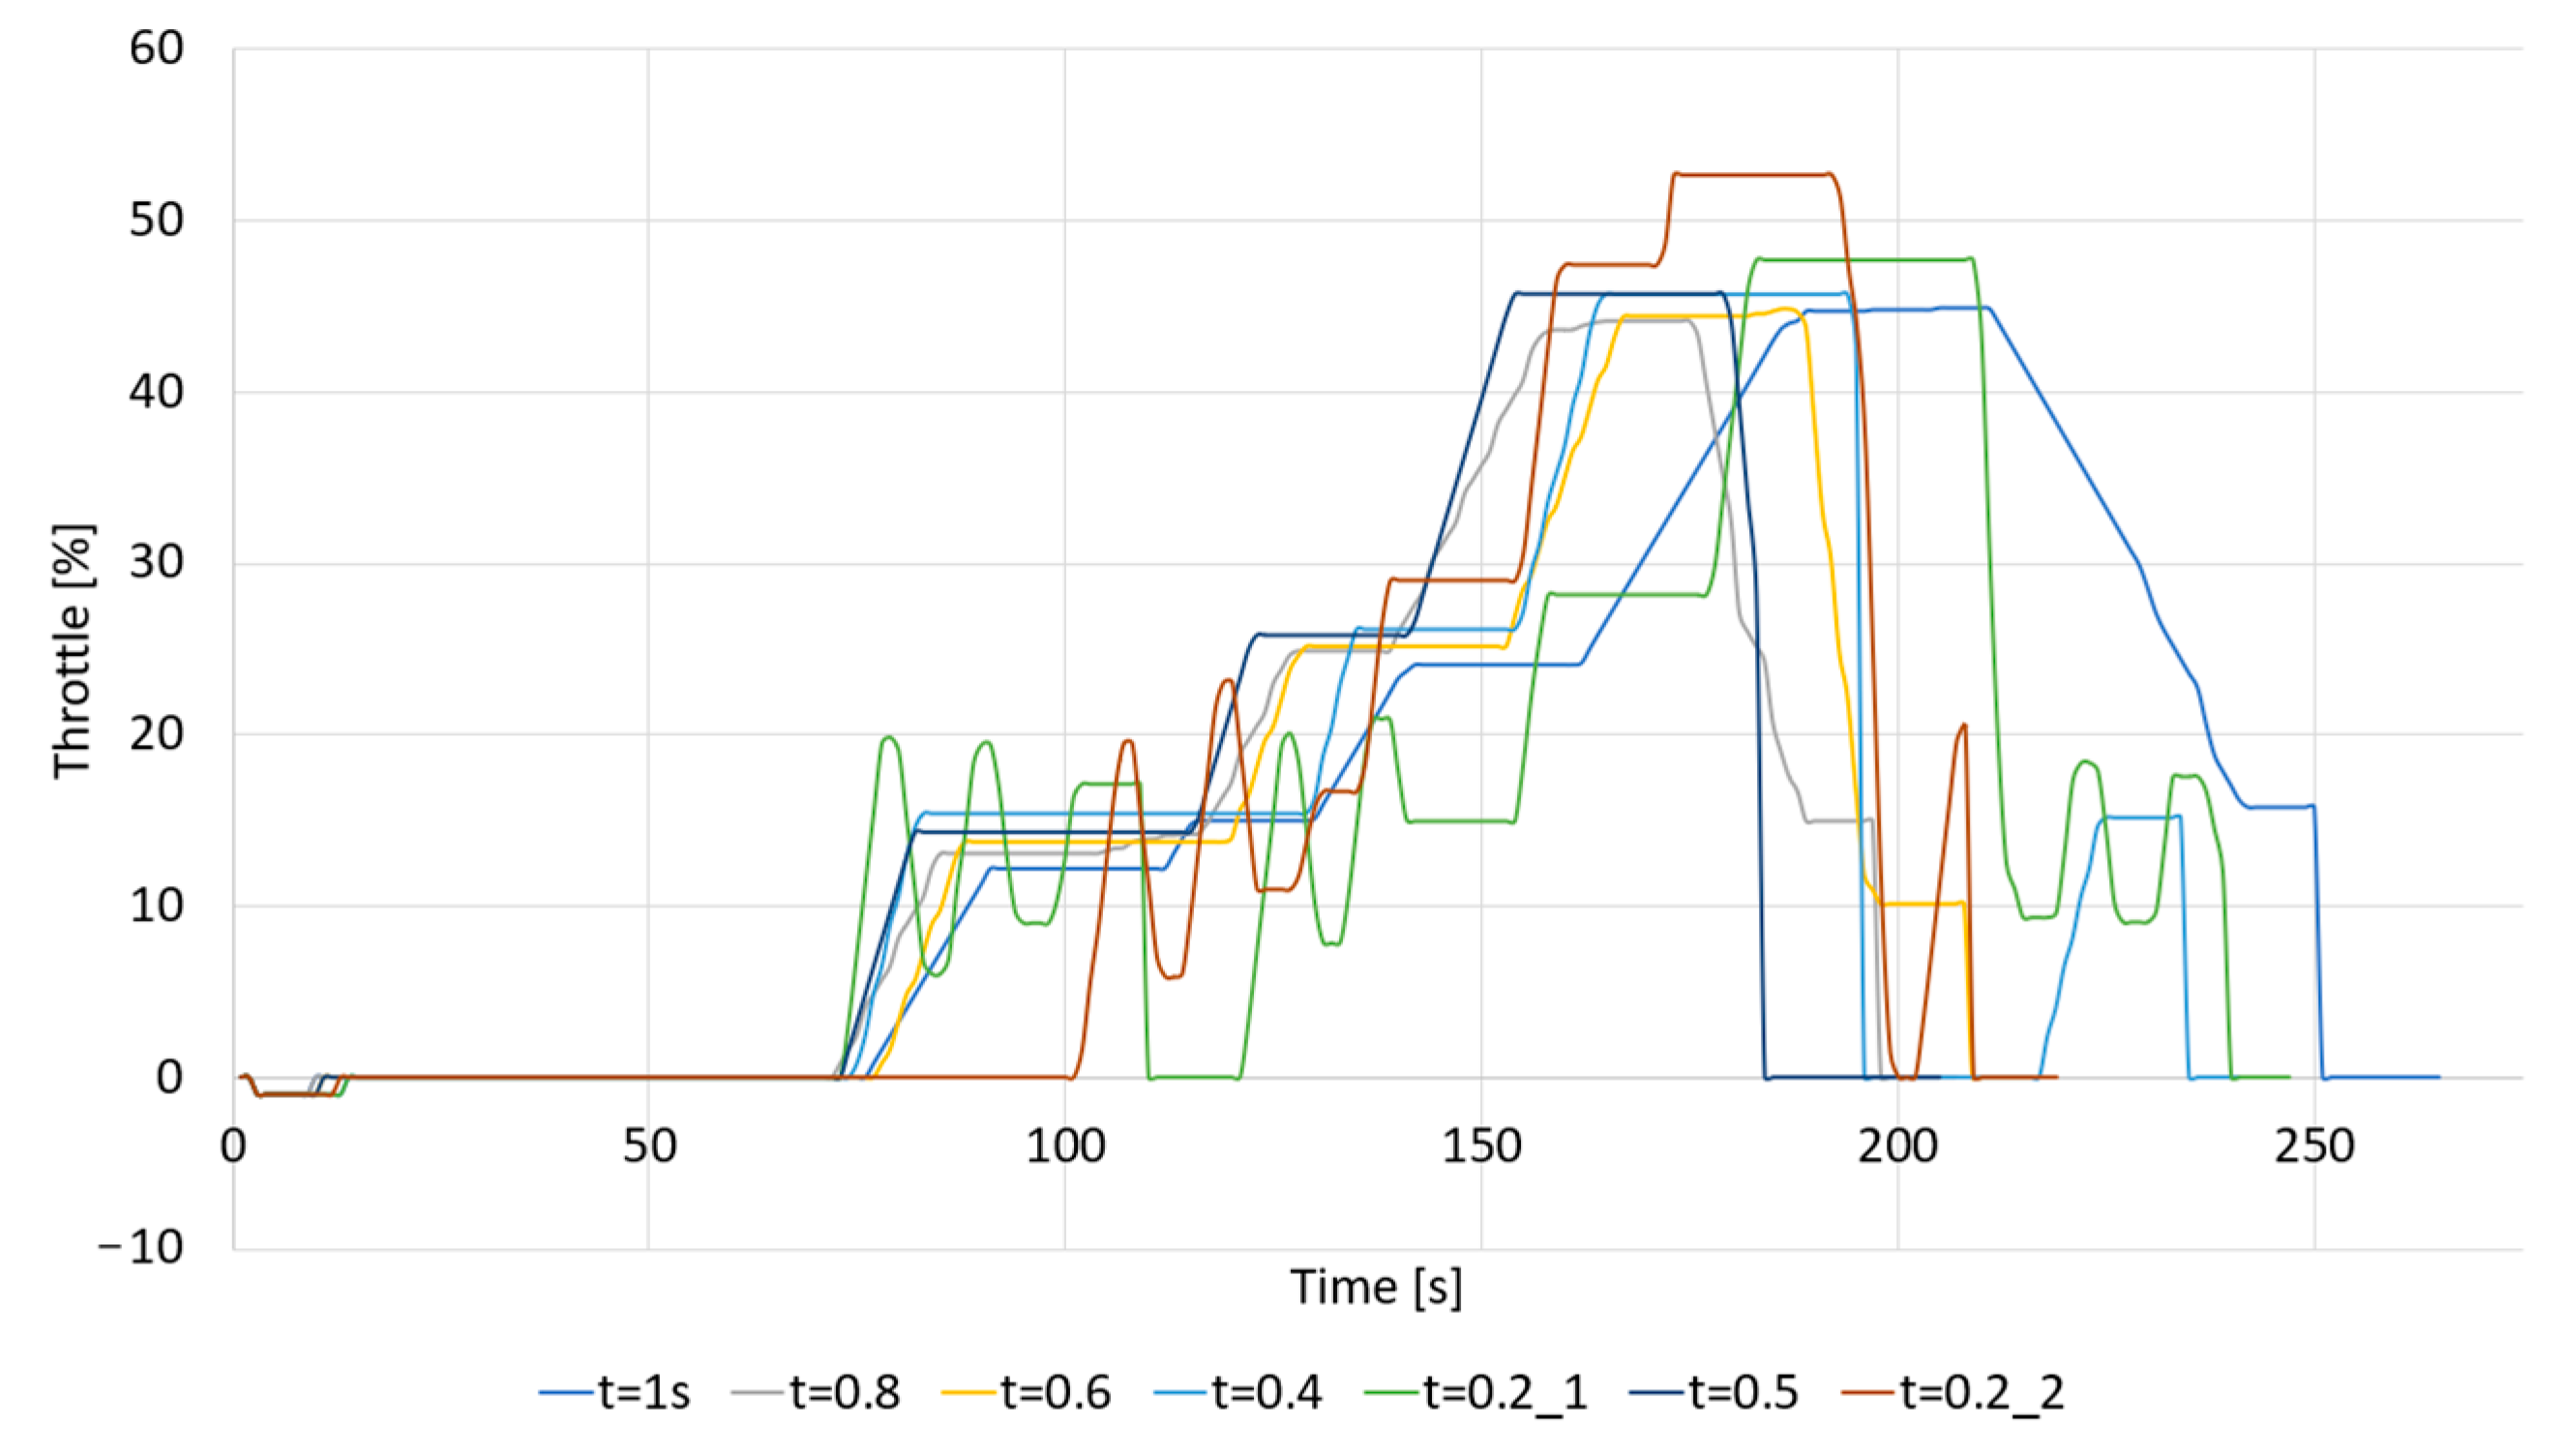
Before proceeding with the description of the testing strategy, it is important to clarify a key technical term. The term “throttle”, as used in the analysis within this research paper, differs from its application in gasoline engines. Unlike gasoline engines, the micro-engine is regulated by controlling the quantity of fuel rather than a traditional throttle mechanism. Thus, whenever the term “throttle” is mentioned, it specifically denotes the power output achieved by adjusting the amount of fuel supplied to the combustion chamber of the micro-engine. The first part of the experimental testing campaign with automated control was conducted by following a structured approach to evaluate the performance of the system under varying conditions. The same fuzzy logic control program was employed throughout the tests, with modifications applied solely to the computation frequency, which was adjusted at discrete time steps of 1, 0.8, 0.6, 0.5, 0.4, and 0.2 s.
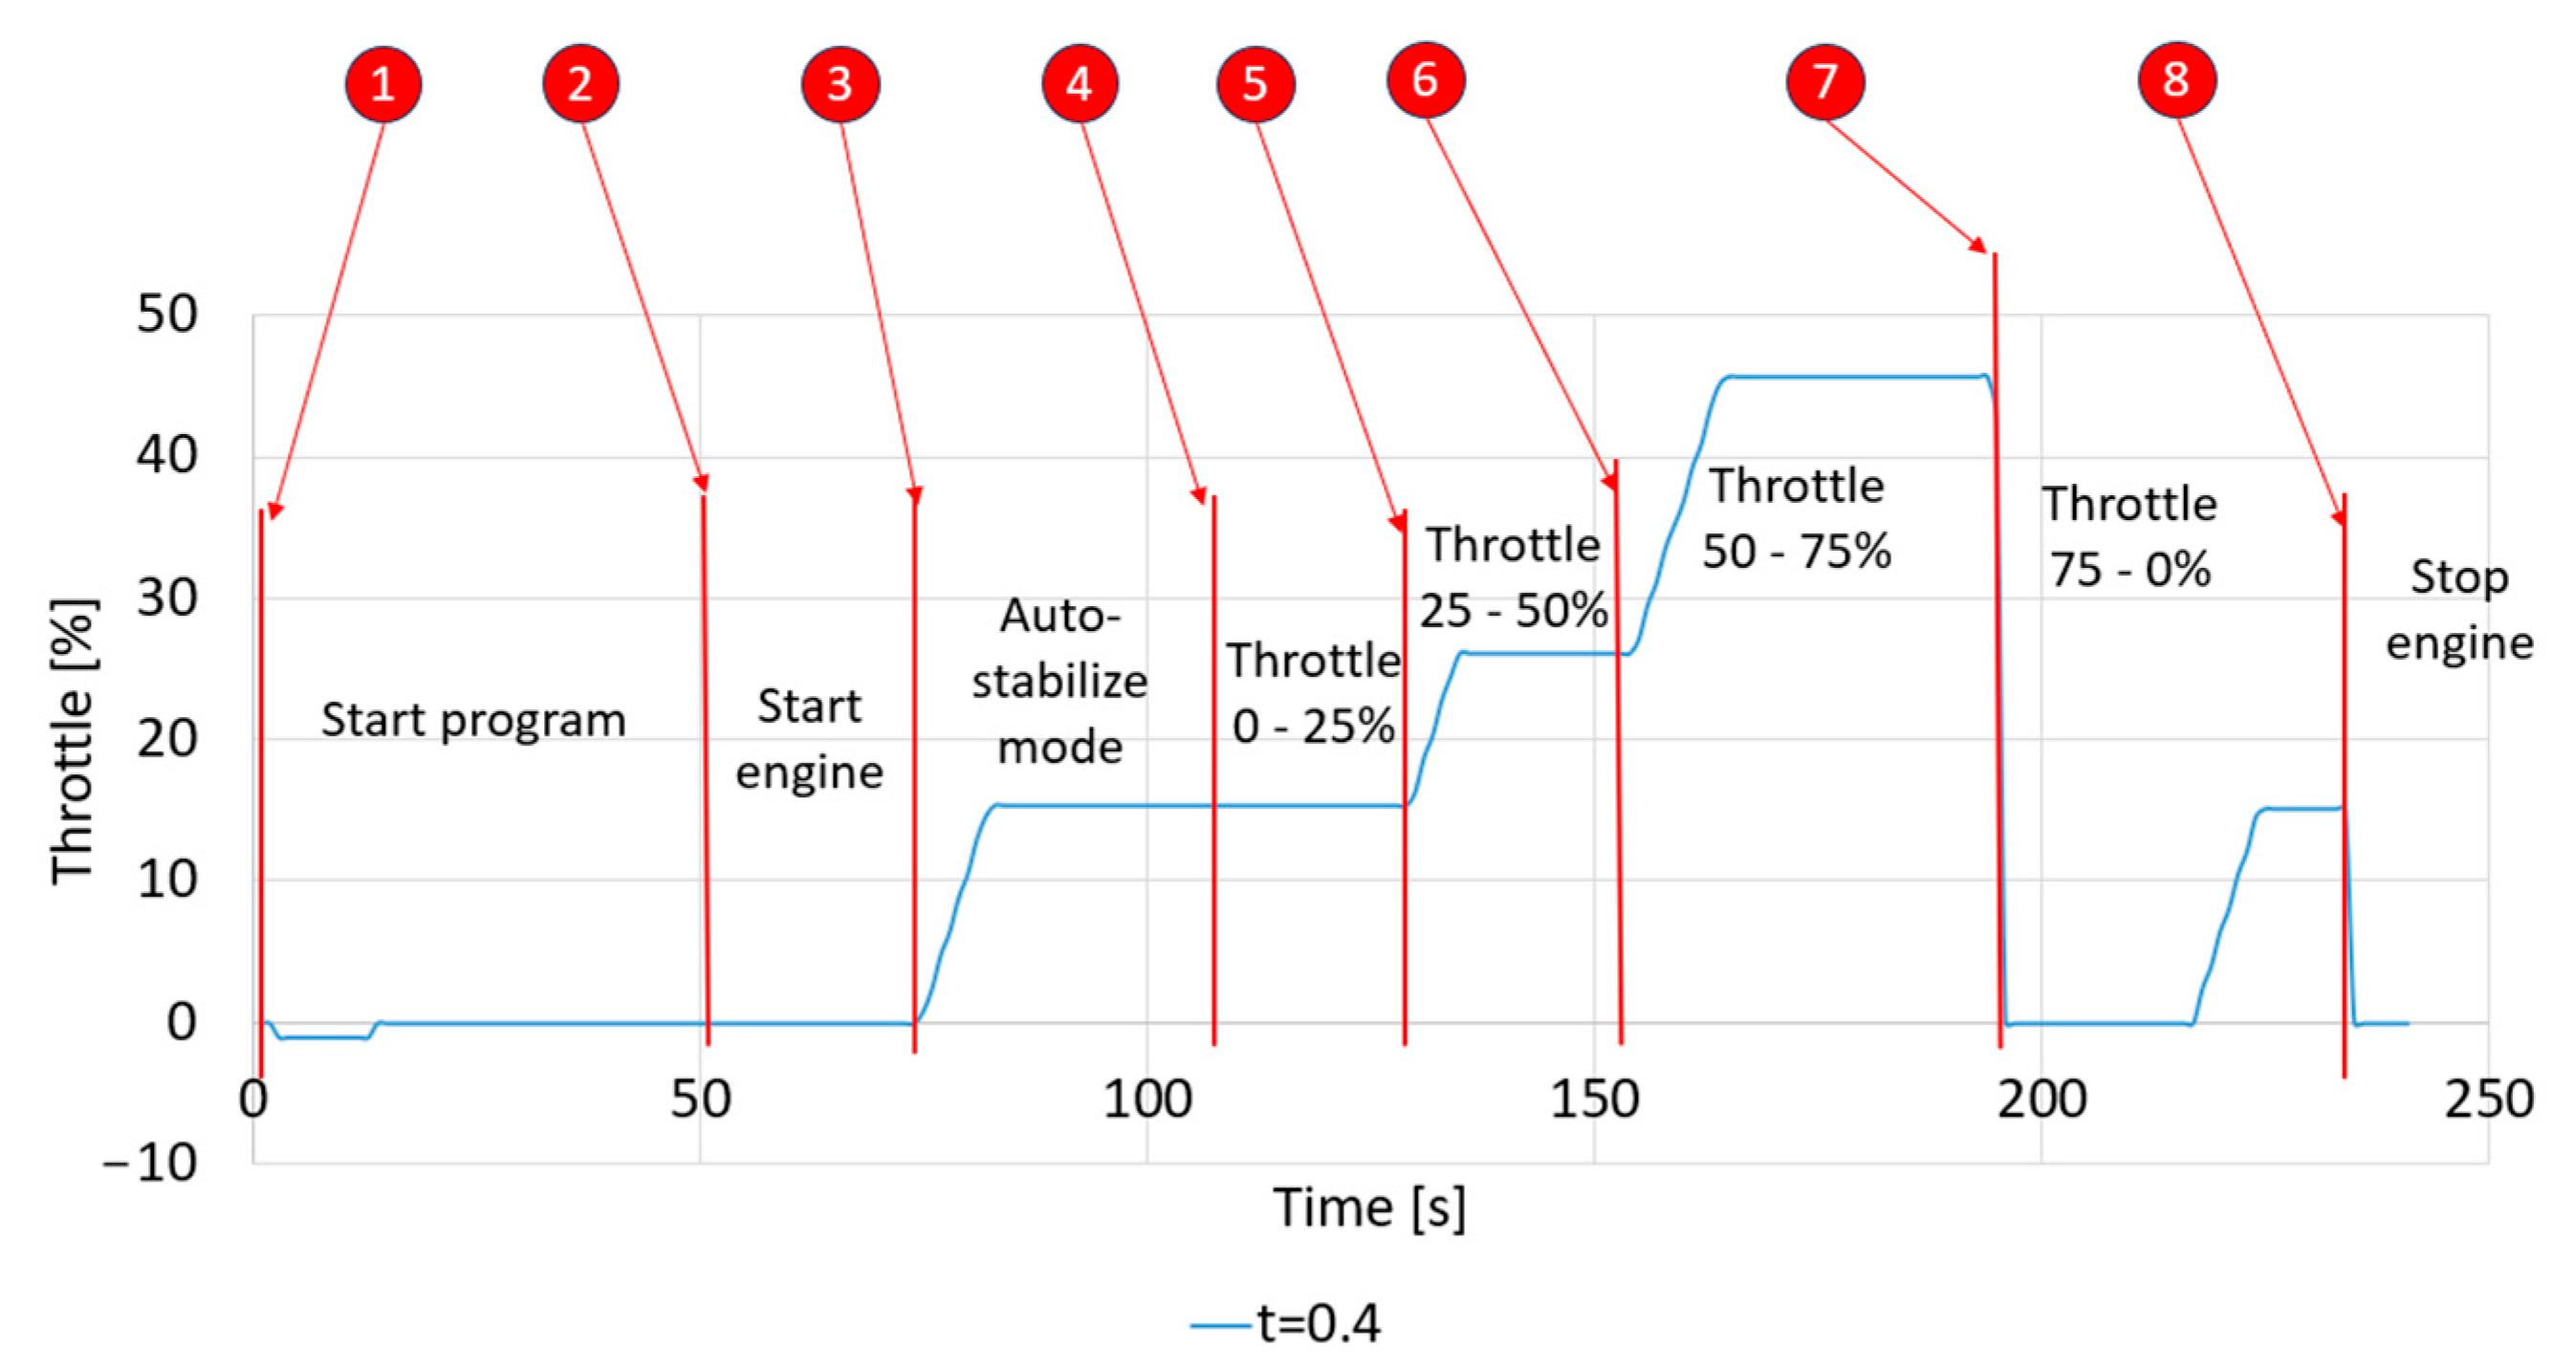
Figure 6 presents a graphical representation, which highlights the key phases of the testing procedures conducted on the test bench. This structured approach ensures a comprehensive evaluation of the control strategy.
The testing procedure began with the initiation of the developed control program through the designated interface. Once the program was activated, the micro-turbogenerator was started, followed by the activation of the auto-stabilization mode to maintain system stability. Subsequently, the load was incrementally adjusted, starting with a 25% throttle, then increasing it to 50%, and later to 75%, allowing for an assessment of the system’s response under varying loads. After reaching the peak load, the throttle was reduced to 0% to observe the evolution of the parameters during immediate deceleration. Finally, the testing sequence concluded with the controlled shutdown of the micro-turbogenerator.
The second set of tests consisted of adding the power converter module onto the micro-turbogenerator test bench in order to increase the value of the voltage-stabilizing threshold without damaging the entire system.
The final testing procedure consisted of increasing the voltage setpoint from 35 to 48 VDC, to gain access to higher power values. To ensure that the electrical components would not be overloaded in the case of drastic fluctuation of the voltage, the fuzzy logic controller rules were made stricter, especially for the “OK” law.
The final phase of the testing procedure involved incrementally raising the voltage setpoint from 35 VDC to 48 VDC to achieve access to higher power outputs, alteration which was illustrated in
Figure 7. To safeguard the electrical components against potential overloads caused by abrupt voltage fluctuations, the rules governing the fuzzy logic controller were rigorously refined. Particular emphasis was placed on tightening the constraints for the “OK” control law to reduce error propagation in the least amount of time possible.
To ensure the accuracy and reliability of the measurements, the values recorded by the Hall effect-based electric sensor were cross-verified using an ammeter (ampere meter). Additionally, the control algorithm incorporated automated regulation of the power consumer’s rotational speed, specifically the EDF (Electric Ducted Fan). This incorporation enhanced the monitoring and stabilization of parameters such as the electric current intensity, the micro-turboprop engine’s rotational speed, and the generator’s rotational speed, ensuring consistent and reliable system performance.
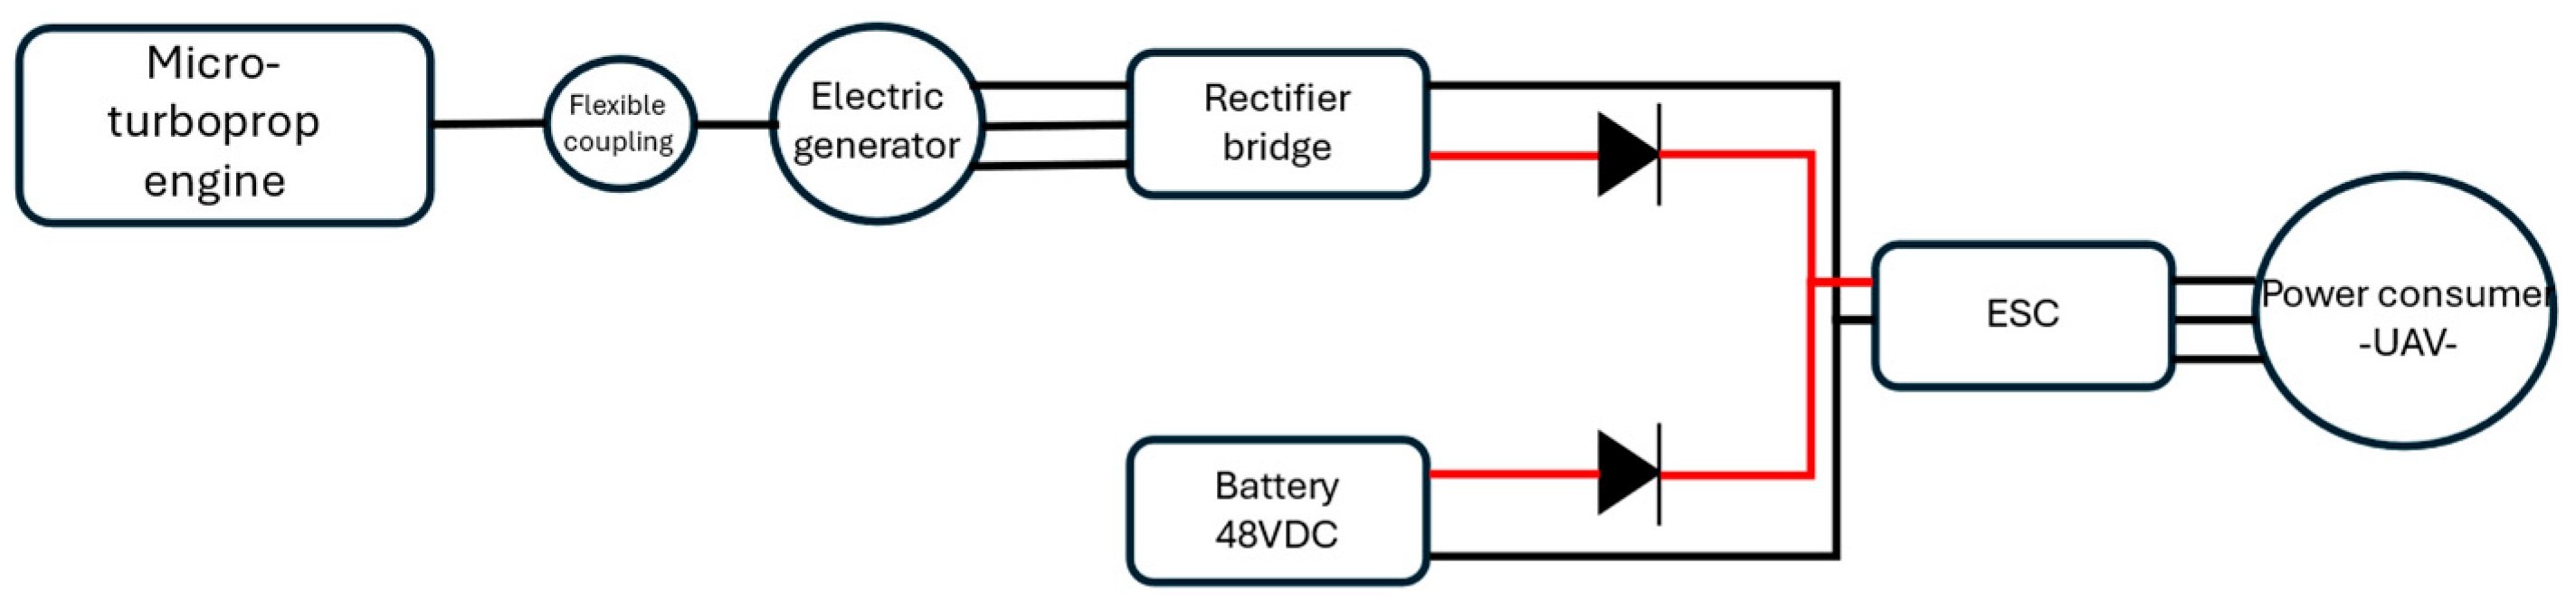
In order to enhance the safety of the test bench components even further, this study proposes a solution aimed at stabilizing the energy output of the electric generator through the integration of an additional battery module. This module is designed to compensate for instances when the micro-turbogenerator is unable to meet the energy demands of the power consumer, such as the UAV, thereby ensuring a consistent and reliable power supply. This configuration becomes essential in situations where the fuzzy control algorithm is either overridden or is unable to maintain adequate performance.
Figure 8 presents a schematic diagram of the newly proposed stabilizing module. This configuration includes, as displayed in the following representation, two diodes, which are incorporated to ensure the unidirectional flow of current within the system. This design feature prevents reverse current flow, thereby enhancing the stability and reliability of the module’s operation.
This newly proposed stabilizing configuration, however, has not yet been experimentally validated on the test bench; there are plans to address and evaluate this solution in detail within the context of a subsequent research article.
3. Results
To enable a coherent evaluation of the micro-turbogenerator’s performance, a series of tests were conducted, during which variations in key parameters of interest, such as voltage, electric current intensity, generator rotation speed and micro-turboprop engine rotational speed, were recorded. These experiments employed the previously described fuzzy logic control scheme.
A primary focus should be placed on comparing the results obtained from the manual and autonomous operation modes. The findings from the manually operated tests, as detailed in [
24], are depicted in
Figure 9. It is evident that the maximum voltage level achieved during manual operation was 25 V, which is nearly half of the target current value of 48 VDC. Additionally, the maximum power output recorded under manual operation was 675 W.
The most essential results derived from the test sets primarily focus on analyzing the variations in voltage over time and the influence of these changes when the discrete time step between signals is altered. Future research directions may also be highlighted. The graph displayed in
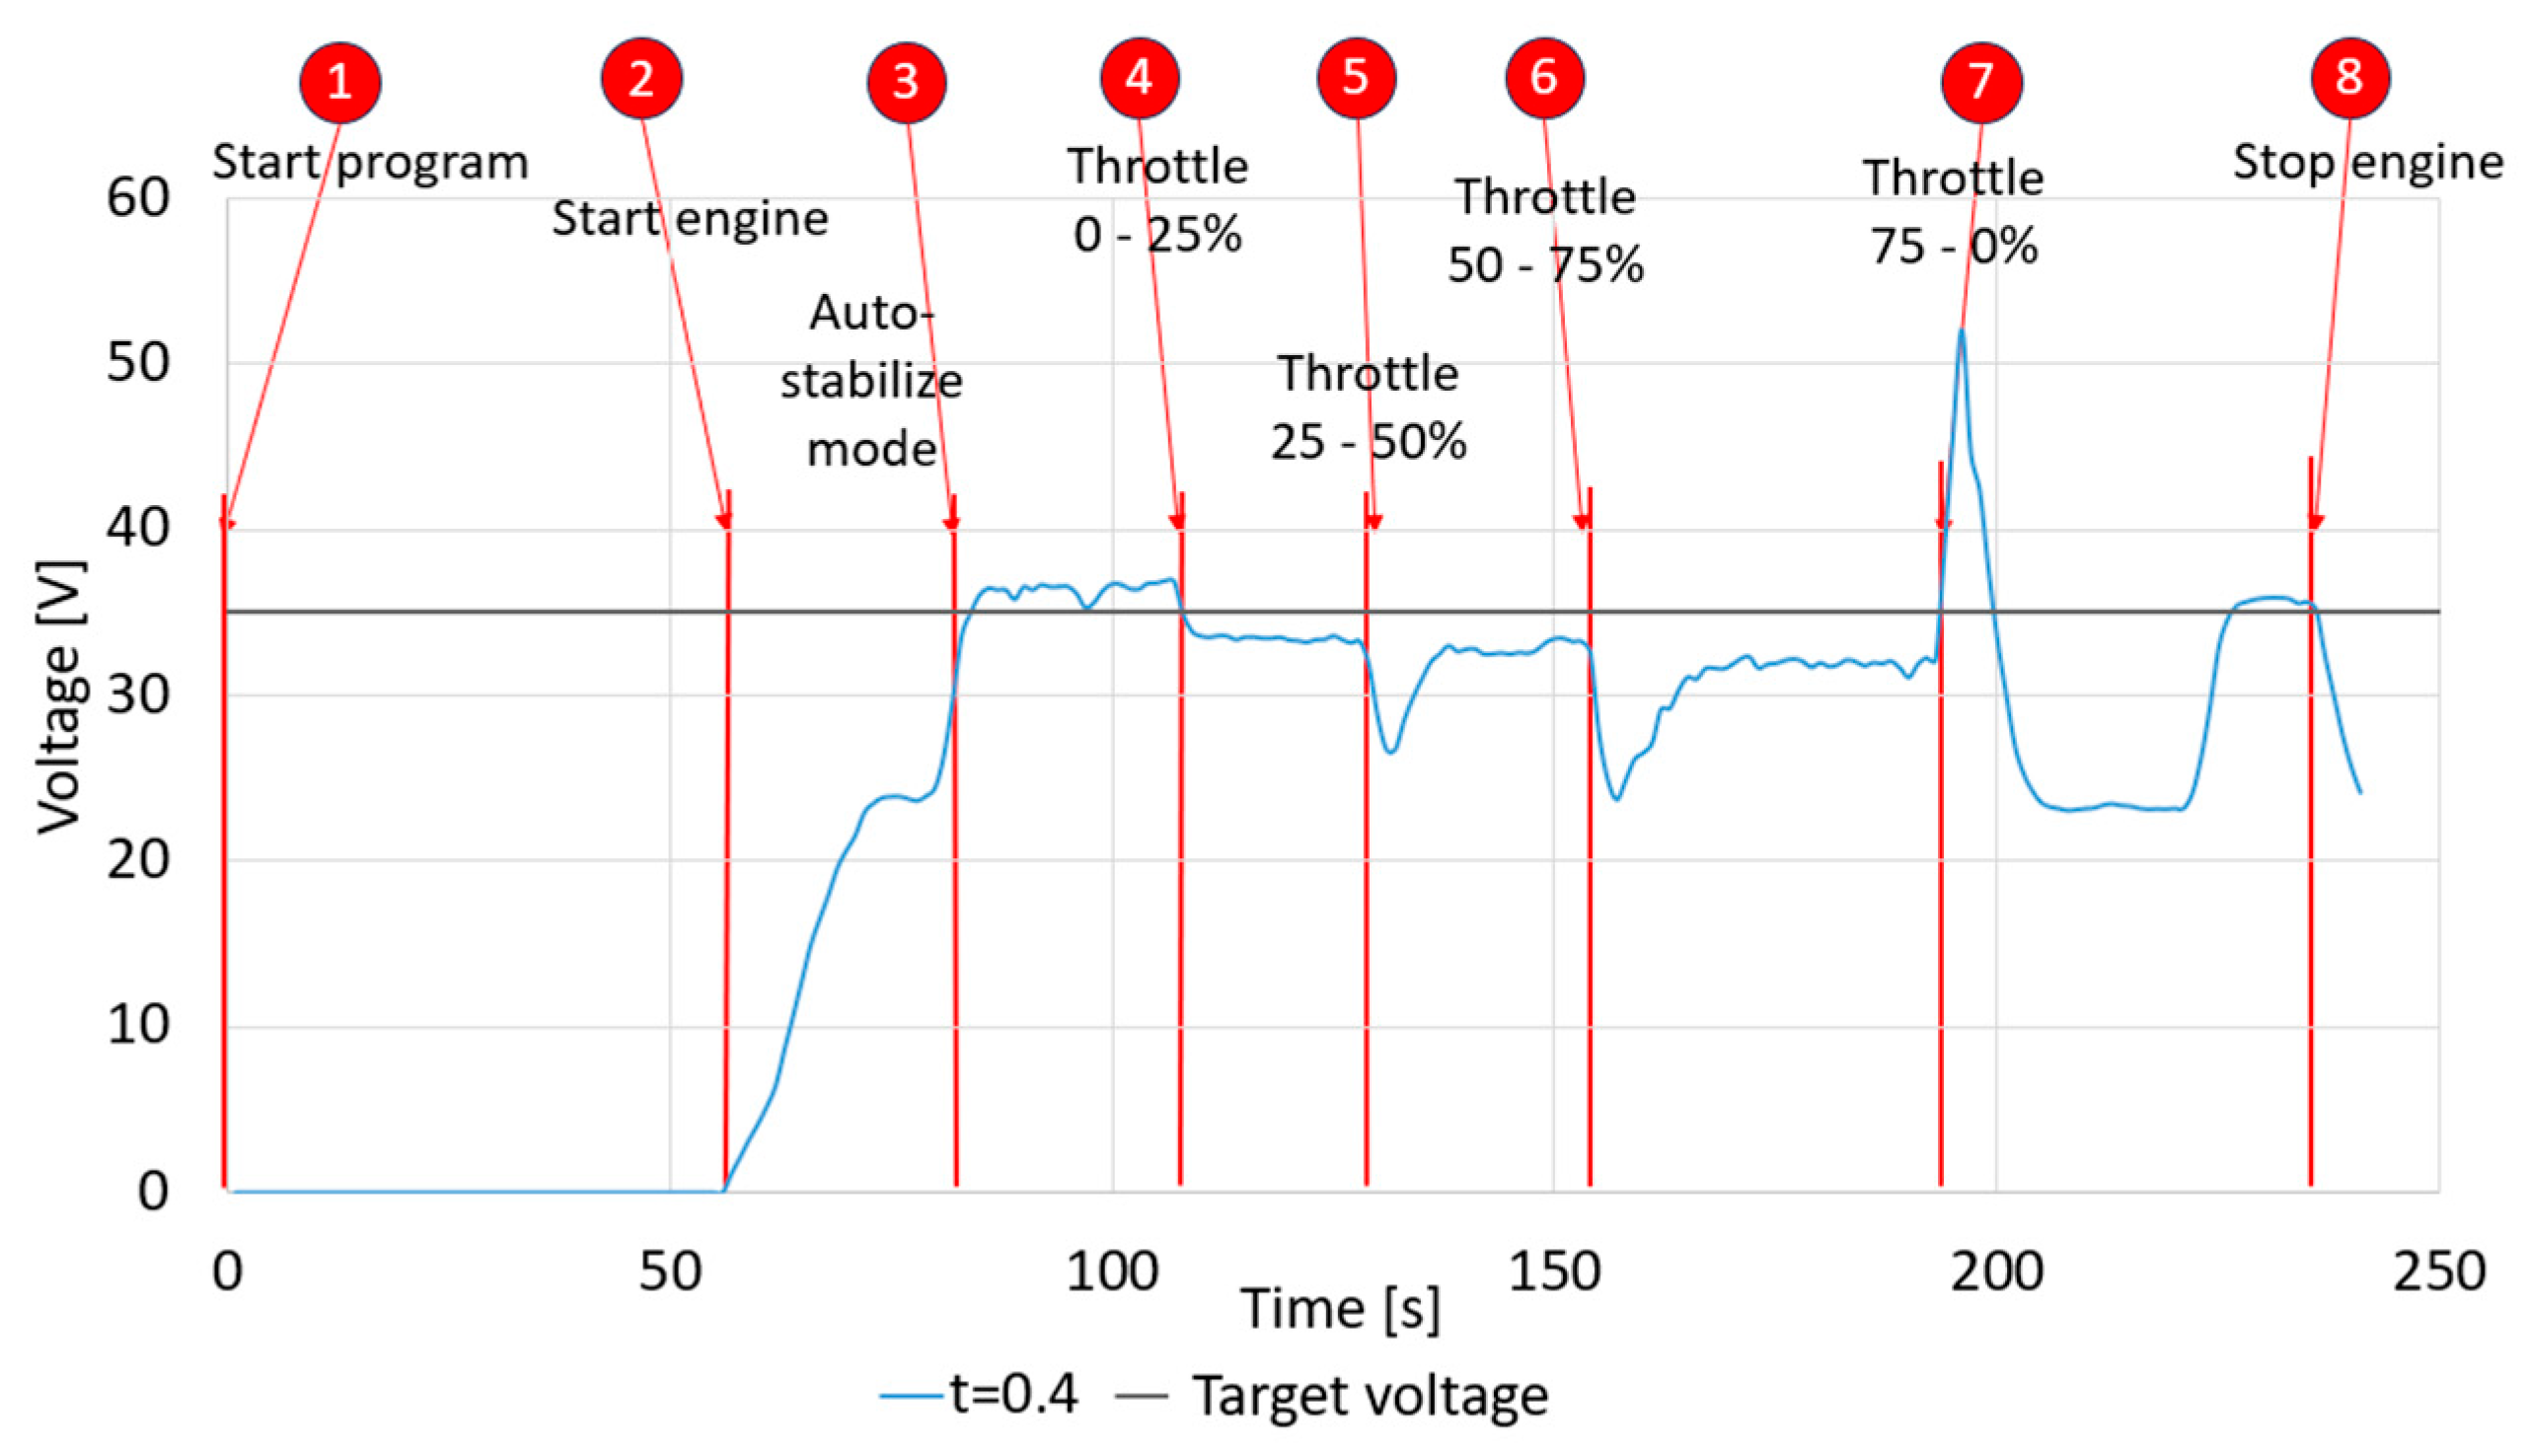
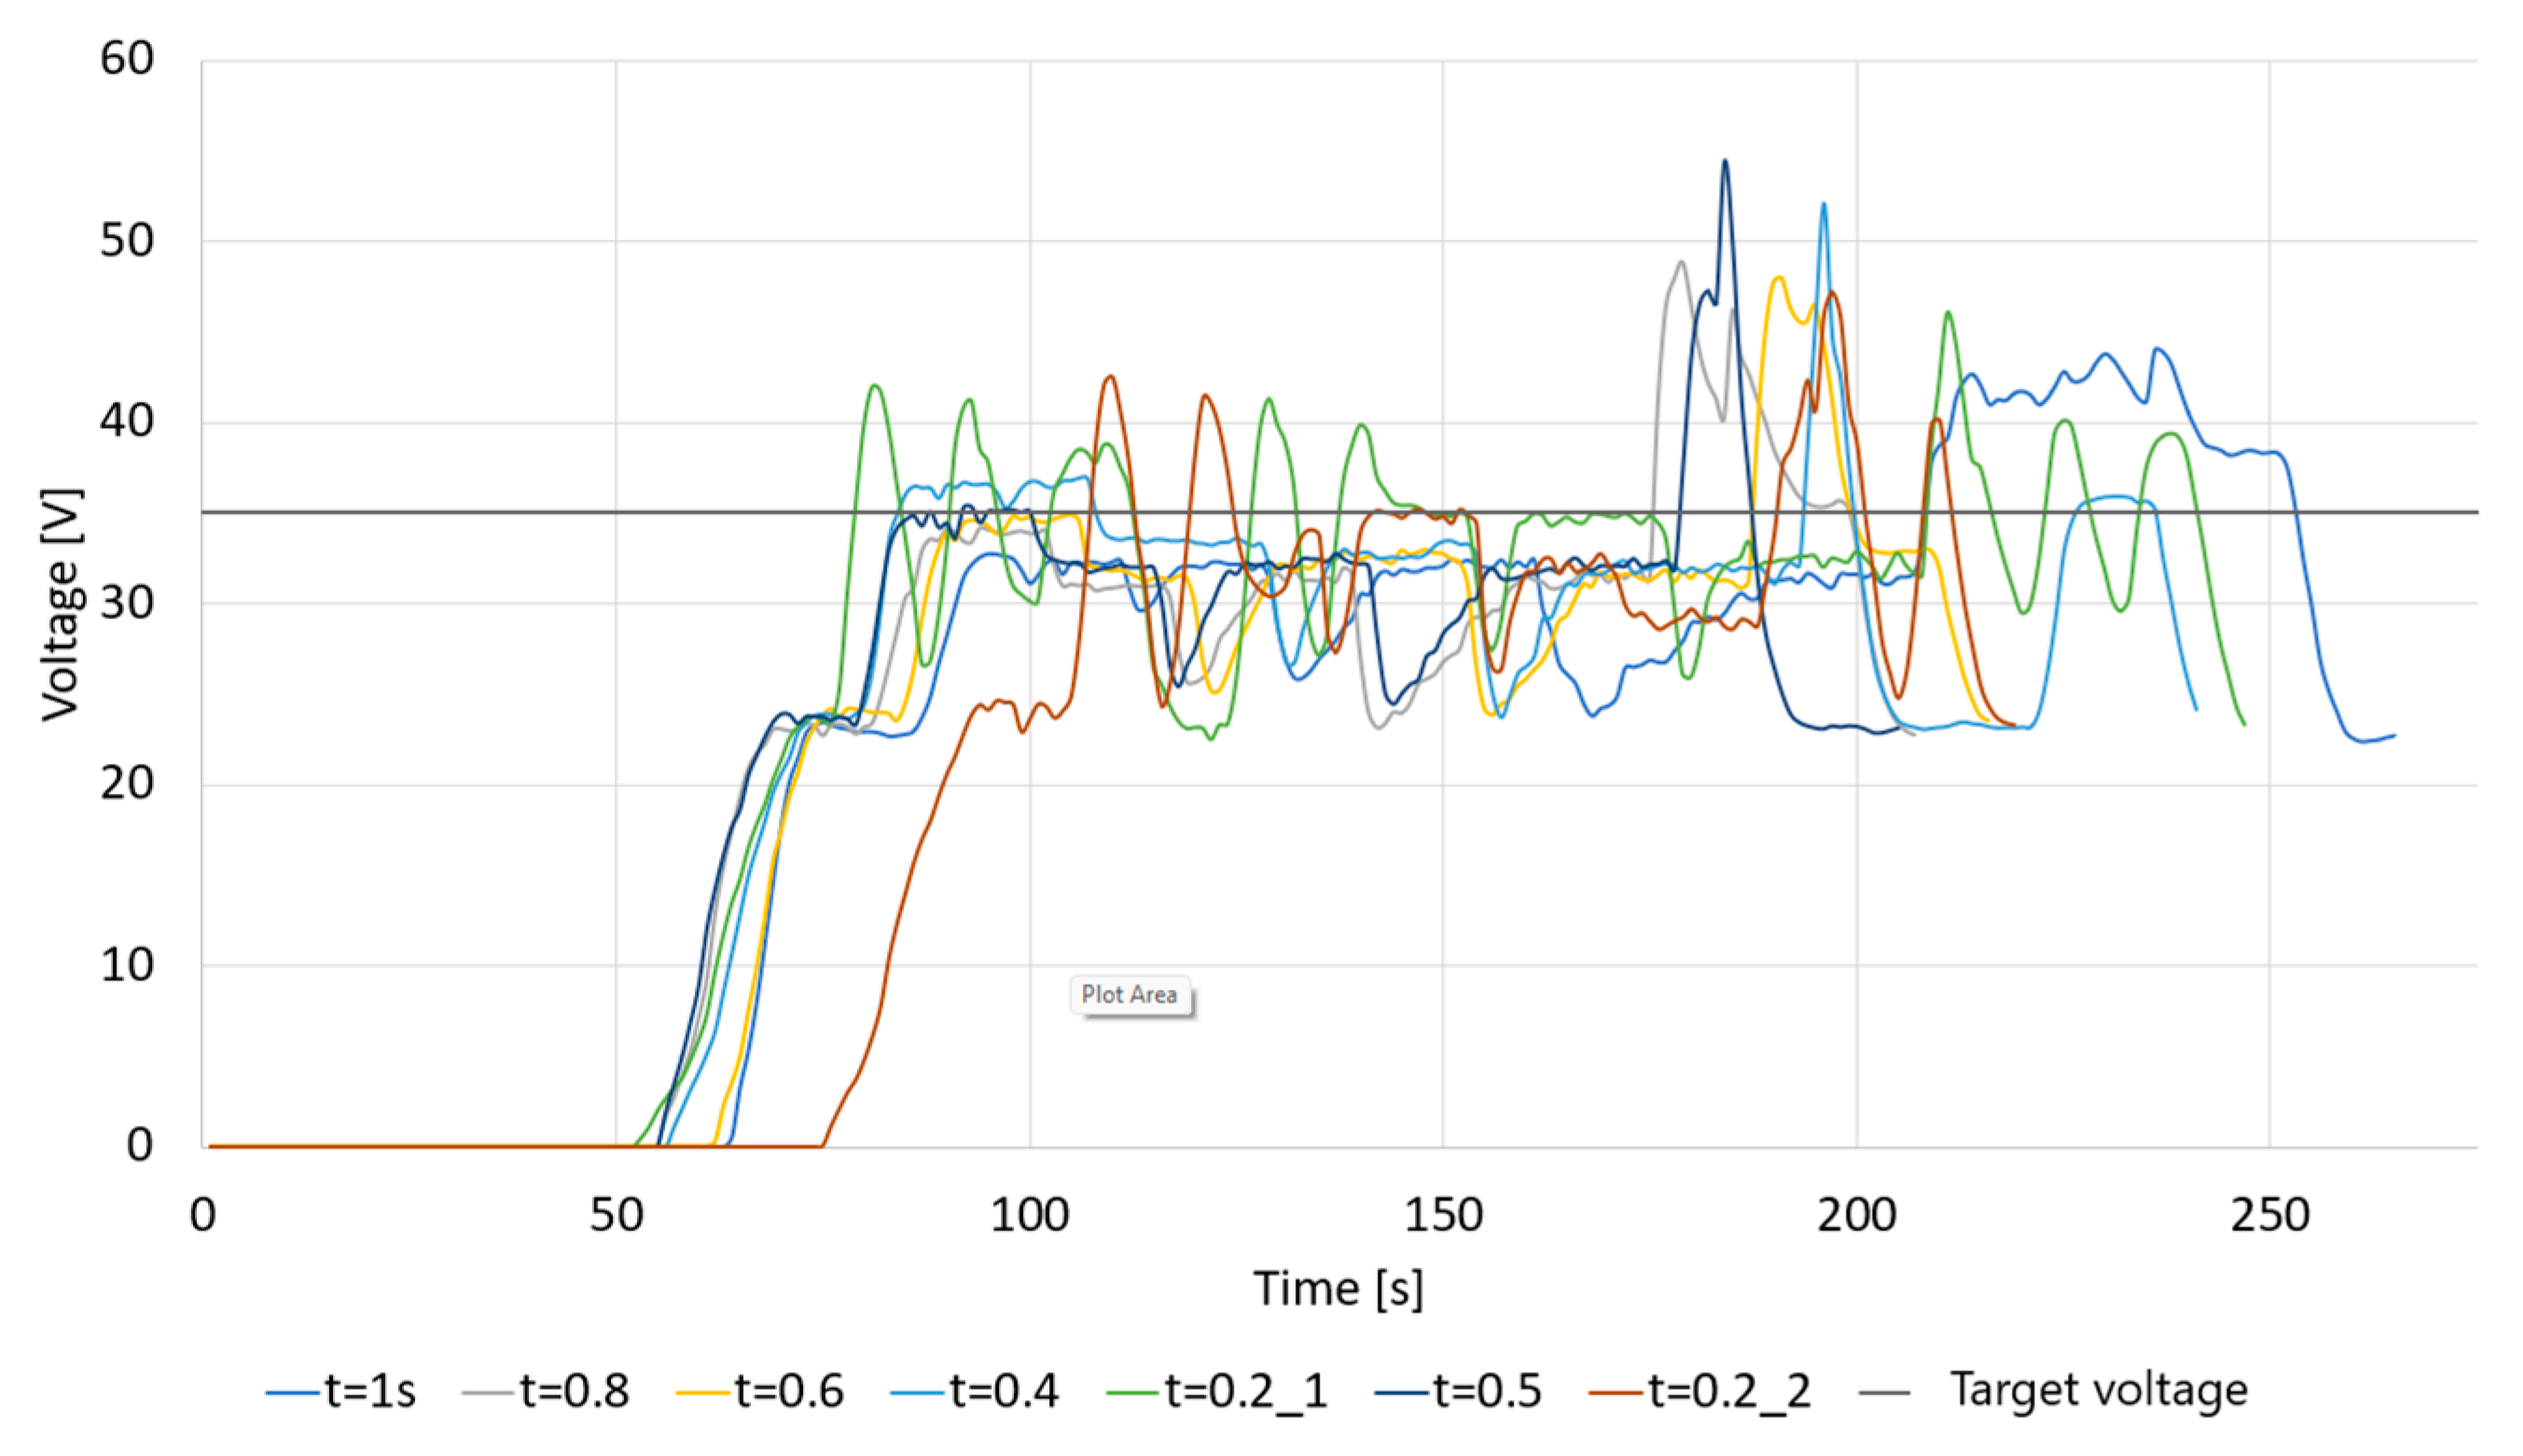
Figure 10 illustrates the variation in the generator’s voltage over time during testing, with the processing interval set to 0.4 s.
During the first stage, the voltage is 0 VDC, indicating the initiation of the program. At point 2, the startup sequence of the micro-turbogenerator is initiated, and the generator begins to be rotated by the shaft of the micro-turboprop engine. The voltage increases to approximately 24 VDC, and then at point 3, the micro-turbogenerator’s self-control function is activated, causing the voltage to rise to 35 VDC. At point 4, the load is increased from 0 to 25% throttle, resulting in a slight decrease in voltage, although it remains above 30 VDC, as the micromotor’s throttle is autonomously adjusted (see
Figure 10). At point 5, the load is further increased from 25 to 50% throttle, increasing the load on the generator and reducing its rotational speed, consequently lowering the voltage. The self-control program automatically increases the micro-turboprop engine’s throttle to restore the voltage to above 30 VDC, targeting 35 VDC. At point 6, the load is increased from 50 to 75% throttle, as depicted in the figure. Point 7 represents an abrupt transition from 75% to 0% throttle, where the generator no longer has any load, causing its rotational speed to increase significantly. At this point, the voltage exceeds 50 VDC, but does not reach the safety threshold of 55 VDC. Point 8 marks the shutdown of the micro-turbogenerator.
Subsequently, the experimental results for all processing time steps used in the testing are presented.
Figure 11 displays the generator’s output voltage over time for all processing time steps, with all curves following the same testing strategy described above.
In the case of a 1 s processing time span, the system’s response was rather slow relative to the variations in the electrical load. As the processing frequency decreased, the system’s response improved significantly, as observed in
Figure 10,
Figure 11,
Figure 12,
Figure 13 and
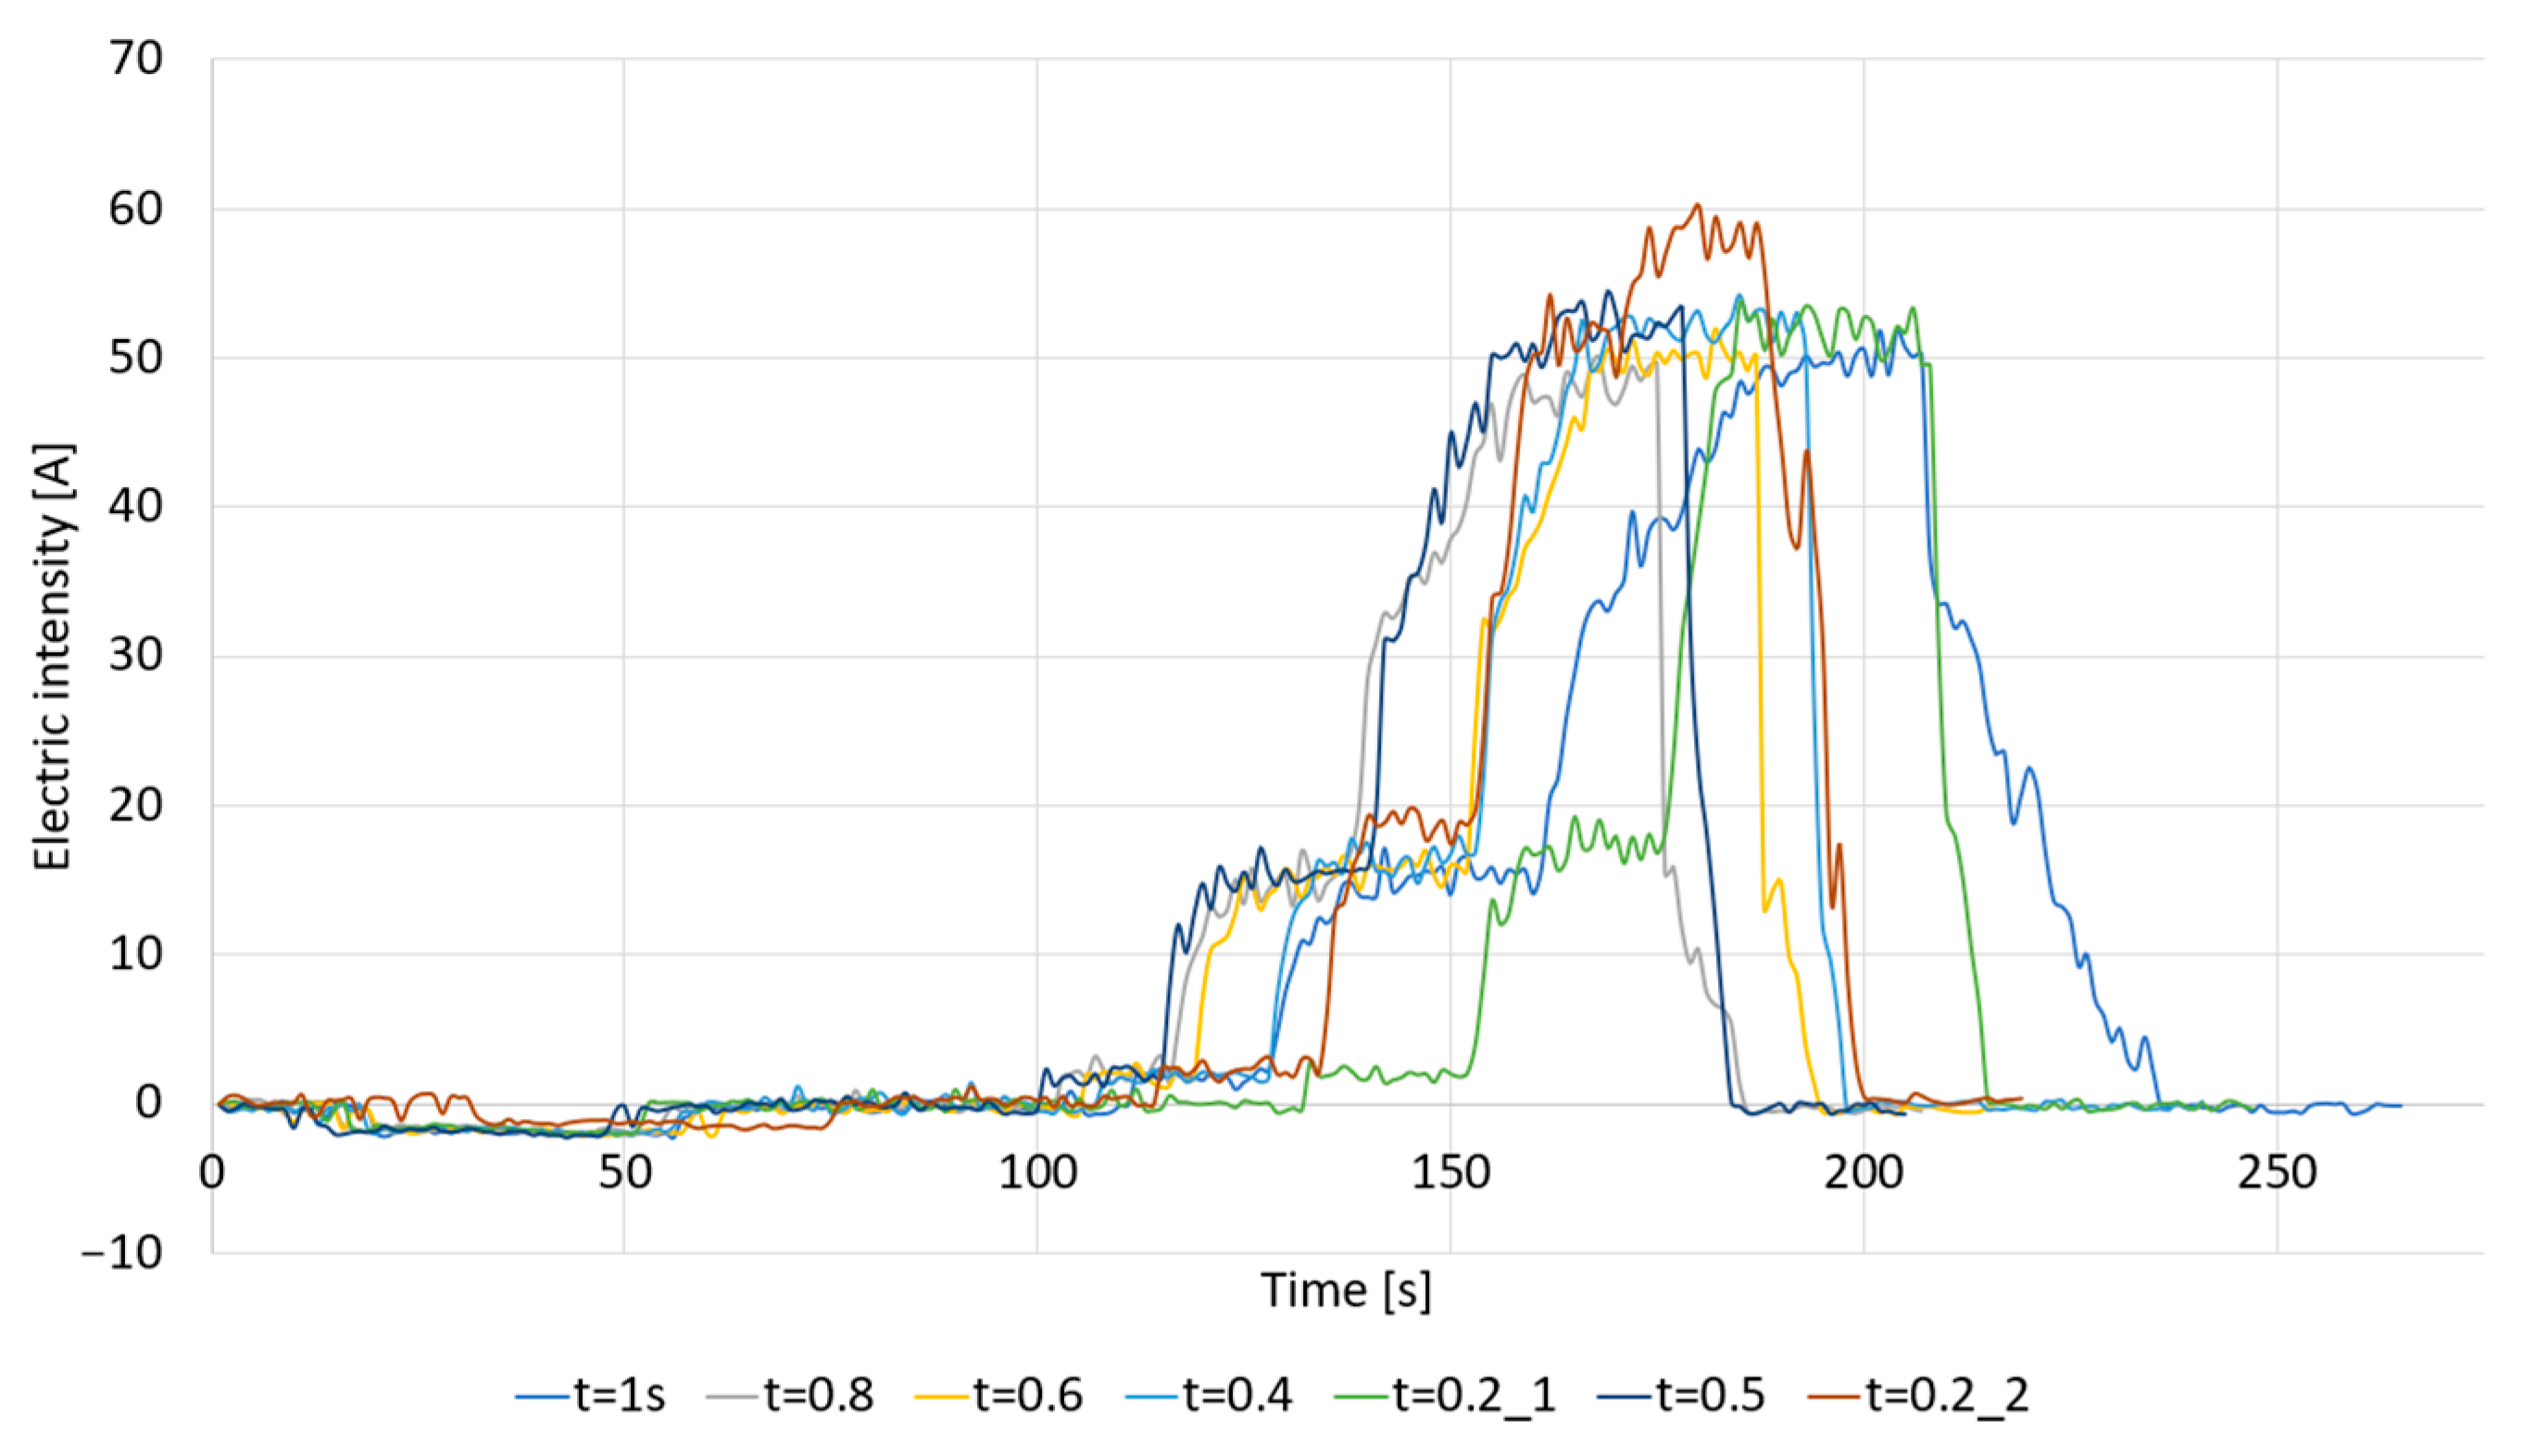
Figure 14. For a processor response time of 0.2 s, oscillations are noticeable during the transition to self-stabilization when the load is at 0% throttle. However, after increasing the electrical load, the automation system’s response was highly effective. It is also evident that the micro-turboprop engine’s throttle was autonomously controlled and increased to approximately 50%, with the electrical power consumption reaching around 2000 W during stage 6. The power did not exceed this level because voltage stabilization at this load was not achieved.
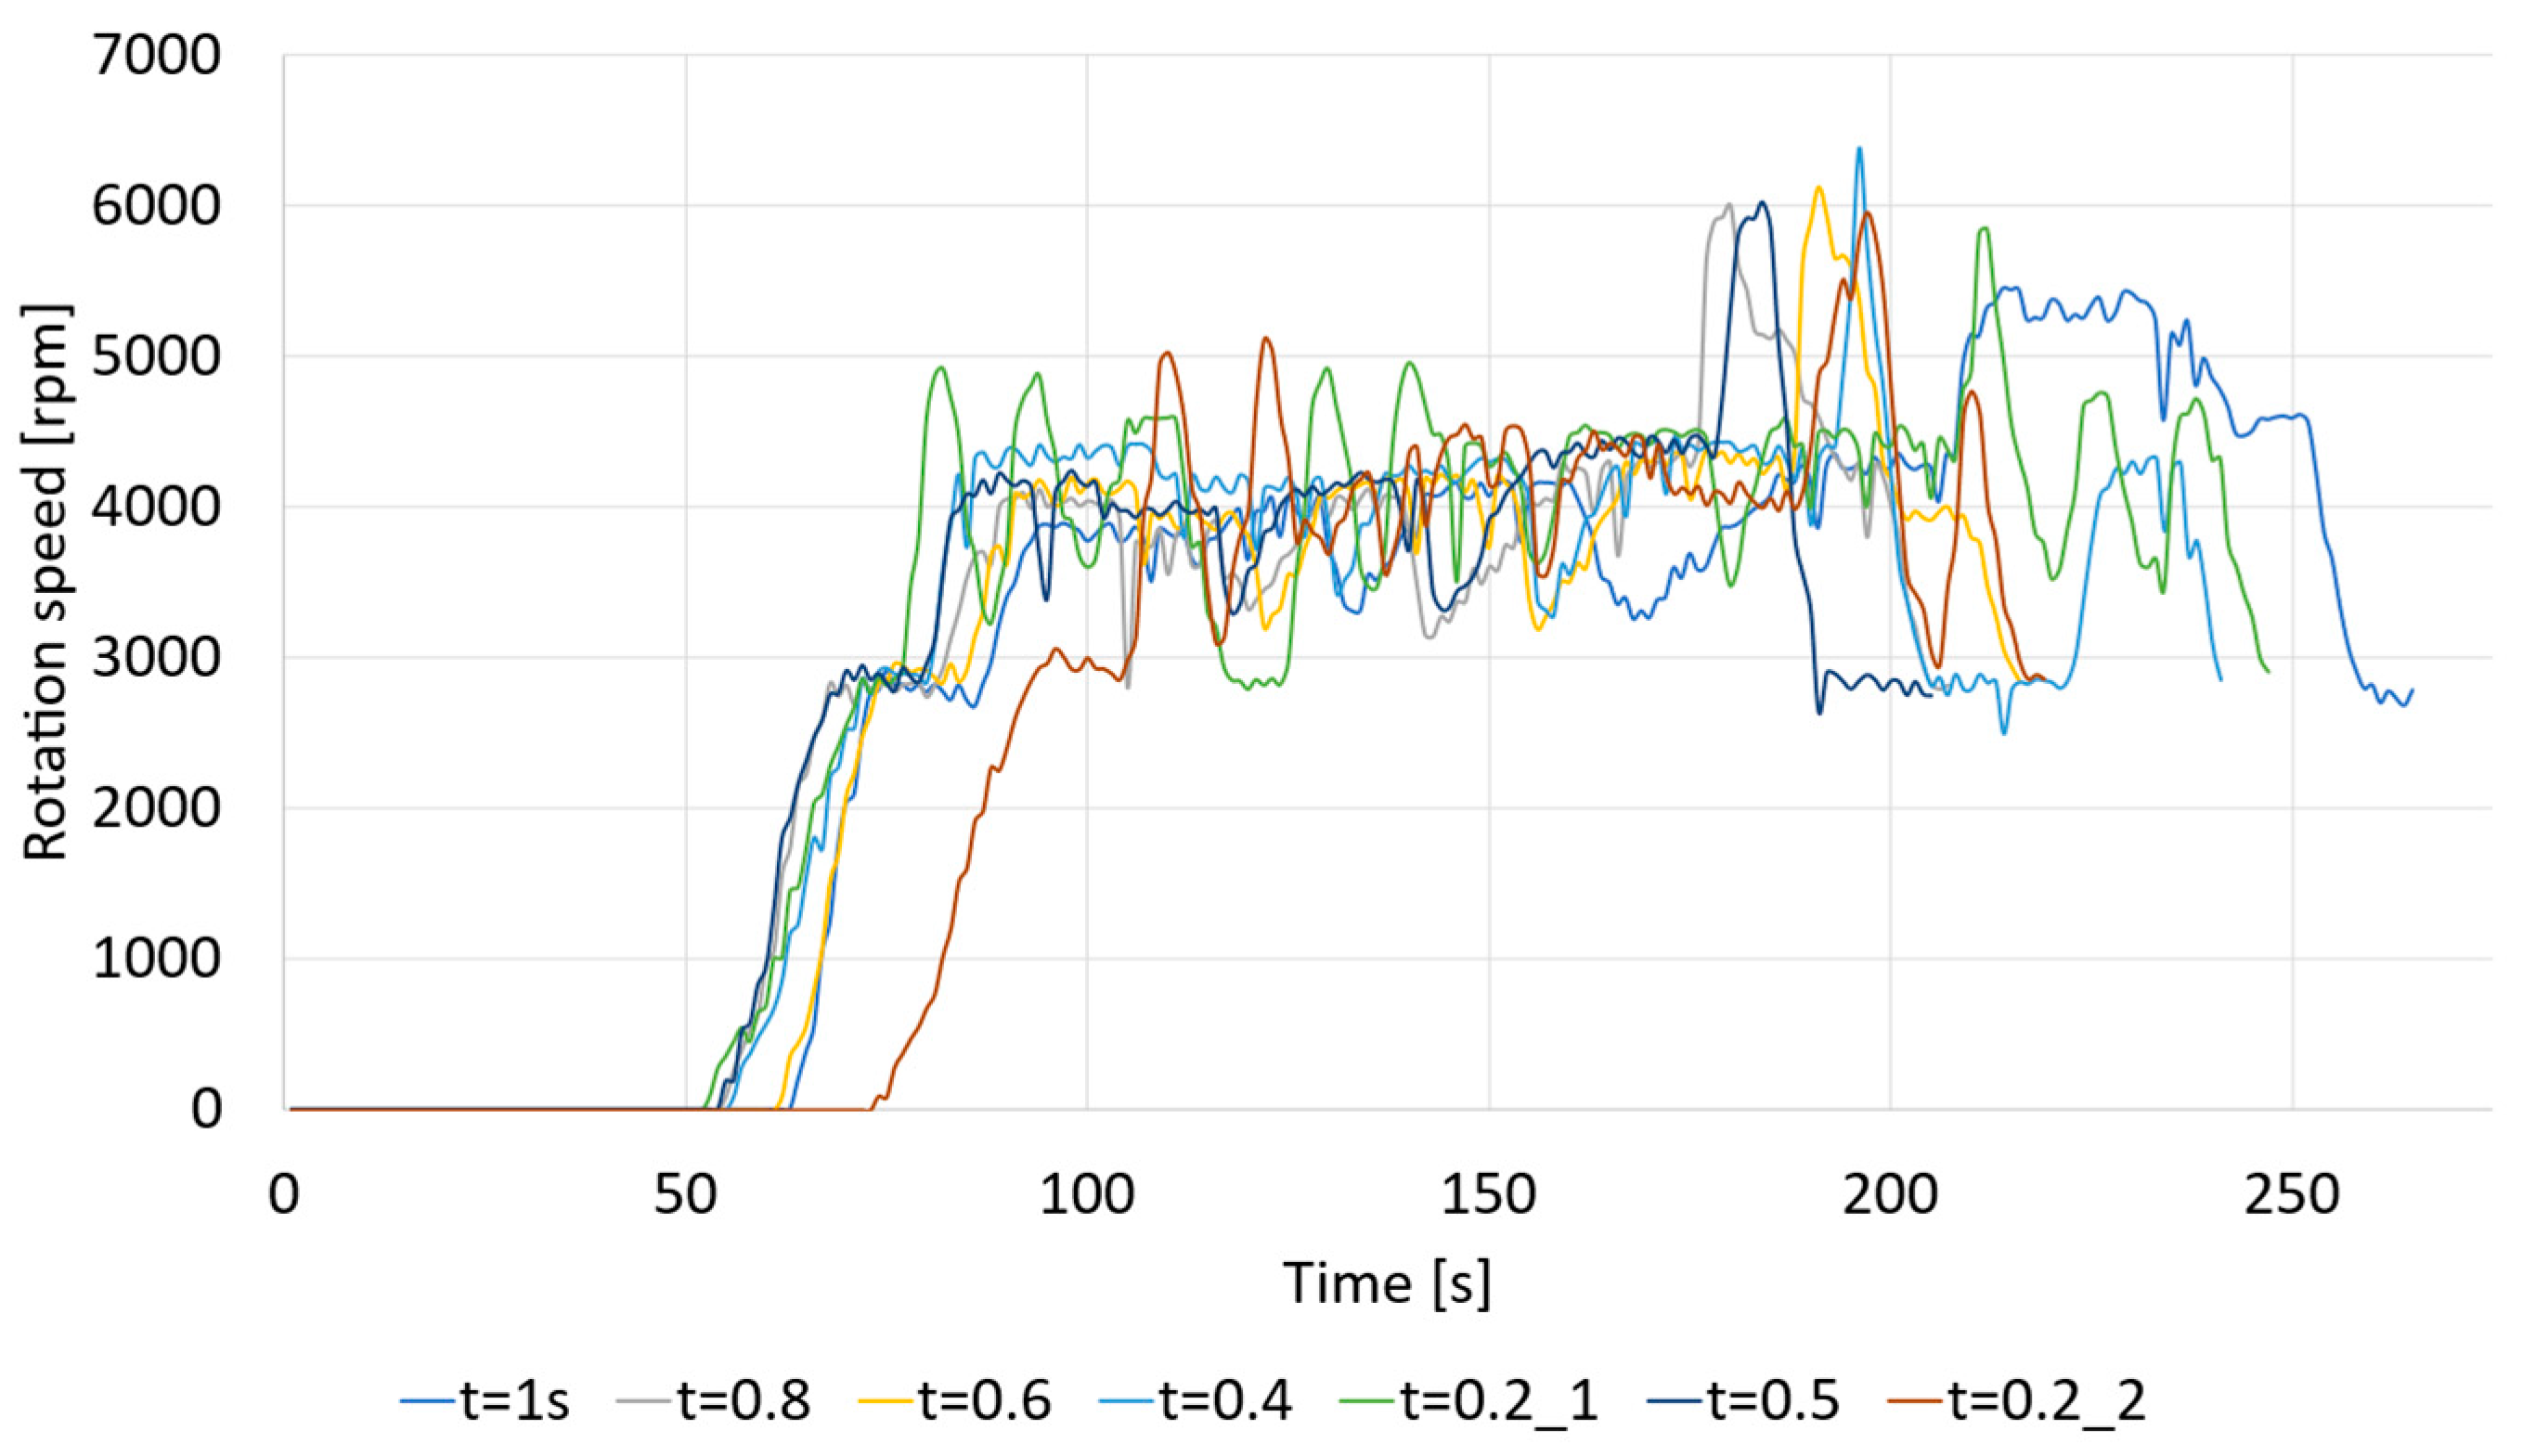
Given the constant voltage control system (targeting 35 VDC as the generator output), the generator’s rotational speed varies depending on the load and its KV (constant velocity) under that specific load. It can be observed that during the peak power phase of the experimental tests, the generator’s rotational speed reached approximately 4200 rpm. The modification of the control law ensured effective management of the micro-turbogenerator.
During the second phase of testing, the stabilizing module utilized for voltage regulation was determined to be unsuitable for effective stabilization. The primary factor contributing to the failure of this solution was the improper tuning of the three stabilizers. Since the process of setting the target voltage values was performed manually, slight discrepancies arose in the stabilization voltages across the three power converters. As the test commenced, the entire electrical load was directed through a single stabilizer, due to these target voltage inconsistencies and the parallel configuration of the system. This imbalance caused the overloaded stabilizer to fail, a process that subsequently triggered the failure of the remaining two stabilizers as a result of the increased load placed on them. The cascading failure occurred because the remaining components were unable to handle the additional power, ultimately compromising the entire stabilization system.
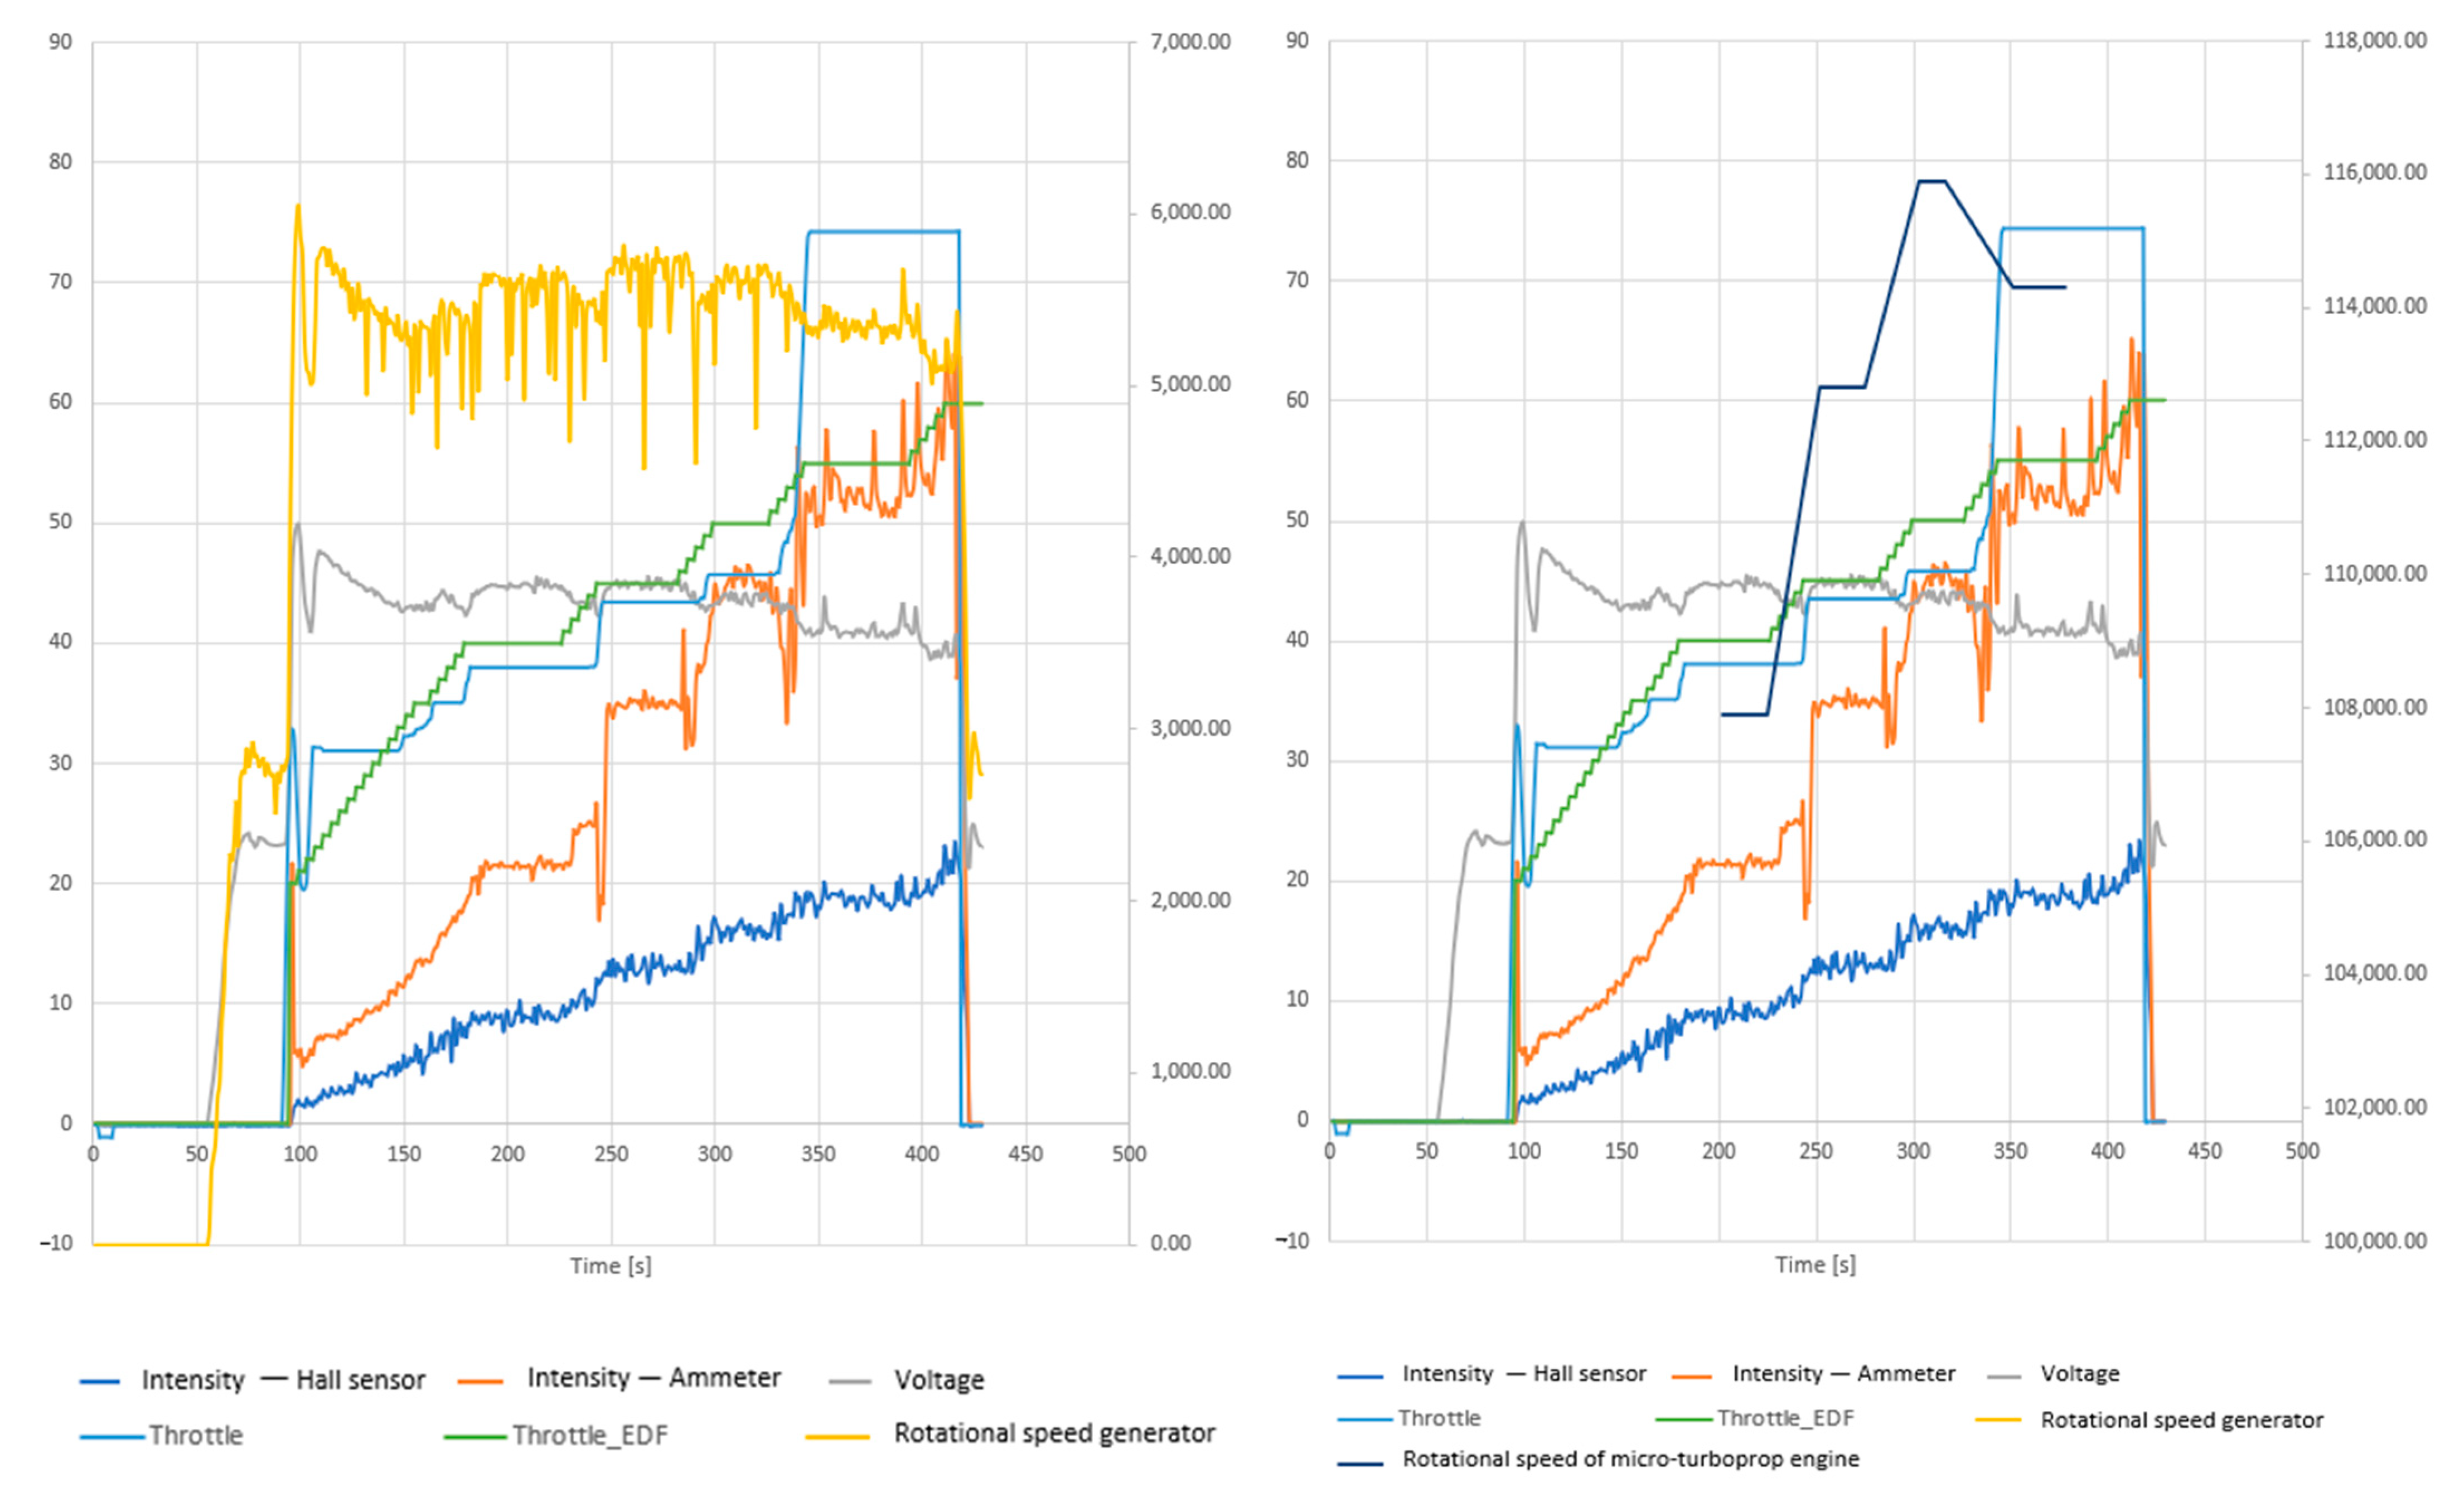
The final testing phase showed the best results. The two graphs below, portrayed in
Figure 15, illustrate the variation trends of key parameters recorded during this micro-turbogenerator testing session. For the sake of clarity and, consequently, the relevance of the graphs, it can be observed that in the right-hand image, the rotational speed of the generator is interchanged with that of the micromotor.
A primary aspect that can be inferred from the analysis of these graphs is the quantitative difference between the current intensity values recorded by the ammeter and those measured by the electrical sensor. This discrepancy arises from the difference in the type of electrical current being measured: while the sensor captures the variation trend of the direct current (DC) entering the electronic speed controller (ESC), the ammeter indicates the alternating current (AC) intensity at the input of the electrical load. Despite this distinction, a global similarity in the overall variation trend can be observed.
Another notable aspect identified in the analysis of the two graphs is the stabilization tendency of parameters such as the current intensity, the voltage, and the micro-turboprop engine’s speed. This stabilization is attributed to the maintenance of a constant throttle level for the EDF (Electric Ducted Fan).
During this test, the throttle of the electrical load was initially set to 40% via the interface. The throttle was then gradually increased to 60%, at which point a sudden increase in the micromotor throttle was observed, accompanied by a voltage drop beyond acceptable limits. The maximum power reached during this test was approximately 950 W.
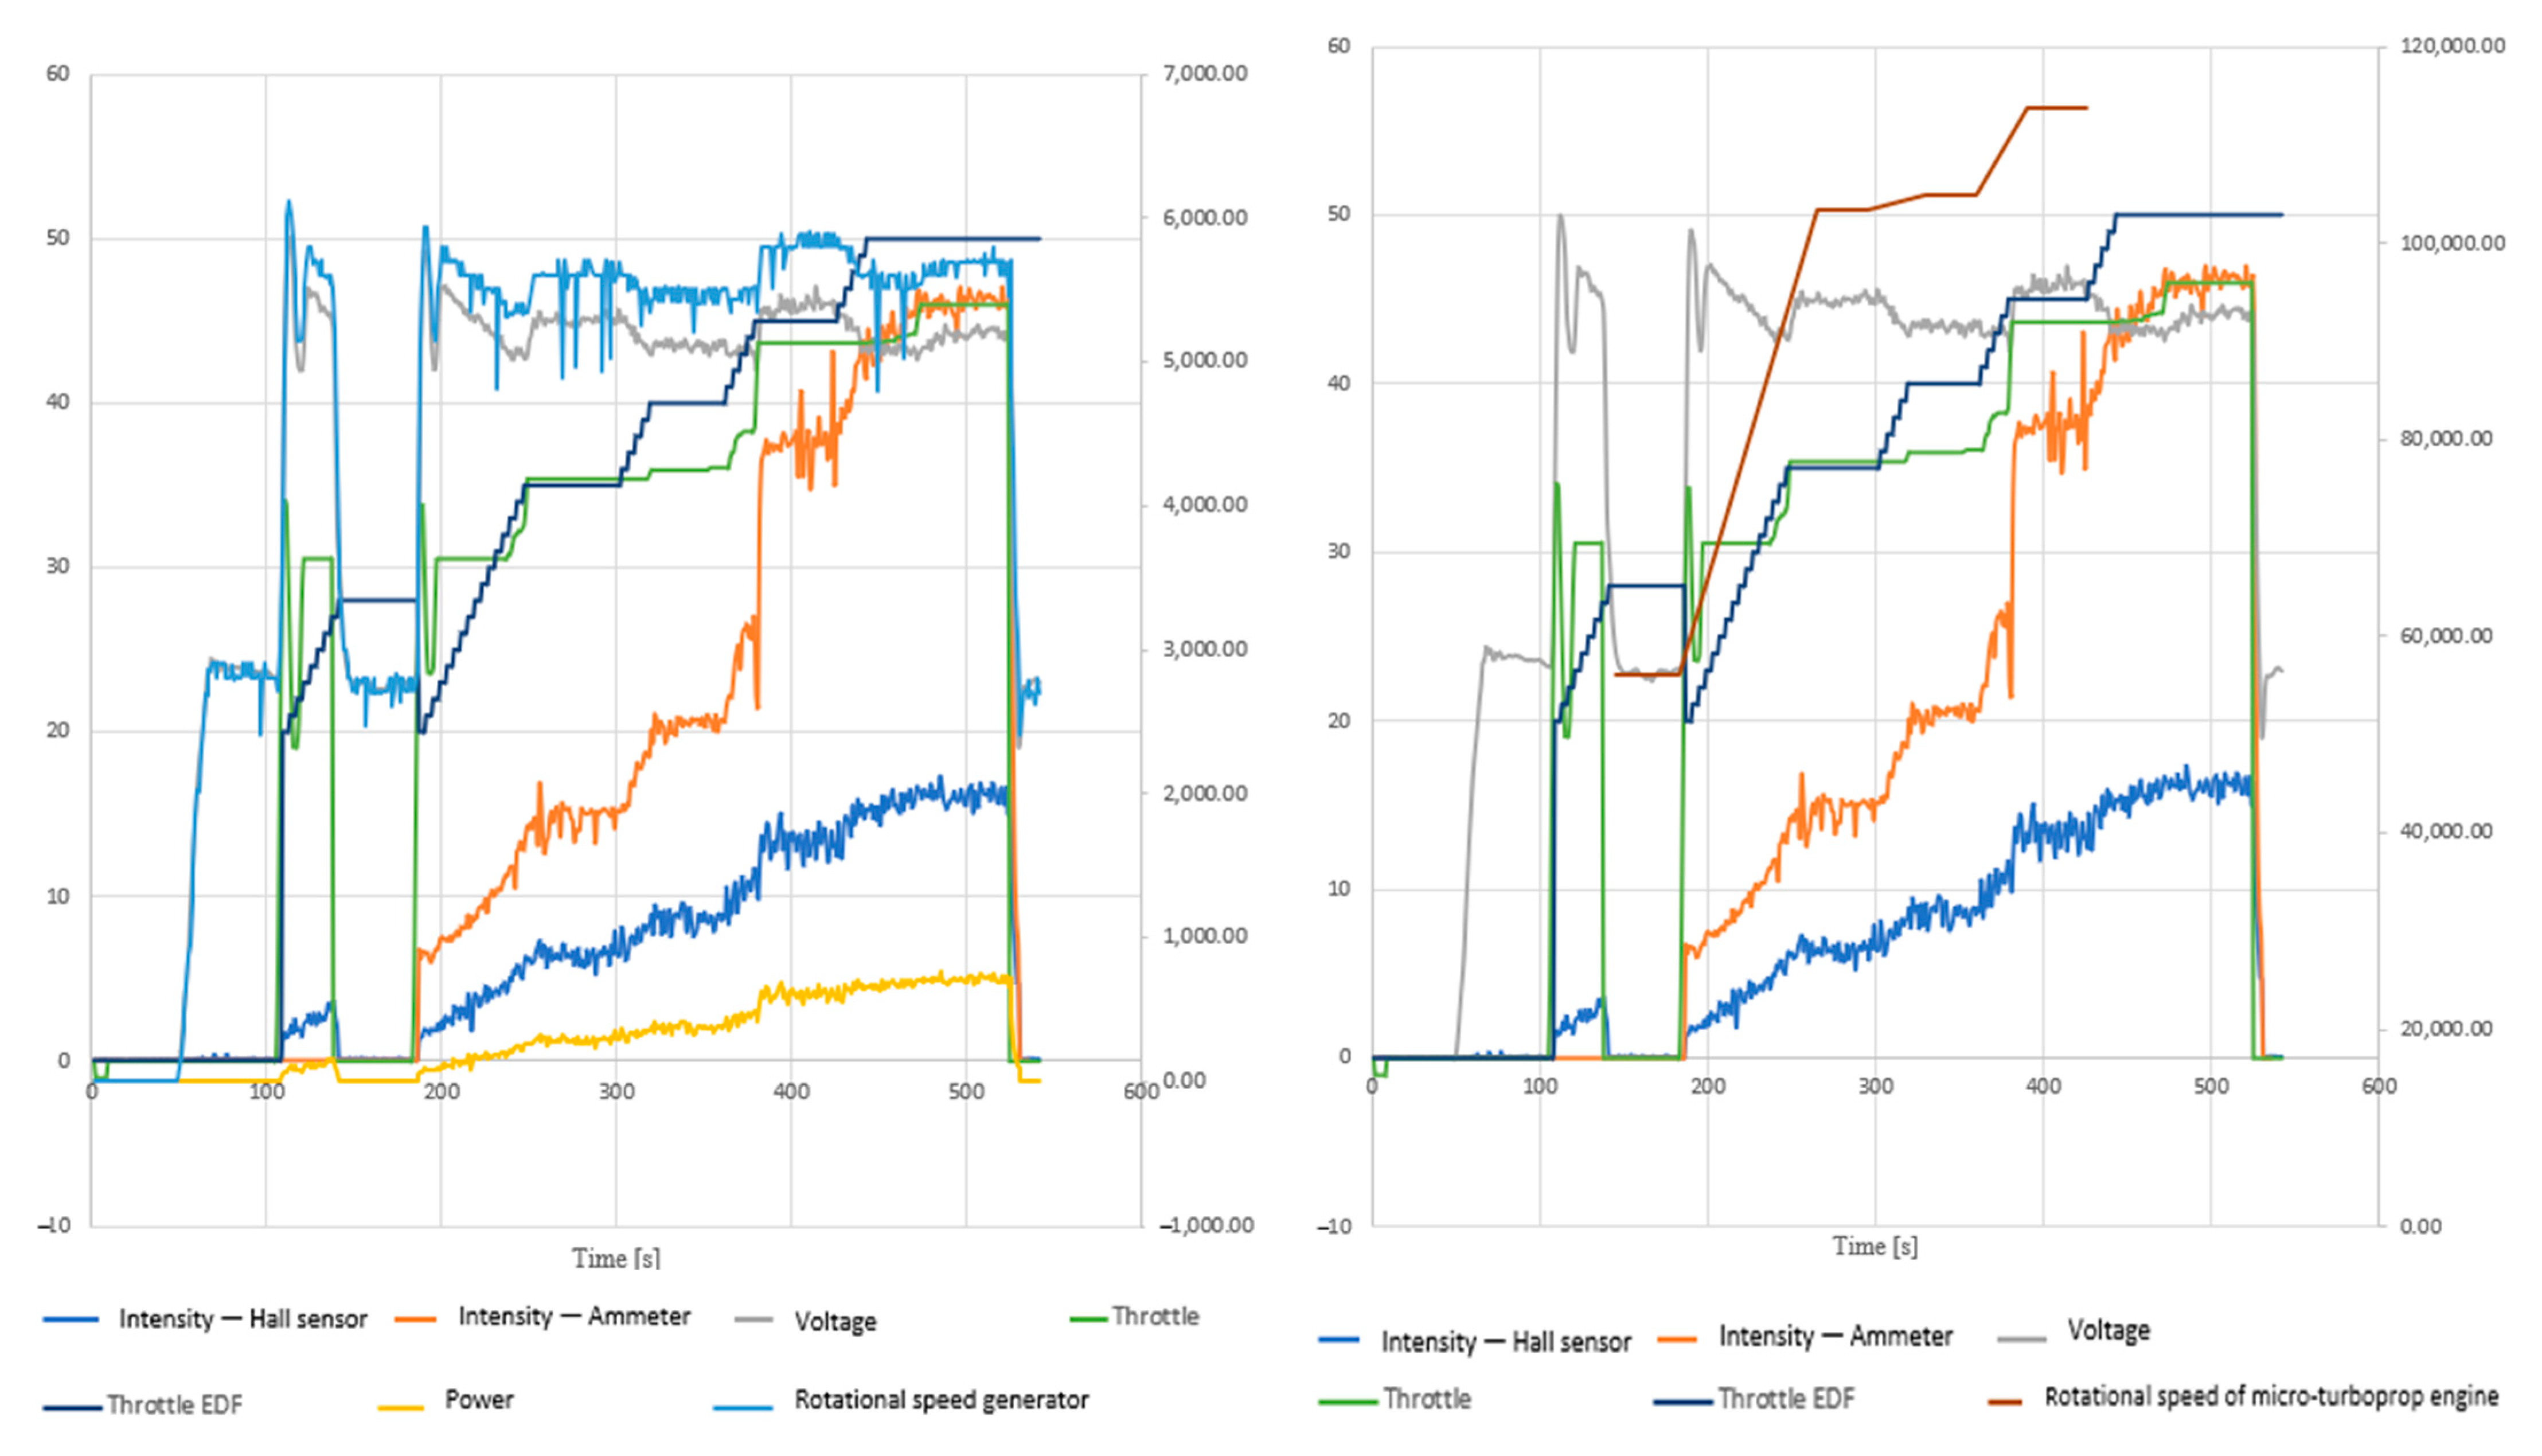
The first experiment was, however, abruptly stopped. To investigate the phenomenon that interrupted the test, the micro-turbogenerator was turned on a second time. The variation in the parameters during the second test is displayed in
Figure 16.
According to the results of this experiment, a variation behavior similar to that observed in the first test was identified. However, upon reaching a 55% throttle level for the consumer, the voltage exceeded the safety limits set within the control program, reaching a value of 50 V. It was not possible to achieve a 60% consumer throttle, the value that was attained during the first test. The cause of this phenomenon may be attributed to the operating temperature of the generator, as the two experiments were conducted successively, without comprehensive cooling of the electrical components. The maximum electrical power achieved was 1.1 kW, which is higher than the value obtained in the first experiment. Following the execution of multiple tests, it was observed that the variation trends were approximately similar.
The maximum power achieved across all conducted tests (including those which were displayed in
Figure 17 and
Figure 18) was approximately 1.1 kW. To access higher power values, it is planned to replace electric generator with a more efficient one, an improvement that will be addressed in a future research article.


 ,
, 