Article

Improved YOLO11 Algorithm for Insulator Defect Detection in Power Distribution Lines

1
The Electric Power Research Institute of State Grid Hebei Electric Power Co., Ltd., Shijiazhuang 050021, China
2
Hebei Key Laboratory of Electric Machinery Health Maintenance & Failure Prevention, North China Electric Power University, Baoding 071003, China
3
Hebei Engineering Research Center for Advanced Manufacturing & Intelligent Operation and Maintenance of Electric Power Machinery, North China Electric Power University, Baoding 071003, China
4
State Grid Hebei Electric Power Co., Ltd., Shijiazhuang 050021, China
*
Author to whom correspondence should be addressed.
Electronics 2025, 14(6), 1201; https://doi.org/10.3390/electronics14061201
Submission received: 21 February 2025 / Revised: 16 March 2025 / Accepted: 17 March 2025 / Published: 19 March 2025
(This article belongs to the Special Issue Deep Learning for Power Transmission and Distribution)

Abstract

:
Distribution line insulators play a key role in electrical insulation and supporting lines in distribution lines. Insulator defects due to overvoltage, thermal stress, and environmental pollution may trigger power transmission instability and line collapse, thus threatening the safe operation of distribution networks. However, distribution line insulators often present detection challenges due to their compact dimensions, diverse flaw types, and frequent installation in populated areas with visually cluttered environments. The combination of these factors, including small defect sizes, varying failure patterns, and complex background interference, in both urban and rural settings, creates significant difficulties for precise defect identification in these critical components. In response to these challenges, this paper proposes a defect recognition algorithm for distribution line insulators based on the improved YOLO11 model. Firstly, the algorithm combines the detection head of the original model with the Adaptively Spatial Feature Fusion (ASFF) module to effectively fuse defect features at different resolution levels and improve the model’s ability to recognize multi-scale defect features. Secondly, a Bidirectional Feature Pyramid Network (BiFPN) replaces the FPN + PAN structure of the original model to achieve a more effective transfer of contextual information in order to facilitate the model’s efficiency in performing defect feature fusion, and the Convolutional Block Attention Module (CBAM) Attention mechanism is embedded in the BiFPN output so that the model is able to give priority attention to defective features on insulators in complex recognition environments. Finally, the ShuffleNetV2 module is used to reduce the parameters of the improved model by replacing the large-parameter C3k2 module at the end of the backbone network for easy deployment on lightweight and small devices. The experimental results show that the improved model performs well in the distribution line insulator defect detection task, with an accuracy precision (AP) and mean accuracy precision (mAP) of 97.0% and 98.1%, respectively, which are 1.4% and 0.7% higher than the original YOLO11 model.

1. Introduction

As a core component of the power supply architecture, the main function of the distribution system is to efficiently distribute the current in the transmission lines to end-users to meet their diverse power needs. In the distribution system, distribution line insulators play a key role in electrical insulation and supporting the lines, ensuring the safe transmission of electricity and being an indispensable component of the distribution network system [1,2]. However, during power supply, insulators may be damaged and corroded due to overvoltage, thermal stress, environmental corrosion, pollution, and improper maintenance, affecting their performance [3,4], and even leading to line collapse and unstable power transmission, posing critical operational risks to the power distribution networks. To address the safety hazards caused by insulator defects in a timely manner, grid line inspection robots have been developed and utilized in the grid system [5,6].
Current distribution line insulator defect detection primarily depends on manual inspection of robotic-captured imagery, a process prone to inefficiency and oversight [7,8]. Advancements in imaging technologies have enabled automated solutions, with early-stage research employing traditional machine learning methods (morphological/geometric feature analysis) for defect identification [9,10,11]. However, these approaches exhibit constrained effectiveness in complex operational scenarios. The emergence of deep learning-powered computer vision frameworks has revolutionized surface anomaly detection, offering enhanced adaptability to diverse defect patterns and environmental conditions [12,13].
For example, Kanika Bhalla et al. [14] developed a defect segmentation approach for TFT-LCD panels using Singular Value Decomposition (SVD) and Kernelized Neutrosophic Entropy. The integration of fuzzy membership functions with SVD enables adaptive image contrast enhancement, effectively mitigating uneven lighting and color distortions. Gaussian kernel functions and nonlinear neutrosophic entropy thresholding are further incorporated to improve defect detection accuracy in complex backgrounds. However, the reliance on manually designed fuzzy and kernel functions in FSVD and GKNE restricts their generalization capability for diverse defect patterns. Pin Ning et al. [15] enhanced the Faster-RCNN architecture by incorporating a Feature Pyramid Network (FPN), achieving improved detection performance. However, the increased computational overhead resulted in slower processing rates, posing challenges in meeting the real-time demands of high-frequency power line inspection tasks. Qinggang Wu et al. [16] introduced a texture extraction technique for insulators utilizing localized operators within the Beltrami framework, enhancing the detection of uneven surface textures. However, the dynamic adjustment of its weighted parameters remains suboptimal, requiring further refinement. Ruihai Li et al. [17] enhanced the SSD framework through the integration of a multi-branch architecture and dilated convolution, boosting detection precision in simple backgrounds while compromising performance in complex scenarios. MD. Faiyaz Ahmed et al. [18] used deep learning to detect and identify breakdown defects in transmission line insulators, but the model size was too large and more suitable for large equipment for transmission line inspection, making it difficult to deploy on lightweight and small equipment for distribution line inspection. Tomaszewski et al. [19] proposed a framework utilizing color intensity profile analysis and ensemble learning for insulator disk fault detection. The method identifies damaged disks through spectral analysis of color intensity profiles extracted from insulator images. However, its reliance on color features alone—without integrating deep learning-based multi-modal fusion—limits its ability to capture critical discriminative features.
Within the domain of object detection frameworks, YOLO-series models exhibit high efficacy in identifying insulator defects across diverse environments, as evidenced by studies [20,21,22]. For example, Chuanyang Liu et al. [23] proposed an enhanced YOLO-based framework for insulator defect detection in aerial imagery. By integrating Cross-Stage Partial Dense (CSPD) blocks to refine feature propagation and reuse, the method achieves superior accuracy. However, its scope is restricted to missing-cap faults in glass insulators, overlooking critical defects such as cracks, contamination, or mechanical degradation in distribution line insulators, thereby limiting practical applicability. Gujing Han et al. [24] proposed an improved YOLOv5-based insulator fracture detection method, which enhances feature discriminability in complex backgrounds through the ECA-Net attention mechanism, preserves small target features using the bidirectional feature pyramid Bi-FPN, and optimizes overlapping target detection with the Soft-NMS algorithm. In this method, the ECA-Net employs a local cross-channel interaction strategy, which reduces computational costs but may neglect long-range channel dependencies. Jun SU et al. [25] developed a lightweight insulator defect detection framework by integrating the Triplet Attention module into YOLOv8n, aiming to mitigate challenges including complex background interference, small-target under detection, and excessive computational complexity. However, the Slim-neck structure in their design directly employs the existing GSConv module without incorporating a spatial-channel decoupled convolution mechanism tailored to the slender morphology of insulators, potentially leading to localized feature loss. In addition, Chengyin Ru et al. [26] proposed an enhanced lightweight framework, ECA-YOLOX-Tiny, for detecting self-explosion defects in UAV-captured insulator images. By integrating the Efficient Channel Attention (ECA) module into the YOLOX-Tiny backbone, the method improves feature discriminability for small defect regions. However, although the ECA reduces parameter overhead, its lack of spatial attention integration results in suboptimal feature focus performance for densely occluded insulators.
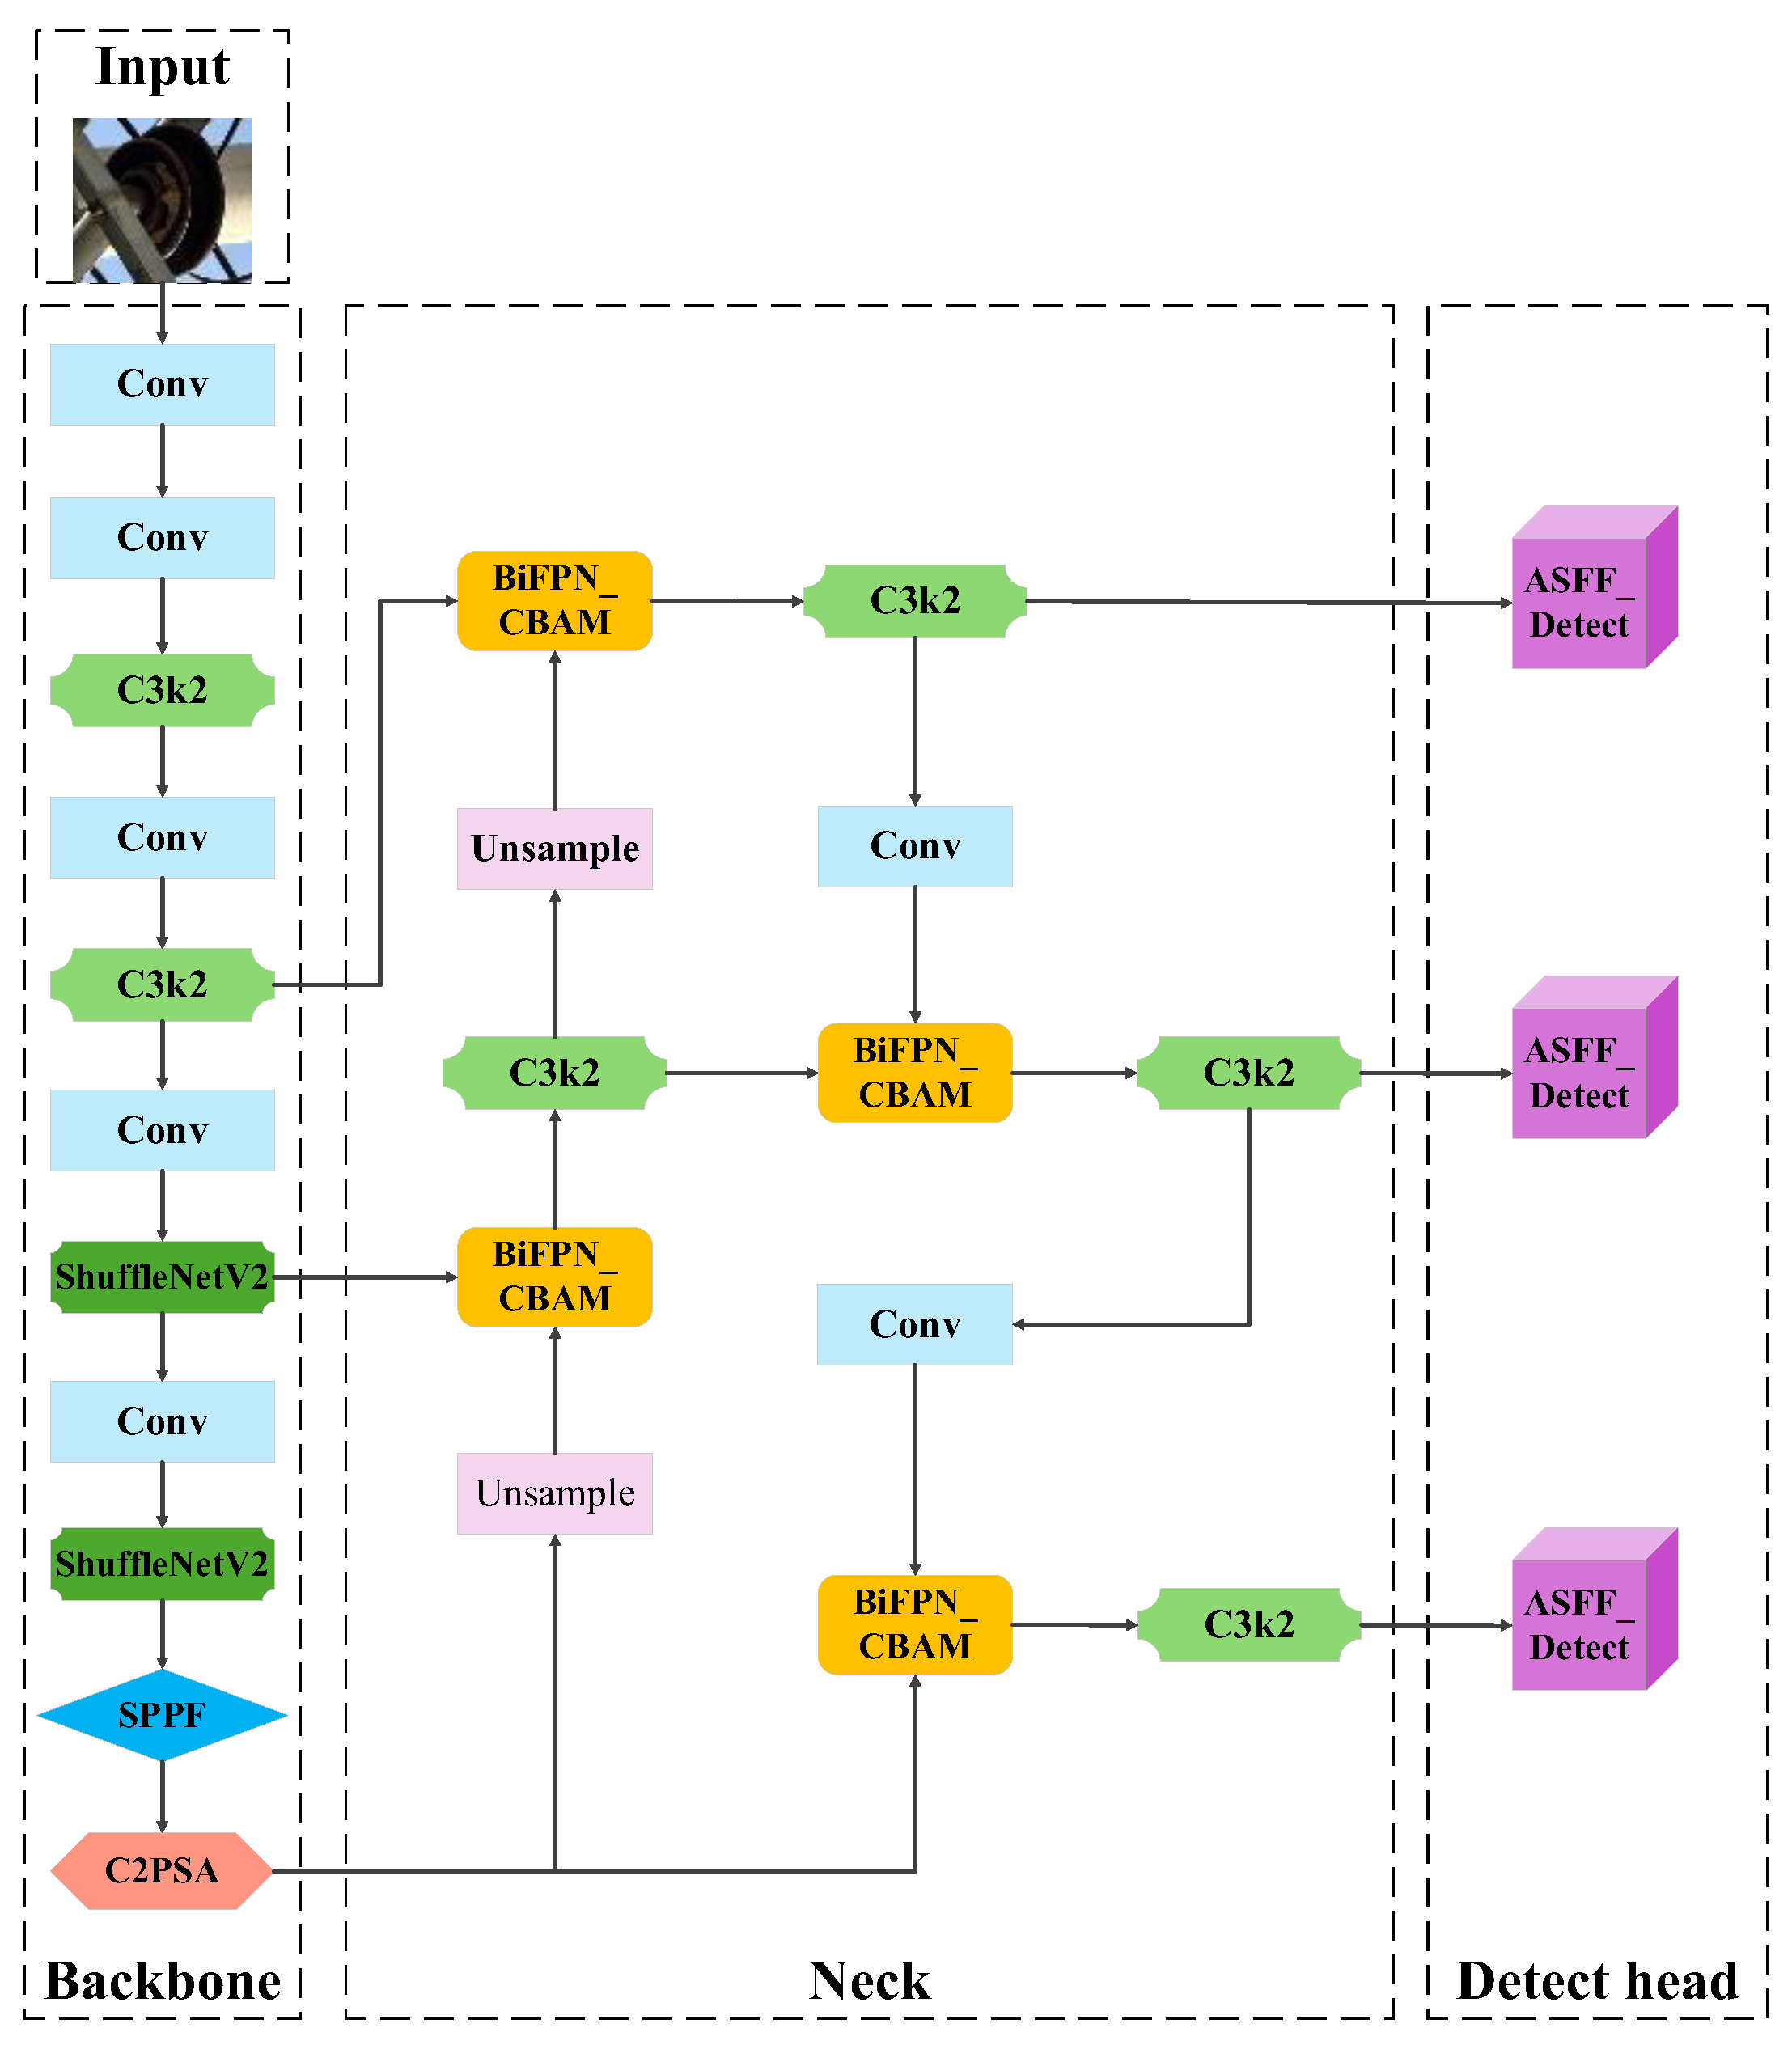
Building upon prior research in insulator defect detection, this study proposes an enhanced YOLOv11-based algorithm for multi-type distribution line insulators in complex environments to improve detection accuracy. Specifically, the original YOLOv11 architecture is optimized through structural enhancements to its backbone, neck, and detection head modules. The main improvements are as follows:
(1)
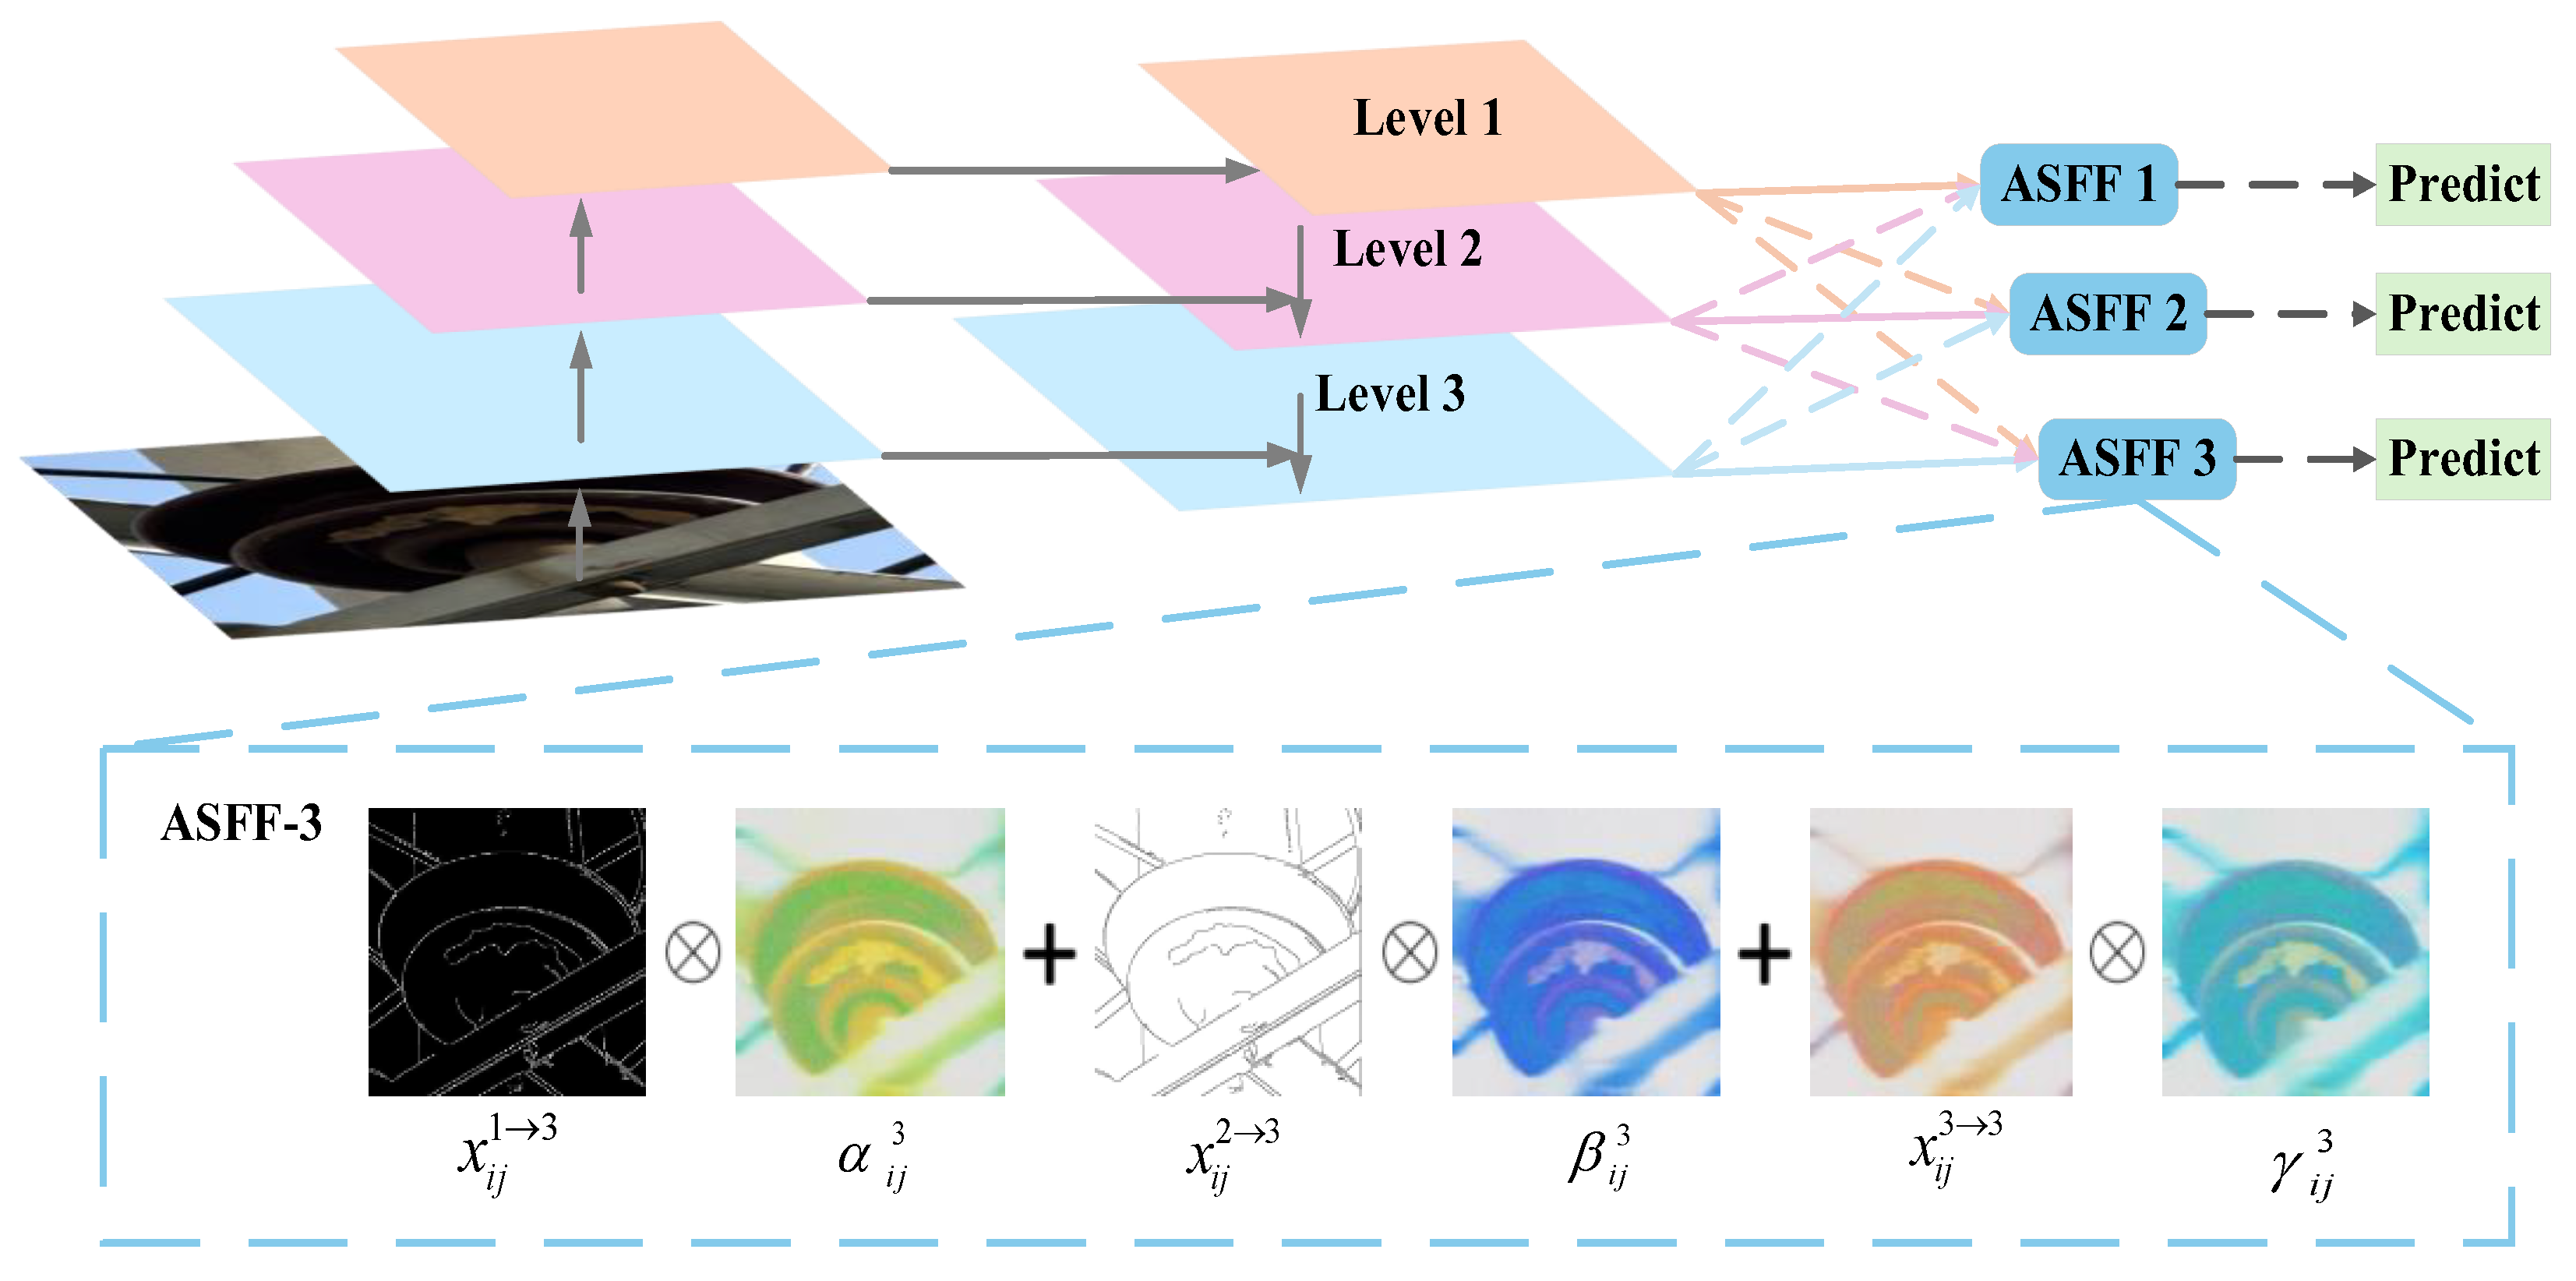
In order to solve the problem of scale inconsistency when identifying defect features due to different defect forms, this paper embeds the ASFF (Adaptively Spatial Feature Fusion) adaptive spatial feature fusion module in the original detection head module. This strengthens the feature fusion capacity of the detection head across multi-resolution feature hierarchies, thereby boosting multi-scale target detection performance while enhancing the algorithm’s accuracy and operational robustness.
(2)
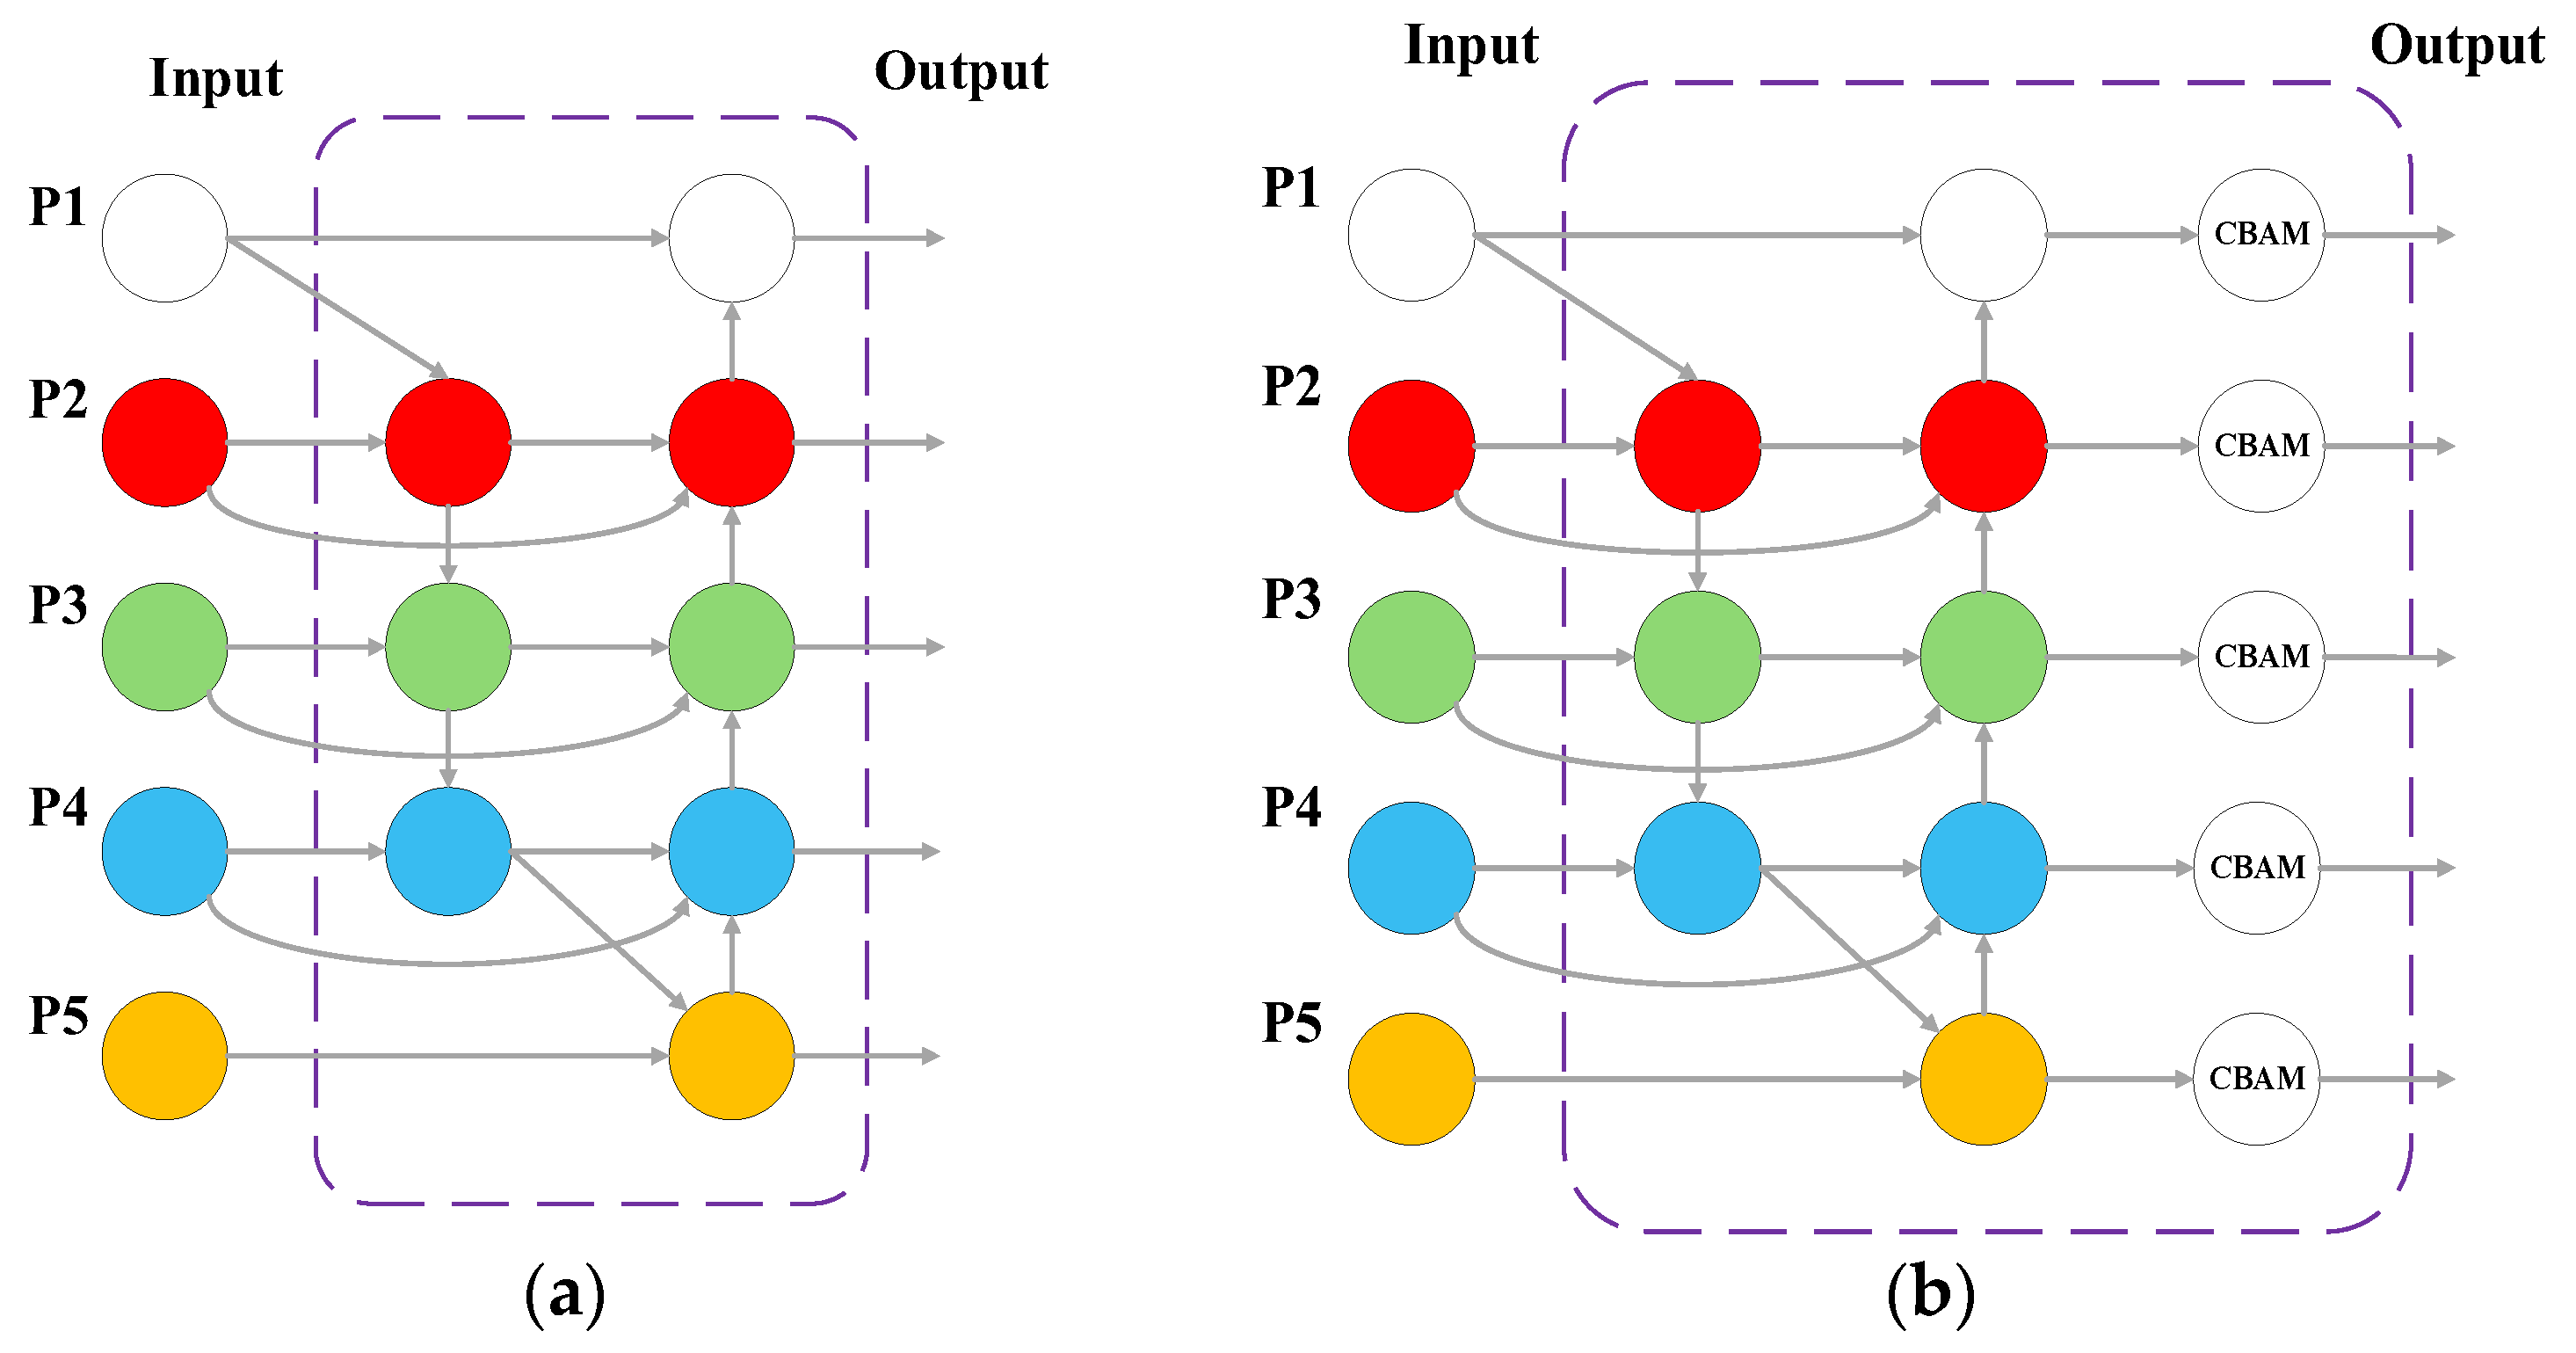
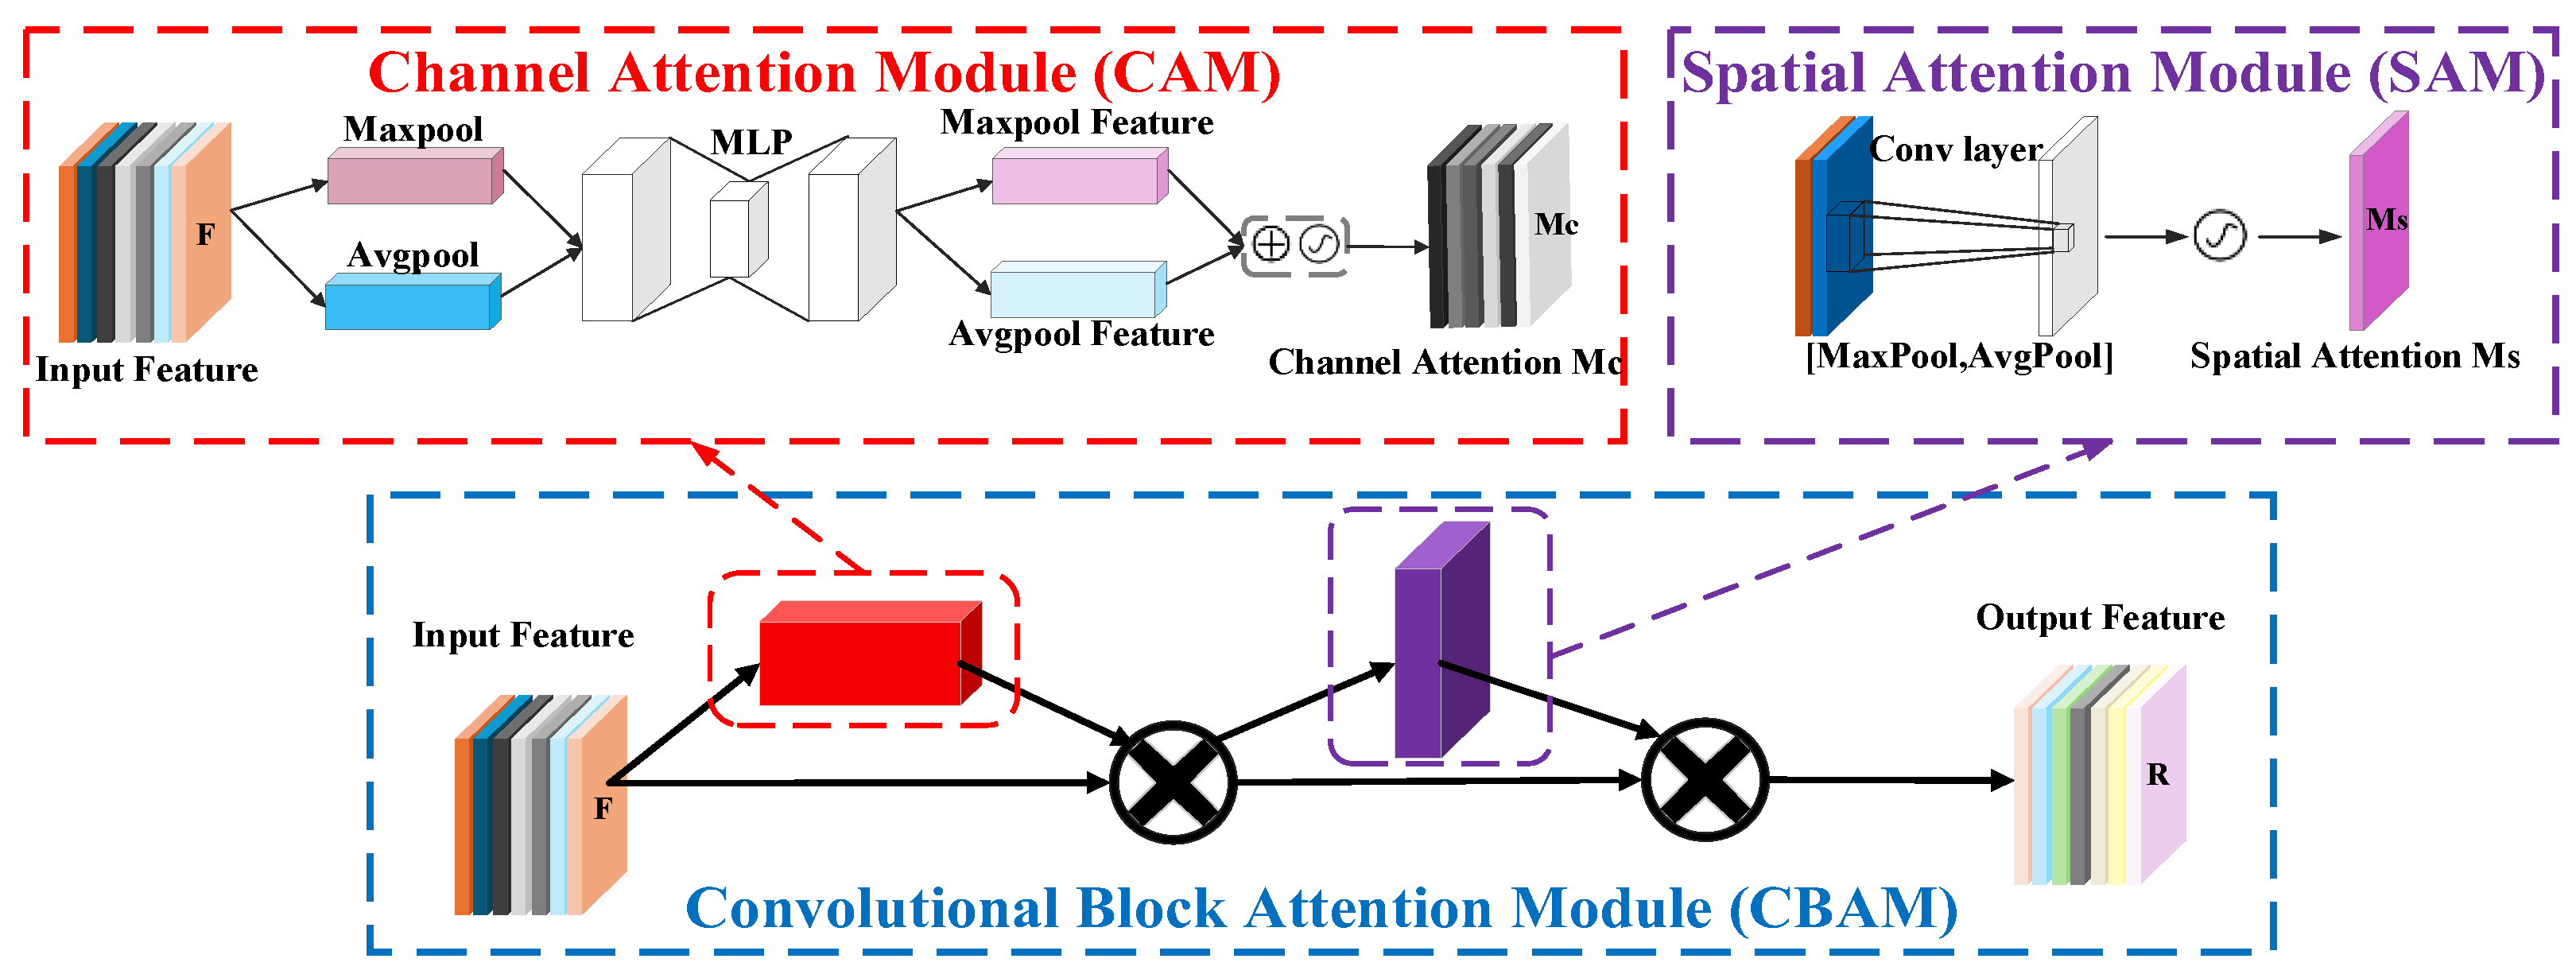
To enhance contextual information flow and enable weighted multi-scale defective feature fusion, this study replaces the original FPN + PAN neck structure with a Bidirectional Feature Pyramid Network (BiFPN), thereby optimizing cross-scale feature fusion efficiency in the neck module. Meanwhile, to prioritize defective features on insulators within complex recognition environments, the Convolutional Block Attention Module (CBAM) is integrated into the BiFPN output layer. This integration mitigates background interference during urban–rural distribution line inspections while enhancing feature representation learning, thereby improving detection precision.
(3)
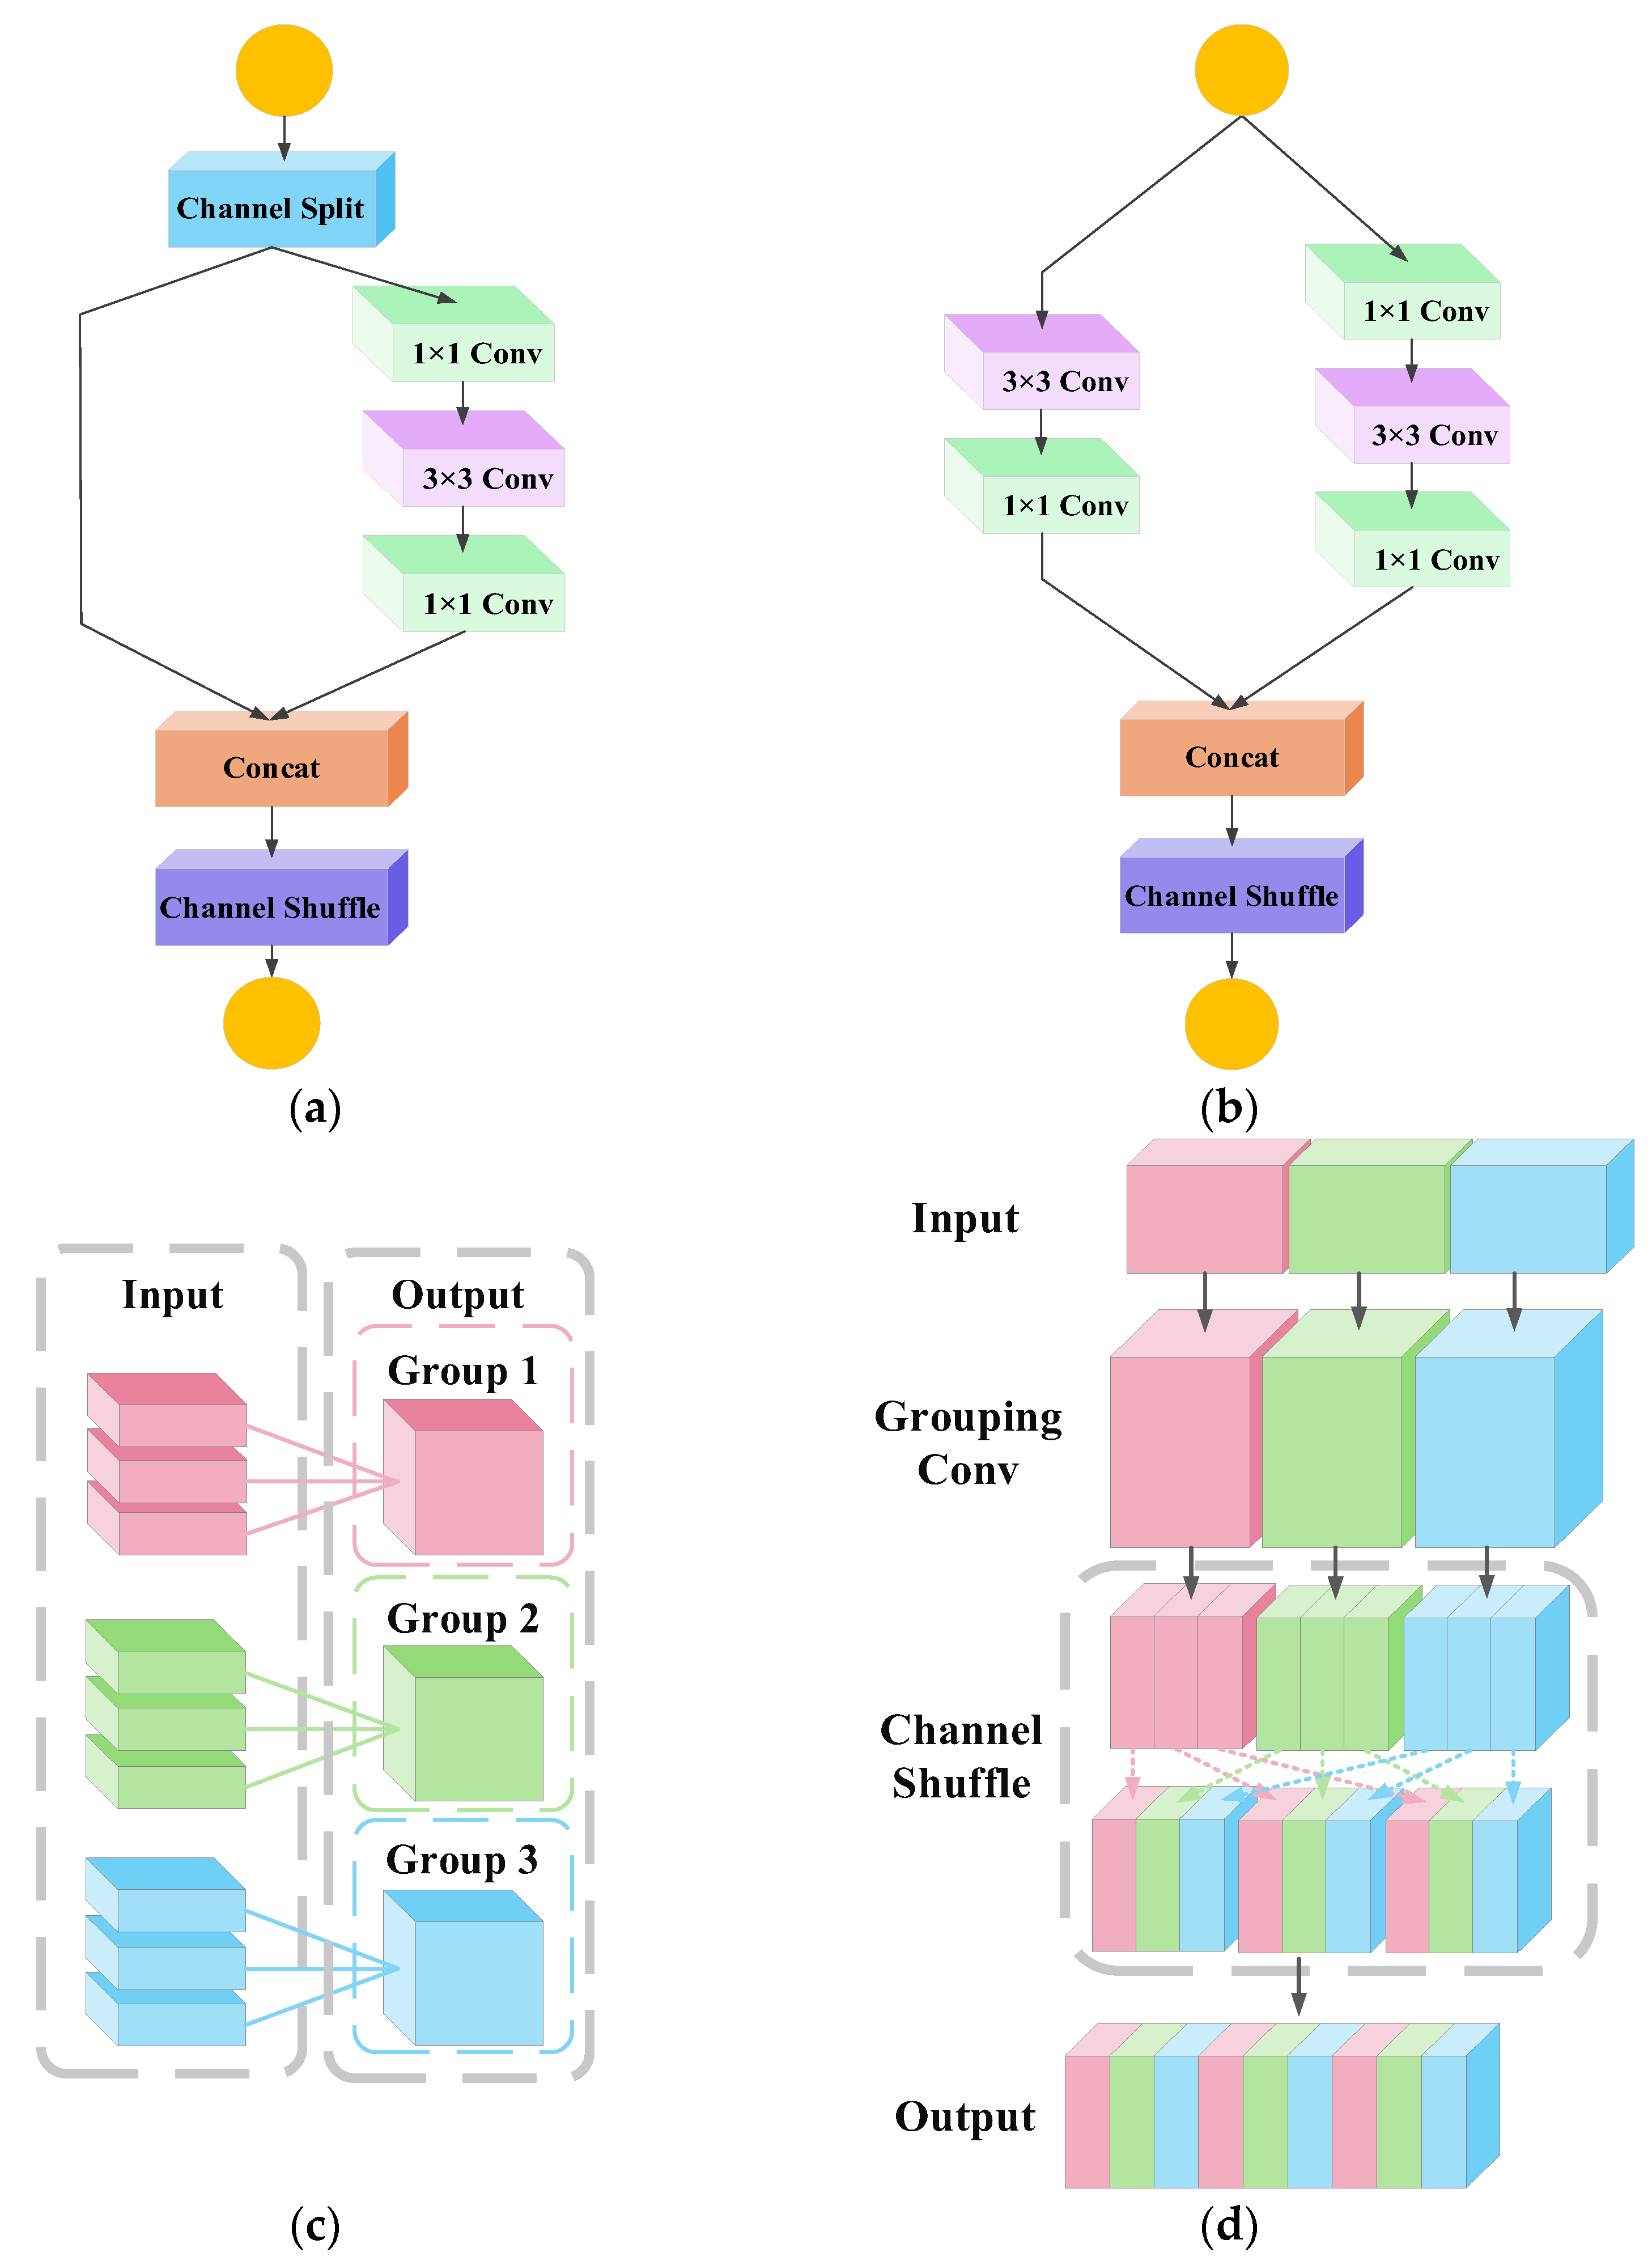
To mitigate the increase in model parameters brought about by the above improvements, improve detection efficiency, and facilitate deployment on small distribution inspection equipment, we replace the large-parameter C3k2 module at the end of the backbone network with a ShuffleNetV2 module. The number of model parameters is reduced without the excessive loss of detection accuracy.

2. Related Work

2.1. YOLO11 Algorithm

The YOLO series algorithms have undergone multiple iterations and updates and have now evolved into version YOLO11. Compared to previous versions, YOLO11 demonstrates significant advantages in detection performance and generalization capability. While reducing model parameters, its detection accuracy and efficiency surpass those of earlier YOLO series models [27]. Relative to YOLOv8, YOLOv9, and YOLOv10, the YOLO11 model primarily upgrades the C2f module from YOLOv8 to the C3k2 module, which combines the strengths of both C2f and C3 modules by optimizing feature extraction paths and gradient propagation mechanisms. Additionally, YOLO11 introduces the C2PSA module after the SPPF layer in the backbone network, enhancing the model’s adaptability to occluded objects and multi-scale features. Furthermore, the YOLO1m-level model inherits YOLOv9’s PGI framework, which mitigates information decay in deep networks through optimized gradient propagation paths. It also retains YOLOv10’s dual label assignment mechanism to directly generate final prediction boxes, streamlining the workflow from training to deployment. These advancements endow YOLO11 with notable application potential in detecting multi-defect scenarios for power line insulators.
The YOLO11 network architecture consists of four components: the input layer (Input), the backbone network (Backbone), the neck network (Neck), and the detection head (Head) [28]. The input layer performs adaptive resizing and data distribution alignment to ensure consistency with the training dataset. The backbone network executes hierarchical feature extraction from preprocessed inputs, subsequently propagating semantic information to the neck and detection head for target localization. Distinct from prior YOLO iterations, YOLOv11 incorporates the C3k2 and C2PSA modules within its backbone architecture, optimizing detection efficiency through enhanced feature representation [29]. The neck module serves as an intermediary between the backbone and detection head, implementing multi-scale feature fusion through C3k2, Upsample, Conv, and Concat modules to enrich hierarchical feature representations, thereby enhancing model performance. The detection head employs task-specific processing branches for classification, detection, and localization, utilizing task-optimized loss functions to quantify prediction errors during training.

2.2. Improved YOLO11 Network Model Construction

The detection head integrates an Adaptive Spatial Feature Fusion (ASFF) module to enhance multi-scale feature extraction for diverse insulator defect types. ASFF [30] can dynamically adjust the pyramid feature contribution of each scale, enhance feature consistency by adaptively weighting and combining features through a lightweight network, and improve the model’s responsiveness to defects at different scales. Meanwhile, the FPN + PAN of the neck network is replaced by BiFPN [31], which introduces learnable weighting weights to achieve bidirectional feature fusion and optimize the effect of multi-scale feature fusion. In addition, CBAM is integrated into the output of the BiFPN module to improve the model’s defective feature detection ability in complex environments with the help of CBAM’s [32] channel attention mechanism and spatial attention mechanism, enhance multi-scale feature fusion and defective feature sensitivity, and improve detection accuracy and robustness. To reduce model complexity and computational overhead for easy deployment on small inspection robots, the C3k2 module at the end of the backbone network is replaced with ShuffleNetV2, which lightens the YOLO11 backbone, reduces parameters, and improves computational efficiency. The subsequent subsections of this section describe the working principle of each module and related techniques. The improved model network structure is shown in Figure 1.

2.2.1. ASFF (Adaptively Spatial Feature Fusion)

Distribution line insulators have a variety of defects, and there are large differences in scale between different defect forms. Small-scale defects such as fine galvanic corrosion points often require high-resolution features to accurately capture their detailed characteristics; medium-scale defects like fouling coverage rely on macroscopic semantic features for rapid localization and identification; and large-scale defects, such as stress damages on insulator surfaces, require feature information integration within a certain range to facilitate the accurate determination of their morphology and scope. Traditional feature fusion methods are difficult to adequately cope with such multi-scale variations, and the ASFF module can effectively solve these problems.
Firstly, the ASFF module uses the scale of the target resolution as a baseline so that it can be easily adjusted for other resolution scales. As shown in Figure 2, the hierarchical structure demonstrates progressive resolution enhancement from Level 1 to Level 3, accompanied by contracting receptive fields. To optimize detection efficacy, multi-level feature integration is implemented by combining Level 1 and Level 2 feature maps for enhanced contextual representation.
Secondly, following feature reconstruction, the ASFF module subsequently executes adaptive multi-feature integration. The ASFF module calculates spatial importance weights for feature plots at each scale. As shown in Figure 2, taking the fusion of Level 3 as an example, let x i j 1 3 , x i j 2 3 , and x i j 3 3 represent the values of the eigenvectors at position ( i , j ) after resolution from Level 1, Level 2, to Level 3, respectively. The fusion feature y i j 3 for Level 3 is calculated as
y i j 3 = α i j 3 x i j 1 3 + β i j 3 x i j 2 3 + γ i j 3 x i j 3 3
where α i j 3 , β i j 3 , and γ i j 3 are the spatial importance weights obtained through network learning, α i j 3 + β i j 3 + γ i j 3 = 1 and α i j 3 , β i j 3 , γ i j 3 [ 0 , 1 ] .
This adaptive fusion enables the model to automatically assign weights according to the contribution of different scale features to insulator defect detection.
The integration of ASFF into YOLO11’s detection head is primarily driven by its capacity to dynamically weight multi-scale features. This design aligns with the multi-scale challenges inherent in distribution line insulator defect detection. By adaptively optimizing feature contributions across scales, the architecture enhances multi-scale detection accuracy while improving robustness against false positives and missed detections caused by scale variations.

2.2.2. BiFPN (Bidirectional Feature Pyramid Network)

The traditional Feature Pyramid Network (FPN) constructs a series of feature maps with a uniform number of channels but varying spatial resolutions through a top-down architecture, enabling the FPN to effectively process and recognize feature maps of different sizes. The Path Aggregation Network (PANet) enhances the Feature Pyramid Network (FPN) by introducing bottom-up pathways over its top-down architecture, which propagates fine-grained features from lower to higher levels via iterative downsampling. The FPN + PAN structure simply adds up different input features when fusing them without distinguishing the importance of different features and is less effective in detecting defects in small targets. The escalation of feature dimensionality inevitably escalates parameters and computational overhead, thereby compromising model generalizability.
BiFPN employs a bidirectional feature fusion mechanism to enable simultaneous upward–downward feature integration. This design resolves the unidirectional information flow limitation inherent in traditional feature pyramid structures while enhancing feature fusion depth, information transmission efficiency, and representation capacity. The structure of BiFPN is shown in Figure 3a, which eliminates nodes that receive only a single input to reduce the unnecessary duplication of information and deepens the integration of features and facilitates the flow of information through the network by repeatedly applying the bidirectional fusion step. The network also introduces a weighted feature fusion method, which assigns corresponding weights to each feature according to its relevance and importance, to improve the effect of feature fusion. Its weighted fusion formula is as follows:
O = i ω i I i ε + j ω j
where I i is the input feature, O is the output feature, ω i and ω j are the learnable weights used to adjust the contribution of different features in the fusion, and the ε = 0.0001 can avoid numerical instability.
This weighted fusion strategy allows the adaptive modulation of cross-scale feature contributions during insulator defect recognition, thereby improving robustness under challenging background and illumination conditions. Furthermore, BiFPN’s skip connection mechanism preserves feature map resolution and minimizes information degradation, particularly critical for small-scale insulator defect detection where multi-scale fusion avoids the dilution of discriminative features.
To strengthen defect feature prioritization and minimize background noise interference, the CBAM attention module is integrated into the BiFPN output layer of the enhanced architecture. This integration enhances defect-specific feature extraction in cluttered environments, suppresses error propagation in high-level semantic representations, and optimizes contextual reasoning. The modified BiFPN structural schematics are depicted in Figure 3b, with detailed CBAM operational principles elaborated in the subsequent section.

2.2.3. CBAM (Convolutional Block Attention Module)

Conventional feature recognition methods exhibit inadequacies in handling insulator defects with multi-scale and spatially heterogeneous characteristics. The CBAM attention mechanism addresses this limitation by augmenting feature discriminability in complex contexts. Comprising a Channel Attention Module (CAM) and a Spatial Attention Module (SAM), CBAM generates channel-spatial weight maps that dynamically modulate intermediate features through element-wise multiplication. This dual-attention mechanism substantially enhances the network’s feature representation capacity through adaptive feature refinement. The CBAM attention module implementation flow is shown in Figure 4.
First, The CBAM initiates processing by applying its Channel Attention Mechanism (CAM) to the channel-wise dimensions of input feature maps. The CAM mainly consists of two core steps: global average pooling and fully connected layer processing. For the input feature map F , the Channel Attention Module (CAM) generates pooled feature descriptors F a v g c and F max c through global average and max-pooling operations. These descriptors are subsequently processed by a shared two-layer MLP to derive channel-wise attention weights. After that, the MLP outputs are summed element-wise to produce an intermediate feature map, which is activated via the sigmoid function to generate channel attention weights M c ( F ) . These weights are then multiplied element-wise with the original input feature map F to yield the channel-refined feature map F .
The channel attention module can be expressed as follows:
M c ( F ) = σ ( M L P ( A v g P o o l ( F ) ) + M L P ( M a x P o o l ( F ) ) ) = σ ( W 1 ( W 0 ( F a v g c ) ) + W 1 ( W 0 ( F max c ) ) ) ,
F = M c ( F ) F ,
where σ denotes the sigmoid activation function; W 0 and W denote the two convolution operations in the MLP; F a v g c and F max c denote the feature maps generated after global average pooling and global maximum pooling in CAM, respectively; M c ( F ) is the channel attention weight map; F is the feature map obtained after weighting in CAM; and denotes the element-wise product.
Next, the SAM processes the spatial dimension of the channel-refined feature map. For the CAM-processed feature map F , global average pooling and global maximum pooling operations in the channel direction are first performed to obtain two feature maps F a v g s and F max s . The two pooled descriptors undergo channel-wise concatenation, thereby generating a fused feature map [ F a v g s ; F max s ] . Immediately after, the fused feature map undergoes a 7 × 7 convolution followed by sigmoid activation to produce spatial attention weights M s ( F ) . Finally, these weights are then multiplied element-wise (Hadamard product) with the SAM’s input feature map F to generate the spatially refined output F .
The spatial attention module can be expressed as follows:
M s ( F ) = σ ( F 7 × 7 ( [ A v g P o o l ( F ) ; M a x P o o l ( F ) ] ) ) = σ ( F 7 × 7 ( [ F a v g s ; F max s ] ) )
F = M s ( F ) F
where F 7 × 7 denotes a convolution operation with a convolution kernel size of 7 × 7; F a v g s and F max s denote the feature maps generated in SAM after global average pooling and global maximum pooling, respectively; [ F a v g s ; F max s ] denotes the feature maps concatenated over the channel dimensions; and M s ( F ) is the spatial attention weight map.
In this model, the main motivation for combining CBAM with BiFPN is to improve the model’s recognition accuracy of defective features in complex backgrounds and occlusion situations by fully focusing on the key features of small target defects in complex backgrounds that have been processed by BiFPN through the characteristics of CBAM’s dual-dimensional attention mechanism.

2.2.4. ShuffleNetV2

ShuffleNetV2, introduced by Ma et al. [33], targets mobile devices and resource-constrained environments. The architecture incorporates depth-wise separable convolution and channel shuffling within grouped convolutions. Depth-wise separable convolution splits operations into depth-wise and pointwise layers to minimize parameters. Grouped convolution partitions input/output channels into subgroups for parallel processing, reducing computational load. Channel shuffling rearranges feature channels post-grouping to enhance cross-channel information flow while maintaining low complexity. These innovations balance computational efficiency and feature representation, establishing ShuffleNetV2 as a lightweight CNN optimized for mobile deployment.
The basic module of ShuffleNetV2 is shown in Figure 5a. First, the feature maps are channel-separated and fed into two branches: the left branch is an identity mapping without any operation, and the right branch extracts features in the order of point-wise convolution, 3 × 3 depth-wise convolution, and point-wise convolution, keeping the number of channels constant. Then, the left and right branches’ feature maps are concatenated, and channel shuffling is performed.
The downsampling module of ShuffleNetV2 is shown in Figure 5b, which also inputs the feature maps into two branches, but differs from the basic module in that the left branch is downsampled with 3 × 3 depth-wise convolution with a stride size of 2, and then conducts point-wise convolution to merge channel information. The right branch is the same as that of the basic module, in which the stride size of the 3 × 3 depth-wise convolution is 2. Then, the left and right branch feature maps are combined, and the number of channels becomes twice the original. Finally, channel shuffling is performed on the merged feature maps.
ShuffleNetV2 avoids the increase in computation and overcomes the defect that group convolution hinders the communication of inter-group feature maps by channel information shuffling after connection. First, the input feature map is grouped convolution to realize parallel processing, and the operation process of grouped convolution is shown in Figure 5c. Then, the feature matrix is further disrupted and divided for channel shuffling, and the realization process of channel shuffling is shown in Figure 5d. Finally, the feature map that fully integrates different channel information is obtained.

2.3. Distribution Line Insulator Defect Dataset Construction

2.3.1. Dataset

The insulators of distribution lines are predominantly situated in high-voltage environments, necessitating specialized equipment and personnel for data collection, which results in extremely high costs for dataset acquisition. Additionally, insulator defects (such as damage and electrical erosion) are constrained by external factors in real-world operational environments. The number of normal samples significantly exceeds that of defective ones, and accumulating effective defect data requires prolonged detection periods. Limited by budgetary and time constraints, a portion of distribution line insulators used in actual engineering projects were purchased and artificially damaged under complex backgrounds based on real-world collected data to supplement the dataset. This ensures the dataset contains sufficient data types and a comprehensive data structure, as illustrated in Figure 6, which shows excerpts from the dataset. Ultimately, the dataset comprises a total of 408 images, with synthetic data and real defect samples each accounting for 50%.

2.3.2. Dataset Expansion

Given the constrained dataset, image augmentation methods were implemented to mitigate model overfitting, improve algorithmic robustness, and boost generalization capabilities.
The data augmentation process consists of several techniques with specific probabilities: adjusting brightness and contrast with random variations between 90% and 110% (65% probability); flipping images vertically, horizontally, or at ±45° angles (25% probability for each direction); rotating images with angles randomly selected between 30° and 120° (65% probability); randomly adding occlusions covering 15% of the original image area with 1–3 blocks (60% probability, simulating detection obstructions); introducing salt-and-pepper noise with radii between 1 and 2 pixels (65% probability, mimicking electromagnetic interference during inspections); applying color jitter with hue shifts ranging from −72° to 72° (35% probability, replicating lighting variations); and distorting images via piecewise affine transformations (10% probability, emulating real-world distortions or motion blur from unstable inspection robots). This strategy expanded the distribution line insulator dataset to 1205 images while maintaining balanced defect class proportions, and the representative samples of the augmented dataset are illustrated in Figure 7.
Annotate enhanced image data using LabelImg (1.8.6) image annotation software installed in the virtual environment.
Each annotated image is accompanied by a corresponding text file containing metadata about the object categories, along with bounding box coordinates and dimensional parameters. The annotation process yielded 2973 validated object annotations, comprising 1690 intact insulator markings and 1683 defect indicators.
The original labeled images and augmented derivatives were randomly partitioned using a 9:1 split ratio between training and validation subsets, supplemented by an independent test set comprising 200 unprocessed images for comprehensive model evaluation. This structured dataset assembly forms the foundation of the power distribution network insulator defect detection framework, with detailed statistical distribution illustrated in Table 1.

3. Experimental Verification

3.1. Experimental Software and Hardware Configuration

The computational architecture proposed in this study leverages the PyTorch neural network development ecosystem.
The hardware and software used in the experiment were as follows: Windows 10 operating system; 13th Gen Intel(R) Core (TM) i5-13600KF @ 3.5 GHz CPU; RTX 4070 12 G GPU; PyTorch version 2.1.2; CUDA version 11.8.

3.2. Assessment of Indicators

To holistically evaluate target detection performance, this study employs five key metrics: precision, recall, mean average precision (mAP), F1-score, and AUC–ROC. These indicators quantify model capabilities across critical dimensions of detection reliability and generalization.
Precision quantifies the ratio of true positive instances among all samples classified as positive by the model, serving as an indicator of classification validity. This metric evaluates the model’s capability to minimize false positive predictions, mathematically expressed as the number of correctly identified positives divided by the total predicted positives (sum of true and false positives). The formula is as follows:
P r e c i s i o n = T P T P + F P
where TP (true positive) represents the number of true positive samples, and FP (false positive) represents the number of false positive samples.
Recall measures the proportion of all samples that are actually positive that are correctly predicted as positive by the model. It reflects the completeness of the model’s detection results, i.e., how many actual positive samples the model was able to detect. Recall is calculated using the following formula:
R e c a l l = T P T P + F N
where FN (false negative) represents the number of false negative samples.
Mean average precision (mAP) is a composite performance metric that synthesizes the model’s precision performance at different levels of recall. mAP is calculated by involving the integration of the precision–recall curves for each category, and then averaging the mean precision across all categories. The specific calculation formula is as follows:
A P = 0 1 P ( r ) d r
m A P = 1 N i = 1 N A P i
where A P i represents the average precision of the i-th category and N represents the total number of categories.
The F1-score is the harmonic mean of precision and recall, used to balance the trade-off between these two metrics. When dealing with class imbalance in data, the F1-score provides a more comprehensive measure of a model’s ability to identify minority classes. F1-score is calculated using the following formula:
F 1 = 2 × P r e c i s i o n × R e c a l l P r e c i s i o n + R e c a l l
When there is a significant discrepancy between precision and recall, the F1-score will be notably lower than their arithmetic mean, indicating that the model requires further optimization of its classification boundaries.
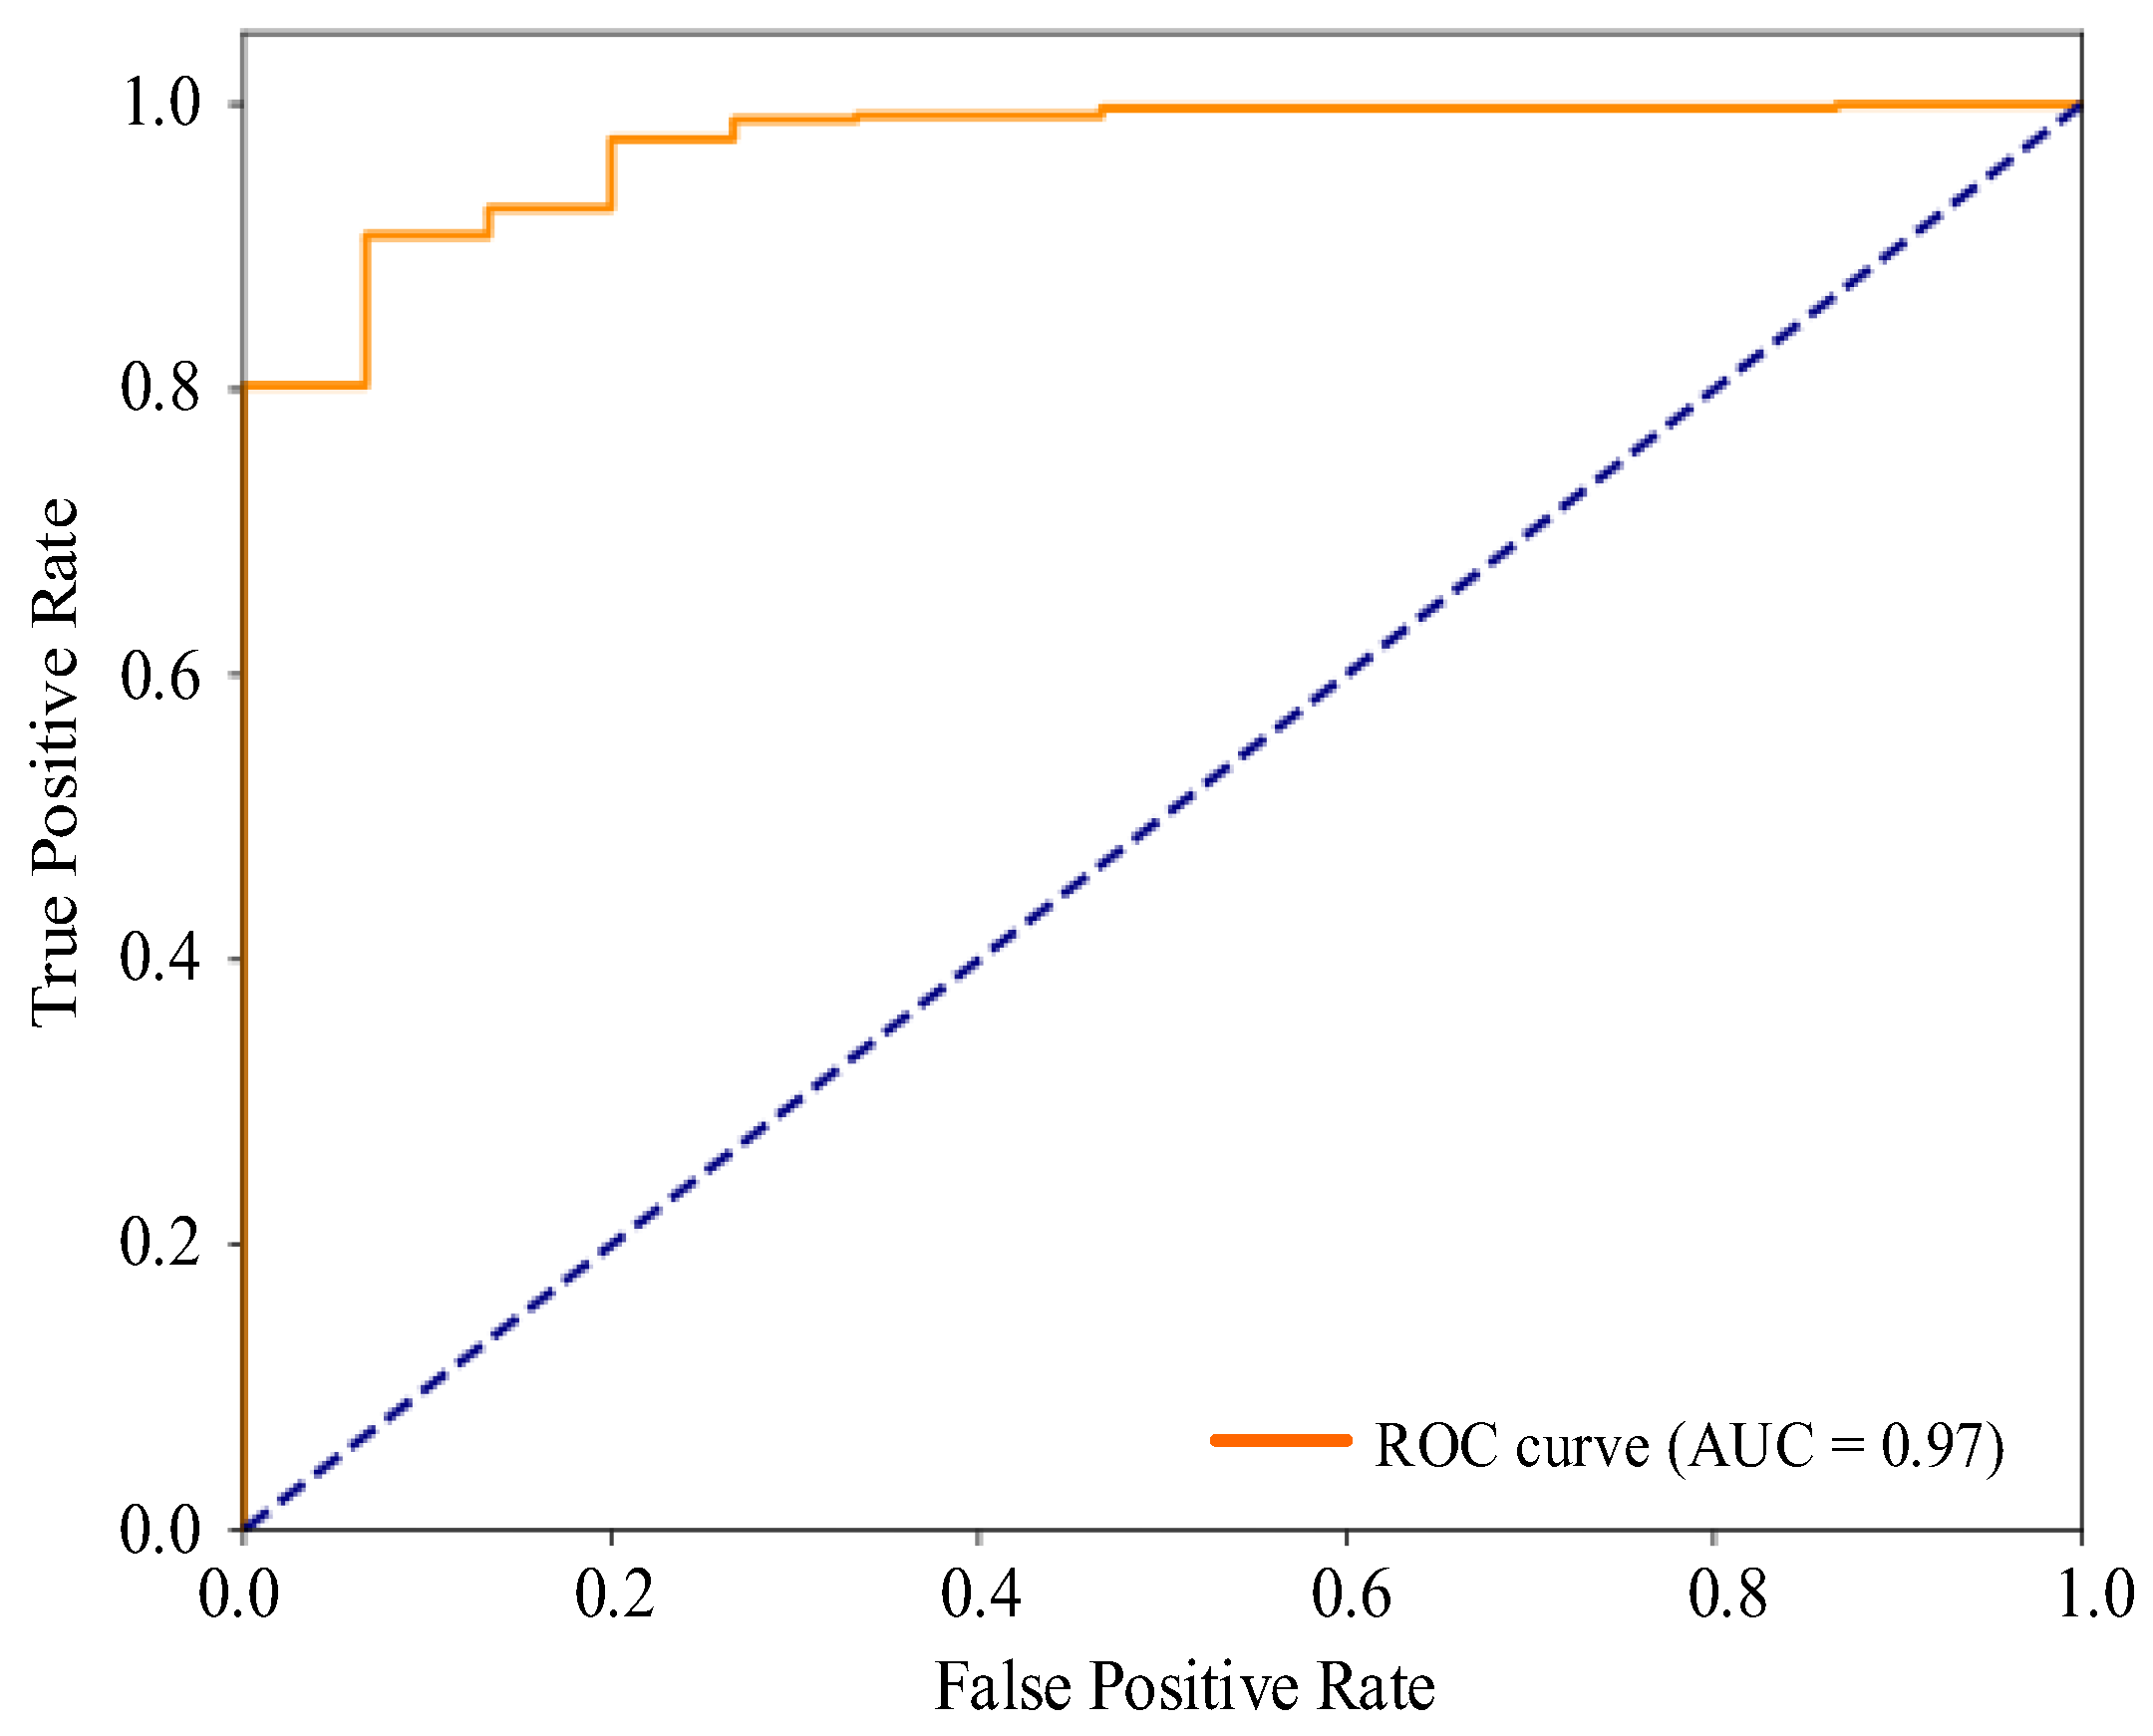
AUC–ROC (area under the ROC curve) evaluates a model’s overall performance across different classification thresholds by calculating the area under the ROC curve. The ROC curve plots the FPR (false positive rate) on the x-axis against the TPR (true positive rate) on the y-axis. The closer the AUC value is to 1, the stronger the model’s ability to distinguish between positive and negative samples. The formula is expressed as
A U C = 0 1 T P R ( F P R 1 ( x ) ) d x
Unlike metrics that rely on a single threshold, the AUC–ROC captures a model’s generalization performance across all possible thresholds, making it particularly suitable for class-imbalanced scenarios.
These evaluation metrics not only reflect model performance in specific aspects individually but also provide a comprehensive view of model performance when used in combination. In practice, these metrics help us understand the strengths and limitations of the model on specific tasks, which in turn guides the optimization and improvement of the model.

3.3. Training and Prediction of Improved YOLO11

The post-implementation of the defect dataset for distribution network insulators, the improved YOLO11 model training was started. Considering the capacity of the computing platform, the training iterations were set to 300 times.
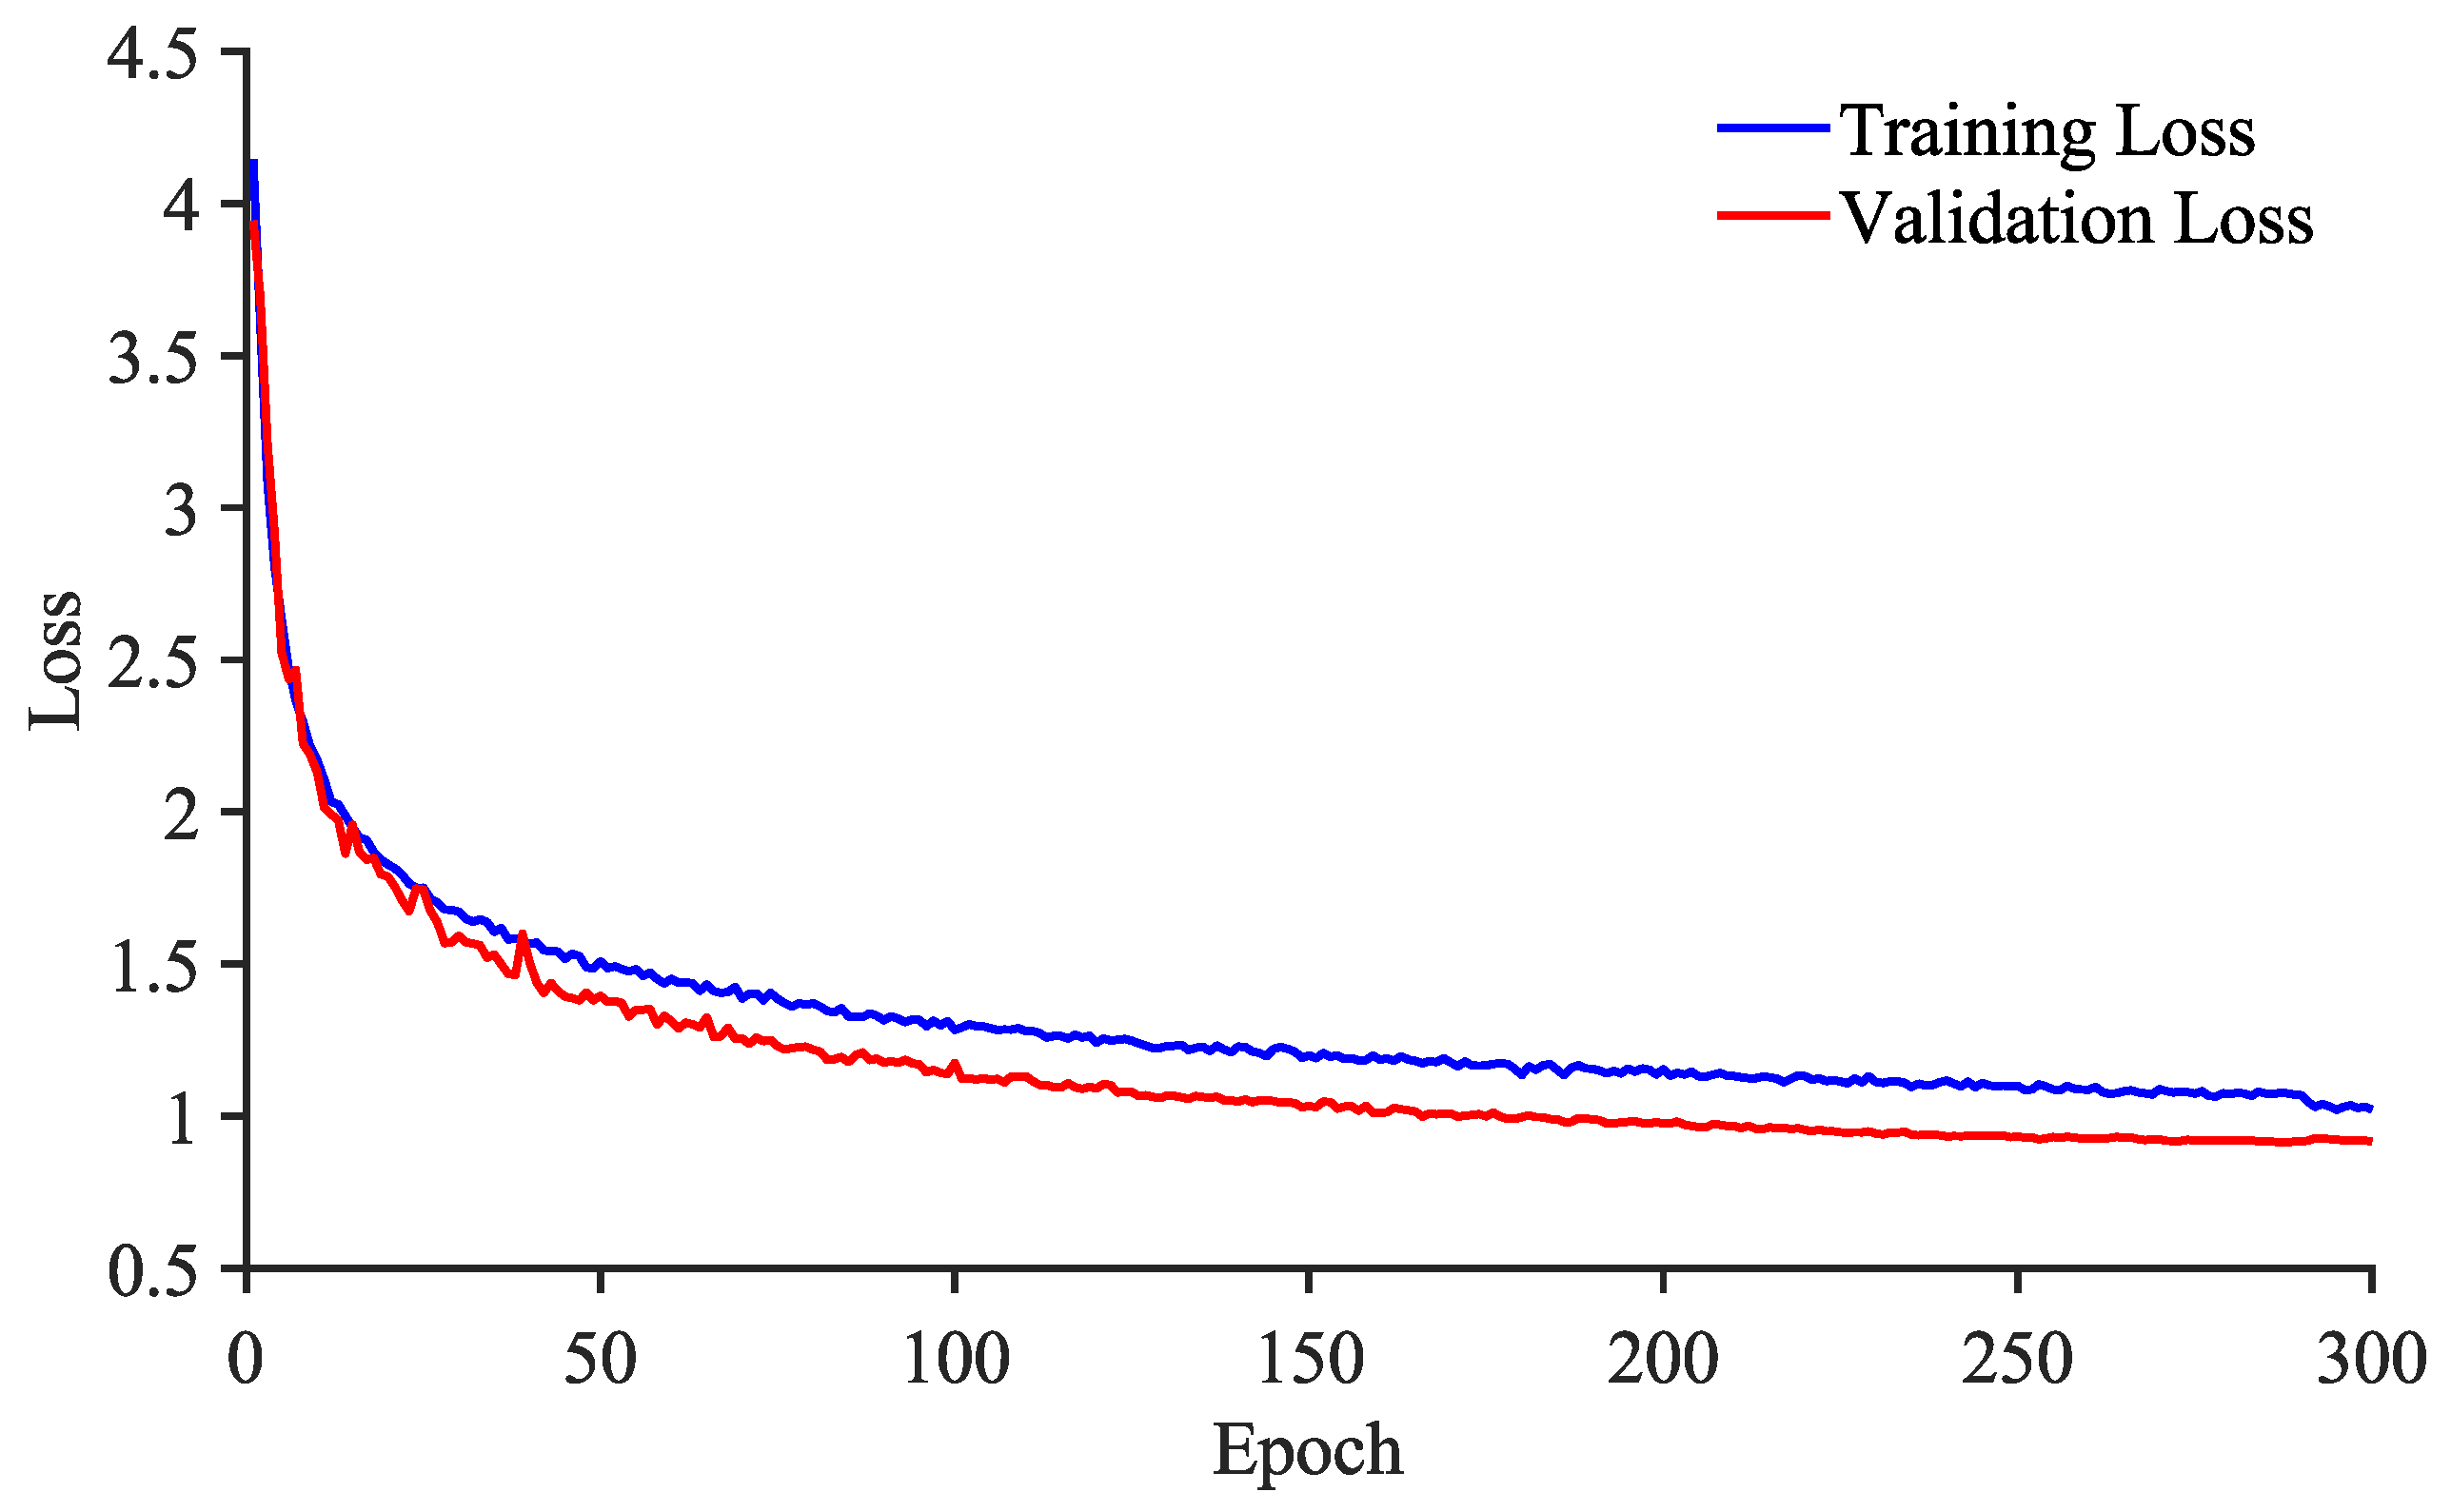
After the training is completed, the model’s performance is evaluated by statistically analyzing the processing and prediction results of the test set. During the training process, the loss value decreases with iterations, and the model converges when the validation loss value no longer decreases. The loss value change curve is shown in 
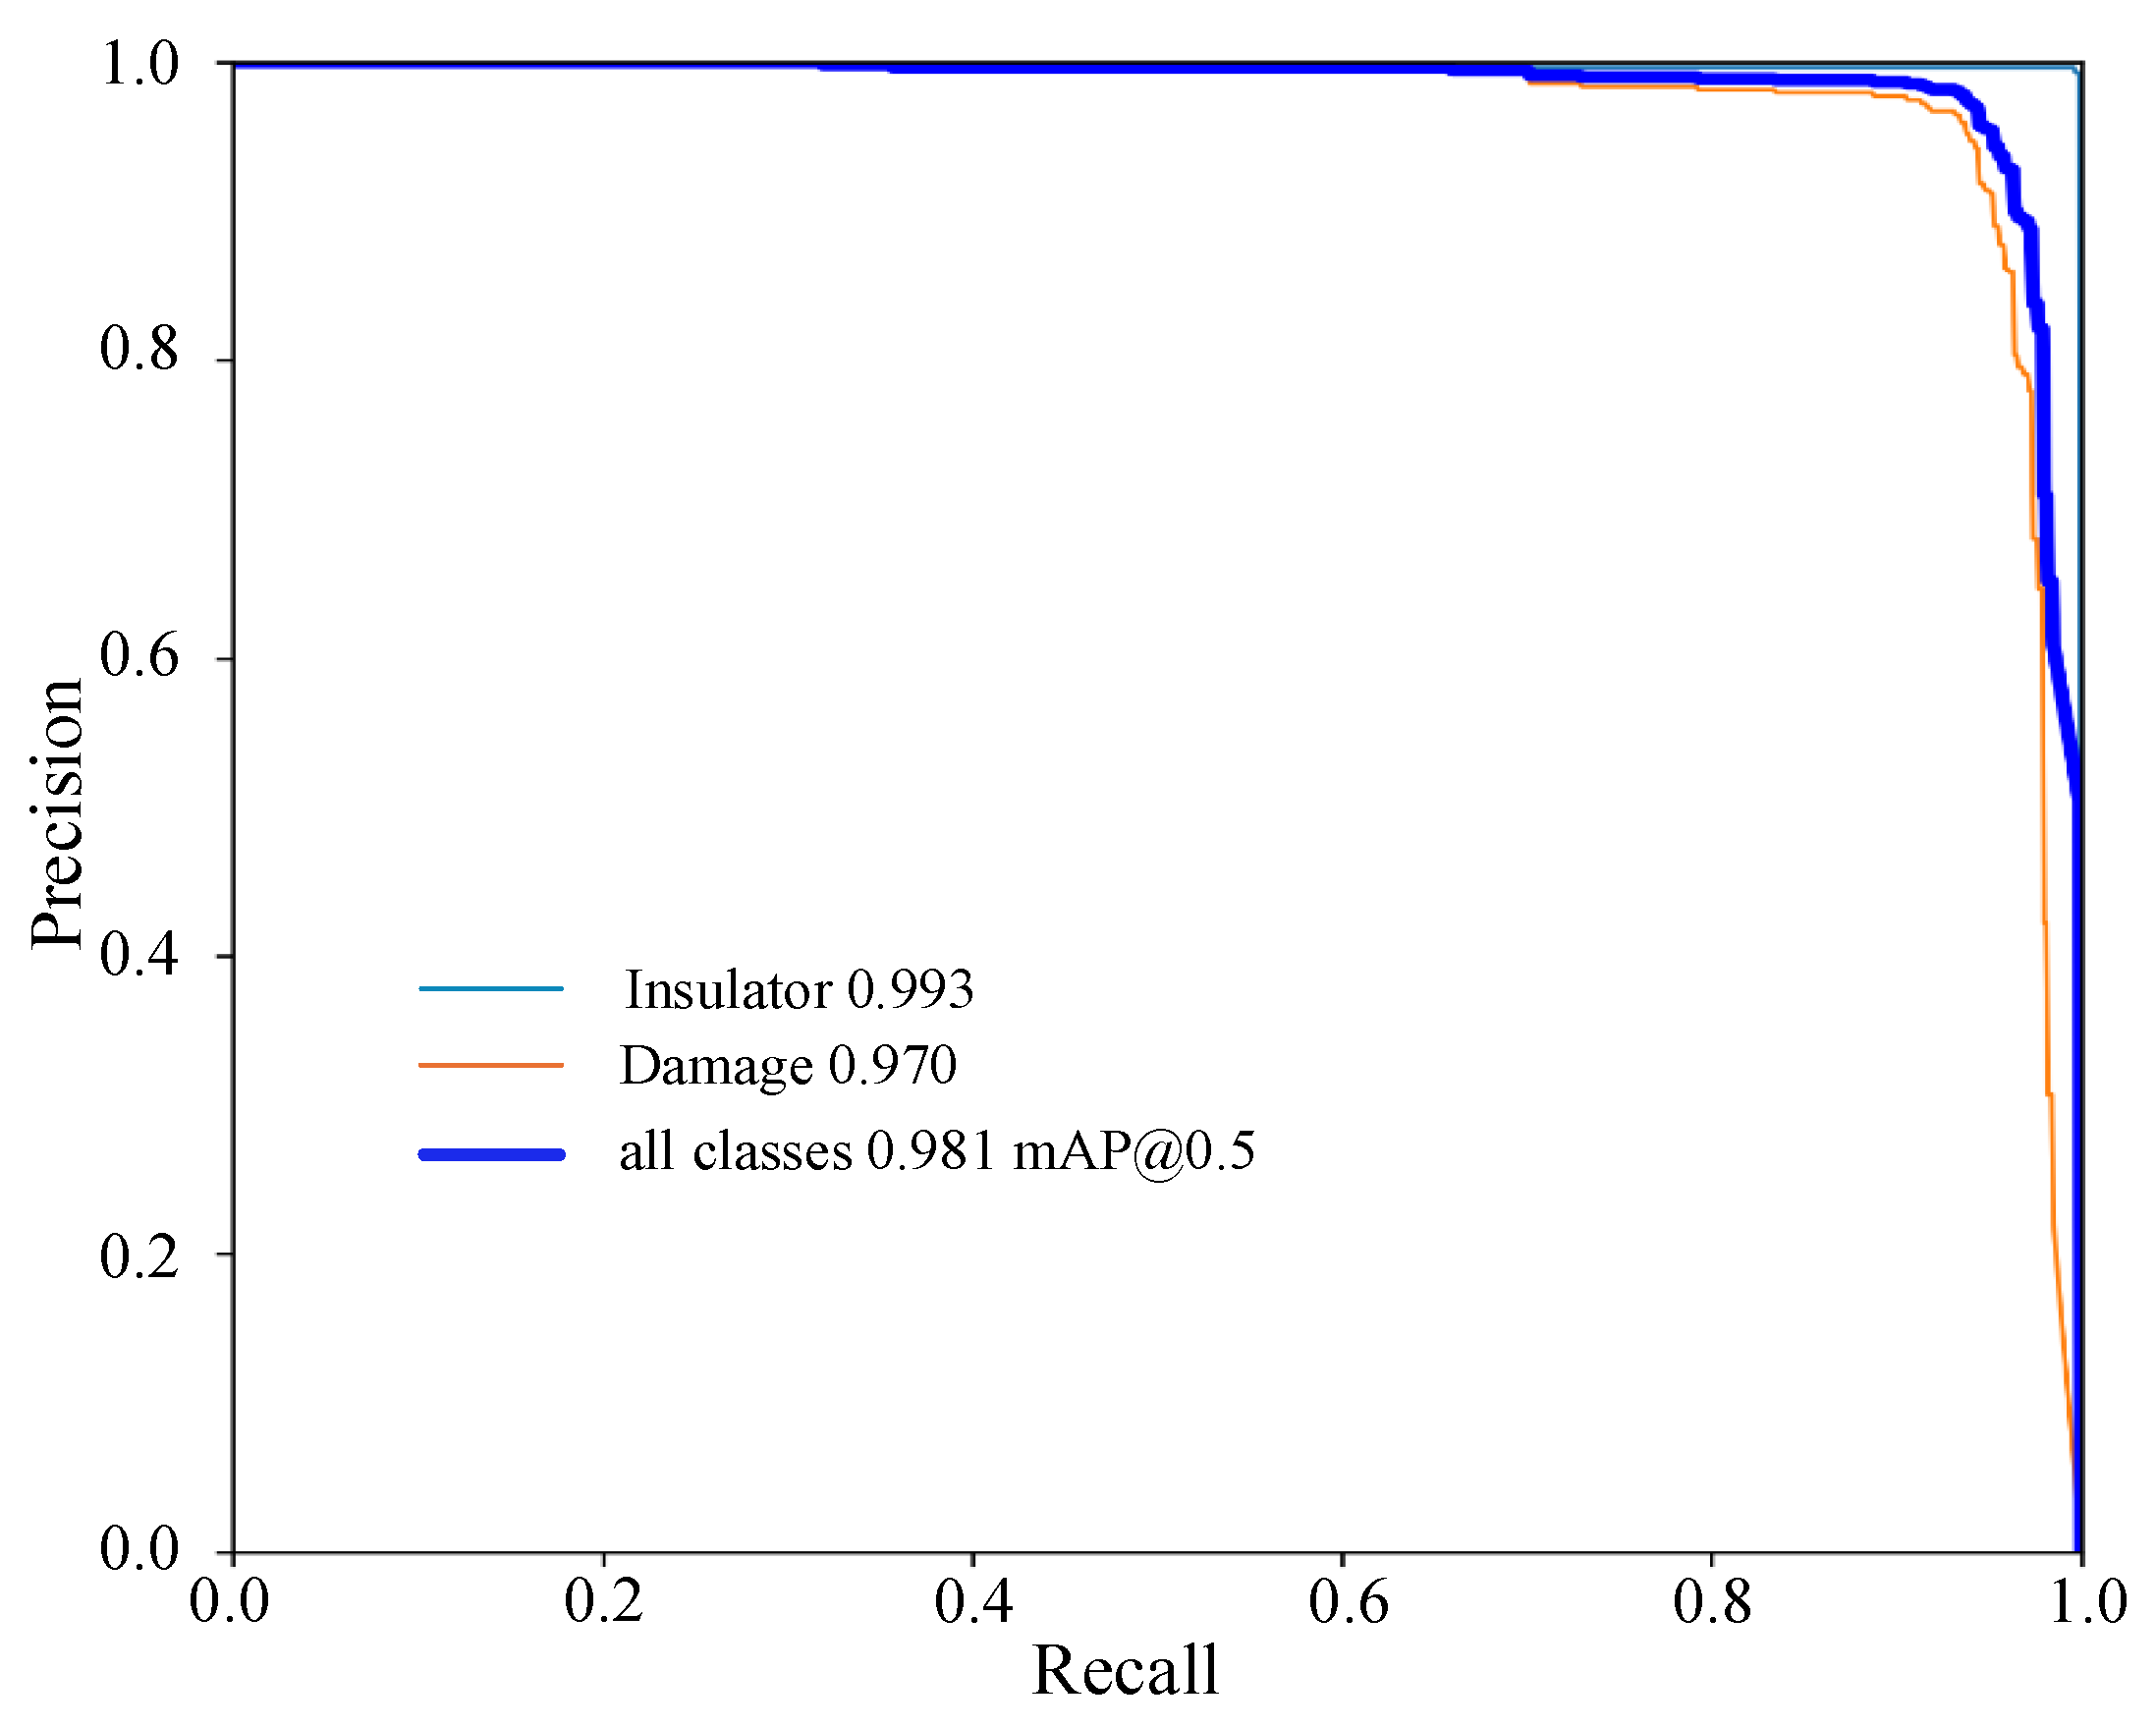
Figure 8. To comprehensively evaluate the model performance, the precision–recall (P-R) curve, the AUC–ROC curve, and confusion matrix are used as the basis for experimental validation. The P-R curve is presented in Figure 9, the AUC–ROC curve in 
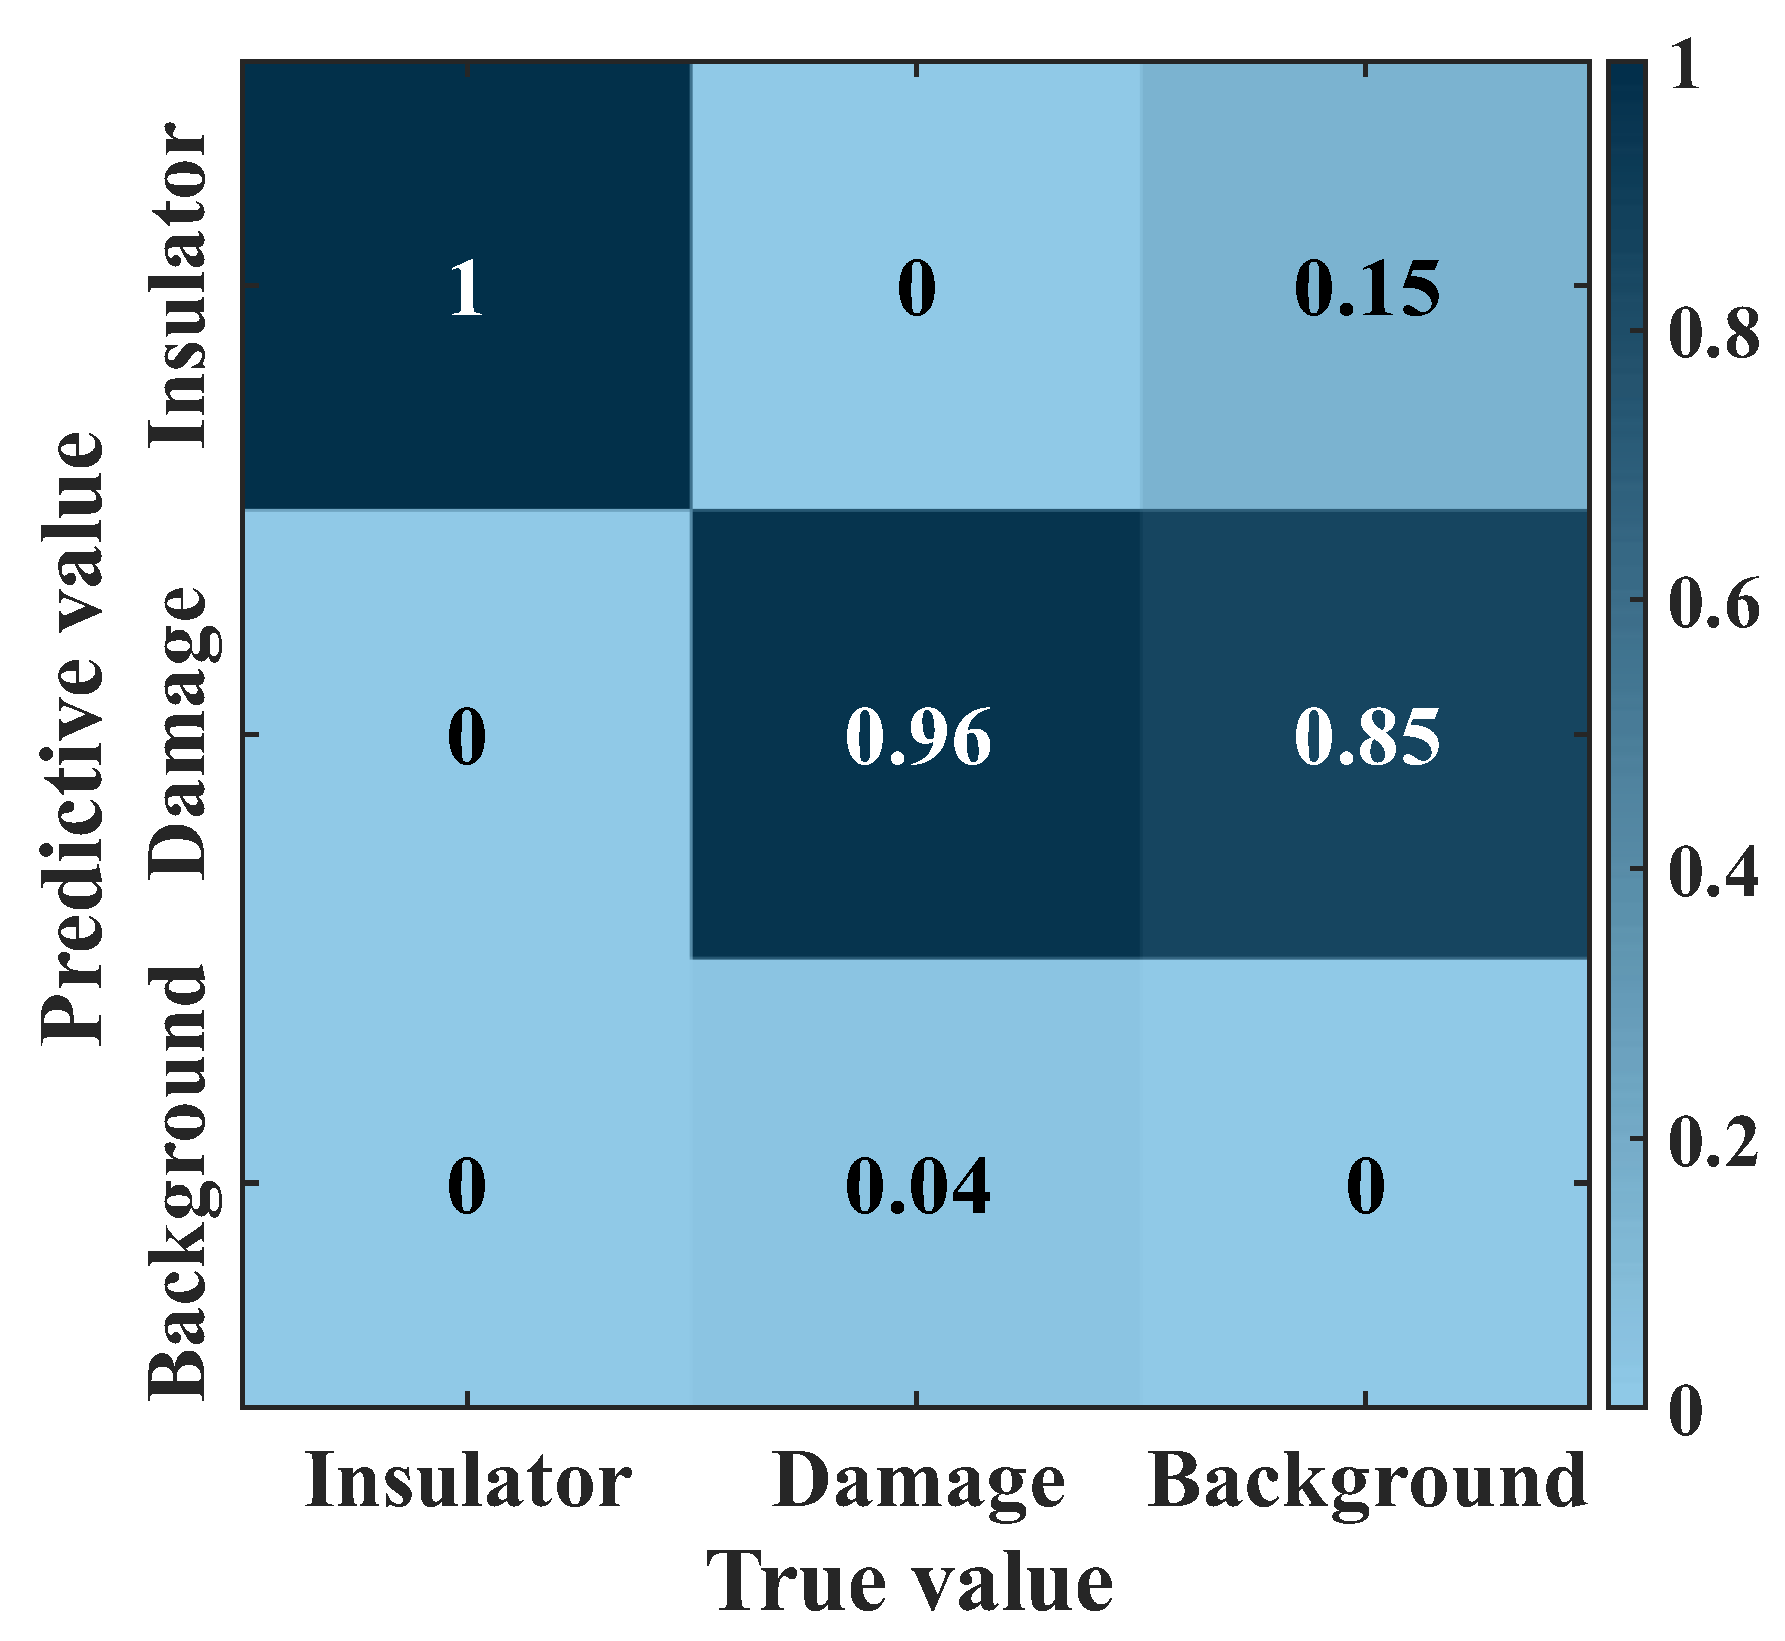
Figure 10, and the confusion matrix in Figure 11. The P-R curve clearly illustrates the balanced relationship between the model’s precision and recall under different thresholds, accurately reflecting its performance across varying confidence levels. The AUC–ROC curve demonstrates the trade-off between the true positive rate (TPR) and false positive rate (FPR) at different thresholds, effectively showcasing the model’s ability to distinguish between positive and negative samples. The confusion matrix, on the other hand, provides an in-depth analysis of label classification through four key metrics: true positives (TPs), true negatives (TNs), false positives (FPs), and false negatives (FNs), offering a comprehensive assessment of the model’s classification effectiveness.
The training loss curves illustrated in Figure 8 demonstrate a sharp decline in model loss values during the initial 50 epochs, followed by stabilization beyond the 200th epoch. This progressive reduction in the composite loss trajectory confirms robust convergence behavior of the model. As evidenced by the result in Figure 9, Figure 10 and Figure 11, the enhanced YOLO11 architecture achieves superior performance in identifying insulator defects on power distribution line infrastructure.
Furthermore, Figure 12 shows the prediction results of the model on different test sets. The distribution line insulators and their defects are marked out in the figure and distinguished using different colored boxes with the corresponding names and confidence levels shown on the boxes. From the experimental results of the improved model on different test sets, it can be seen that the improved model is able to accurately identify the insulators and whether they are defective or not, and the prediction results show consistency across different test sets with the overall prediction effect.

3.4. Comparative Experiments on Different Attention Mechanisms

To investigate the specific impact of various attention mechanisms on the detection performance of the YOLO11 model, we integrated BiFPN modules, incorporating three different attention mechanisms, SE, CA, and CBAM, respectively, in the same location of the model architecture. The detection results of each module on the distribution line insulator defect dataset are shown in Table 2. The experimental results show that the network incorporating the CBAM performs on the defect recognition task with a high defect detection accuracy of 96.0% and a high mean accuracy (mAP) of 97.6%. The advantage of the CBAM is its ability to add attention to both channel and spatial dimensions simultaneously, which significantly improves the model’s ability to capture key features. This not only preserves the positional and spatial information in the feature map but also effectively localizes the defective features, which in turn enhances the performance of the model. In contrast, the CA module, which mainly focuses on the spatial location information in the feature map, expands the parameter scale of the model, but its detection performance enhancement is not significant. The SE module, on the other hand, mainly concentrates its attention on the channel dimension and lacks the sufficient consideration of the spatial dimension feature information, making its improvement in detection performance insignificant.
As shown in Table 2, the results of the attention mechanism comparison experiments indicate that the integration of the CBAM attention mechanism into the YOLO11 network is an effective solution to improve defect detection performance. Due to its simultaneous attention in both channel and spatial dimensions, the model is able to identify and localize insulator defects more accurately, thus improving the overall detection performance.

3.5. Ablation Experiment

This research implemented architectural optimizations across the backbone network, neck architecture, and detection head of the baseline model. To systematically evaluate the efficacy of these modifications, ablation studies were conducted on the three proposed enhancement modules. The quantitative comparisons of how distinct optimization strategies influence detection capabilities are presented in Table 3.
As demonstrated in Table 3, integrating the ASFF module into YOLOv11’s detection head achieves accuracy gains of 1.0% (AP) and 0.5% (mAP) over the baseline. After integrating the BiFPN_CBAM into the neck network of the YOLO11 model, the defect detection accuracy and average detection accuracy are improved by 0.4% and 0.2%, respectively, compared with the original model. After replacing the large-parameter C3k2 module at the end of the backbone network of the YOLO11 model with the ShuffleNetV2 module, both the defect detection accuracy and the average detection accuracy decreased by only 0.1% compared to the original model, but the model size was significantly reduced. Similarly, when compared to models only incorporating ASFF and BiFPN_CBAM, the improved YOLO11 model maintained comparable detection accuracy for insulator defects while achieving a marked reduction in model size, demonstrating that the ShuffleNetV2 module effectively reduces model size and accomplishes model lightweighting.
The experimental results demonstrate that both the ASFF module and the BiFPN_CBAM significantly enhance the model’s performance. Specifically, the ASFF module strengthens the model’s feature extraction capability for multi-scale defective targets, thereby improving its detection capacity for diverse defect types. Meanwhile, the BiFPN_CBAM enables efficient cross-scale feature information flow, with the CBAM at the output stage effectively mitigating interference from complex backgrounds on the perception of critical insulator defect features. The synergistic interaction between ASFF and BiFPN_CBAM collectively elevates the detection accuracy of the improved model. Additionally, the incorporation of the ShuffleNetV2 module achieves model lightweighting, significantly reducing model size while preserving detection accuracy and enhancing generalization capability.
The synergistic integration of these three enhancements demonstrates marked superiority over both the baseline configuration and individual optimization approaches. The model achieves 97.0% precision in flaw identification, with a mean accuracy of 98.1% across all detection metrics.

3.6. Comparison of Detection Performance of Different Models

A benchmarking framework was established to assess the proposed model’s advancements. Multiple representative architectures—Faster R-CNN (convolutional neural network), DEYO-N, YOLOv5, YOLOv8, YOLOv9, YOLOv10, and the baseline YOLO11 implementation—were trained under identical conditions using the power line insulator defect dataset. The comparison evaluation mainly includes average precision (AP), mean average precision (mAP), F1-score, Mbyte, and model inference speed (FPS), as shown in Table 4.
The experimental results indicate that the improved model significantly outperforms the original Faster R-CNN, DEYO-N, YOLOv5, YOLOv8, YOLOv9, YOLOv10, and YOLO11 models across AP, mAP, and F1-score metrics, while maintaining a respectable FPS and effectively accomplishing recognition tasks. In summary, the enhanced model demonstrates remarkable effectiveness in detecting defects in distribution line insulators, achieving superior performance compared to the other seven algorithmic models.

4. Discussion

4.1. Practical Significance

In power systems, the accuracy of insulator defect detection is directly related to the fault leakage and misdetection rates. Although this improved model only improves the accuracy of insulator defect detection by 1.4%, it can reduce thousands of false positives in millions of image analyses, thus shortening the fault response time and reducing the cost of manual review. Insulator defects can cause tens of thousands of dollars in financial losses in a single fault, so a 1.4% improvement may seem limited, but hundreds of potential faults can be avoided when performing intense distribution line inspections with millions of image analyses, and millions in maintenance savings can be expected.

4.2. Limitations

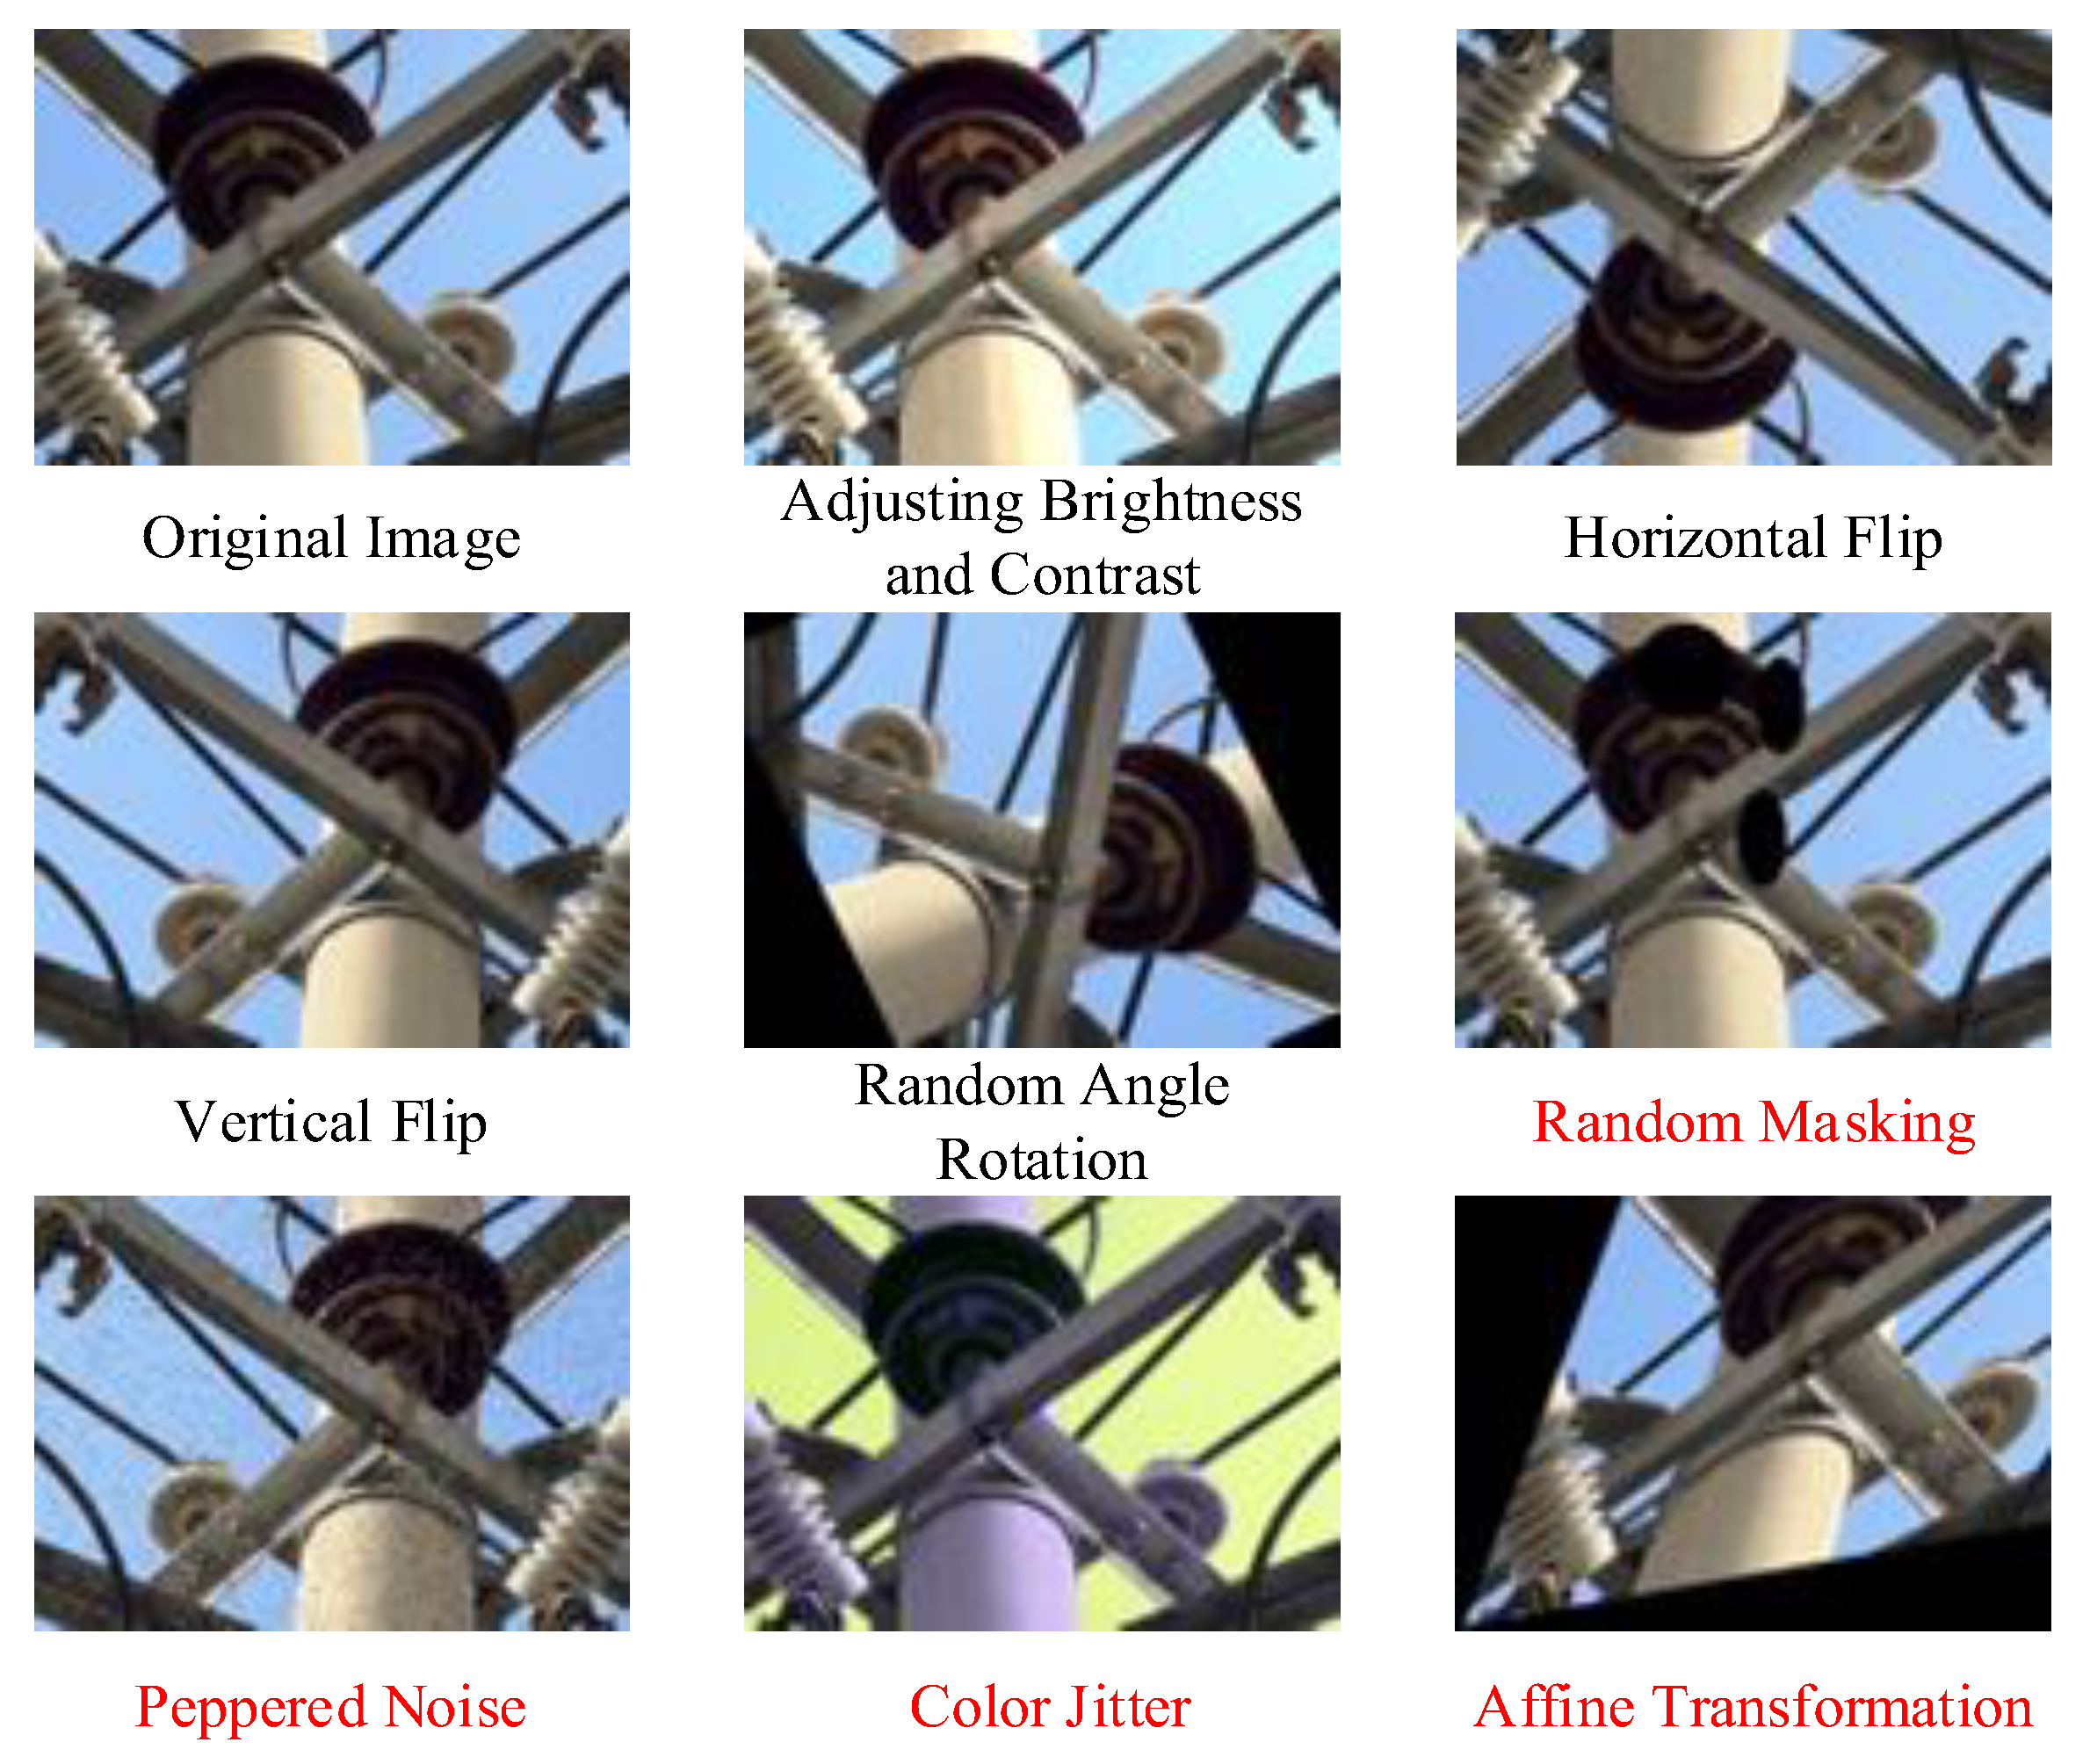
This study has the following three limitations at the data construction level: firstly, the dataset size is too small (only 1205 images after enhancement), which makes it difficult to adequately cover the various features of the target scene, and even if a data enhancement strategy is adopted, there may be a generalization bottleneck in the model detection performance for cross-scene testing. Secondly, there are constraints regarding the labeling of raw data. Due to the limited granularity of the labeling of damage types in the raw data, the sample size of some categories did not meet the requirement of statistical significance, and in order to ensure the consistency of the analysis, this study adopted a uniform naming convention for all the damage types, a treatment that may result in the loss of some of the detailed information. In addition, although a balanced strategy of 50% real data and 50% synthetic data was used to mitigate domain bias, due to the distributional differences between synthetic and real data, there may still be some domain gaps in practical applications, which may lead to model fitness problems.
In terms of model architecture, there are efficiency bottlenecks in the model. As shown in Table 3, the introduction of the ASFF and BiFPN_CBAMs increased the model parameter count from 5.23 Mb to 9.65 Mb. Although the ShuffleV2 lightweight module reduced the parameter count of the ASFF and BiFPN_CBAM-enhanced model from 9.65 Mb to 8.88 Mb, the overall improved model still occupies 3.65 Mb more than the baseline model. Additionally, as indicated in Table 4, the improved model exhibits a 1.33 FPS decrease compared to the original model. This suggests that while the improved model achieved a 1.4% accuracy gain in defect detection, the incorporation of ASFF and BiFPN_CBAMs introduces computational redundancy due to multi-scale feature fusion. Furthermore, the ShuffleV2 module demonstrates insufficient lightweight capability for mitigating the increased complexity caused by the ASFF and BiFPN_CBAMs.

4.3. Practical Deployment and Real-Time Analysis

Although the current experiments focus on improving algorithmic accuracy, the model’s lightweight design and single-stage detection architecture have laid the foundation for practical deployment. The compact structure of our model theoretically enables an inference speed of ≥82 FPS on equivalent hardware, meeting the real-time requirements of most inspection scenarios. In future deployments, detection speed and accuracy can be further balanced by optimizing the quantization of the multi-scale feature fusion module and refining lightweight module deployment strategies. Additionally, commonly used edge-computing techniques such as model pruning and hardware acceleration libraries are expected to reduce computational redundancy, decreasing inference latency by approximately 30%, thereby supporting real-time processing demands for drone platforms.
In practical deployment, considerations such as heterogeneous hardware adaptation and power consumption constraints must also be addressed. For instance, mobile devices may require further model compression to minimize energy consumption, while server-side deployments could leverage multi-GPU parallel processing for large-scale data handling. Although this study does not include hardware-specific testing, the algorithmic-level deployment optimizations provide critical support for engineering implementation. Subsequent collaborations with power enterprises will be conducted to validate full-chain deployment in real-world scenarios.

4.4. Future Work

To address the aforementioned limitations, future research will focus on improvements in three key directions: Firstly, expanding real-world defect datasets of power line insulators through scenario-specific data collection to gradually increase data scale and enhance model generalization. Secondly, establishing a cross-institutional data collaboration mechanism by developing a progressive training framework based on horizontal federated learning. Thirdly, exploring a co-optimized model that integrates attention-guided channel dynamic pruning with multi-scale feature refinement. Specifically, a channel dynamic pruning module will be designed to optimize computational redundancy in complex multi-scale feature fusion architectures, aiming to identify an optimal subnetwork structure that preserves critical parameters while eliminating non-essential computations. This approach targets efficiency–accuracy trade-offs in the enhanced model architecture.

5. Conclusions

In this paper, a defect detection algorithm for distribution line insulators based on improved YOLO11 is proposed. The algorithm enhances the multi-scale feature fusion capability of the model by introducing the ASFF module, optimizes the weighted fusion efficiency and attention focusing performance of the feature pyramid by using the BiFPN_CBAM structure, and realizes model lightweighting by using the ShuffleNetV2 module. The accuracy (AP) and mean average precision (mAP) of the improved model on the self-constructed distribution line insulator defects dataset reach 97.0% and 98.1%, respectively, which are 1.4% and 0.7% higher than in the original YOLO11 model.
The experimental results show that the proposed fusion model significantly improves the accuracy of insulator defect detection and reliably detects the different types of defects on distribution line insulators even in complex background detection environments. This improvement is a major breakthrough in insulator defect detection technology, emphasizing the ability of the target detection algorithm to operate effectively in complex environments, thus expanding its practical application in distribution line inspection work. The timely detection of insulator defects is a key link to ensure the safe and stable operation of the power system, and the efficient detection capability of the improved model can significantly reduce the potential risks caused by insulator defects, providing strong support for the safe operation and reliable power supply of the power industry.
However, the scope of the dataset used in this study is relatively limited, and future research needs to further increase the data on insulator defects of distribution lines in more complex scenarios and enlarge the dataset size to enhance the generalization ability of the model. Meanwhile, the optimization of real-time deployment of the model on embedded devices needs to be explored in the future to promote the practical application of intelligent grid inspection.

Author Contributions

Conceptualization, Y.J., D.Z. and Y.H.; methodology, Y.J.; software, Y.J.; validation, Y.J., D.Z. and J.Z.; formal analysis, Y.J.; investigation, D.Z. and Y.H.; resources, Y.H.; data curation, Y.H.; writing—original draft preparation, Y.J., X.D. and T.Z.; writing—review and editing, Y.J., D.Z. and J.Z.; visualization, J.Z. and X.D.; supervision, D.Z.; project administration, Y.J.; funding acquisition, Y.J. All authors have read and agreed to the published version of the manuscript.

Funding

This research was funded by State Grid Hebei Electric Power Provincial Company Science and Technology Project Fund Grant Project: research on the optimal design and application technology of the stable mounting and dual-mode motion obstacle avoidance structures for the flying and walking distribution of network inspection robots (kj2024-030).

Data Availability Statement

The dataset and code are unavailable due to contractual and legal restrictions. These resources were obtained under specific agreements that prohibit their dissemination, and therefore we cannot provide access to either the dataset or the source code.

Conflicts of Interest

Authors Yanpeng Ji, Da Zhang, Tuo Zhang and Jianli Zhao were employees of the Electric Power Research Institute of State Grid Hebei Electric Power Co., Ltd. Author Xin Duan was an employee of the State Grid Hebei Electric Power Co., Ltd. The authors declare that this study received funding from State Grid Hebei Electric Power Provincial Company Science and Technology.

Abbreviations

The following abbreviations are used in this manuscript:
ASFFAdaptively Spatial Feature Fusion
BiFPNBidirectional Feature Pyramid Network
CBAMConvolutional Block Attention Module
APAccuracy Precision
mAPMean Accuracy Precision
SVDSingular Value Decomposition
FSVDFuzzy Singular Value Decomposition
GKNEGaussian Kernelized Neutrosophic Entropy
FPNFeature Pyramid Network
CSPDCross-Stage Partial Dense
ECAEfficient Channel Attention
PANPath Aggregation Network
CAMChannel Attention Module
SAMSpatial Attention Module
TPTrue Positive
FPFalse Positive
TNTrue Negative
FNFalse Negative
AUC–ROCArea Under the ROC Curve
FPRFalse Positive Rate
TPRTrue Positive Rate
P-RPrecision–Recall

References

  1. McDonald, J.D.; Wojszczyk, B.; Flynn, B.; Voloh, I. Distribution systems, substations, and integration of distributed generation. In Electrical Transmission Systems and Smart Grids: Selected Entries from the Encyclopedia of Sustainability Science and Technology; Springer: New York, NY, USA, 2012; pp. 7–68. [Google Scholar]
  2. Kazmi, S.A.A.; Shahzad, M.K.; Khan, A.Z.; Shin, D.R. Smart distribution networks: A review of modern distribution concepts from a planning perspective. Energies 2017, 10, 501. [Google Scholar] [CrossRef]
  3. Ghaly, R.N.R.; Ibrahim, A.; Ghoneim, S.S.M.; Abu-Siada, A.; Bajaj, M.; Zaitsev, I.; Awad, H. Impact of atmospheric conditions on the flash-over voltage of the transmission line insulators using central composite design. Sci. Rep. 2024, 14, 22395. [Google Scholar] [CrossRef] [PubMed]
  4. Wang, R.; Ji, H.; Li, P.; Yu, H.; Zhao, J.; Zhao, L.; Zhou, Y.; Wu, J.; Bai, L.; Yan, J.; et al. Multi-resource dynamic coordinated planning of flexible distribution network. Nat. Commun. 2024, 15, 4576. [Google Scholar] [CrossRef] [PubMed]
  5. Alhassan, A.B.; Zhang, X.; Shen, H.; Xu, H. Power transmission line inspection robots: A review, trends and challenges for future research. Int. J. Electr. Power Energy Syst. 2020, 118, 105862. [Google Scholar] [CrossRef]
  6. Katrasnik, J.; Pernus, F.; Likar, B. A survey of mobile robots for distribution power line inspection. IEEE Trans. Power Deliv. 2009, 25, 485–493. [Google Scholar] [CrossRef]
  7. Shihab, U.A.; Apsaan, M.T.M.S.; Ahamed, M.F.; Razeeya, M.R.F.; Juhaniya, A.I.S. An Adaptive YOLO Model for Detection of Faulty Insulators in Power Transmission Network Using Unmanned Aerial Vehicle. In Proceedings of the 2023 Moratuwa Engineering Research Conference (MERCon), Moratuwa, Sri Lanka, 9–11 November 2023; pp. 282–287. [Google Scholar]
  8. Sadykova, D.; Pernebayeva, D.; Bagheri, M.; James, A. IN-YOLO: Real-time detection of outdoor high voltage insulators using UAV imaging. IEEE Trans. Power Deliv. 2019, 35, 1599–1601. [Google Scholar] [CrossRef]
  9. Lei, Y.; Yang, B.; Jiang, X.; Jia, F.; Li, N.; Nandi, A.K. Applications of machine learning to machine fault diagnosis: A review and roadmap. Mech. Syst. Signal Process. 2020, 138, 106587. [Google Scholar] [CrossRef]
  10. Hou, J.; Lu, X.; Zhong, Y.; He, W.; Zhao, D.; Zhou, F. A comprehensive review of mechanical fault diagnosis methods based on convolutional neural network. J. Vibroeng. 2024, 26, 44–65. [Google Scholar] [CrossRef]
  11. Luo, L.; Ma, R.; Li, Y.; Yang, F.; Qiu, Z. Image recognition technology with its application in defect detection and diagnosis analysis of substation equipment. Sci. Program. 2021, 2021, 2021344. [Google Scholar] [CrossRef]
  12. Ameri, R.; Hsu, C.C.; Band, S.S. A systematic review of deep learning approaches for surface defect detection in industrial applications. Eng. Appl. Artif. Intell. 2024, 130, 107717. [Google Scholar] [CrossRef]
  13. Cheng, Y.; Liu, D. An Image-Based Deep Learning Approach with Improved DETR for Power Line Insulator Defect Detection. J. Sens. 2022, 2022, 6703864. [Google Scholar] [CrossRef]
  14. Bhalla, K.; Huang, Y.-P. A Modified Singular Value Decomposition Kernelized Neutrosophic Entropy Method for TFT-LCD Panel Defect Segmentation. In Proceedings of the 2022 IEEE International Conference on Systems, Man, and Cybernetics (SMC), Prague, Czech Republic, 9–12 October 2022; pp. 248–253. [Google Scholar]
  15. Ning, P.; Jin, J.; Xu, Y.; Kong, C.; Zhang, C.; Tang, D.; Huang, J.; Xu, Z.; Li, T. Enhanced Detection of Glass Insulator Defects Using Improved Generative Modeling and Faster RCNN. Procedia CIRP 2024, 129, 31–36. [Google Scholar] [CrossRef]
  16. Wu, Q.; An, J. An active contour model based on texture distribution for extracting inhomogeneous insulators from aerial images. IEEE Trans. Geosci. Remote Sens. 2013, 52, 3613–3626. [Google Scholar] [CrossRef]
  17. Li, R.; Yang, Y.; Li, N.; Zhang, W.; Zhang, G.; Yang, Y. Transmission line pin detection based on improved SSD. In Proceedings of the AIIPCC 2022, The Third International Conference on Artificial Intelligence, Information Processing and Cloud Computing, Online, 21–22 June 2022; pp. 1–6. [Google Scholar]
  18. Ahmed, M.; Mohanta, J.; Sanyal, A. Inspection and identification of transmission line insulator breakdown based on deep learning using aerial images. Electr. Power Syst. Res. 2022, 211, 108199. [Google Scholar] [CrossRef]
  19. Tomaszewski, M.; Gasz, R.; Kasana, S.S.; Osuchowski, J.; Singh, S.; Zator, S. TCIP: Transformed Colour Intensity Profiles analysis for fault detection in power line insulators. Multimed. Tools Appl. 2024. [Google Scholar] [CrossRef]
  20. Zhang, N.; Yang, G.; Wang, D.; Hu, F.; Yu, H.; Fan, J. A Defect Detection Method for Substation Equipment Based on Image Data Generation and Deep Learning. IEEE Access 2024, 12, 105042–105054. [Google Scholar] [CrossRef]
  21. Jiang, X.; Zhuang, X.; Chen, J.; Zhang, J.; Zhang, Y. YOLOv8-MU: An Improved YOLOv8 Underwater Detector Based on a Large Kernel Block and a Multi-Branch Reparameterization Module. Sensors 2024, 24, 2905. [Google Scholar] [CrossRef]
  22. Wu, Y.; Xiao, F.; Liu, F.; Sun, Y.; Deng, X.; Lin, L.; Zhu, C. A Visual Fault Detection Algorithm of Substation Equipment Based on Improved YOLOv5. Appl. Sci. 2023, 13, 11785. [Google Scholar] [CrossRef]
  23. Liu, J.; Liu, C.; Wu, Y.; Xu, H.; Sun, Z. An improved method based on deep learning for insulator fault detection in diverse aerial images. Energies 2021, 14, 4365. [Google Scholar] [CrossRef]
  24. Han, G.; He, M.; Gao, M.; Yu, J.; Liu, K.; Qin, L. Insulator breakage detection based on improved YOLOv5. Sustainability 2022, 14, 6066. [Google Scholar] [CrossRef]
  25. Su, J.; Yuan, Y.; Przystupa, K.; Kochan, O. Insulator defect detection algorithm based on improved YOLOv8 for electric power. Signal Image Video Process. 2024, 18, 6197–6209. [Google Scholar] [CrossRef]
  26. Ru, C.; Zhang, S.; Qu, C.; Zhang, Z. The high-precision detection method for insulators’ self-explosion defect based on the unmanned aerial vehicle with improved lightweight ECA-YOLOX-Tiny model. Appl. Sci. 2022, 12, 9314. [Google Scholar] [CrossRef]
  27. Jegham, N.; Koh, C.Y.; Abdelatti, M.; Hendawi, A. Evaluating the Evolution of YOLO (You Only Look Once) Models: A Comprehensive Benchmark Study of YOLO11 and Its Predecessors. arXiv 2024, arXiv:2411.00201. [Google Scholar]
  28. Ali, M.L.; Zhang, Z. The YOLO framework: A comprehensive review of evolution, applications, and benchmarks in object detection. Computers 2024, 13, 336. [Google Scholar] [CrossRef]
  29. Khanam, R.; Hussain, M. YOLOv11: An overview of the key architectural enhancements. arXiv 2024, arXiv:2410.17725. [Google Scholar]
  30. Liu, S.; Huang, D.; Wang, Y. Learning spatial fusion for single-shot object detection. arXiv 2019, arXiv:1911.09516. [Google Scholar]
  31. Tan, M.; Pang, R.; Le, Q.V. EfficientDet: Scalable and Efficient Object Detection. In Proceedings of the 2020 IEEE/CVF Conference on Computer Vision and Pattern Recognition (CVPR), Seattle, WA, USA, 13–19 June 2020; pp. 10778–10787. [Google Scholar]
  32. Woo, S.; Park, J.; Lee, J.Y.; Kweon, I.S. Cbam: Convolutional block attention module. In Proceedings of the European Conference on Computer Vision (ECCV), Munich, Germany, 8–14 September 2018; pp. 3–19. [Google Scholar]
  33. Ma, N.; Zhang, X.; Zheng, H.T.; Sun, J. Shufflenet v2: Practical guidelines for efficient cnn architecture design. In Proceedings of the European Conference on Computer Vision (ECCV), Munich, Germany, 8–14 September 2018; pp. 116–131. [Google Scholar]
Figure 1. The model architecture after improvement of YOLO11.
Electronics 14 01201 g001
Figure 2. The schematic diagram of ASFF.
Electronics 14 01201 g002
Figure 3. The structural diagram of BiFPN and improved BiFPN. (a) BiFPN; (b) improved BiFPN.
Electronics 14 01201 g003
Figure 4. The schematic diagram of CBAM attention mechanism.
Electronics 14 01201 g004
Figure 5. The core structure of ShuffleNetV2. (a) Basic module; (b) downsampling module; (c) group convolution; (d) channel shuffle.
Electronics 14 01201 g005
Figure 6. Complex background data in a portion of the dataset.
Electronics 14 01201 g006
Figure 7. Data-enhanced rendering.
Electronics 14 01201 g007
Figure 8. The loss value change curve during training.
Electronics 14 01201 g008
Figure 9. The P-R curve of the improved YOLO11.
Electronics 14 01201 g009
Figure 10. The AUC–ROC of the improved YOLO11.
Electronics 14 01201 g010
Figure 11. The confusion matrix of the improved YOLO11.
Electronics 14 01201 g011
Figure 12. The effectiveness of dataset prediction results.
Electronics 14 01201 g012
Table 1. Self-built insulator defect detection dataset partition table for power distribution lines.
Insulator DatasetNumber of DataTags
InsulatorDamage
Training set (90%)90410591378
Validation set (10%)101231305
Test set (200 no tags)200--
Table 2. The detection performance comparison of YOLO11 with incorporated different attention mechanisms.
ModelAdd ModuleInsulator Average
Precision
Damage Average
Precision
Mean Average
Precision (mAP)
F1Mbyte
BiFPN_SEBiFPN_CABiFPN_CBAM
YOLO11---0.9930.9560.9740.9535.23
--0.9930.9530.9730.9555.44
--0.9920.9530.9720.9545.42
--0.9910.9600.9760.9606.38
Table 3. The ablation study results of the improved YOLO11 model.
ModelAdd ModuleInsulator Average
Precision
Damage Average
Precision
Mean Average
Precision (mAP)
F1Mbyte
ASFFBiFPN_CBAMShuffle-Netv2
YOLO11---0.9930.9560.9740.9535.23
--0.9920.9660.9790.9658.50
--0.9910.9600.9760.9606.38
--0.9920.9550.9730.9604.46
-0.9940.9700.9820.9789.65
0.9930.9700.9810.9758.88
Table 4. The comparison of different model detection results.
ModelInsulator Average PrecisionDamage Average PrecisionMean Average Precision (mAP)F1MbyteFPS
Faster R-CNN0.9900.9100.9500.91010.7672.37
DEYO-N0.9940.9520.9730.9517.8677.83
YOLOv50.9920.9480.9700.9444.4581.86
YOLOv80.9930.9520.9720.9475.3881.80
YOLOv90.9940.9500.9720.94941.2849.74
YOLOv100.9920.9530.9730.95039.5057.50
YOLO110.9930.9560.9740.9535.2383.76
Improved YOLO110.9930.9700.9810.9758.8882.43
Disclaimer/Publisher’s Note: The statements, opinions and data contained in all publications are solely those of the individual author(s) and contributor(s) and not of MDPI and/or the editor(s). MDPI and/or the editor(s) disclaim responsibility for any injury to people or property resulting from any ideas, methods, instructions or products referred to in the content.

