1. Introduction
With SSI, a hacker creates a chain of compromised hosts (stepping-stone hosts), employs the tool ssh to login to each of the stepping-stone hosts in the chain, and then sends the attacking commands to the victim host [
1,
2,
3,
4,
5,
6,
7].
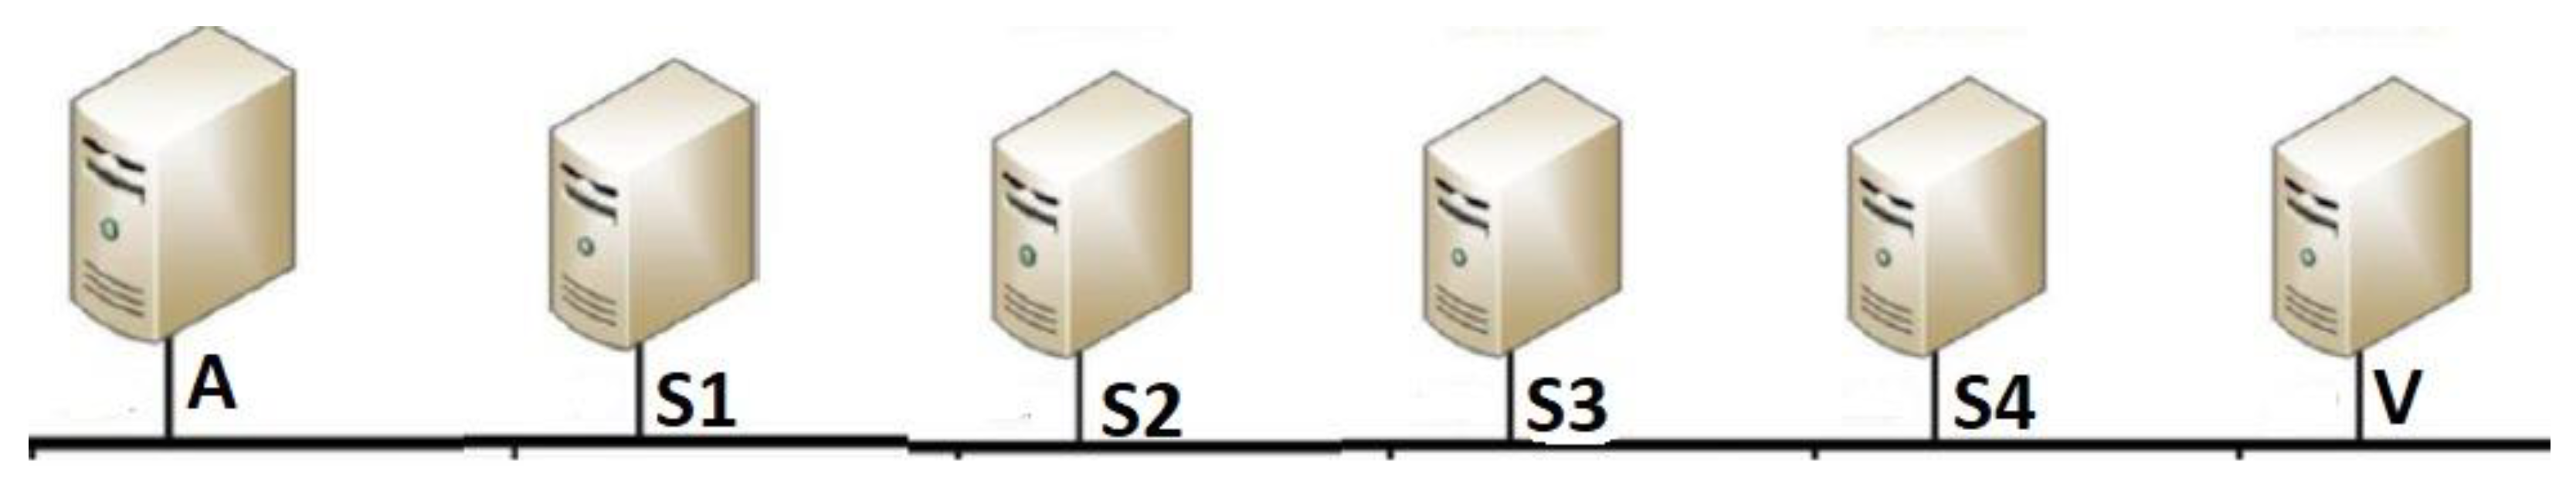
Figure 1 shows a sample of a connection chain with five connections. In this figure, host A is the attack host, whereas host V serves as the victim host. In turn, the attacker remotely logins to the stepping-stone hosts S1, S2, S3, and S4, and eventually to the victim. To perform SSID, any stepping-stone host between the attacker A and the victim host V can be used as the sensor host to capture network packets using certain tools such as tcpdump or Wireshark. Assume that host S2 is selected as the sensor host. The connections from the intruder A to host S1, and then to the sensor S2, form the upstream sub-chain, whereas the connections from S2 to host S3 to host S4 and finally to the victim V form the downstream sub-chain.
The goal for detecting SSI is to decide whether a stepping-stone host is used by an attacker for a network intrusion [
1,
2,
3]. The session is a network intrusion detected at the sensor host if an ingress connection to the sensor matches one of its outbound connections from the sensor. With stepping-stone intrusion, it is extremely tough to detect the intruder as it is hidden behind a long communication session [
1,
2,
3]. The difficulty for the final victim host V to obtain information about the origin of the attack has been well documented in the literature of this area.
Nowadays, attackers often send hacking commands using techniques such as chaff perturbation to manipulate the communication session, that is, injecting some meaningless packets into a TCP data stream. The purpose for performing this is to decrease the probability of being caught. SSI with chaff perturbation is also referred to as a chaff attack. Through a chaff attack, intruders can not only revise the packets’ round-trip times (RTTs) but can also change the packet count for those sent from the attacker host to the victim. With chaff attacks, most of the existing detection approaches for SSI may be defeated by hackers. Today, chaff-attacking techniques have been widely used in various cyberattacks.
A widely used type of detection method for SSI is to find if an outbound connection departing from the sensor matches with an ingress connection into the sensor [
1,
2]. If so, it is highly suspicious that the sensor host is used as a stepping-stone host. With this type of SSID approach, all the network packets are captured and analyzed only at the selected sensor host; thus, it is called host-based SSID [
8].
Figure 2 below shows a scenario for deciding if the host H1 is used as a stepping-stone one. The basic idea here is that if host H1 is used as a stepping-stone host, some other host must be under attack presumably via host H1, although this detection method may bring false positive errors.
In
Figure 2, H1 is the sensor host. This figure shows a scenario where
Cin is an incoming connection from its upstream hosts (up to the attacker machine) and
Cout is an outgoing connection that goes to its downstream hosts until it reaches the victim machine. If
Cin and
Cout are proved to be a relayed pair of connections, then host H1 is used as a stepping stone. In the incoming connection
Cin, there are two streams,
Si and
Ej, where
Si represents the request packets stream, which is also called ‘Send packets from the attacker to the victim’, whereas
Ej represents the response packets stream, which is also called ‘Echo packets from the victim back to the attacker host’. Similarly, the two streams
and
are obtained from the outgoing connection
Cout.
Many such methods for SSI have been proposed in the literature. The work [
1] is the first paper in this area for unencrypted network traffic. The conclusion of [
1] states that, if there is such a relayed pair of connections, the sensor host is used as a stepping stone. The detection algorithm proposed in [
1] is easy to implement and also quite efficient. The primary issue for the content thumbprint is that it is hard to obtain packets’ contents if the connection is established using encrypted tools, such as SSH or OpenSSH. Thus, this method for detecting SSI based on packet contents can be easily defeated by establishing an encrypted session.
A time thumbprint is an approach proposed by Y. Zhang and V. Paxson [
2] in 2000 to detect SSI when the network traffic is encrypted. The time thumbprint approach can overcome the difficulty existing in a content thumbprint. The main reason is that, instead of using the packet content, this approach uses the timestamp of each captured packet to define the time thumbprint. Since the timestamp of each packet is not encrypted, and also only relies on the local host system time clock, this approach is not only stable and reliable but also cannot be affected by the clock skew issue. However, the time thumbprint approach can be easily defeated by chaff attacks as intruders’ session manipulation can change the timestamps of network packets.
The use of encrypted sessions by intruders makes SSID much more complicated, and the intruder’s active timing perturbation and injection of chaff packets by attackers make the SSI detection process even more difficult. The use of packet count was proposed in [
4] and [
5] by T. He et al. to handle such SSID challenges. The paper [
5] is the extended version of the paper [
4]. These two papers proposed strategies for identifying stepping-stone connections when the network traffic is encrypted, and the timestamps of packets are perturbed or chaff packets are injected into an attacking stream. Two activity-based algorithms are proposed to detect stepping-stone connections with either bounded memory or bounded delay perturbation, respectively. More details of these host-based detection methods will be reviewed and discussed in the next section.
Most of these known host-based detection algorithms for SSI only worked effectively for network traffic without intruders’ session manipulation. When session manipulation such as chaff perturbation or time jittering by intruders is present, however, these known hosted-based SSID algorithms are either weak to resisting intruders’ manipulation or have a very limited capability in resisting attacker’s manipulation.
This paper develops an innovative host-based algorithm for SSID that is effective for detecting SSI and resistant to intruders’ chaff perturbation through matching TCP packets by using packet crossover. Our proposed detection algorithm can be simply implemented as the ratios of packet crossover used in this paper can be quickly computed. Well-designed network experiments are conducted to verify the correctness of the proposed method for SSI. The experimental results that we obtained exhibit that the proposed approach for SSI in this paper works in resisting intruders’ chaff attacks effectively.
The rest of this paper is organized as follows: related work of this paper is presented in
Section 2. Preliminary knowledge of basic concepts is given in
Section 3. In
Section 4, we give an effective SSID algorithm to determine whether a host is used as a stepping stone for network traffic with chaffed meaningless packets via using the occurrences of packet crossover. In
Section 5, we design and conduct network experiments to verify the correctness of Proposition 1, which is a theoretical basis of the proposed SSID algorithm.
Section 6 concludes this paper and gives some discussion of future research directions in the SSID area.
5. Network Experimental Results and Analysis
In this section, we design and implement network experiments to verify the correctness of Proposition 1 described in
Section 4 by comparing the packet crossover ratios of incoming and outgoing connections. Relayed pairs typically result in almost equal packet crossover ratios. On the other hand, non-relayed pairs of connections typically result in dissimilar packet crossover ratios.
To set up our experimental environment, we created a connection from a local computer (localhost-1) in our computer lab at Columbus State University (Columbus, GA, USA) to four remote Amazon AWS servers, aws-servers 1 through 4, which were then connected back to another local host (localhost-2) in the same computer lab in our university. A chain of five connections was created from the attacker host localhost-1 to the victim host localhost-2 through the four stepping stones: aws-servers 1 through 4. Linux was running in each of these six hosts, which had both the SSH client and server installed in each host. AWS2 served as the sensor host. We used the tool tcpdump to capture all the network packets at the sensor host.
The corresponding actual geographic locations and their corresponding public IP addresses of the four AWS servers (aws-servers 1 through 4) are listed in
Table 1. Both the incoming packets to the sensor host AWS2 and the outgoing packets from AWS2 were monitored and captured at the sensor host.
For this experiment, we used four virtual servers on the Amazon AWS cloud, except for the two local hosts that we used in our computer labs. It is well known that a virtual machine server runs on the top of another physical computer server. If the virtual servers are replaced by physical computer servers located in each of the specific cities that we selected, the RTTs of captured network packets will be reduced slightly. However, the number of packet crossovers will remain the same, and so will the packet crossover ratios. Therefore, the replacement of four virtual servers with physical computer servers does not affect the results of this experiment.
After the connection chain was established, both the incoming and outgoing connections of the sensor host AWS2 were monitored, and the packets were captured using the tcpdump tool running at the sensor host AWS2.
In the first experiment that we conducted, network traffic without chaffed meaningless packets was captured and analyzed. With this experiment, we first entered the following Attacker 1 script of standard Linux commands for about 3 min into a terminal on the attacker localhost-1 and captured all packets from the indicated connections at the sensor AWS2:
//Attacker 1 script
pwd
whoami
sudo su
ls
cd/etc
ls −a
scp −p shadow attacker username@attacker IP:/home/seed/Documents
exit
By running the Attacker 1 script for about 3 min, we captured 10 datasets in total at the sensor host AWS2, with each dataset comprising two files: one for the incoming connection to the sensor host and the other one for the outgoing connection from the sensor host. On average, over the 10 datasets, we captured 514 packets from the incoming connection to AWS2 and 514 packets from the outgoing connection from AWS2.
After capturing all the data, we ran our packet crossover ratio algorithm to calculate the packet crossover ratio observed at the sensor AWS2 from the incoming connection represented by i1 for the above script (refer to
Figure 4). In
Table 2, CR stands for crossover ratio. Column 1 of
Table 2 lists the number of each dataset. Column 2 of
Table 2 lists the crossover ratio (CR) of the incoming connection i1 for each dataset. Then, we ran the packet crossover ratio algorithm to calculate the packet crossover ratio observed at the sensor AWS2 from the corresponding outgoing connection represented by o1 (refer to
Figure 4). Column 3 of
Table 2 lists the crossover ratio (CR) of the outgoing connection o1 for each dataset.
Next, we entered the following Attacker 2 script of standard Linux commands different from Attacker 1 for about 3 min into a terminal at the attacker localhost-1 and captured all packets from the indicated connections at the sensor host AWS2:
//Attacker 2 script
whoami
pwd
cd/home/seed/Documents
ls
nano text_file.txt
//paste a large text and save it
ls
cat hello.txt
exit
By running the Attacker 2 script for about 3 min, we captured 10 datasets in total at the sensor host AWS2, with each dataset comprising two files: one for the incoming connection to the sensor host and the other one for the outgoing connection from the sensor host. On average, over the 10 datasets, we captured 338 packets from the incoming connection to AWS2 and 338 packets from the outgoing connection from AWS2.
After capturing all the data, we ran our packet crossover ratio algorithm to calculate the packet crossover ratio observed at the sensor AWS2 from the incoming connection represented by i2 for the above script (refer to
Figure 5). Column 5 of
Table 2 lists the crossover ratio (CR) of the incoming connection i2 for each dataset. Then, we ran the packet crossover ratio algorithm to calculate the packet crossover ratio observed at the sensor AWS2 from the corresponding outgoing connection represented by o2 (refer to
Figure 5). Column 6 of
Table 2 lists the crossover ratio (CR) of the outgoing connection o2 for each dataset.
We then used the packet crossover ratios that we obtained to match the incoming and outgoing connections. Based on Proposition 1 above, the packet crossover ratios captured at a given sensor for the incoming and outgoing connections of a relayed pair should be close to 1. Therefore, we expected to see a matching of close to 1 for ratio i1/o1 in Column 4 of
Table 2, as well as a matching for ratio i2/o2 close to 1 in Column 7 of
Table 2. Moreover, we expected to see from this table a matching not close to 1 for non-relayed connection pairs, such as i1 and o2 (or i2 and o1). This table compares the CR of i1 to its respective outgoing connection o1. The CRs of relayed pairs should be very similar. Therefore, the incoming connection’s CR divided by the outgoing connection’s CR should and does equal approx. 1 in Columns 4 and 7 of
Table 2.
Now, let us calculate standard deviations to back our claim, Proposition 1 described in
Section 4. In column 4 of
Table 2, the mean of the ratio i1/o1 over the 10 datasets is µ(i1/o1) = 1.034. Its standard deviation is 0.065, which is very low. In column 7 of
Table 2, the mean of the ratio i2/o2 over the 10 datasets is µ(i2/o2) = 0.994. Its standard deviation is 0.016, which is also very low. These low values of standard deviations further verify the correctness of Proposition 1 when there are no chaffed meaningless packets in the network traffic.
In the second experiment that we conducted, network traffic with meaningless packets chaffed at a rate of 10% was captured and analyzed. We performed all the same steps as carried out for the first experiment above for network traffic without chaffed packets. We entered the scripts of Attacker 1 and Attacker 2, respectively, for about 3 min for each script into a terminal on the attacker localhost-1 and captured all packets from the indicated connections at the sensor AWS2. Similarly, the same packet crossover ratio algorithm was employed to compute the packet crossover ratio using the captured packets with a 10% chaff rate at the sensor host. Our results for the second experiment are listed in
Table 3 below, and are very similar to our results for the first experiment without chaffed meaningless packets (refer to
Table 2).
Now, let us calculate standard deviations to back Proposition 1 for this experiment. In column 4 of
Table 3, the mean of the ratio i1/o1 over the 10 datasets is µ(i1/o1) = 1.013. Its standard deviation is 0.032, which is very low. In column 7 of
Table 3, the mean of the ratio i2/o2 over the 10 datasets is µ(i2/o2) = 1.001. Its standard deviation is 0.017, which is also very low. These low values of standard deviations further verify the correctness of Proposition 1 when the chaff rate is 10%.
In the third experiment that we conducted, network traffic with meaningless packets chaffed at a rate of 50% was captured and analyzed. We performed all the same steps as carried out for the first experiment above for network traffic without chaffed packets. We entered the scripts of Attacker 1 and Attacker 2, respectively, for about 3 min for each script into a terminal on the attacker localhost-1 and captured all packets from the indicated connections at the sensor AWS2. Similarly, the same packet crossover ratio algorithm was employed to compute the packet crossover ratio using the captured packets with a 50% chaff rate at the sensor host. Our results for this experiment are listed in
Table 4 below, and are also very similar to our results for the first experiment without chaffed meaningless packets (refer to
Table 2).
Now, let us calculate standard deviations to back Proposition 1 for this experiment. In column 4 of
Table 4, the mean of the ratio i1/o1 over the 10 datasets is µ(i1/o1) = 1.002. Its standard deviation is 0.01, which is very low. In column 7 of
Table 4, the mean of the ratio i2/o2 over the 10 datasets is µ(i2/o2) = 1.008. Its standard deviation is 0.016, which is also very low. These low values of standard deviations further verify the correctness of Proposition 1 when the chaff rate is 50%.
Next, let us use the same datasets that we captured by running the above Attacker 1 script to compare the performance of the SSID algorithm that we proposed in this paper with the SSID method developed in [
6] by A. Blum et al. We compare the detection accuracies of these two SSID algorithms in the following three different scenarios of network traffic:
- (1)
Captured network traffic with no chaffed meaningless packets;
- (2)
Captured network traffic with 10% chaff rate;
- (3)
Captured network traffic with 50% chaff rate.
For the first scenario of network traffic with no chaff, according to the experimental data in
Table 2 and the analysis that we performed on column 4 (the ratio i1/o1) and column 7 (the ratio i2/o2) of
Table 2, with their standard deviations of 0.065 and 0.016, respectively, our proposed SSID algorithm detected the relayed connection pair for each of the 10 datasets. Therefore, the detection accuracy of our proposed SSID algorithm is 100%, as shown in
Table 5 below. Now, we analyze the detection accuracy of the SSID method developed in [
6] for this scenario. Let us assume that the maximum tolerable delay bound Δ = 1000 ms. For the first dataset that we captured by running the Attacker 1 script, the maximum number of packets that may be sent in the time interval Δ is
pΔ = 4. The difference in the number of packets of the two streams never exceeds the packet bound 4. The SSID algorithm in [
6] detected the attacking pair for the first dataset, and the same is true for the remaining nine datasets. Thus, the detection accuracy of the SSID algorithm in [
6] is 100%, as shown in
Table 5 below.
For the second scenario of network traffic with a 10% chaff rate, according to the experimental data in
Table 3 and the analysis that we performed on column 4 (the ratio i1/o1) and column 7 (the ratio i2/o2) of
Table 3, with their standard deviations of 0.032 and 0.017, respectively, our proposed SSID algorithm detected the relayed connection pair for each of the 10 datasets. Therefore, the detection accuracy of our proposed SSID algorithm is 100%, as shown in
Table 5 below. Now, we analyze the detection accuracy of the algorithm for detection with chaff described in Section 5.1 of [
6] for this scenario. Let us assume that the maximum tolerable delay bound Δ = 1000 ms. For the first dataset that we captured by running the Attacker 1 script, the maximum number of packets that may be sent in the time interval Δ is
pΔ = 4. The difference in the number of packets of the two streams never exceeds 2
pΔ = 8. The SSID algorithm in Section 5.1 of [
6] detected the attacking pair for the first dataset, and the same is true for the remaining nine datasets. Thus, its detection accuracy over the 10 datasets is 100%, as shown in
Table 5 below.
For the third scenario of network traffic with a 50% chaff rate, according to the experimental data in
Table 4 and the analysis that we performed on column 4 (the ratio i1/o1) and column 7 (the ratio i2/o2) of
Table 4, with their standard deviations of 0.01 and 0.016, respectively, our proposed SSID algorithm detected the relayed connection pair for each of the 10 datasets. Therefore, the detection accuracy of our proposed SSID algorithm is 100%, as shown in
Table 5 below. Now, we analyze the detection accuracy of the algorithm for detection with chaff described in Section 5.1 of [
6] for this scenario. Let us assume that the maximum tolerable delay bound Δ = 1000 ms. For the first dataset that we captured by running the Attacker 1 script, the maximum number of packets that may be sent in the time interval Δ is
pΔ = 6. The difference in the number of packets of the two streams never exceeds 2
pΔ = 12. The SSID algorithm in Section 5.1 of [
6] detected the attacking pair for the first dataset, and another 6 out of the 10 datasets, but it failed to detect the attacking pair for the remaining 3 datasets. Thus, its detection accuracy over the 10 datasets is 70%, as shown in
Table 5 below.
We summarize the detection accuracy comparison between these two SSID algorithms in
Table 5 below. The data shown in
Table 5 are the detection accuracies over the 10 captured datasets for each of these two SSID algorithms. From the data in this table, we conclude that our SSID algorithm proposed in this paper outperforms the detection method developed in [
6] when the chaff rate is large.


