1. Introduction
Recent advancements in deep learning have catalyzed substantial breakthroughs in image generation, showcasing remarkable potential across domains such as object detection, scene understanding, and security monitoring [
1,
2,
3]. These algorithms have achieved unparalleled realism in image generation, significantly broadening the possibilities for image-processing applications. Although image generation quality continues to improve, the development of corresponding quality assessment methods has lagged, presenting a critical bottleneck in the progress of this field.
A particularly pertinent application of deep learning and advanced image processing techniques is infrared image colorization. This process transforms infrared thermal images captured by sensors into color and visible light images that are more aligned with human visual perception [
4]. Accurate quality assessment of these colorized images is essential for various applications, including security and surveillance nightvision systems, autonomous vehicle navigation, and medical diagnosis. Misinterpretations arising from subpar colorization can lead to serious consequences in these fields. Colorized outputs significantly enhance information richness compared to their infrared counterparts, improving both human visual comfort and the accuracy of environmental perception [
5,
6]. To achieve effective colorization, multiple deep learning-based algorithms have been developed, each presenting unique strengths and weaknesses. One notable example is CycleGAN [
7], which employs a cycle-consistent adversarial network to learn mappings between the infrared and visible domains without the need for paired training data. While CycleGAN is capable of generating plausible color information, it can also introduce issues such as color bleeding and unrealistic texture artifacts. To mitigate these challenges, innovative methodologies such as QS-Attn [
8] have been proposed, which incorporate query-selected attention mechanisms. These mechanisms enhance the capacity of the network to capture long-range dependencies and selectively focus on pertinent information during the colorization process, resulting in improved color consistency and sharper details. TIV-Net [
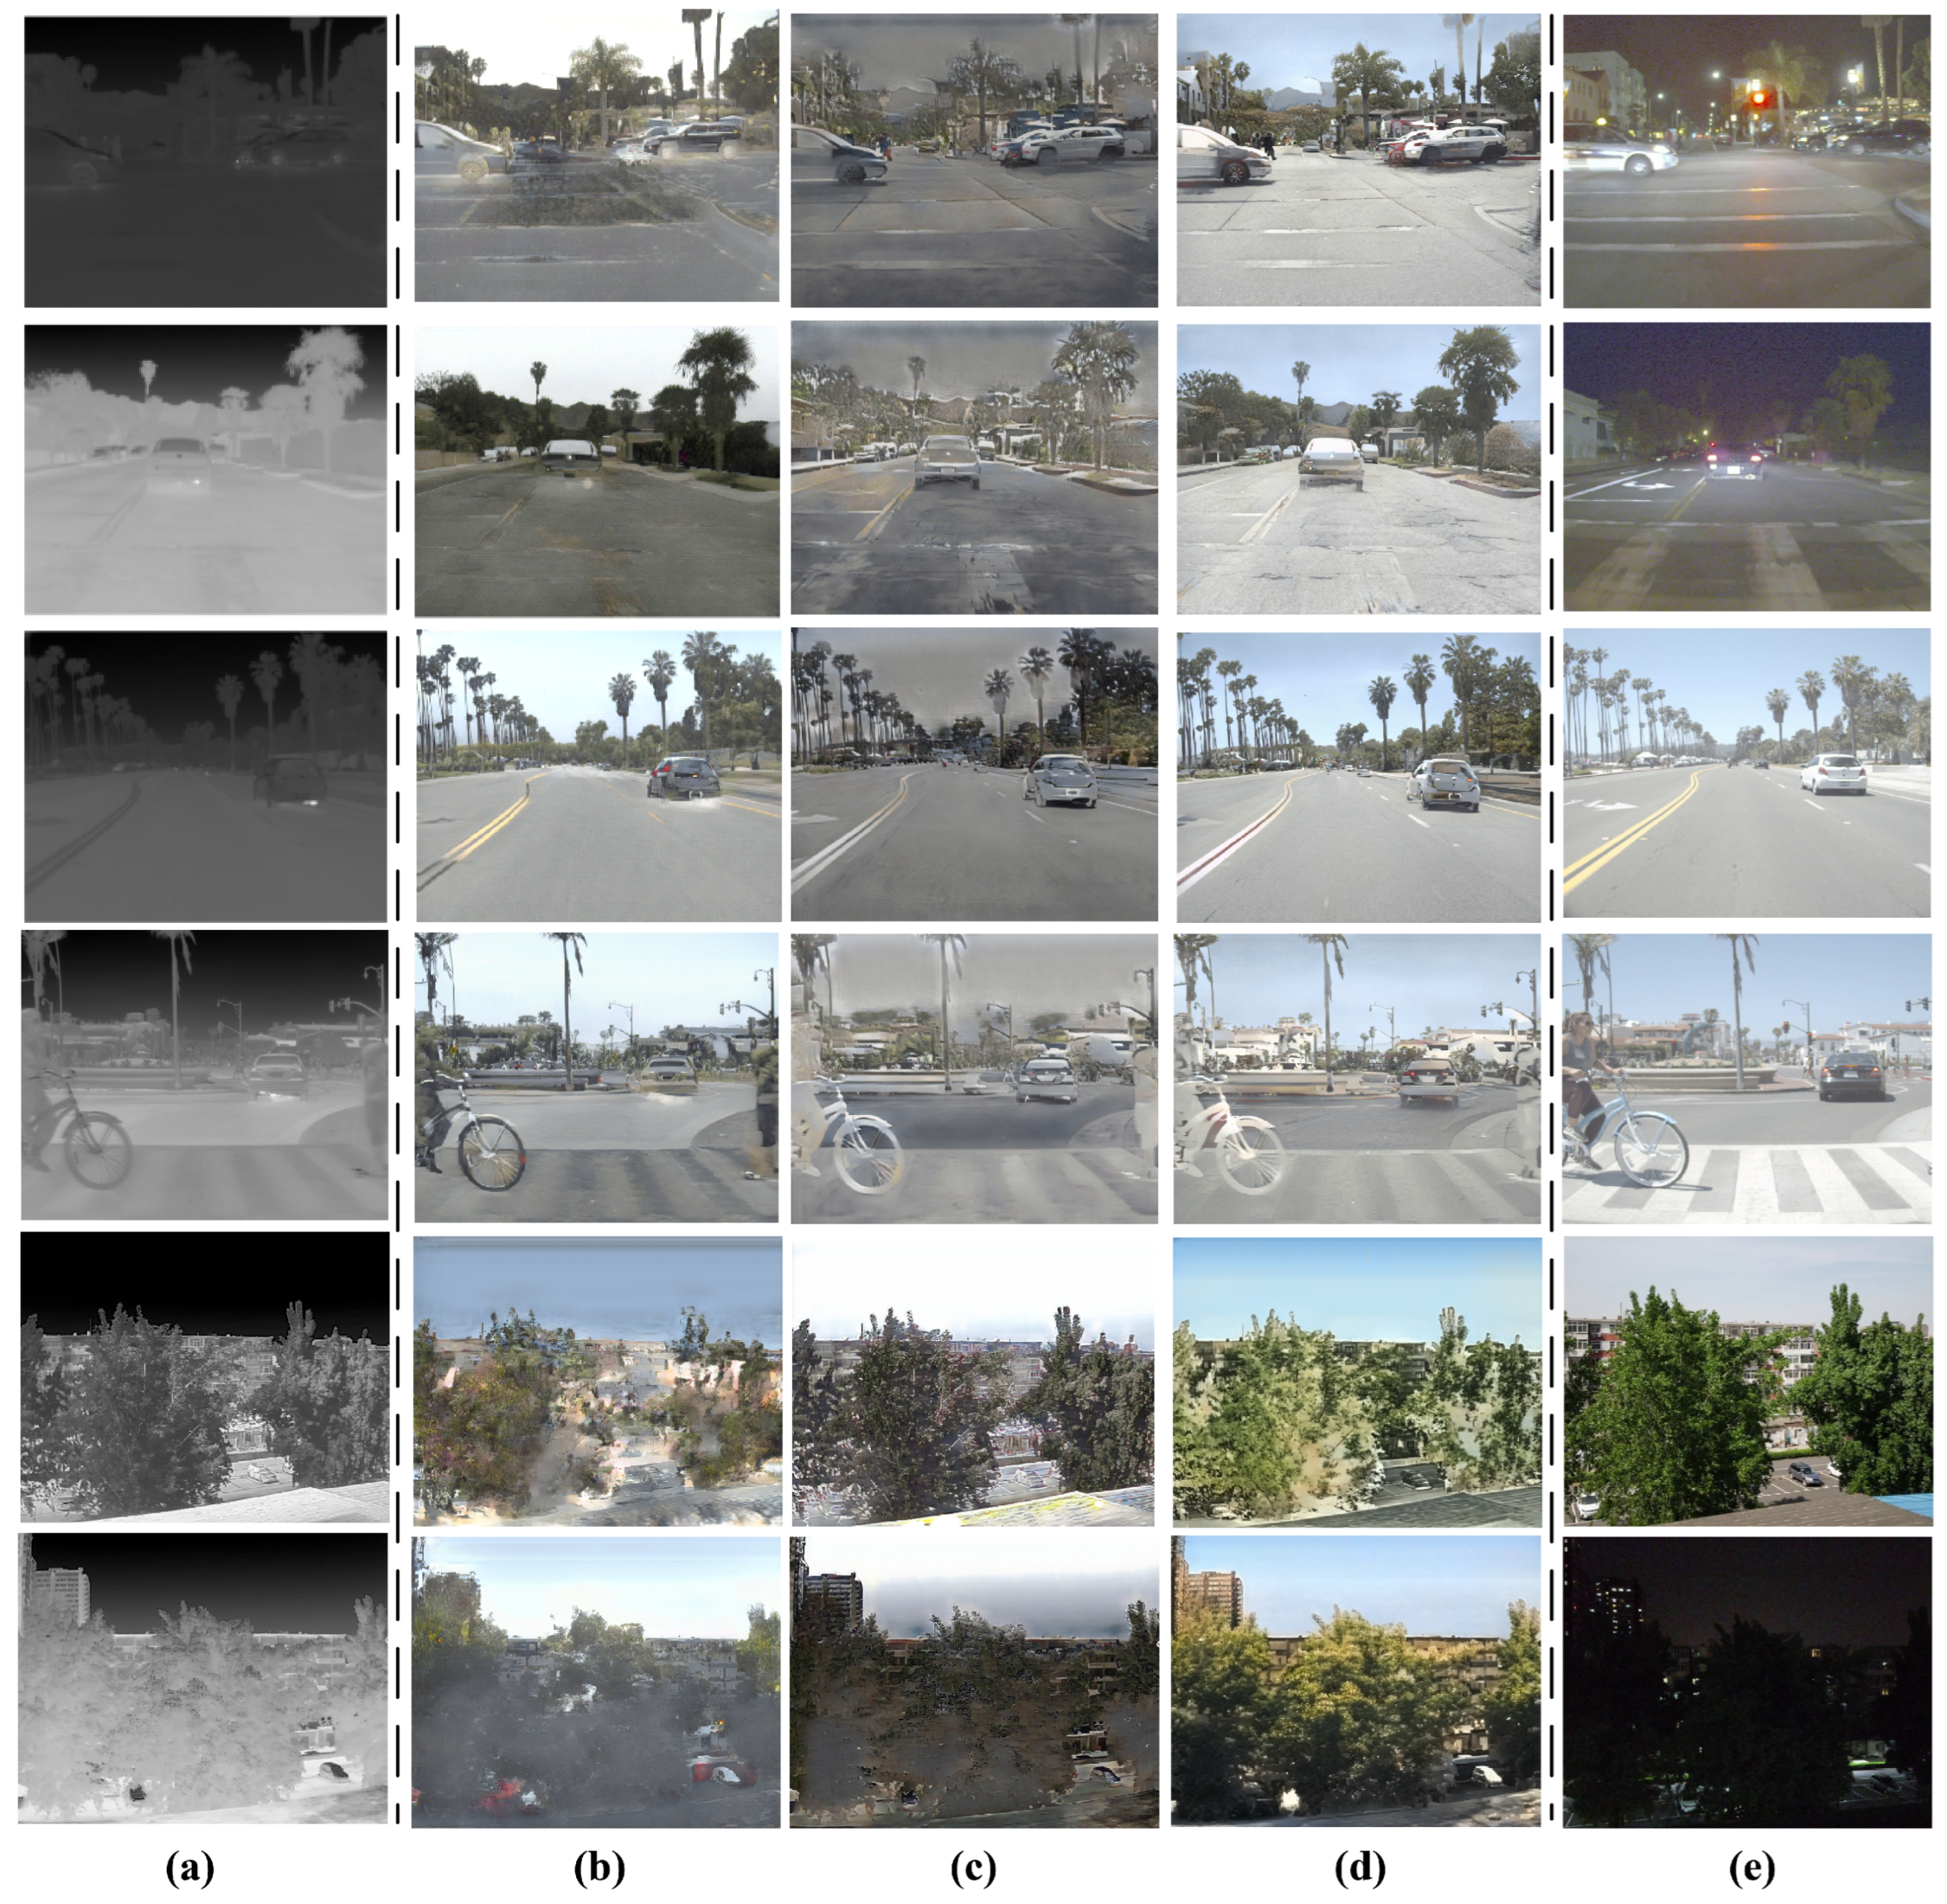
9] introduces an innovative architecture that seamlessly integrates multiscale feature fusion with attention mechanisms, thereby enhancing the fusion of thermal and structural information. This integration results in colorization that is not only more natural but also exhibits superior detail preservation. The infrared colorization outcomes produced by these algorithms are illustrated in
Figure 1.
Despite the substantial advancements in infrared image colorization technology, the existing quality assessment frameworks for these generated images remain insufficient. Contemporary IQA techniques which perform well for conventional natural images, including NIQE [
10] and NIMA [
11], often struggle when applied to colorized infrared images. These IQA methods tend to concentrate on structural features such as texture and edge definition; however, they frequently overlook crucial aspects such as color fidelity and the overall naturalness of the images. These aspects are vital for precise perception of colorized thermal scenes. The shortcomings of current IQA methods in this regard originate from their inability to account for specific types of color distortions that may arise during the colorization process, such as unrealistic color mappings, unnatural transitions between colors, and inconsistencies in color representation with reference to the underlying thermal data. Therefore, this limitation signals an urgent necessity for the development of new evaluation methodologies specifically tailored for colorized infrared images. Such methodologies would enable objective and accurate quantification of image quality within this unique domain, ultimately providing invaluable insights for optimizing image generation algorithms and enhancing their practical applications.
To address these challenges, we propose LDANet, a novel no-reference quality assessment model for generated images. LDANet integrates color feature extraction based on latent Dirichlet allocation (LDA) with a multichannel attention mechanism. The key contributions of this research are outlined as follows:
Introduction of a novel color feature extraction method via unsupervised learning. This study innovatively integrates an unsupervised LDA model with a deep learning framework; by utilizing an LDA model that has been pretrained on extensive natural color image datasets, we achieve precise extraction of color features from generated images.
Development of a multichannel and spatial attention mechanism for feature extraction. Our proposed methodology employs a multiscale strategy that combines multichannel and spatial attention techniques to extract spatial features; this dual approach significantly enhances the capacity of the model to discern and evaluate image quality effectively.
Creation of an integrated framework for image quality assessment combining color and spatial features. We establish a comprehensive framework for image quality assessment that synthesizes both color and spatial features; this integration facilitates more accurate and thorough no-reference quality evaluation of generated images.
2. Related Work
IQA is a major domain under image processing which is dedicated to the advancement of algorithms that can autonomously and accurately assess perceptual image quality. IQA methodologies are typically categorized into three principal types based on their reference image requirements: full-reference, reduced-reference, and no-reference.
Full-reference methods such as the peak signal-to-noise ratio (PSNR) and the structural similarity index (SSIM) [
12] require an original reference image for direct comparison with the distorted image. Although these approaches offer computational efficiency and widespread applicability, their utility is constrained by the requirement for a high-quality reference image. Reduced-reference methods [
13] require limited information from a reference image, which can prove advantageous in certain situations. Nevertheless, obtaining even partial reference data is often impractical or entirely unfeasible when dealing with generated images. Given that these images are synthetic and lack a corresponding “ground truth” in the real world, any methods that depend on reference data are fundamentally unsuitable for evaluating their quality.
In contrast, no-reference IQA (NR-IQA) methods have gained considerable recognition for their ability to assess image quality without the need for reference images. These methods are typically divided into two main categories, namely, distortion-specific and general-purpose. Distortion-specific approaches focus on identifying and quantifying specific types of degradation such as blur, noise, and compression artifacts by utilizing models trained to predict quality based on these defined distortions [
14,
15]. Although such methods are highly effective for well-understood distortion types, they often encounter significant difficulty when confronted with complex or unfamiliar degradation patterns.
On the other hand, general-purpose NR-IQA methodologies aim to mimic human visual perception through extensive extraction of image features. These approaches predominantly employ statistical analysis techniques, particularly natural scene statistics (NSS), alongside advanced machine learning techniques such as deep learning frameworks [
15]. Within the realm of deep learning for image analysis, attention mechanisms have gained increasing prominence and been explored in various infrared imaging applications. For example, Huang [
16] investigated attention residual networks for analyzing infrared crystal phase characteristics. While this application differs from our focus on colorized image quality assessment, it demonstrates the broader trend of leveraging attention mechanisms to enhance deep learning models for processing infrared data. This trend further motivates our use of attention mechanisms within a general-purpose NR-IQA framework.
Notable contributions in this domain include the NIQE method [
10], which employs NSS models for quality assessment, as well as the NIMA method [
11], which utilizes a pretrained deep neural network for feature extraction and quality prediction. Recent investigations into NR-IQA have highlighted the potential of various deep learning architectures, especially convolutional neural networks (CNNs) and generative adversarial networks (GANs) [
17,
18,
19]. However, these approaches have predominantly been developed and assessed using natural images, which raises concerns regarding their applicability to colorized infrared images. Infrared images possess unique characteristics, often manifesting distinct distortions and artifacts that differ from those found in natural images.
Color information is critical in IQA, especially in scenarios involving color reproduction and colorization; however, traditional no-reference IQA metrics frequently overlook the explicit significance of color, instead incorporating it indirectly through texture analysis. Empirical research has established that elements such as color harmony and naturalness play a pivotal role in shaping the perceived quality of images [
20,
21].
Pioneering studies by Ou et al. [
22] and others have delved into the interplay between color combinations and perceived harmony, utilizing psychophysical experiments to uncover this relationship; more recently, scholars have aimed to computationally model color harmony, often relying on color statistics and geometric relationships within color space [
23]. This research builds upon these foundational studies by harnessing the capabilities of LDA to uncover complex color relationships from extensive datasets of natural images. The insights gained in this way are then applied to evaluate the color harmony of generated infrared images, thereby addressing a critical gap in the existing NR-IQA literature.
Recent advancements in this domain include a color perception-based gated CNN architecture for visual quality assessment [
23] and a dual-band color fusion assessment methodology using color descriptors [
24]. These advancements highlight the paramount significance of integrating color features in image processing. Specifically, methodologies centered on color harmony often utilize intricate modeling techniques to analyze color distribution patterns and the relationships of color co-occurrence within images [
25].
Despite notable progress in infrared image colorization technology [
9,
26,
27], a critical challenge persists in effectively evaluating the quality of colorized outputs. Current evaluation methods possess several inherent limitations. First, they tend to focus predominantly on texture feature evaluation while neglecting the vital aspect of color harmony, which leads to only partial assessment of the visual quality of infrared colorized images. Second, many current approaches demonstrate efficacy solely on particular datasets or for specific types of infrared images, resulting in constrained generalization capabilities. Lastly, the high computational demands associated with certain methodologies hinder their practical implementation in real-time systems.
In response to these challenges, we introduce LDANet, a comprehensive framework designed for the evaluation of colorized infrared image quality. This framework is underpinned by two pivotal innovations: an LDA-based color feature extraction module that adeptly captures the nuances of color harmony, and an integrated multiscale attention mechanism that facilitates detailed spatial feature analysis. This dual-component architecture sets LDANet apart from existing methodologies by enabling more comprehensive quality assessment.
3. Proposed Methods
For practical scenarios involving generative image quality assessment, both spatial feature information and color harmony are crucial. Color harmony, broadly defined as “the visual pleasure produced by two or more colors”, serves as a guide for identifying harmonious color combinations in images, thereby illuminating the relationship between color and perceived quality [
20]. The classical theory of color harmony suggests that aesthetically pleasing color combinations possess distinct geometric features within a defined harmony space [
21]. An intuitive approach to applying this principle is to utilize the geometric relationships between various color regions as features when training models for color harmony [
25].
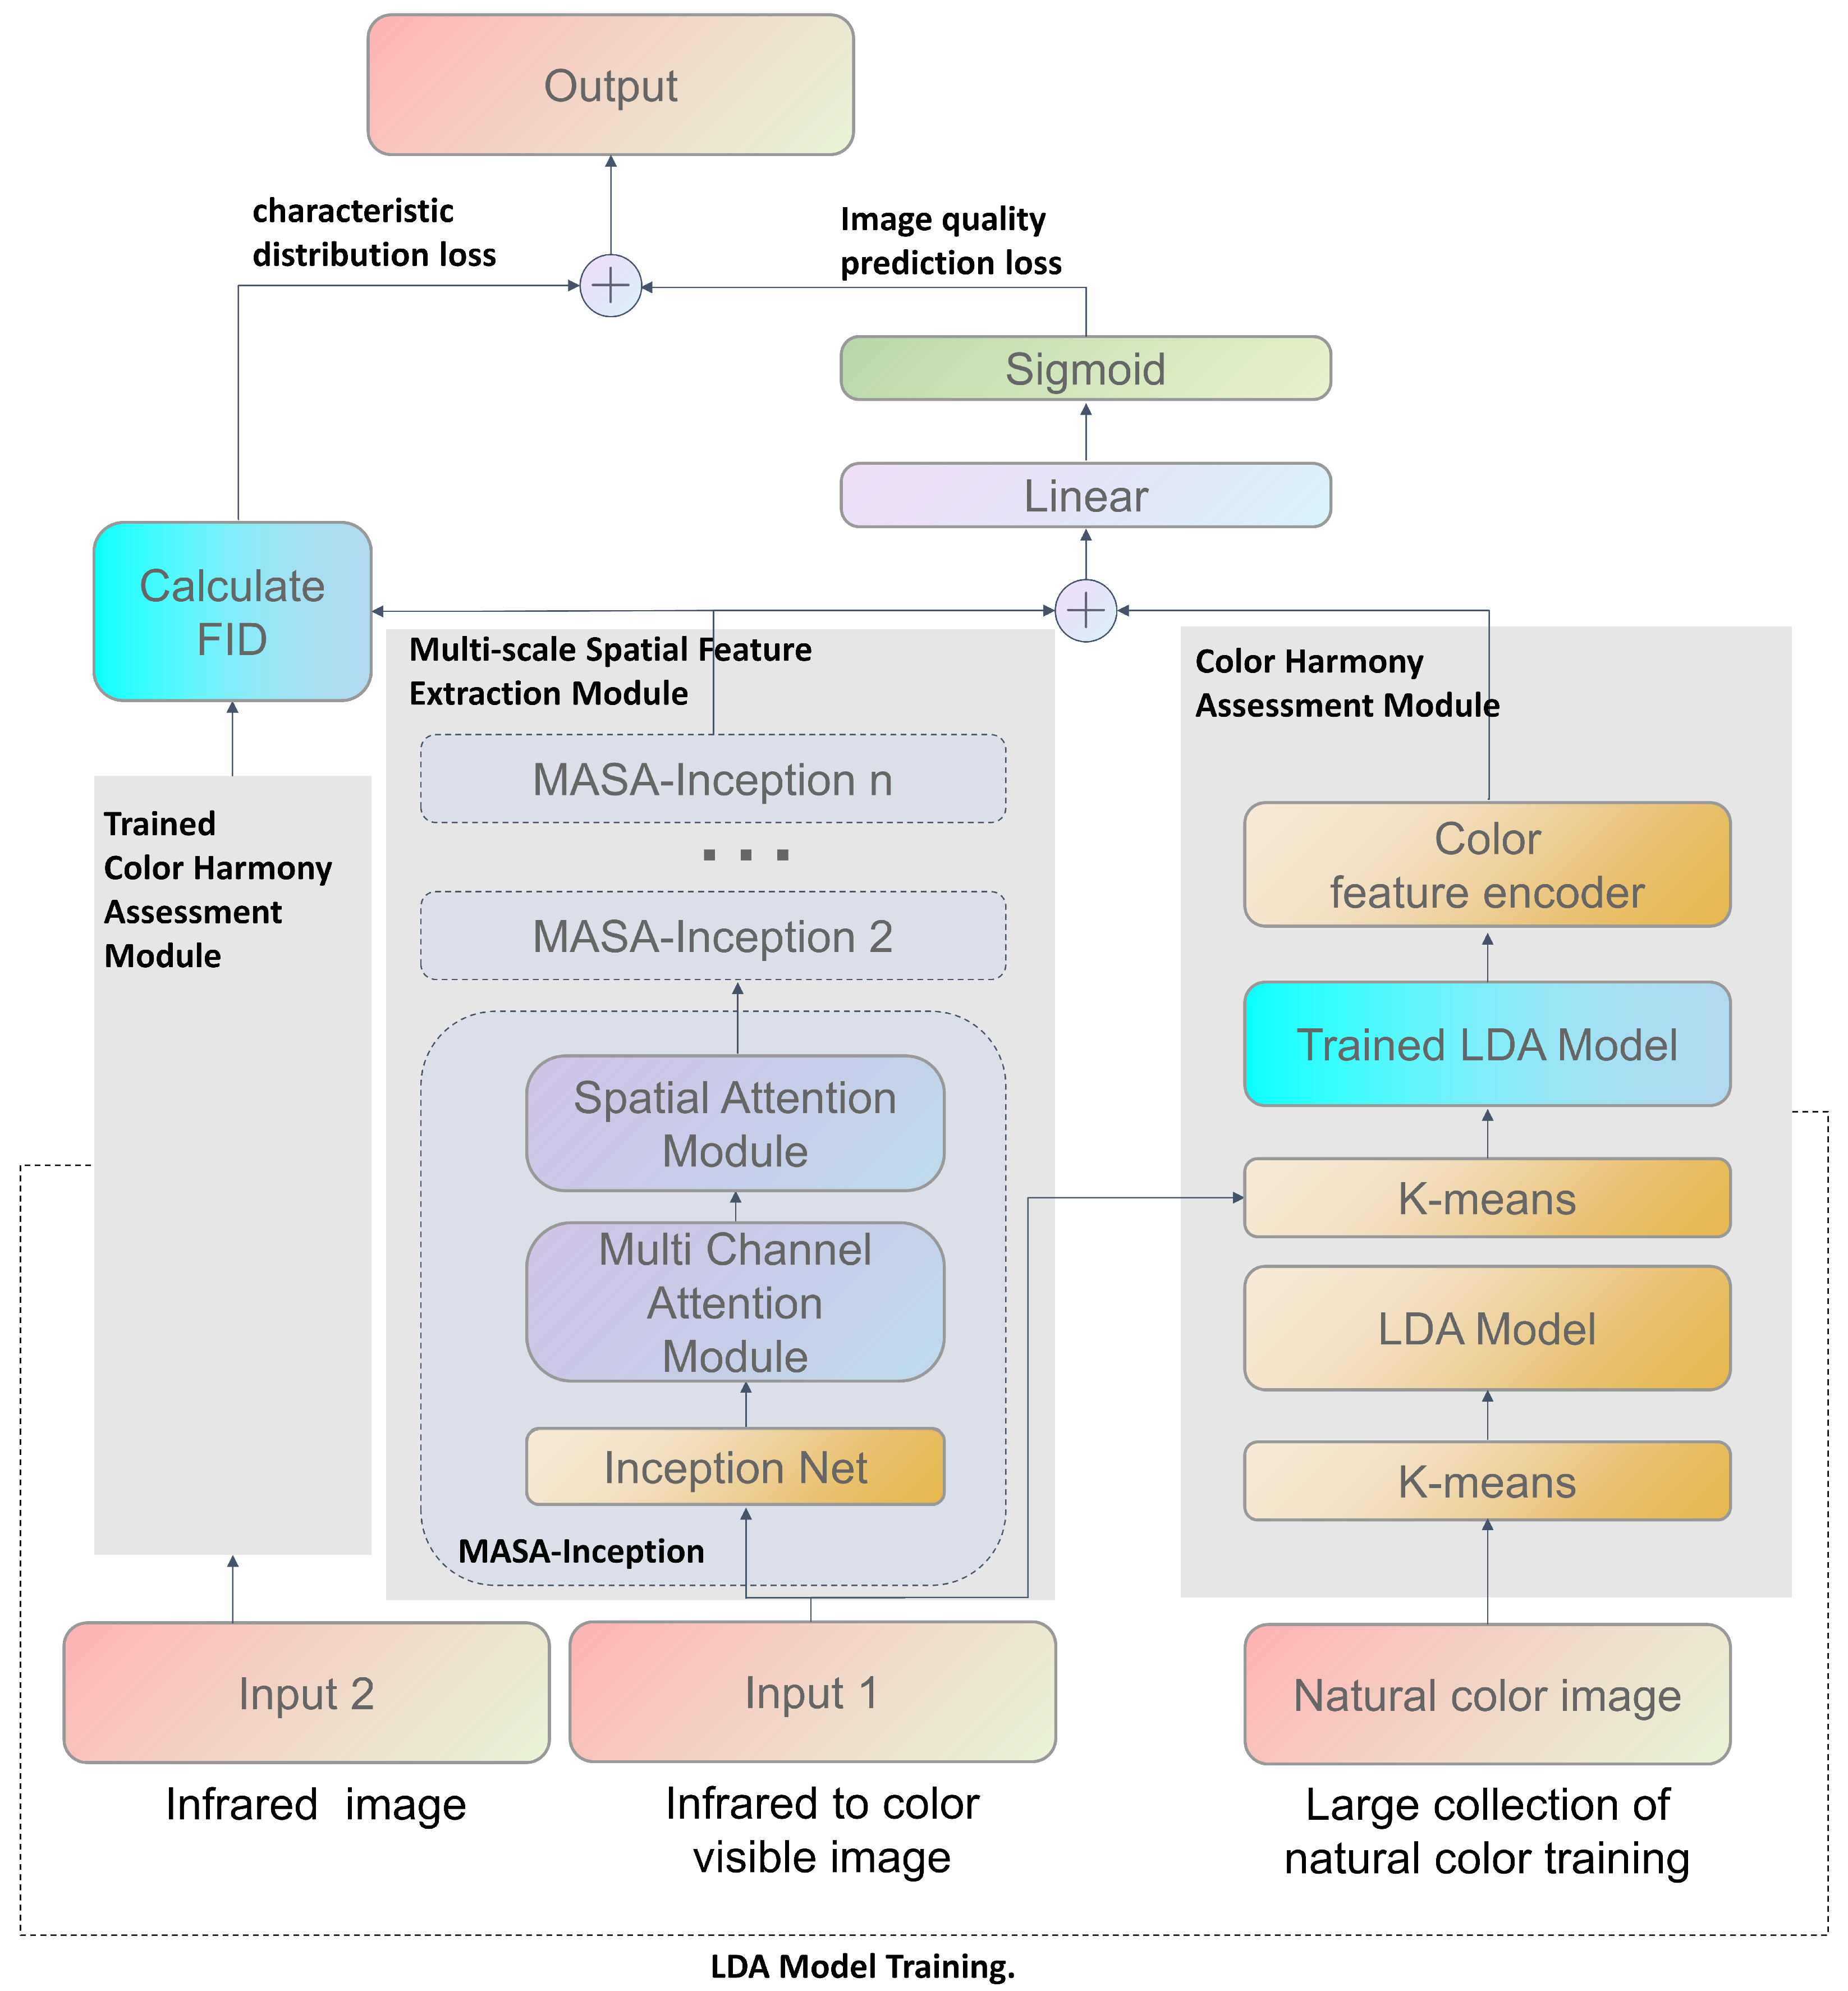
However, this approach faces two significant obstacles in the intricate nature of color combinations in spatial layouts and the vast diversity of combinations within the color space; together, these complicate the accurate representation of the myriad color combinations present in an image. To tackle these two challenges, we introduce an innovative generative image quality assessment method based on the LDA model, as depicted in
Figure 2. The proposed method offers holistic assessment of image quality by simultaneously analyzing both image features and color harmony.
3.1. Architecture
As we show in our code (
https://github.com/sddh123456/LDANet, accessed on 17 January 2025), the core innovation of our approach is its seamless integration of semantic image features with color harmony data to facilitate comprehensive quality evaluation of the of generated images. This methodology encompasses several essential components. Initially, we utilize an LDA model for topic modeling of image features to effectively capture the underlying semantic structures. This is further enhanced by a neural network that conducts a detailed analysis of color distribution and coordination, then extracts the vital color harmony information. Additionally, to improve the perception of multiscale features, we incorporate dual-channel and spatial attention mechanisms specifically designed to extract deep feature information across multiple scales. By combining color harmony information with deep feature analysis, this integrated approach enables more accurate and comprehensive quality assessment of the generated images.
Our model was trained using a composite loss function that effectively combines the image quality prediction and feature distribution losses. The prediction loss quantifies the discrepancy between the predicted scores and the actual ground truth scores; conversely, the feature distribution loss, derived from the MASA-Inception network, encourages similarity in feature distribution between the generated infrared images and their original counterparts, drawing parallels to the Fréchet inception distance (FID). The MASA-Inception network was selected for its proficiency in capturing multiscale structural information. Unlike other feature extractors such as VGG or ResNet, the multibranch architecture of the inception model excels at capturing features at varying scales, which is crucial for analysis of the intricate spatial patterns inherent in infrared imagery. Moreover, the integration of multichannel and spatial attention mechanisms significantly enhances the capacity of the model to focus on the most relevant regions and features for improved quality assessment. By jointly optimizing these two objectives, the training process not only boosts prediction accuracy but also ensures that the generated images retain consistent feature distributions with those of authentic infrared images.
3.2. Multiscale Spatial Feature Extraction Module
To further improve spatial information feature extraction, a dual-attention enhancement mechanism comprising both multichannel and spatial attention is integrated into the algorithm. This strategic incorporation specifically addresses the challenges posed by the variability of target feature scales in images. By embedding both attention mechanisms into each layer of the inception network, as depicted in
Figure 3, the proposed method achieves adaptive multiscale feature fusion along with precise localization of key regions. The multiscale spatial feature extraction module leverages a dual-attention mechanism that functions through two complementary components, namely, multichannel and spatial attention. Multichannel attention serves to modulate feature maps across various scales and concurrently amplifies the salient features specific to particular scales while suppressing superfluous information; simultaneously, spatial attention steers the focus of the model toward informative regions in the image, thereby enhancing the efficiency and effectiveness of spatial information extraction. This methodological enhancement significantly strengthens the feature representation capabilities of the model without incurring substantial computational overhead. Overall, the module architecture is composed of three essential components: an inception-based backbone network, a multichannel attention mechanism, and a spatial attention mechanism.
3.2.1. Multichannel Attention Mechanism
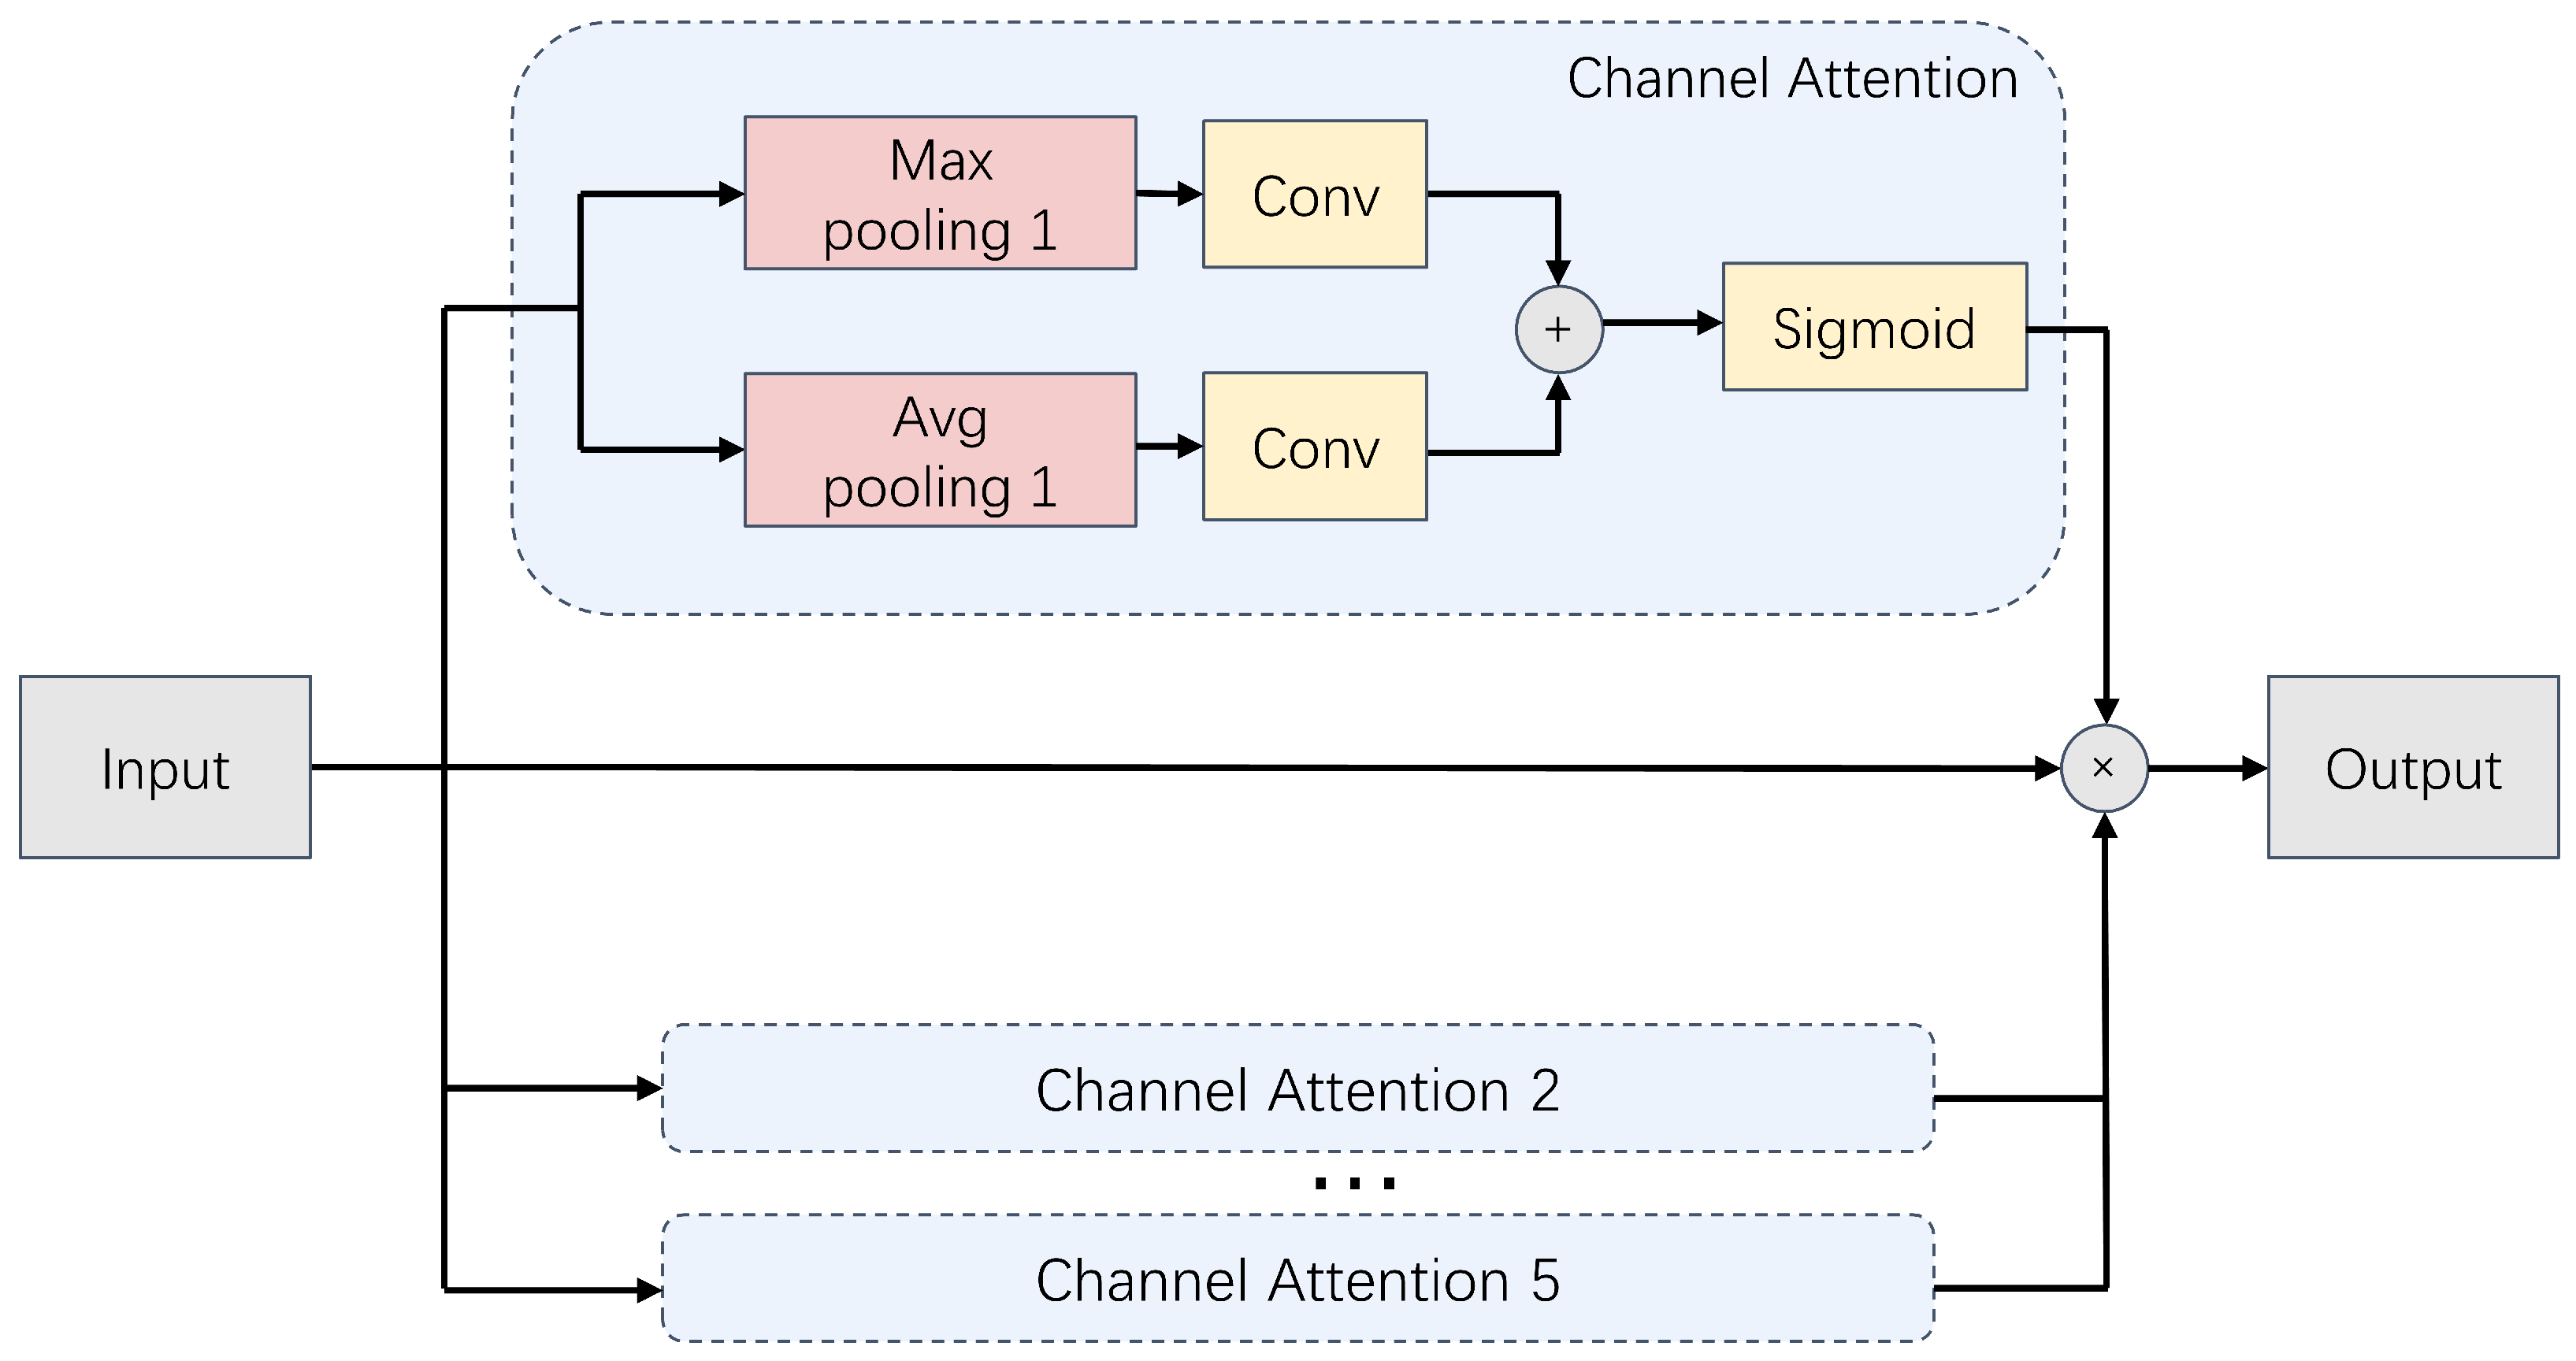
The multichannel attention computation process depicted in
Figure 4 unfolds in three key stages. First, the input feature map is processed through a series of pooling kernels of varying scales. This generates distinct feature map branches at multiple resolutions, wherein each branch corresponds to a specific receptive field. In the second stage, these multiscale feature maps are input to the channel attention modules. These modules learn to assign adaptive importance weights to individual channels, allowing the network to prioritize the feature maps based on their relative significance. Finally, the weighted multiscale feature maps are fused to produce a comprehensive multiscale feature representation which seamlessly integrates information across all scales.
The input feature map can be represented as
, where
C,
H, and
W correspond to the number, height, and width of the channels, respectively. To effectively capture multiscale variations in the target features present in the image, we employ five convolutional kernels of varying scales. These kernels process the input feature map
F to produce five distinct feature map branches, each characterized by a unique resolution. This transformation can be mathematically expressed as follows:
where
defines the downsampling ratios,
denotes the pooling operator with kernel size
k and stride
s, and
represents the pooled feature map.
To enhance the model’s multiscale scene content analysis capability, we integrate a scale-specific channel attention mechanism that operates independently on the feature maps
at each scale. The initial step involves performing global pooling on each feature map, which serves to extract global contextual information and capture feature responses across all spatial locations within the respective feature map. The specific operations are listed as follows:
where
and
respectively denote the results of global average and global maximum pooling applied to the
nth scale feature map, with
representing the number of channels at that scale. These pooling strategies were meticulously designed to extract the global statistics from diverse perspectives. Specifically, global average pooling captures the overall presence of the features, while global maximum pooling highlights the most salient features and collectively enriches the contextual richness of the data.
Subsequently, we concatenate the global average pooled features, denoted as
, and global maximum pooled features, denoted as
, and feed them into a multilayer perceptron (MLP) that shares weights across both input streams. This MLP facilitates nonlinear mapping, which empowers the model to effectively learn the attention weights for each individual channel. This calculation is detailed as follows:
where
and
denote the respective weight matrices of the first and second layers of the MLP. The channel reduction ratio, denoted by
r, reduces the model complexity, while
and
respectively denote the ReLU and sigmoid activation functions. This process yields the channel weight vector
that reflects the relative importance of each channel for the current task.
The subsequent steps in this process involve the calculation of channel weights, represented as
. Armed with these weights, the feature maps undergo a weighting process that amplifies the representation of critical channels while simultaneously diminishing the influence of less significant ones. After the implementation of channel-wise attention weighting across the feature maps at each scale, the multiscale feature maps are fused to obtain a comprehensive multiscale fused feature representation
where
signifies the
nth scale feature map after being processed by channel attention. Note that the operation referred to as Concat involves concatenating the features along the channel dimensions. The expressions
indicate that the feature maps from each scale are concatenated sequentially. This fusion process adeptly combines feature information across multiple scales, thereby creating a more nuanced and comprehensive framework for subsequent feature representation. The feature maps processed by each channel are upsampled to the original size and then concatenated along the channel dimension, and the attention weight map of the original size is obtained through convolution and sigmoid operations.
The effectiveness of the multichannel attention mechanism stems from its ability to adaptively weigh the feature maps generated by pooling kernels of varying receptive field sizes. The multichannel attention mechanism learns to prioritize these feature maps based on their relevance to the overall quality assessment task.
The learned channel weights, denoted as
in Equation (
3), modulate the contributions of each feature map. The multilayer perceptron (MLP) within the channel attention module learns a nonlinear mapping from the globally pooled features
and
to these channel weights. This mapping enables the model to identify combinations of global features that are indicative of either high or low image quality. Consequently, channels that consistently contribute to accurate quality predictions are assigned higher weights, while less informative channels are suppressed. Although direct visualization of individual channel weights is not presented, the ablation studies (
Section 4.4) provide empirical evidence of their contribution to the model’s performance. The mechanism effectively performs a feature selection across scales, emphasizing the most discriminative information for quality assessment.
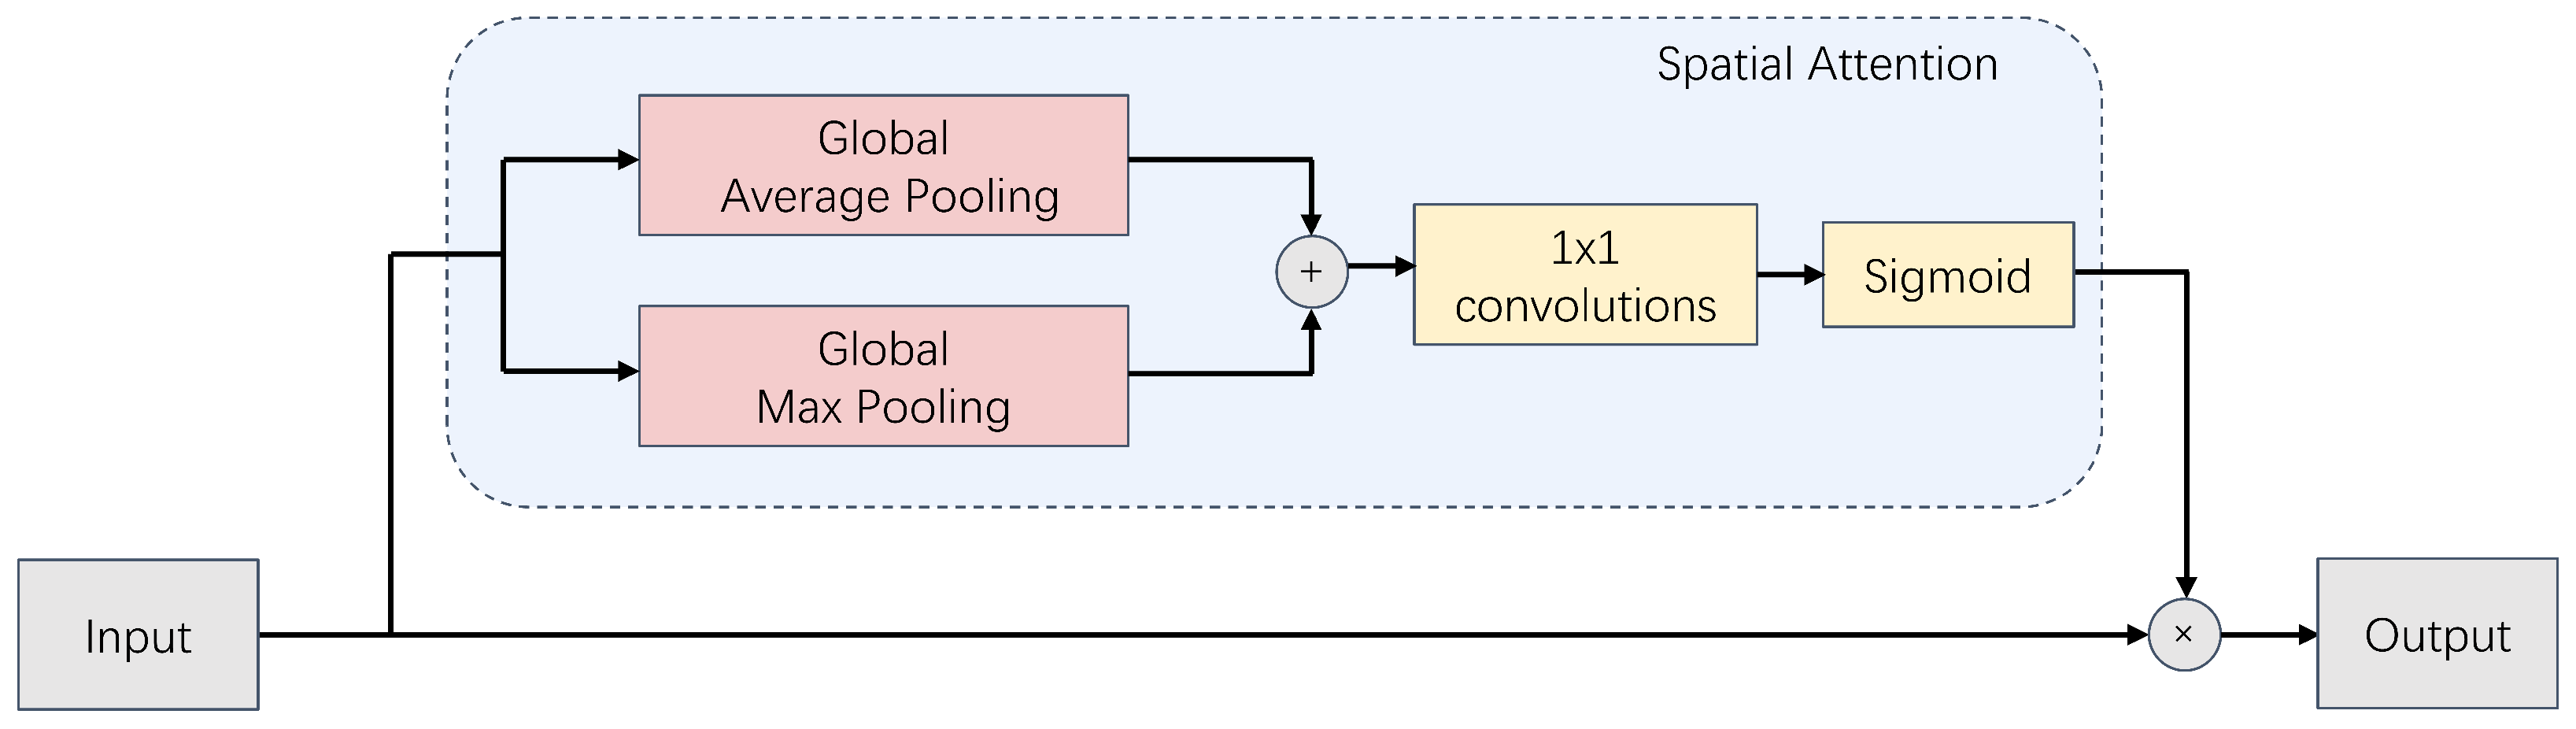
3.2.2. Spatial Attention Mechanism
To further emphasize key spatial information, a spatial attention mechanism is employed on the fused feature map, denoted as
. This mechanism operates by allocating weights across the spatial dimensions of the feature map, which amplifies responses to significant regions while diminishing the impact of irrelevant or noisy outputs. The implementation of this mechanism is depicted in
Figure 5 and follows a systematic approach.
Initially, the fused feature map undergoes both global average pooling and global max pooling to extract spatial contextual information:
where
represents the total number of channels in the fused feature map. The results of global average pooling and global max pooling are denoted as
and
, respectively.
Thereafter,
and
are concatenated along the channel dimensions, yielding a two-channel feature map that encapsulates both the average and maximum spatial features. A convolutional layer then processes this concatenated feature map to generate the spatial attention weights
:
where
denotes the convolutional kernel size set to
and
represents the sigmoid activation function. The convolution operation effectively captures spatial correlations to produce attention weights
that indicate the significance of each spatial location within the feature map.
Finally, these spatial attention weights
are applied to the fused feature map
via elementwise multiplication, effectively weighting the feature map spatially:
where ⊙ denotes elementwise multiplication. The resulting feature map
is obtained by concatenating the features. Subsequently, a 2D convolutional operation with a 1 × 1 kernel is applied to
, yielding
, which represents the feature map after spatial attention. This attention mechanism selectively enhances the representation of critical regions while suppressing background noise, ultimately resulting in more accurate and robust features that are better suited for downstream tasks.
The spatial attention mechanism shown in
Figure 6 complements the multichannel attention by selectively weighting different spatial locations within feature maps. This is crucial because not all regions in a colorized infrared image contribute equally to perceived quality. Spatial attention emphasizes salient features such as edges, textures, and object boundaries areas that are critical for evaluating detail preservation and sharpness, both of which are key indicators of colorization quality. Blurring or artifacts, especially around edges, are strong indicators of poor quality and are readily identified by this mechanism.
In Equation (
7), a weight
is assigned to each location based on its relative importance in quality prediction. The spatial attention module’s convolutional layer learns to identify these salient locations by analyzing spatial relationships and feature distributions within the pooled feature maps
and
. Locations with strong gradients, high contrast, or other visually prominent features receive higher weights. Elementwise multiplication of the fused feature map
with
then amplifies responses from these salient regions while attenuating less informative ones, creating a more focused and discriminative feature representation.
Our proposed feature extraction framework combines multiscale convolutions with channel and spatial attention mechanisms. This allows the model to comprehensively capture object features at various scales and their relative importance, improving object recognition and focusing on critical regions. Channel attention dynamically adjusts channel weights to refine feature expressions, while spatial attention prioritizes informative regions through spatial weight adjustments, as visualized by the learned attention weights shown in
Figure 6. This synergistic interplay enhances feature utilization, leading to substantial advancements in representation and task performance. Integrating these attention mechanisms enhances feature extraction efficiency and reduces computational complexity while maintaining high performance.
3.2.3. Inception Backbone Network
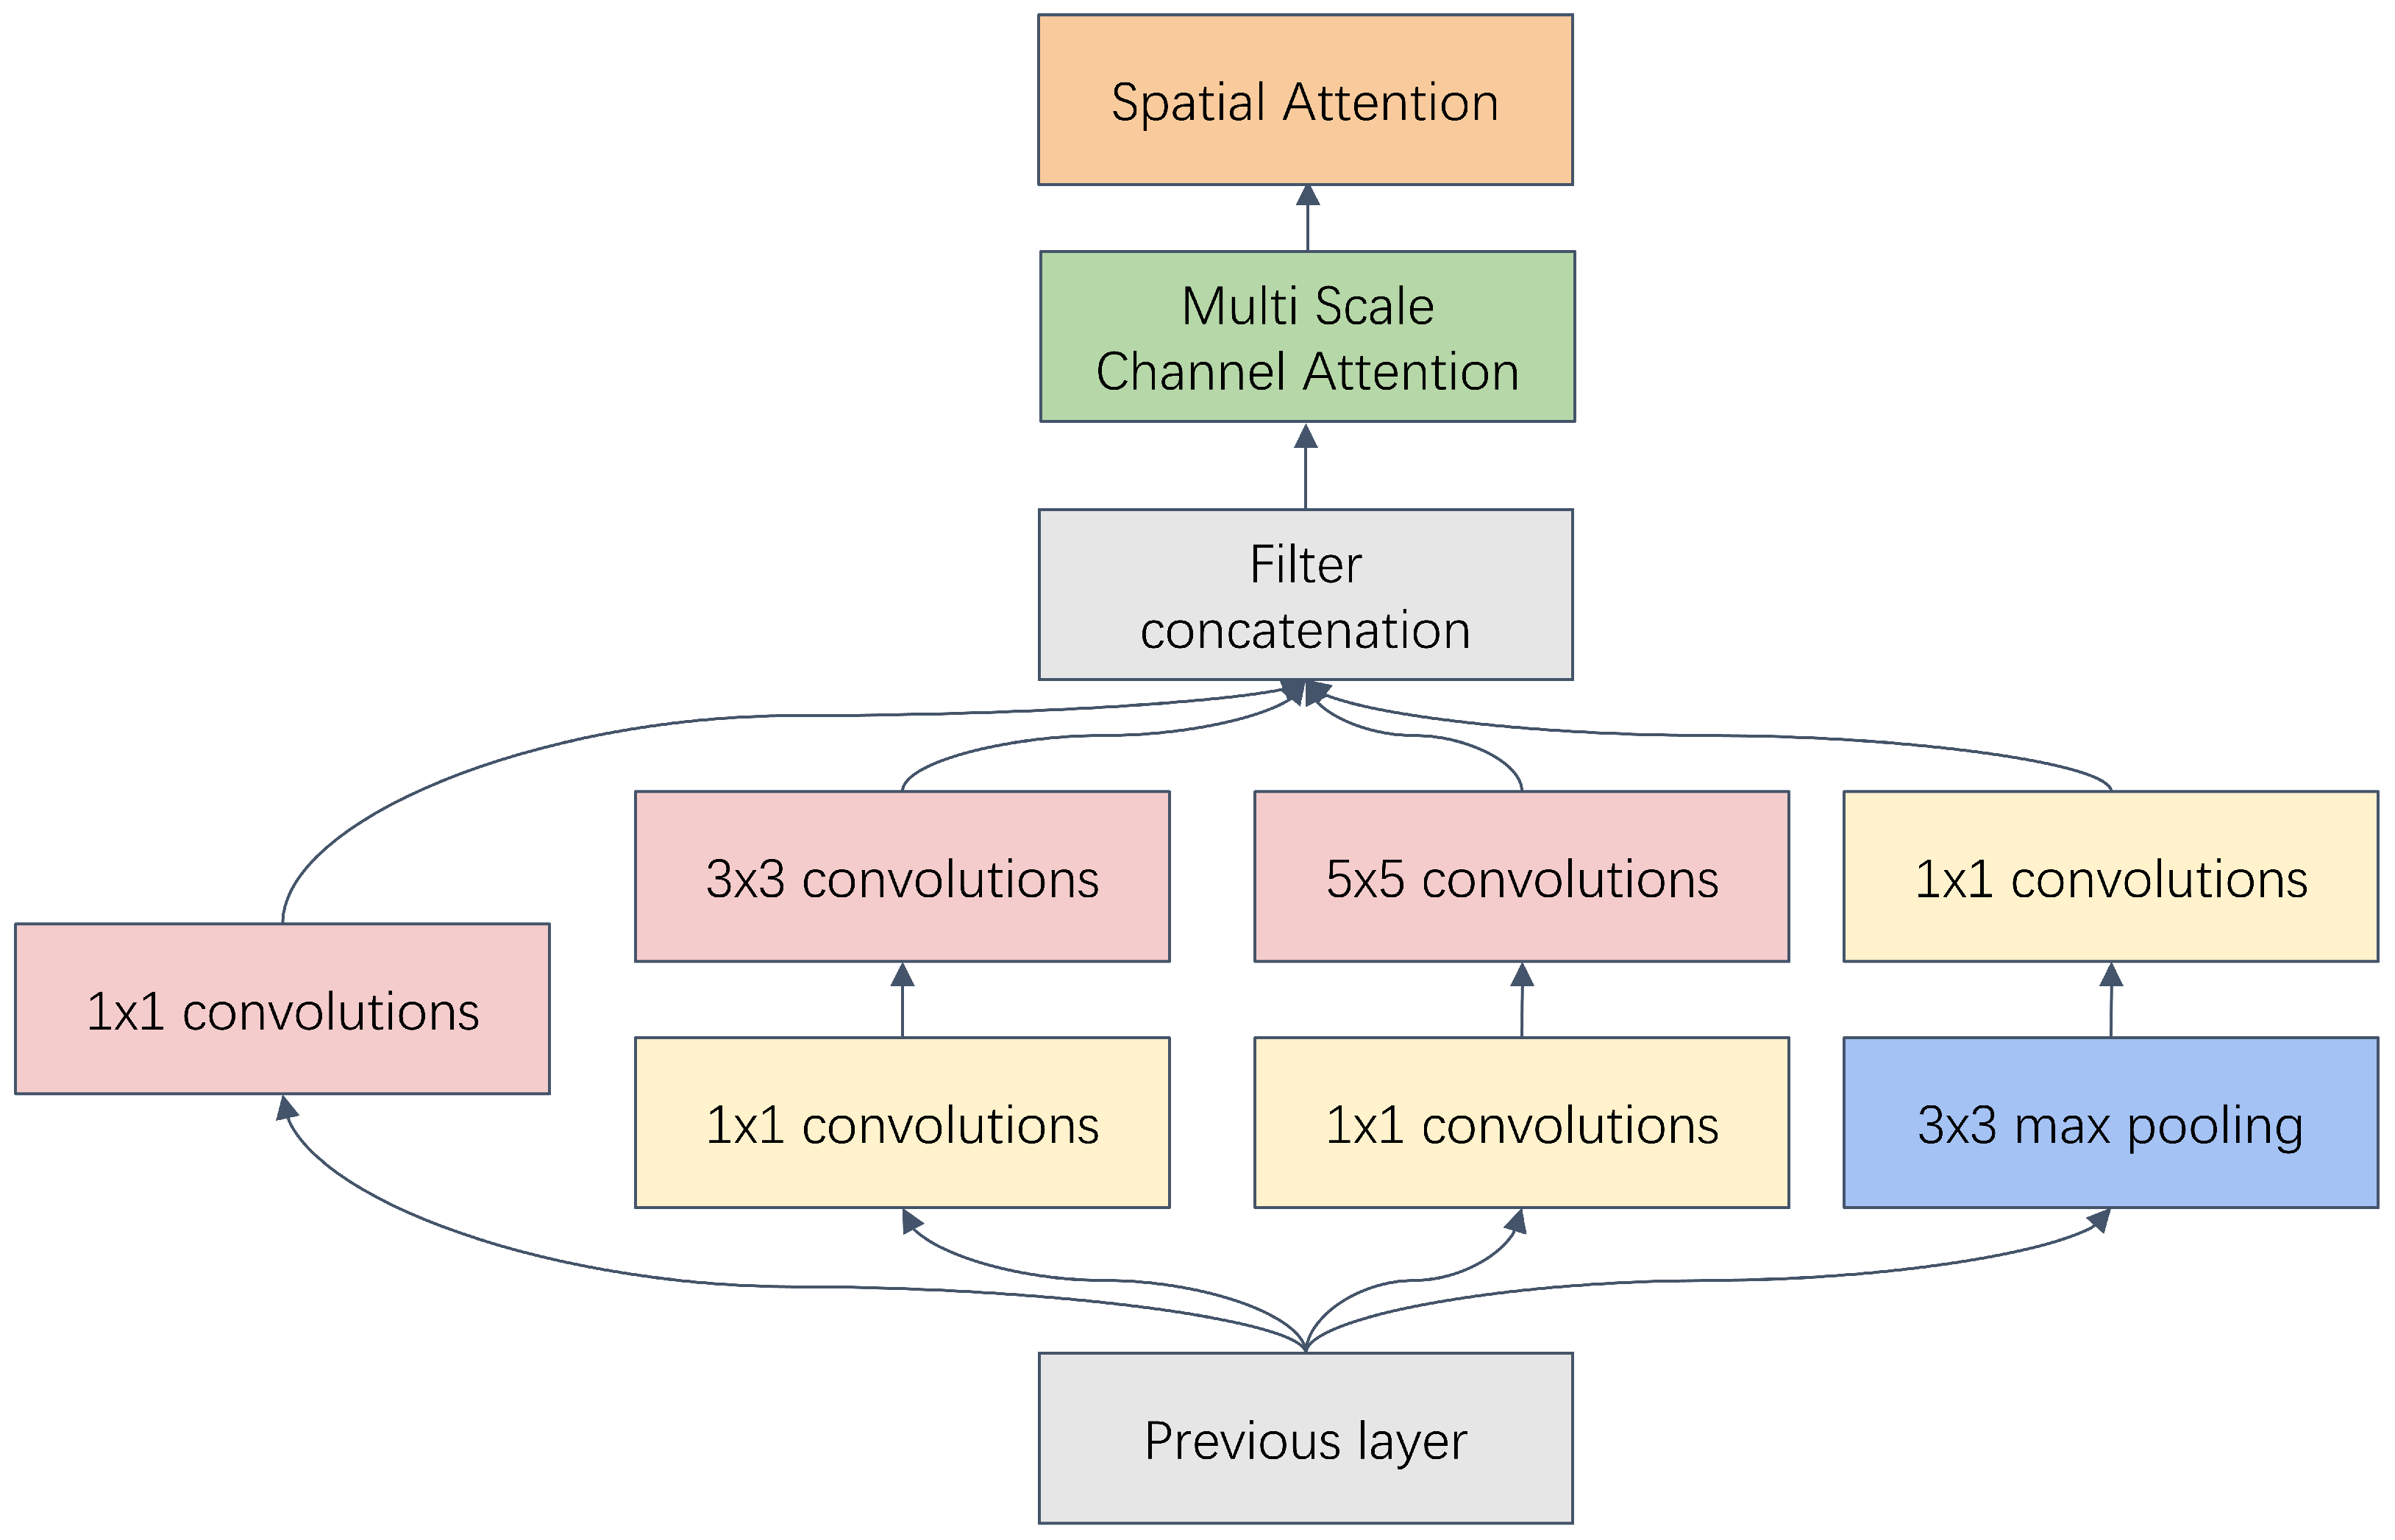
The network utilizes the well-established inception framework [
28] as its backbone for the initial extraction of image features, as portrayed in the accompanying figure. The multibranch architecture of the inception module is instrumental in capturing features across multiple scales, thereby enriching the input for the subsequent attention mechanisms.
After preprocessing, the input image
is processed into a sequence of seven consecutive inception modules
to progressively extract the higher-level features, where
represents the
nth inception module. The input and output channel numbers for each module, denoted as
and
, respectively, are configured as follows:
,
,
,
,
,
,
. The following formula uniformly describes the entire inception module sequence
where
,
denotes the output feature map of the
nth inception module, and
represents the inception module with specific input and output channel counts of
and
, respectively.
The first inception module receives as its input, which consists of 192 input channels and 256 output channels, resulting in the feature map . This feature map is then processed in the second inception module; this iterative procedure continues sequentially through to the seventh inception module, ultimately generating the output . This output serves as the input to the deep feature encoder, which is a component designed to enhance the quality of the extracted deep features.
The deep feature encoder initiates the process with an adaptive average pooling layer, which effectively compresses the spatial dimensions of the feature map
to a size of
, represented mathematically as
where
signifies the resulting feature map after the pooling operation. The subsequent step involves transforming this feature map into a one-dimensional vector, denoted as
, achieved through a Flatten-layer. Subsequently, a linear layer reduced the feature dimensionality to 256, followed by a ReLU activation function to introduce nonlinearity. Ultimately, a BatchNorm1d layer is employed to normalize the feature set, thereby improving the stability and generalization of the model. The steps are summarized as follows:
The procedural steps highlight how these operations empower the deep feature encoder to adeptly map high-dimensional features into a cohesive lower-dimensional space, thereby enhancing the overall stability and generalization capabilities of the model. Furthermore, the spatial information feature extraction module amplifies this process by integrating multiscale convolutional kernels alongside multichannel attention mechanisms. These components enable the model to efficiently capture and synthesize feature information across diverse scales. The attention mechanism assigns differential weights to feature maps depending on their scale, thereby highlighting key features while diminishing the influence of less significant ones. This selective emphasis facilitates effective multiscale information fusion. Additionally, the incorporation of a spatial attention mechanism allows the model to concentrate on key regions rich in information within the image, effectively reducing redundant computations in less relevant areas. Therefore, this strategy significantly improves feature extraction efficiency while also reducing overall computational complexity.
3.3. Color Harmony Assessment Module
Color harmony emerges as a vital metric for evaluating both the quality and aesthetic appeal of images during generation and processing phases. The produced images demonstrate color distributions that align closely with those typically observed in natural images, offering a more visually satisfying experience. However, effectively assessing color harmony in generated images remains challenging.
To address this issue, we propose a novel method for color harmony assessment that synergizes topic modeling with deep learning techniques. Initially, we train an LDA model [
29] on a large dataset of high-quality natural color images. This approach allows the model to effectively learn the intrinsic color distributions and representations that characterize the color harmony found in natural images. To evaluate the generated images, we utilize a pretrained LDA model for color quantization, complemented by neural network analysis to assess the color harmony of these images. This methodology ensures alignment of the resulting color distributions with those typically observed in natural imagery.
3.3.1. Overview
For color harmony analysis, the proposed LDA module integrates k-means clustering, LDA, and the quantization capabilities of a downstream neural network. This module adeptly combines color histogram features with deep learning features, effectively merging the high-level semantic information of the images with the statistical properties of their color distributions. This integration significantly enhances the model’s ability to evaluate color harmony. Each “topic” identified by the LDA can be interpreted in the colorized images as a unique theme or characteristic color distribution that frequently appears in natural settings. For instance, one topic might encapsulate the color palette typical of a “sunset” scene, whereas another topic might represent the colors commonly associated with a “forest” environment. By learning these topics from an extensive dataset of natural images, the LDA model successfully captures the fundamental principles that underlie color harmony.
3.3.2. Color Quantification and K-Means Clustering
To reduce data dimensionality and streamline subsequent computations when applying the LDA model, we start by quantizing the colors of the input image. The process employs a k-means clustering algorithm to distill the extensive color palette of the original image into a streamlined set of representative colors, effectively reducing the dimensionality of the data. Notably, k-means is used here solely for data compression of each image to improve subsequent computational efficiency; thus, no separate training is required.
Initially, the original image is represented as
, where
H and
W denote the height and width of the image, respectively. This image is transformed from the RGB color space into the
color space, yielding
. The
color space is favored for its closer correspondence to human visual perception and its more linear representation of color differences, which significantly enhances the efficacy of color clustering, as noted by Chavolla et al. [
30].
Following this transformation, the image’s pixel data of are reshaped into a two-dimensional array to facilitate the application of the clustering algorithm:
where
represents the total number of pixels in the image, resulting in the formation of a matrix
P with dimensions
. In this matrix, each row corresponds to the
color values of an individual pixel, encapsulating the L, a, and b channels.
Subsequently, the k-means clustering algorithm is applied to group the colors represented in P. By establishing the number of clusters K, our objective is to distill the image’s color information into K representative colors, referred to as “color centroids”. For the 512 × 512 images used in this study, we empirically determined that K = 64 provides a good balance between representing the diversity of colors and maintaining computational efficiency. It is important to note that k-means clustering is applied individually to each input image in order to quantize its colors. The main computational cost arises from the iterative distance calculations between each pixel and the K centroids and from the subsequent updating of the centroid positions. The memory requirements are proportional to the number of pixels in the image and the number of clusters (K). While no specific optimizations such as grid search were employed in this implementation, such techniques could be considered for future performance improvements. The clustering process is described below.
Initially, we randomly initialize
K color centroids, denoted as
. Each pixel
, where
, is subsequently allocated to the cluster corresponding to the nearest centroid. This allocation is determined by computing the Euclidean distance between pixel
and each centroid
:
The cluster labelassigned to the ith pixel is represented as , and the operation arg min identifies the index k that minimizes the distance between pixel and centroid .
Following this assignment step, the positions of the centroids are recalibrated to reflect the mean color values of all pixels that have been allocated to each respective cluster:
where
indicates the total number of pixels within the
kth cluster. Moreover,
serves as an indicator function, yielding 1 if the condition
is satisfied and 0 otherwise.
These steps are iterated until the change in centroid positions falls below a predefined threshold or the maximum number of iterations is reached. This process generates cluster labels
for each pixel along with the associated color centroids
. These centroids encapsulate the
K principal colors present in the image, yielding a color-quantified representation. As depicted in
Figure 7, a color histogram is constructed based on the clustering outcomes, enabling a visual representation of the distribution of each representative color within the image [
31].
Color quantization effectively reduces data dimensionality while simultaneously extracting critical color features, which lays a robust groundwork for subsequent topic model training.
3.3.3. LDA Model Training
After the color quantization process, the derived color centroids are utilized as input for the LDA model to facilitate topic training. LDA is a generative probabilistic model widely recognized for its capacity to unveil the latent thematic structure within large collections of documents [
29]. In this study, the color histogram of each image is interpreted as a document, with the quantized colors acting as its constituent words. This innovative approach effectively transforms the image processing task into a text-based topic modeling challenge.
Specifically, the compilation of color histograms from the training set is represented as , where N denotes the total number of images (documents) analyzed. The vocabulary comprises V distinct color patches. The LDA model describes a generative framework for document creation that operates as follows.
For each document
, a topic distribution
is drawn from a Dirichlet distribution. This distribution serves as a probabilistic representation over a collection of non-negative values that sum to unity, with the hyperparameter
controlling the sparsity of the resulting topic distribution.
This process intuitively assigns a probability distribution for each image across various topics, reflecting the prominence of specific color themes present in the image.
Subsequently, for each word
in the document (corresponding to each color patch within the image), a topic assignment
is sampled from a multinomial distribution, which is a probability distribution over a finite set of discrete outcomes:
where
represents the topic associated with the
mth color patch in the
nth image. In this way, a particular topic is systematically assigned to each color patch.
After a topic has been assigned, the corresponding word
(representing the color patch) is sampled from the word distribution linked to that particular topic. This word distribution, which can be interpreted as the “color profile” of the topic, is governed by the Dirichlet distribution:
where
denotes the color profile for topic
and
represents the hyperparameter for this distribution. In this step, the color patches within each topic adhere to a specific color profile.
The joint probability distribution governing the complete LDA model is mathematically represented as follows:
where
represents the observed sequence of words (color patches),
denotes the corresponding sequence of topics, and
denotes the number of words in document
n (equivalent to the number of color patches in image
n).
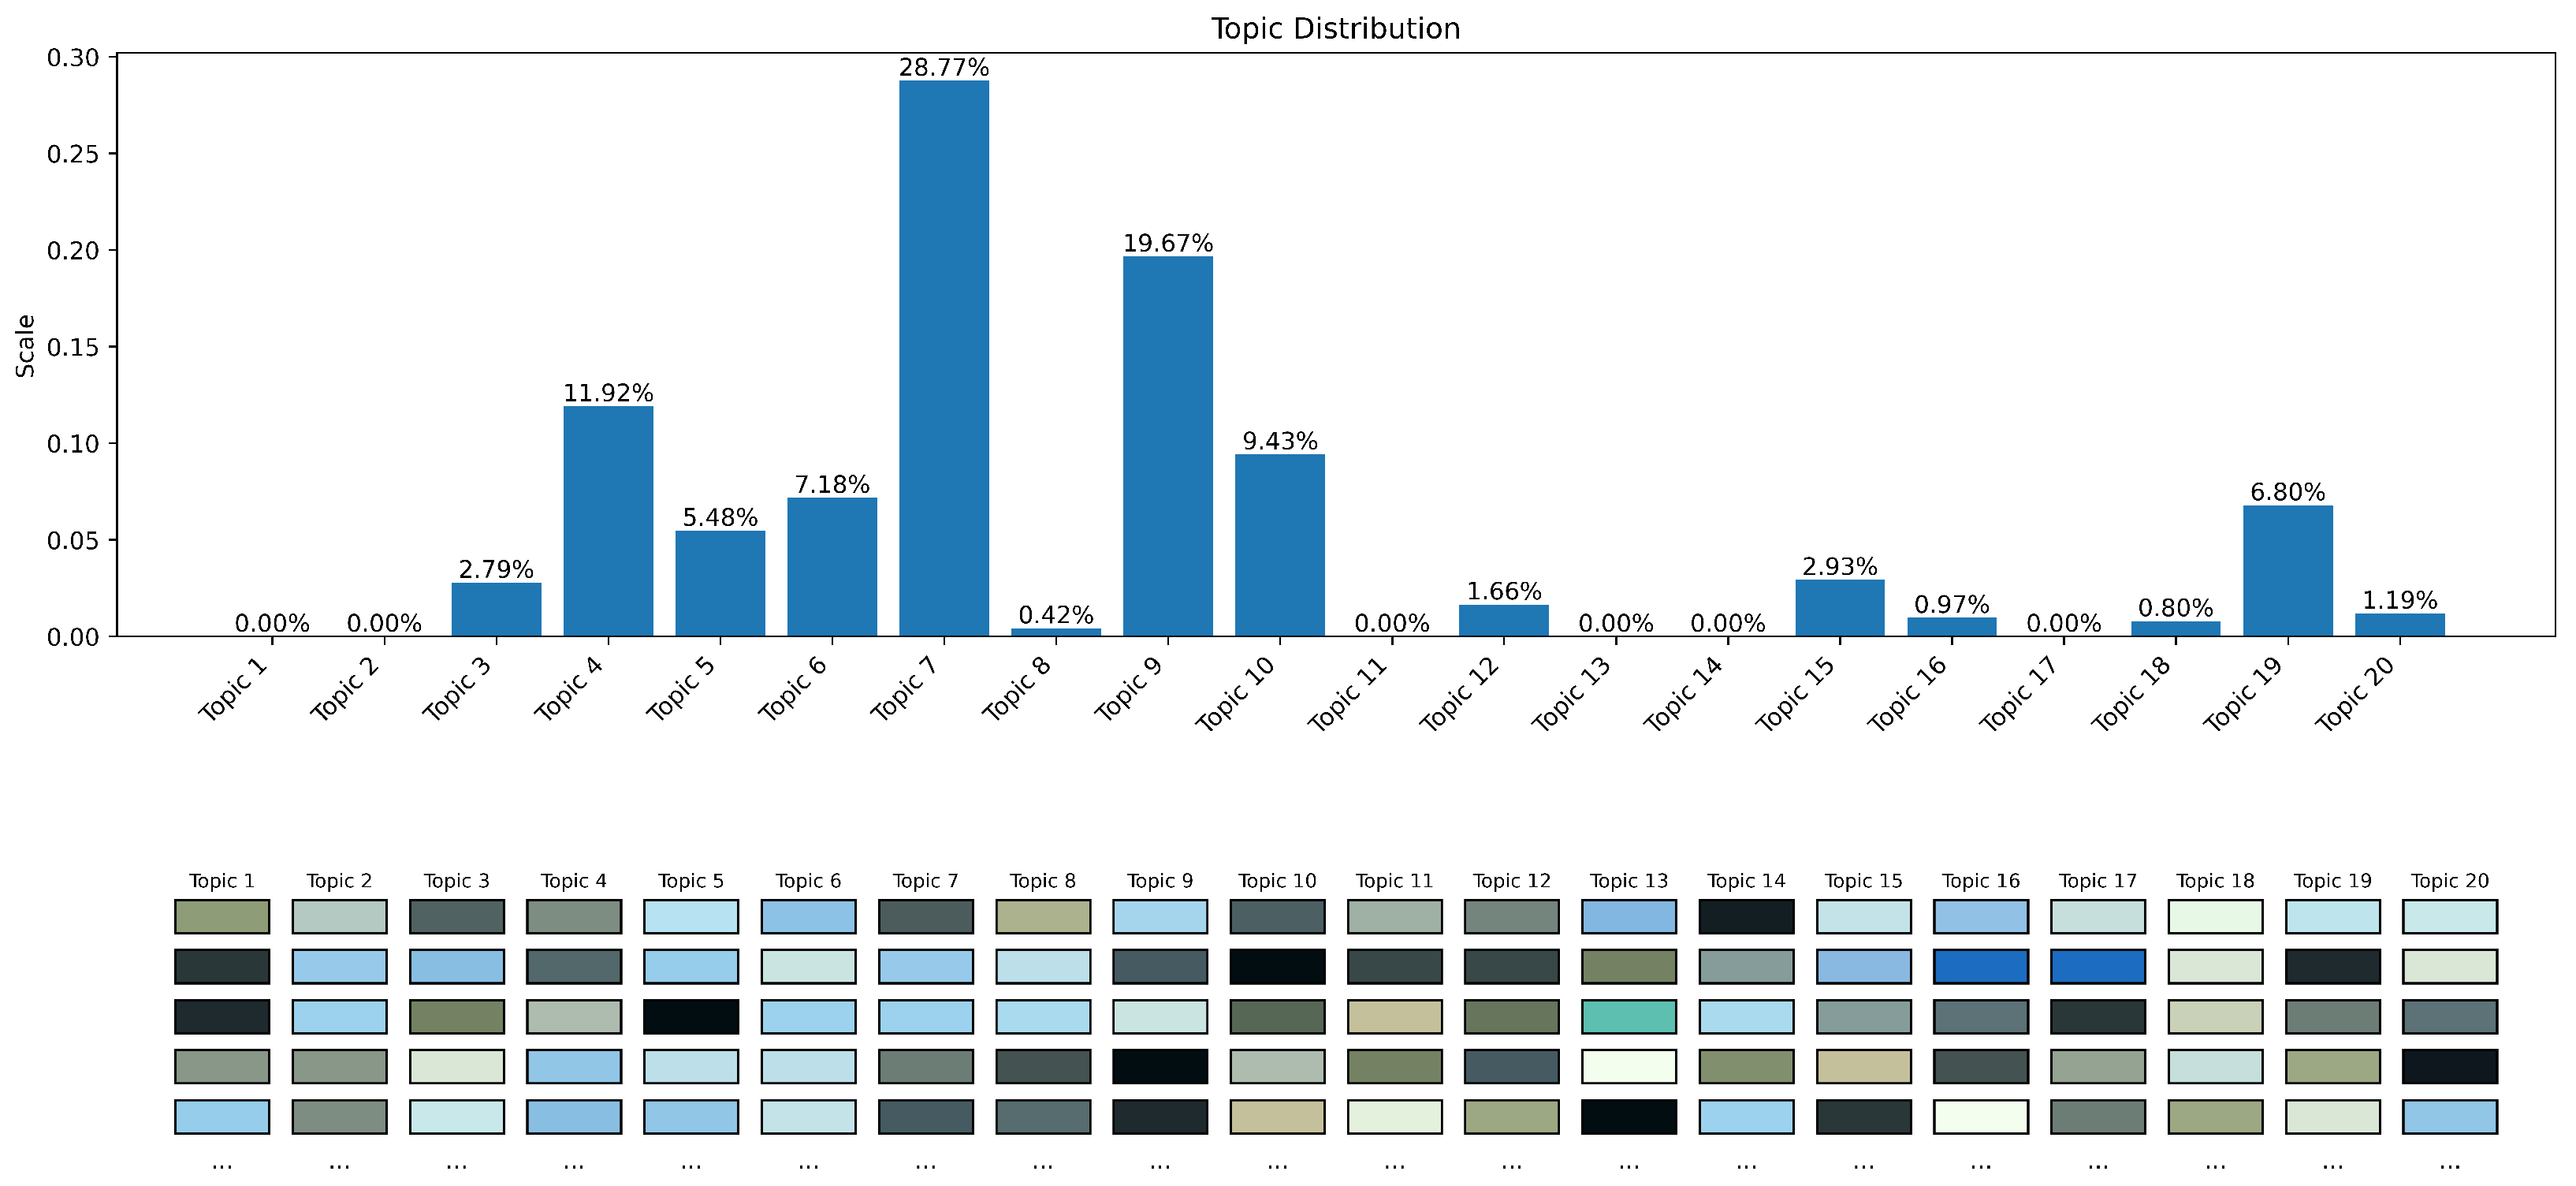
Through the training of the LDA model, we were able to learn the specific color profiles for each topic (as show in
Figure 8), denoted as
, along with the topic distribution per image, represented as
. This analytical process allowed us to identify latent color themes throughout the image collection, revealing both commonalities and divergences in color features across various images. The model was optimized using advanced probabilistic inference methodologies, primarily utilizing variational inference and Gibbs sampling algorithms. Specifically, we used the online variational Bayes algorithm implemented in the scikit-learn library for LDA training. The number of topics T was determined through experimentation and evaluation of topic coherence on a held-out validation set. We found that T = 20 provided a good balance between capturing diverse color themes and avoiding overfitting. We monitored the convergence of the variational inference algorithm by tracking the change in the lower bound of the log-likelihood. These iterative techniques aim to approximate the complicated probability distributions and enhance the log-likelihood of the observed data [
32]. Such methodological approaches facilitate robust parameter estimation of latent variables as well as modeling of the complex probabilistic dependencies inherent in the data.
3.4. Feature Fusion and Prediction
To accurately predict image harmony, deep features must be effectively fused with the LDA-derived color–topic features. We derived a compact deep feature vector, denoted as
f, by employing global average pooling on the feature map
that results from passing through n MASA-Inception modules:
where
C denotes the number of channels in the feature map. Global average pooling transforms the spatial information into a worldwide descriptor that captures the overall semantic content of the image.
Following this, the extracted deep feature
f is concatenated with the LDA color–topic feature
, resulting in a unified feature vector
v:
where
T signifies the number of topics identified by the LDA model. This fusion of features integrates deep semantic information alongside color statistics, yielding a more holistic representation that enhances the accuracy of subsequent harmony prediction.
Finally, we utilize a fully connected layer to map the fused feature vector
v to the corresponding harmony score of the image, followed by a sigmoid activation function:
where
and
represent the weight and bias parameters of the fully connected layer, respectively. The sigmoid function
constrains the output to the interval
, and effectively represents the predicted probability of image harmony.
In the context of generated image evaluation, this method successfully integrates the color statistics of an image extracted by the LDA model with its deep semantic information extracted using the convolutional neural network to practically assess the color harmony in generated color images. This methodology ensures that the color attributes of the generated images closely resemble those found in natural images, augmenting the ability of the model to effectively assess color harmony.
3.5. Loss Function
The loss function of the model includes two key components: image quality prediction loss and feature distribution loss. The image quality prediction loss aims to minimize the discrepancy between the predicted image quality scores and the actual ground truth labels. Meanwhile, the feature distribution loss enforces that the feature distribution of the generated images aligns with that of authentic images.
To quantify the image quality prediction loss, we utilize the mean squared error (MSE), which evaluates the variance between the predicted score, denoted as
, and the actual score, represented as
y:
Here, N denotes the total number of training samples, while and signify the predicted and actual scores for the i-th sample, respectively.
In addition to the image quality prediction loss, we incorporate a feature distribution loss informed by the FID [
33]. This particular loss function serves to constrain the similarity between the distributions of generated and authentic images within the feature space, relying on the deep features extracted by the MASA-Inception network.
This dual-loss framework not only enhances the quality of generated images but also reinforces their statistical similarity to real-world counterparts. Let
and
respectively represent the deep feature vectors of the real and generated images extracted by the MASA-Inception network. The mean and covariance of the vectors are represented as
and
, respectively. The feature distribution loss is then formulated as follows:
where
denotes the trace of a matrix and
indicates its square root. The loss term
quantifies the divergence between two multivariate Gaussian distributions, with a lower value signifying a closer resemblance between the two distributions. The overall loss function is a weighted sum of the image quality prediction and feature distribution losses.
The hyperparameters and are instrumental in adjusting the relative significance of these two components. The selection of these hyperparameters is task-dependent, and was empirically determined using a validation set. In our experiments, setting to 0.5 and to 0.025 resulted in optimal performance. This configuration balanced the accuracy of subjective quality score predictions and the similarity of feature distributions between the generated images and authentic infrared images.
By minimizing , the model simultaneously optimizes the prediction accuracy and quality of the generated images.
4. Experimental Results and Analysis
4.1. Data Preparation
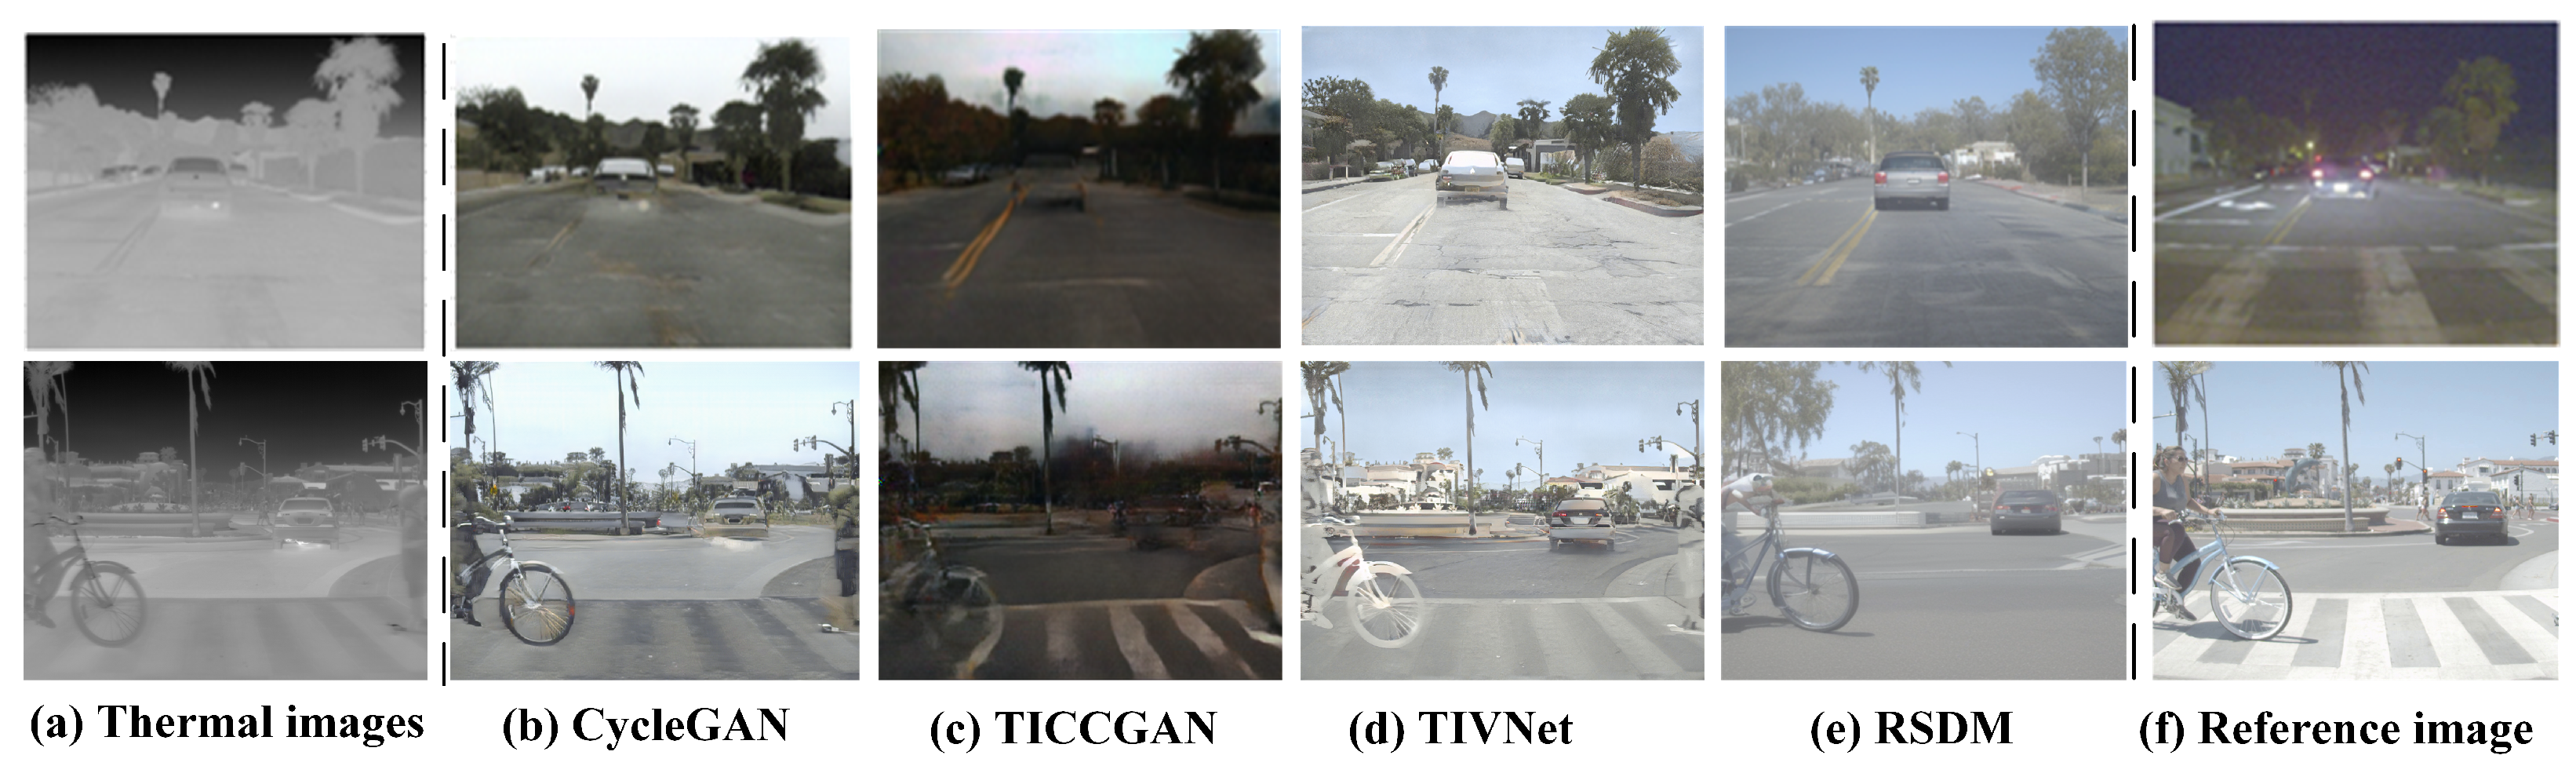
We developed a comprehensive dataset comprised of infrared images to assess the efficacy of various colorization algorithms specifically applied to urban road scenes. To facilitate this evaluation, we selected five representative colorization algorithms: CycleGAN [
7], TICCGAN [
26], TGCNet [
27], TIVNet [
9], and RSDM [
9]. This selection was strategically made to encompass a broad spectrum of approaches to infrared image colorization. Notably, we included GAN-based methods (CycleGAN and TICCGAN), networks that leverage thermal image visualization (TIVNet), and techniques centered around high dynamic range image fusion (TGCNet). This diverse algorithmic selection enabled a comprehensive evaluation of LDANet’s performance across varied colorization methodologies and the identification of potential artifacts. The algorithms were used to process infrared images of the same scene and generate a diverse set of colorized images.
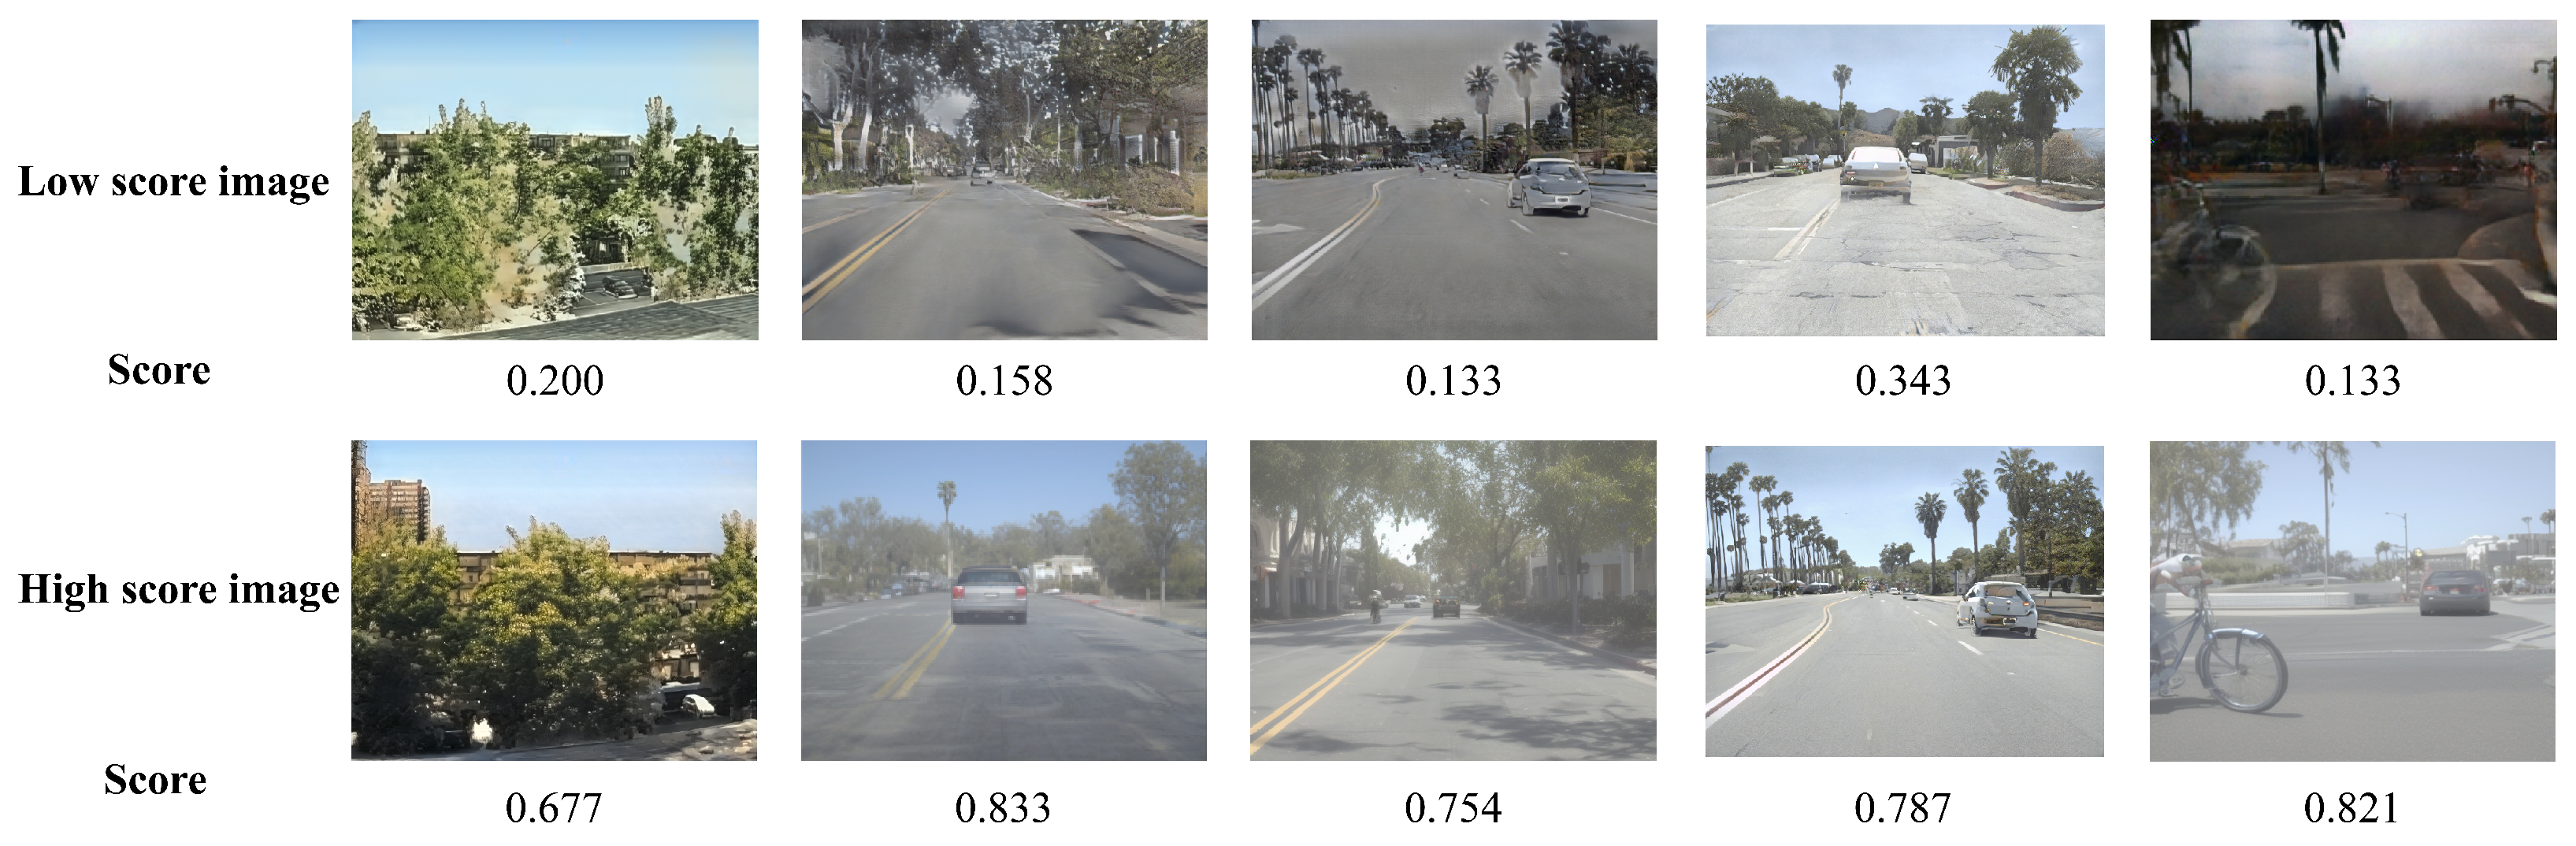
Following the generation of colorized images from the same infrared scenes, we assessed the subjective visual perception by enlisting a group of observers. These participants evaluated the colorized images based on three specific criteria: overall visual satisfaction, aesthetic appeal of the color combinations, and realism of the colors in relation to actual real-world scenes. Each criterion was rated using a standardized scoring scale ranging from 0 to 1. Prior to the assessment, observers were provided with detailed instructions regarding the scoring criteria and presented with examples of images exhibiting a range of quality levels. This preparatory stage was crucial for familiarizing the participants with the evaluation task and ensuring consistency in their scoring process.
As illustrated in
Figure 9, three distinct datasets were employed to evaluate the proposed method: FLIR [
34], KAIST [
6], and a proprietary dataset. The FLIR dataset comprises 8000 thermal images, each with a resolution of 640 × 512 pixels, representing a diverse array of urban and natural environments. Similarly, the KAIST dataset contains 8000 thermal images at the same resolution, with a specific focus on pedestrian detection across various lighting conditions. In addition to these established datasets, we developed our own comprehensive dataset, also consisting of 8000 thermal images (640 × 512 resolution). This self-constructed dataset was meticulously curated to reflect the intricacies of urban road settings. It encompasses a wide range of scenarios, including variations in road infrastructure, traffic dynamics, and diverse meteorological conditions, enabling a thorough evaluation of model performance against a broad spectrum of imaging characteristics and potential obstacles.
To mitigate the effects of individual biases among observers and address inconsistencies in scoring methodologies, we implemented a standardization process for the raw score data. We applied max–min normalization within the group for each observer’s score p on the five images within the same scene image group g. This technique effectively maps the highest score to a value of 1 and the lowest score to a value of 0 while linearly scaling the remaining scores to fit within the interval (0, 1). Max–min normalization is a widely utilized method that rescales data to a predetermined range based on the maximum and minimum values observed in the dataset.
The final color harmony score for each image was calculated by averaging the normalized scores obtained from all observers, ensuring a more reliable and consistent evaluation.
Figure 10 presents a comparative visualization of generated color images with low and high scores for reference.
Figure 11 showcases original infrared images alongside colorized versions generated by various algorithms across two distinct scenes.
Table 1 details the distribution of subjective scores assigned to each colorized image within these scenes, offering a clear framework for assessing the performance of the algorithm.
4.2. Experiment and Discussion of Results
The image dataset was systematically segmented into training, validation, and test sets to rigorously evaluate model efficacy. Specifically, 70% of the images were randomly allocated to the training set, while 15% were designated for each of the validation and test sets. During the training phase, a batch size of 32 was implemented, with a total of 100 epochs set for training and an initial learning rate fixed at 1 × 10
−5. To enhance the reliability of the findings, the experiment was conducted across ten iterations.
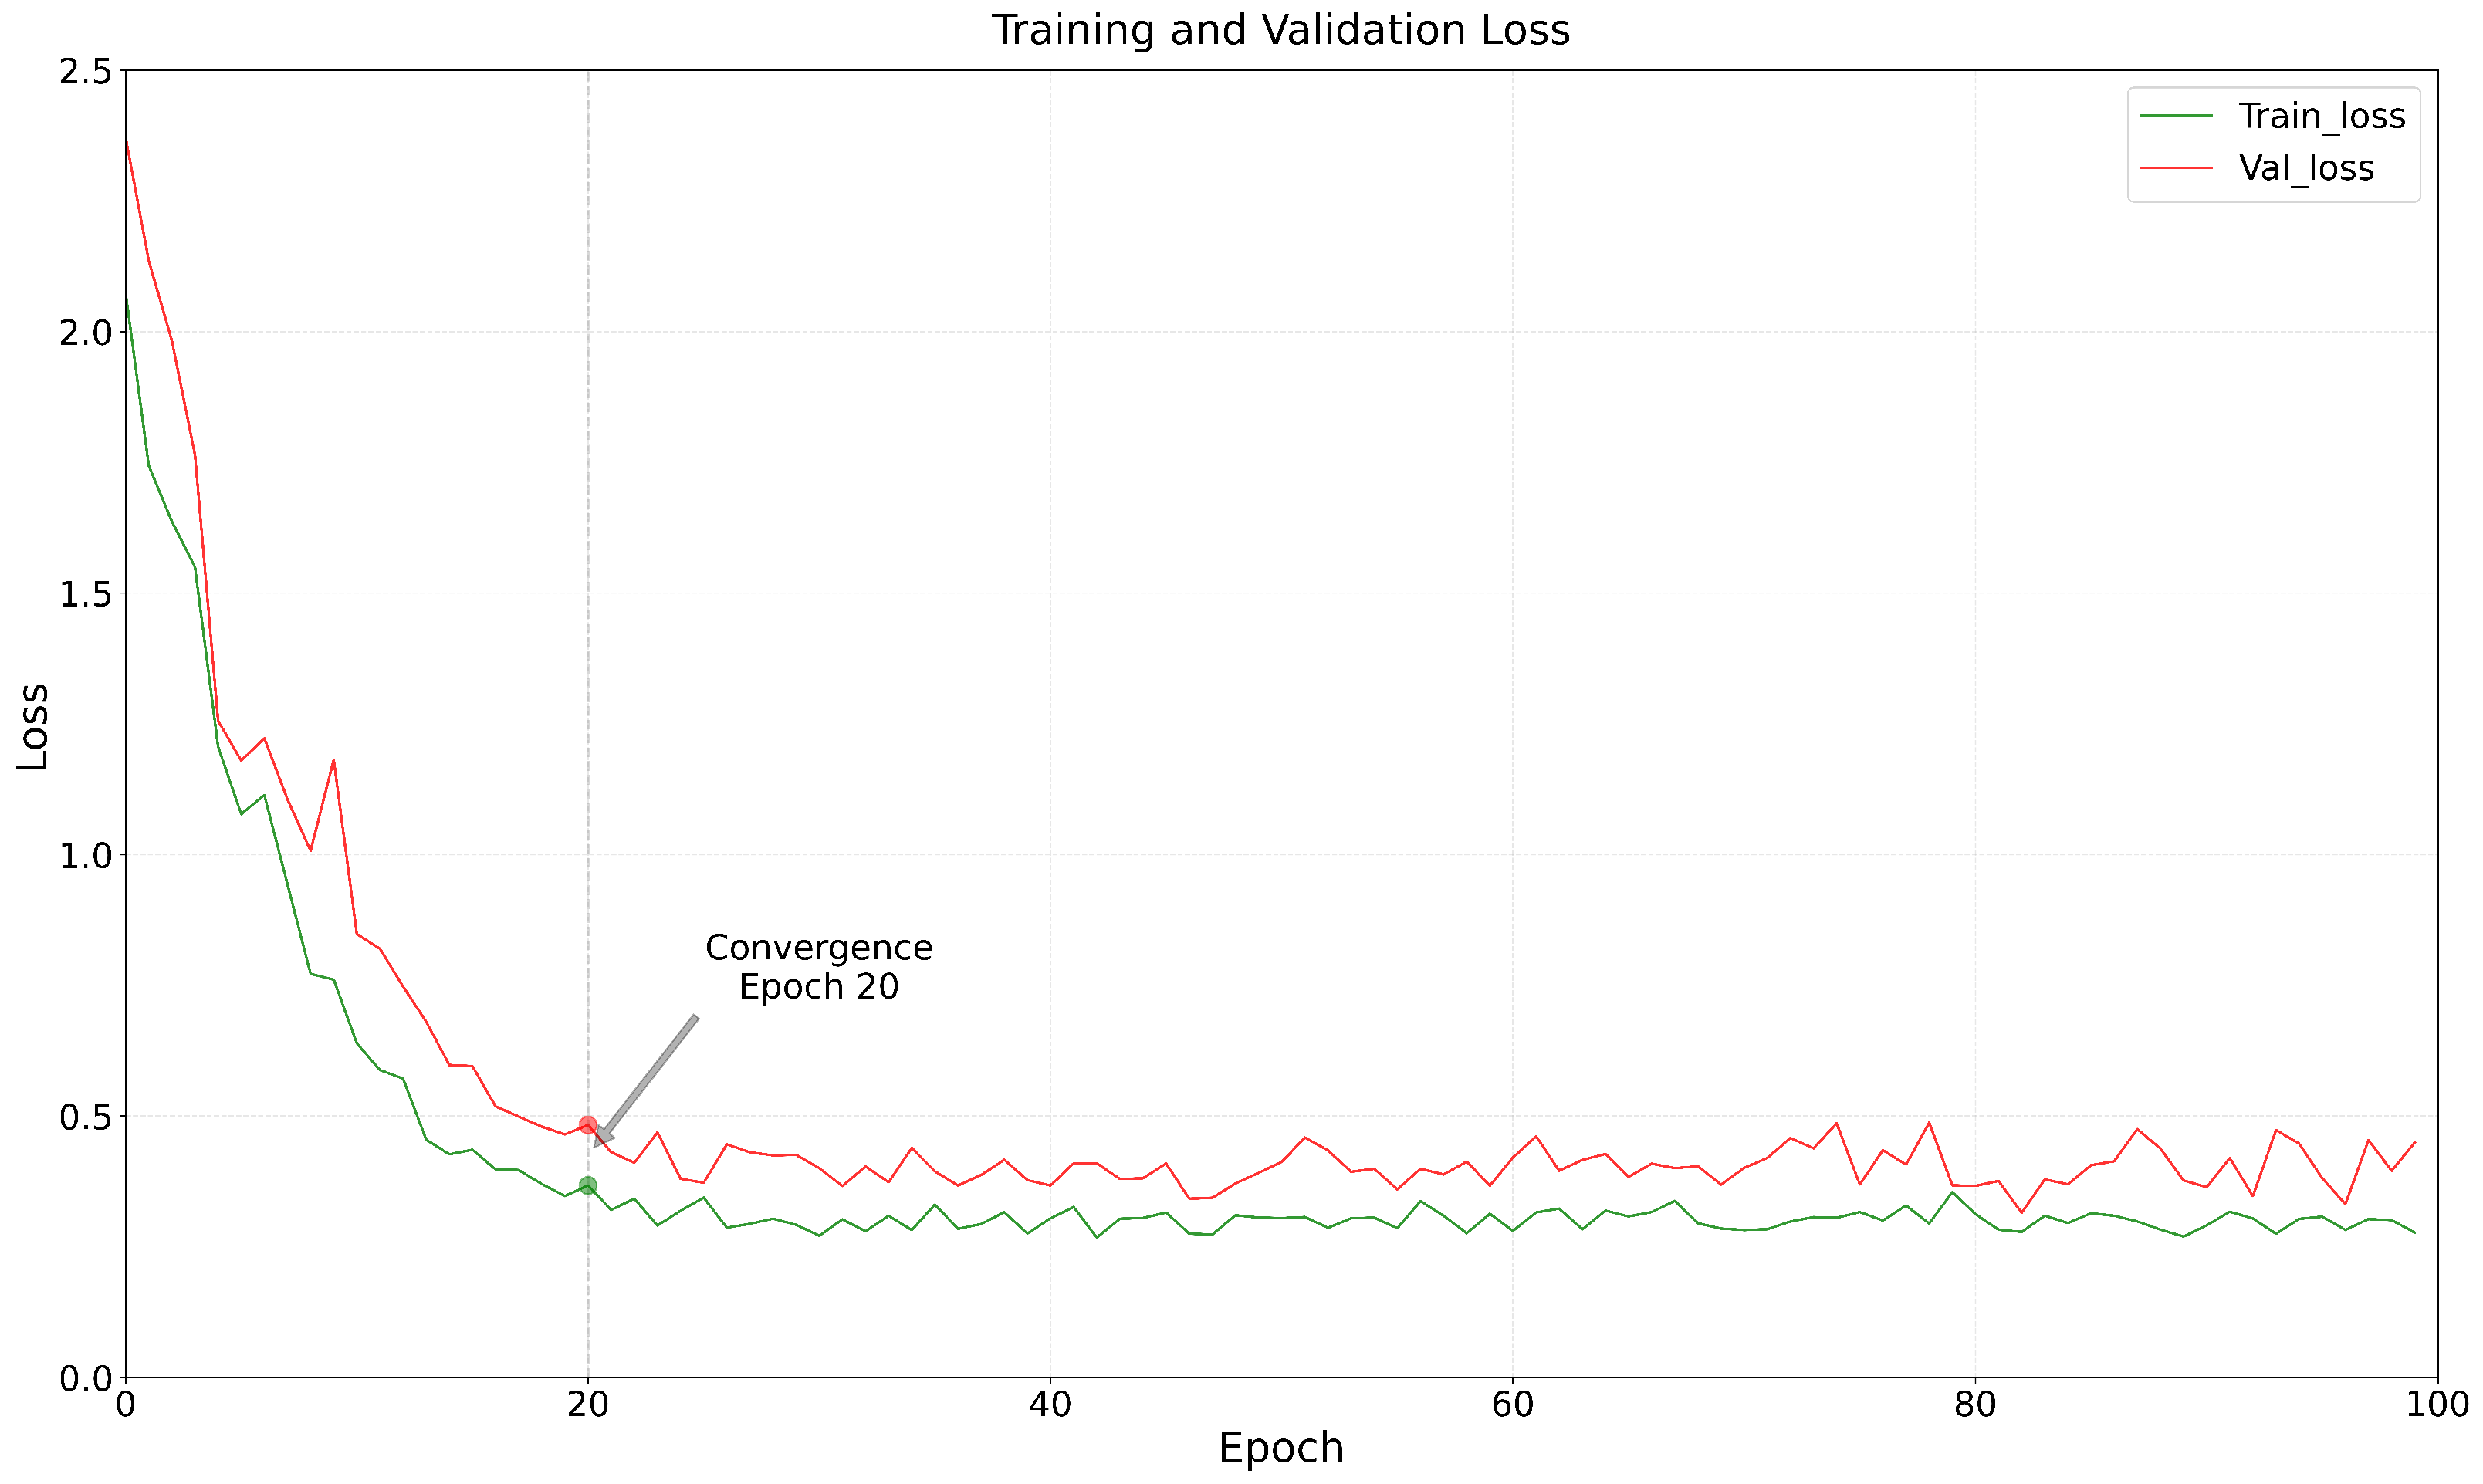
Figure 12 illustrates the results of performance evaluations on the test set, clearly indicating a strong correlation between the predicted scores of the color fusion images and the subjective scores derived from human visual assessment. Meanwhile,
Figure 13 depicts the curve representing the evolution of loss values throughout the training process. It can be seen that the observed loss values consistently decline and reach a stable state after approximately 20 epochs, suggesting that the model effectively converged after surpassing this threshold of training epochs.
4.3. Performance Comparison
To objectively evaluate the performance of these IQA methods, we used the Pearson linear correlation coefficient (PLCC), Spearman rank order correlation coefficient (SROCC), and root mean square error (RMSE) as evaluation metrics [
35]. The PLCC measures the linear correlation between predicted scores and subjective evaluations [
13], whereas the SROCC focuses on the monotonic relationship between these scores, specifically evaluating ranking consistency [
36]. The RMSE measures the average deviation between the predicted and subjective scores [
37]. An effective IQA method should ideally demonstrate high PLCC and SROCC values (approximate to 1) and low RMSE values (approaching 0), signifying strong alignment with subjective assessments as well as good accuracy and reliability.
Table 2 illustrates the performance metrics of various IQA methods applied to the FLIR, KAIST, and proprietary datasets. The experimental results reveal that the limitations of handcrafted features constrain traditional evaluation methods such as NRSL and HOSA, which fail to adequately capture color information. This deficiency results in subpar performance across all three datasets. In contrast, deep learning approaches such as NIMA and NIQE are trained on extensive datasets and show enhanced performance in various domains [
38]. However, their effectiveness in evaluating the quality of infrared colorized images remains constrained due to the inherent complexities involved in generating these images and the unique challenges associated with quality assessment in this domain. As
Table 2 shows, while NIMA and NIQE demonstrate some improvement over traditional methods, they still fall short on all three datasets when compared to our proposed LDANet method.
LDANet significantly outperforms the alternative methodologies on the FLIR dataset in terms of the performance metrics of PLCC, SROCC, and RMSE. Furthermore, LDANet exhibits impressive results on both the KAIST dataset and our custom dataset, further affirming its effectiveness. These findings demonstrate the robustness and efficacy of the proposed LDANet framework in assessing the quality of infrared colorized images, with its performance markedly exceeding that of both traditional and deep learning-based methods.
Notably, LDANet achieves PLCC and SROCC values greater than 0.88 along with RMSE values below 0.12 on all three datasets. This outstanding performance underscores the high degree of consistency and accuracy provided by LDANet in relation to subjective scoring, highlighting its advantages in the field of infrared colorized image quality assessment.
4.4. Computational Cost Analysis
The computational complexity of LDANet is primarily governed by the inception-based feature extraction module, and to a lesser extent by the LDA model during inference. The inception module, with its multiple convolutional layers and integrated attention mechanisms, is the main contributor to the overall computational cost. While the LDA model is less computationally intensive than the inception module during inference, its training phase requires a considerable amount of time.
To quantify the computational demand, we measured the inference time of LDANet on an NVIDIA RTX 3090 GPU. The average inference time for processing a single image is approximately 273 ms. In comparison, the inference times for NIMA and NIQE, evaluated on the same hardware are approximately 195 ms and 244 ms, respectively. This indicates that LDANet’s inference speed is comparable to NIQE and slightly slower than NIMA. However, the training time for LDANet is substantially longer, requiring approximately 4 h on an RTX 3090 GPU. This extended training duration is primarily attributed to the iterative nature of both the inception module’s training process and the LDA model’s parameter estimation.
Although LDANet exhibits a higher computational cost compared to some simpler NR-IQA methods such as NIQE, the significant improvement in accuracy, especially in its ability to capture color-related distortions, justifies this additional computational expense. This tradeoff is particularly acceptable in applications where precise quality assessment is paramount and real-time performance is not a strict constraint. For applications that demand extremely rapid processing, future work could explore optimization techniques such as model pruning, quantization, or knowledge distillation to reduce the computational burden.
4.5. Ablation Experiments
To further explore the influence of each component of the proposed algorithm on the quality assessment of generated images, we conducted a series of ablation experiments (refer to
Figure 2). The results of these experiments are summarized in
Table 3, which details the performance associated with various module configurations. Specifically, “LDA” refers to the color feature extraction module, which is responsible for capturing the color information inherent in the image. The convolutional block attention module (CBAM) enhances the responsiveness of the model to critical features by integrating spatial and channel attention mechanisms. Additionally, “multichannel attention (MCA)” pertains to the multiscale channel feature extraction module, which adeptly extracts channel features across multiple scales. Additionally, we introduce the self-consistent FID (selfFID), which measures the feature alignment between the generated color image and the original image by calculating the distance between them in a high-dimensional feature space.
Table 3 elucidates the influence of each module on the performance metrics of the model. Exclusive application of the LDA module yields inadequate results (PLCC = 0.472, SROCC = 0.627, RMSE = 0.421), underscoring that reliance on color feature extraction alone does not suffice for achieving good quality assessments. Incorporation of the selfFID module provides a significant performance improvement (PLCC = 0.726, SROCC = 0.711, RMSE = 0.196), highlighting its efficacy in discerning the distinctions between generated images and their original counterparts within a high-dimensional feature space. Moreover, integration of the CBAM module further refines the focus of the model on critical features, leading to an additional enhancement in performance metrics (PLCC = 0.883, SROCC = 0.764, RMSE = 0.183). Notably, the model incorporating all modules—LDA, CBAM, MCA, and selfFID—achieves the pinnacle of performance (PLCC = 0.915, SROCC = 0.920, RMSE = 0.105). To further analyze the specific contribution of the LDA module, which is responsible for incorporating color fidelity information, we also evaluated a configuration excluding LDA but retaining CBAM, MCA, and selfFID. The results for this configuration are included in
Table 3. These findings substantiate the effectiveness of the proposed methodology, demonstrating that each module contributes distinctly to an overarching enhancement in performance.
The results from the ablation experiments emphasize the critical importance and irreplaceability of the LDA, CBAM, MCA, and selfFID modules, which function synergistically to improve model performance and facilitate precise quality assessment of the generated images. Notably, the sequential addition of the selfFID, CBAM, and MCA modules increased the PLCC and SROCC values of the model by 0.443 and 0.293, respectively, and decreased the RMSE value by 0.316, verifying the effectiveness of these module designs. Furthermore, comparing the full model with the configuration excluding LDA clearly demonstrates the significant contribution of color information to the overall performance. The removal of LDA results in a noticeable drop in all metrics, confirming its importance for accurate quality assessment of colorized images.
5. Conclusions
In this research we have introduced LDANet, a groundbreaking no-reference evaluation model designed to assess the quality of colorized infrared images. LDANet uniquely combines color features derived from LDA with multiscale spatial features, leveraging attention mechanisms to provide a thorough evaluation of colorized image quality. The experimental findings indicate that LDANet significantly outperforms various state-of-the-art methodologies. Furthermore, ablation studies confirm the efficacy of each component within the model, underscoring the critical role of color features in the process of evaluating colorized infrared images. Thus, this study offers a novel perspective and methodology for image quality assessment, particularly in relation to colorized infrared imagery.
In future, we intend to explore the applicability of LDANet in other domains of image and video quality assessment. Specifically, we will assess its capabilities in evaluating the quality of diverse generated images, including those created by GANs, and expand our analysis to modalities such as medical imaging and satellite photography. In addition, we will investigate the suitability of LDANet for evaluating video quality, particularly where maintaining temporal consistency in colorization is crucial. Another aim is to enhance the model’s architecture through techniques such as network pruning and knowledge distillation, with the goal of improving the efficiency of real-time evaluations, especially in resource-constrained applications. While the FLIR dataset and our custom dataset contain some natural scenes, a more comprehensive evaluation of LDANet’s performance on diverse infrared image types, e.g., industrial settings and natural landscapes with different characteristics, remains necessary in order to fully establish its generalizability. This will be a key focus of future work, where we plan to incorporate additional datasets representing a broader range of infrared imaging scenarios.


