Article

Parathyroid Gland Detection Based on Multi-Scale Weighted Fusion Attention Mechanism

1
College of Intelligence and Computing, Tianjin University, Tianjin 300072, China
2
College of Computer and Data Science, Fuzhou University, Fuzhou 350116, China
3
Department of Computer Science, University of Northern British Columbia, Prince George, BC V2N 4Z9, Canada
4
Department of Thyroid Surgery, Fujian Medical University, Fuzhou 350001, China
*
Authors to whom correspondence should be addressed.
Electronics 2025, 14(6), 1092; https://doi.org/10.3390/electronics14061092
Submission received: 24 January 2025 / Revised: 2 March 2025 / Accepted: 6 March 2025 / Published: 10 March 2025
(This article belongs to the Special Issue Artificial Intelligence Innovations in Image Processing)

Abstract

:
While deep learning techniques, such as Convolutional neural networks (CNNs), show significant potential in medical applications, real-time detection of parathyroid glands (PGs) during complex surgeries remains insufficiently explored, posing challenges for surgical accuracy and outcomes. Previous studies highlight the importance of leveraging prior knowledge, such as shape, for feature extraction in detection tasks. However, they fail to address the critical multi-scale variability of PG objects, resulting in suboptimal performance and efficiency. In this paper, we propose an end-to-end framework, MSWF-PGD, for Multi-Scale Weighted Fusion Parathyroid Gland Detection. To improve accuracy and efficiency, our approach extracts feature maps from convolutional layers at multiple scales and re-weights them using cluster-aware multi-scale alignment, considering diverse attributes such as the size, color, and position of PGs. Additionally, we introduce Multi-Scale Aggregation to enhance scale interactions and enable adaptive multi-scale feature fusion, providing precise and informative locality information for detection. Extensive comparative experiments and ablation studies on the parathyroid dataset (PGsdata) demonstrate the proposed framework’s superiority in accuracy and real-time efficiency, outperforming state-of-the-art models such as RetinaNet, FCOS, and YOLOv8.

1. Introduction

In laparoscopic thyroidectomy, injury to the parathyroid glands might result in persistent hypocalcemia in postoperative patients. Consequently, it is crucial to identify and protect the parathyroid glands from injury during surgical procedures. However, parathyroid glands are diminutive structures susceptible to congestion and occlusion during laparoscopic thyroidectomy, which complicates precise identification even by experienced surgeons [1]. Consequently, the advancement of efficient parathyroid detection techniques has emerged as a critical research focus requiring immediate attention within the medical domain [2].
During surgery, there are numerous ways to identify the parathyroid glands. Among these, the anatomical parathyroid in situ protection technology uses advanced anatomical techniques to identify and safeguard the parathyroid glands [3]. It covers techniques including frozen pathological sections, nanocarbon negative development, and intraoperative fast PTH detection. However, these techniques are typically intrusive, time-consuming, and unduly reliant on the surgeon’s skill and exact knowledge of the anatomical placement of the parathyroid glands. On the other hand, a non-invasive, real-time technique for identifying parathyroids is offered by near-infrared induced autofluorescence (NIRAF) technology [3]. NIRAF technology identifies parathyroid glands using the autofluorescence that parathyroid tissue emits when exposed to near-infrared light. The unique fluorescent characteristics of parathyroid tissue are the basis for this technology. The near-infrared components in the operating room lights can easily interfere with NIRAF detecting technology, and the operating room lights’ adjustments may impact the surgical procedure. Furthermore, to detect NIRAF signals, this technology requires a particular imaging system, which has equipment requirements [3]. Therefore, surgeons have pursued more efficient, accurate, dependable, and direct techniques for identifying the parathyroid glands. The advancement of artificial intelligence technology enables artificial neural networks to offer a new framework for automatic detection and classification of parathyroid glands [3].
In recent years, deep learning has been extensively applied in multiple domains. Due to significant advancements in deep learning within the medical domain, researchers have investigated automated parathyroid detection techniques based on deep learning [2,3]. Deep learning technologies employ neural networks to analyze the features of parathyroid glands from extensive medical imaging, facilitating the automatic detection and identification of these glands [2]. Advances in computing power and medical imaging technology have enabled researchers to leverage deep learning algorithms for automatic parathyroid gland detection. However, significant challenges and limitations remain in achieving robust and efficient PG detection. In laparoscopic surgery, challenges such as disrupted blood supply, scalpel traction, and target obstruction may occur [4,5], resulting in target deformation, varying target sizes, significant color variation, and pronounced multi-scale issues [3]. In existing methods, as the number of convolutional neural network (CNN) layers increases, despite the improved high-level feature extraction capability, shallow spatial information would be gradually lost. Consequently, feature maps in deep layers lack fine-grained spatial details and impair small targets’ precise localization.
Thus, current research needs a more efficient and accurate detection model that can adjust to PG multi-scales. This paper proposes a novel end-to-end Multi-Scale Weighted Fusion Detection framework for Parathyroid Gland Detection (MSWF-PGD) to tackle the challenge of PG object detection. MSWF-PGD initially extracts feature maps of varying scales from convolutional layers and subsequently re-weights them through cluster-aware multi-scale alignment from diverse perspectives (e.g., sizes, colors, and position of PGs based on prior knowledge), thereby incorporating critical multi-scale information and remarkably enhancing both accuracy and detection efficiency. Furthermore, to enhance effective scale interactions, we adaptively integrate these multi-scale feature maps by augmenting the scale weights through Non-Local Block with Multi-Scale Aggregation, thereby supplying more informative and precise localization details for the subsequent detection module, which employs a multi-scale weighted fusion strategy informed by prior information, including size, color, and position. The enhanced Multi-Scale Weighted Fusion Detection framework effectively captures multi-level details through hierarchical fusion and incremental feature optimization, offering a more precise and comprehensive representation, outperforming other PG detection methods. Experimental results on the PG dataset show that our framework significantly improves detection speed and accuracy against challenging scenarios for target detection. Our method shows the profound potential of effectively tackling the multi-scale issue of PG detection tasks. The main contributions of this paper are as follows:
  • We propose a novel end-to-end Multi-Scale Weighted Fusion Detection framework (MSWF-PGD) to enhance the accuracy and efficiency of parathyroid gland detection.
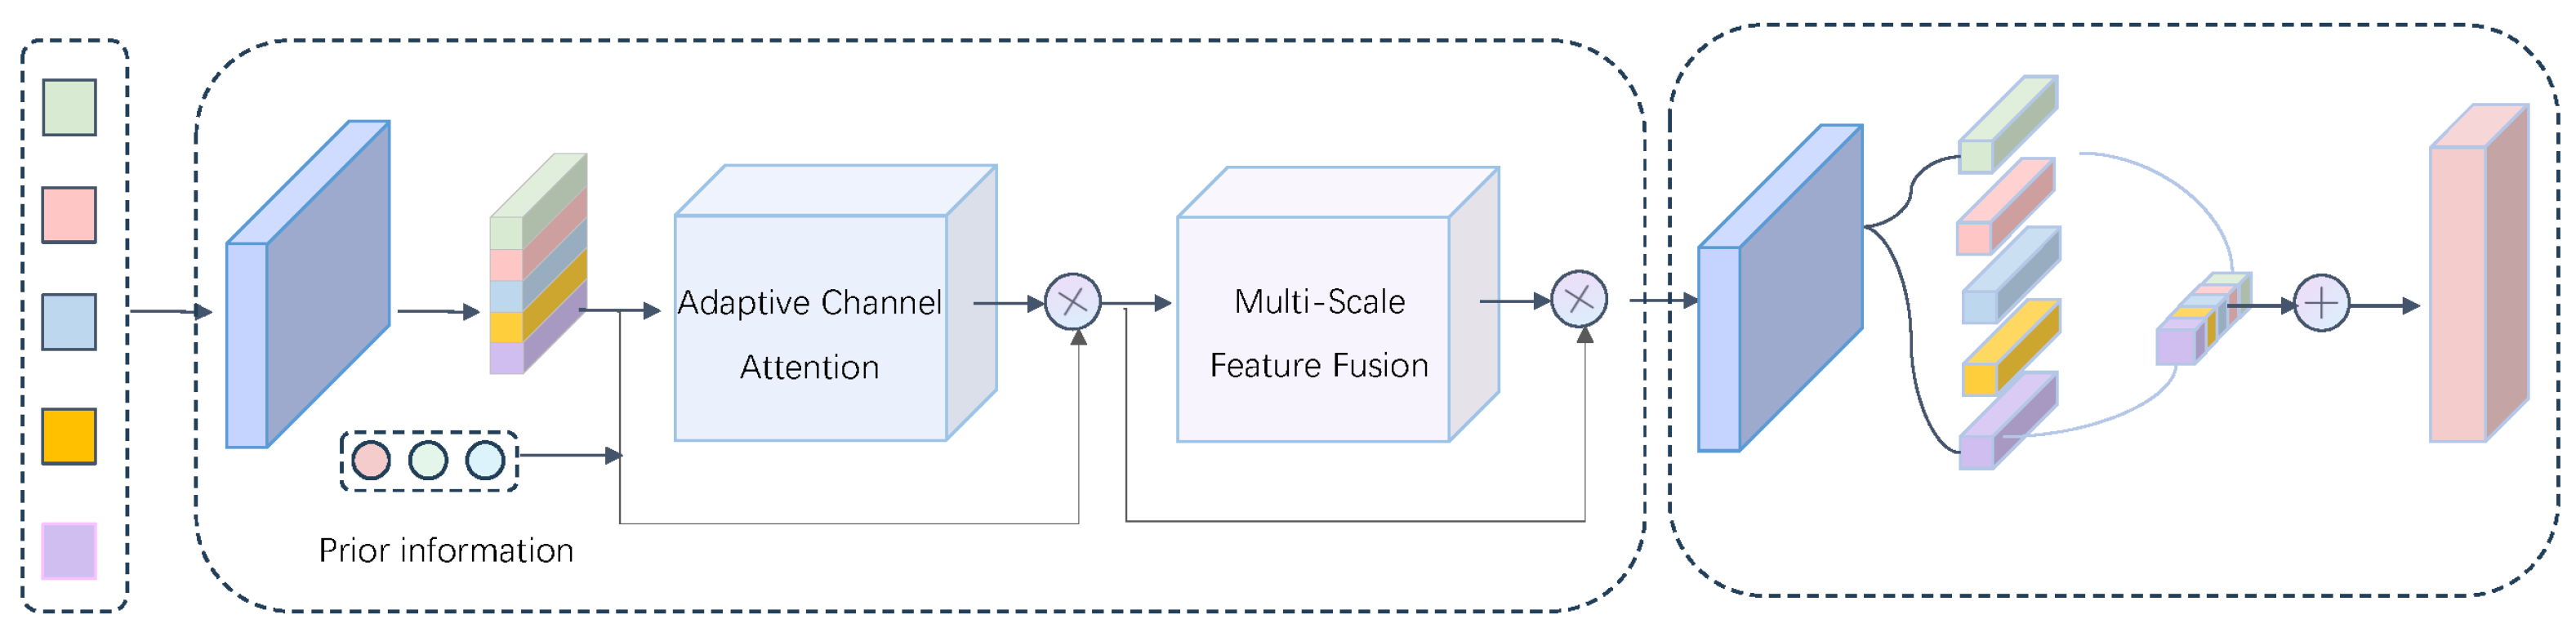
  • Our approach incorporates critical multi-scale information by extracting feature maps at multiple scales, and we re-weight them using cluster-aware multi-scale alignment. These feature maps are further refined with the Non-Local Block and Multi-Scale Aggregation (NL-MSA) to provide more precise localization.
  • We collected and pre-processed a dataset of 13,740 endoscopic parathyroid gland images, providing a valuable resource for future studies. Experimental results demonstrate that our framework outperforms state-of-the-art object detection methods.
The remainder of this paper is organized as follows: Section 2 reviews related work; Section 3 introduces the PG detection model, problem formulation, and the proposed algorithm; Section 4 presents the experimental results and analysis; and Section 5 concludes with a summary and future directions.

2. Related Works

This section is divided into two parts. The first part provides some methods of Object Detection. The second part describes Parathyroid Gland Detection.

2.1. Object Detection

Applying deep learning in computer vision has led to significant advancements in object detection. Deep learning-based feature extraction methods, particularly those that utilize CNN, have become prevalent across various target detection fields. Object detection models that employ CNN can be categorized into two-stage and single-stage algorithms [6,7].
In two-stage object detectors, the first stage involves generating candidate regions or proposal boxes. In the second stage, a convolutional neural network encodes the feature vectors from these regions, classifying and predicting the targets. The region-based convolutional neural network (R-CNN) [8] introduced deep learning to object detection, pioneering the two-stage detection approach. In 2015, Ross Girshick et al. improved R-CNN with the Fast R-CNN detector [9]. Later, in 2017, Ren et al. built on Fast R-CNN to develop Faster R-CNN [10], significantly increasing the model’s speed and introducing a near-real-time detection capability. Faster R-CNN also enabled end-to-end training, marking a significant advancement in detection efficiency.
Single-stage object detectors distinguish themselves from two-stage models by eliminating the need to generate separate candidate regions. Instead, they perform a single detection step to make predictions directly. In 2015, W. Liu et al. introduced the SSD [11] network, a multi-scale and multi-resolution single-stage detector optimized for small object detection. SSD is known for its speed and competitive accuracy compared to traditional region proposal-based models. In 2019, FCOS [12] was developed as a center-based, anchor-free, single-stage detector. Additionally, Lin et al. created RetinaNet [13] to tackle class imbalance, achieving the accuracy levels of two-stage detectors while retaining the speed advantage typical of single-stage models. One of the most recognized models in single-stage object detectors is YOLO (You Only Look Once) [14], introduced by R. Joseph et al., which reframes object detection as a regression problem and achieves predictions through direct regression. The YOLO series of classic target detection algorithms include YOLOv3, YOLOv4, YOLOv5, YOLOX, YOLOv8, and YOLOv11 [15], etc. Another single-stage detection methods is EfficientDet [16]. EfficientDet is designed using a compound scaling method that simultaneously optimizes the network’s depth, width, and resolution, enabling the model to achieve an optimal balance between computational efficiency and accuracy. FoveaBox [17] is a single-stage target detection algorithm inspired by the concept of foveal vision. Its core idea is to simulate the “foveal” mechanism of the human visual system and enable efficient target detection by focusing on features across different scales.
FCOS effectively handles multi-scale objects by making predictions on feature maps of different scales and directly regressing the object’s bounding box and category information from the image [12]. RetinaNet uses a feature pyramid network (FPN) to fuse features of different scales [13]. FoveaBox simulates the “fixation point” mechanism in the human visual system and enhances the detection capability of multi-scale objects by making predictions on feature maps of different scales [17]. The YOLO series of algorithms enhance the detection capability of multi-scale targets by making predictions on feature maps of different scales [15]. For example, YOLOv3 makes predictions on three scales, YOLOv5 introduces a multi-scale training strategy, and YOLOX adopts a more efficient feature fusion method.
These algorithms effectively solve the multi-scale problem in target detection by making predictions on feature maps of different scales, introducing feature pyramid networks, simulating human visual mechanisms, and adopting compound scaling methods [15]. However, the existing target detection algorithms still have the following problems: First, in terms of feature fusion, existing methods usually use a simple weighted fusion method to solve the multi-scale problem of medical images, rarely considering the guiding role of prior information on the model, and there is no suitable mechanism to guide the dynamic weighted fusion of features. Secondly, although some existing studies have improved detection accuracy by adopting complex modules and structures, the vast amount of computation it brings makes it challenging to apply to the requirements of real-time detection of medical images.

2.2. Parathyroid Gland Detection

Automatic parathyroid gland detection based on deep learning is a challenging task. After years of development, many methods [2,3,18] have been proposed. Based on CNN, Wei et al. [18] introduced an automatic detection and segmentation system that learned parathyroid gland properties in ultrasound images and achieved high recognition rates [18]. This method dramatically improves accuracy by using CNN’s feature extraction capabilities. However, the CNN model could be more stable with visual noise and modal variations and requires high-quality annotated data, limiting its practical use. To further refine algorithm selection for identifying parathyroid glands during endoscopic thyroid surgery, Wang et al. compared the performance of several deep learning models, including YOLOv3, Faster R-CNN, and Cascade [3]. Their results indicate that Faster R-CNN outperforms the others in both recognition rate and processing speed. However, the robustness of the model is limited, as it is sensitive to image noise in complex surgical environments. To address the challenge of parathyroid gland detection in noisy environments, Liu et al. [2] improved PGNet by incorporating an anti-noise feature extraction module, an elliptical anchor box, and an attention mechanism to improve gland localization accuracy [3]. The attention module effectively focuses on critical areas, significantly reducing background noise’s impact on detection outcomes. However, the complex network architecture increases computational demands, limiting the model’s efficiency for real-time surgical applications. Unlike the study by Liu et al., Pre-training the model on unlabeled data and migration to annotated datasets significantly improves the detection performance of the parathyroid model [3]. Different from Wang’s research, Considering that PG detection is easily disturbed by illumination and tissue similarity factors, Liu et al. [19] used a graph attention network (GAT) to capture the complex relationship between the parathyroid gland and surrounding tissues to improve detection accuracy. Although Graph Attention Networks can Improve detection accuracy, its feature extraction capabilities still need to be verified on large datasets, and its adaptability to different patient groups still requires further research.
Despite advancements in deep learning techniques for PG detection, several challenges persist. Surgical congestion and compression can impair detection accuracy, while multi-scale issues may lead to model overfitting and reduced performance. However, current research has yet to sufficiently address these challenges. As a result, deep learning systems need further refinement to improve PG detection in complex surgical settings and enhance clinical reliability.

3. Proposed Methods

Considering the challenges posed by blood supply destruction, scalpel manipulation, and target occlusion during laparoscopic surgery, resulting in targets exhibiting significant size variation and substantial differences in brightness and darkness, the multi-scale issue becomes particularly pronounced. Consequently, this study introduces a Multi-Scale Weighted Fusion Framework for Parathyroid Gland Detection to address the low detection accuracy and multi-scale challenges more effectively.

3.1. Network Architecture

In light of the challenges presented by blood supply destruction and scalpel manipulation, this study employs CSPDarknet as the foundational framework to tackle the problem of detecting multi-scale changes in PG. It introduces a novel end-to-end Multi-Scale Weighted Fusion PG Detection method. This enables the adaptation of the fusion effect to changes in the model, accommodates the distribution of samples across different scales, and improves the model’s resilience. The proposed network architecture is illustrated in Figure 1.
Initially, we extract feature maps of different scales from the convolutional layers and re-weight them by cluster-aware multi-scale alignment from multiple perspectives (e.g., target size and color of PGs based on prior information). Scale-aware convolution is introduced in YOLOv8. Convolution kernels or convolution operations of different scales are designed based on prior scale information so that convolution operations can adapt to the extraction of target features of different scales. We design an adaptive fusion module, introduce an adaptive mechanism during feature fusion, and dynamically adjust the fusion method of each layer of features based on prior information (such as size, position, color, etc.). After integrating the information, we use adaptive hyperparameters to optimize the impact of scale attributes across different levels.
The model utilizes a feature extraction backbone based on the CSPDarknet residual network, which generates feature maps at three scales. These feature maps are then processed through a feature pyramid network (FPN) and a path aggregation network (PAN), producing feature maps at five different scales, typically denoted as { p 3 , p 4 , , p 7 } .
Initially, the feature maps produced at each scale are fed into the primary component of the Neck: a multi-scale dynamic weighted fusion framework. The feature maps from the five scales are either upsampled or downsampled to match the feature map with the highest weight ratio derived from previous information. The upsampled or downsampled feature maps are subsequently multiplied by the appropriate weights of their respective scales, and the results of these multiplications are summed. After that, the aggregated findings are optimized by non-local attention [20] to improve feature representation, finally producing new feature maps across five scales. Second, the Neck’s adaptive scale feature contribution adjustment structure receives feature maps from its five scales to adapt the fusion impact to the model. The model automatically fine-tunes the five scales’ contribution to feature fusion during training by adjusting hyperparameter weights w i for each scale, helping it learn semantic and positional information of varying scale sizes. The final feature maps of the Neck are provided to the object detection head for target classification and regression.

3.2. Prior Feature

To address the underutilization of essential features and to tackle multi-scale problems, this study begins by gathering information on the size, color, and position of the PGs. This information is then integrated into a multi-scale module of the model, which helps guide the learning process and accelerate convergence. In the convolutional layers, feature maps of various scales are extracted and undergo cluster-aware multi-scale alignment. These alignments are used to assign weights to features of different scales, facilitating the weighted fusion of multi-scale information and optimizing the detection of targets across diverse scales.

3.2.1. Size Information

During surgery, disruptions in blood flow, scalpel movements, and blockages can alter the target’s size, brightness, and color. To determine the dimensions of the PG, we start by extracting the width (w) and height (h) of the real bounding boxes from the training PG images. These bounding boxes are then mapped onto a two-dimensional plane based on their width and height. Next, we apply a GMM (Gaussian Mixture Model) cluster-aware detector with five clusters to analyze the distribution of width and height in the PG dataset. For Size Encoding, the target’s width (w), height (h), and area values are used as input features. Since the size ranges of different targets can vary significantly, normalization is applied to the width and height to mitigate the impact of scale differences:
Encoded Size = [ w , h , w × h ] w norm = w W , h norm = h H
where W denotes the image width and H denotes its height.
The cluster-aware vector enables the accurate classification of PG into specific scale categories, hence improving the efficiency of feature map weight extraction for different scales based on the target’s dimensional attributes. Figure 2 illustrates that the dark blue region in the lower left represents a smaller-scale target, whereas the light blue region denotes a larger-scale target. Clustering can be used to divide parathyroid glands of various scales reasonably, and it is easier to obtain the weights of different scales in the dimension of the target size.

3.2.2. Color Information

In the three-channel RGB image, we isolated the parathyroid target. As illustrated in Figure 3, some parathyroid glands display distinct color differences.
Since the PG’s surface contains distinct color information, we isolate the PG from the training images using the RGB color model. We extract data from the B, G, and R channels of each normalized image, then combine and average the data from all channels using the following formula:
B = i = 1 W H B i , G = i = 1 W H G i , R = i = 1 W H R i , C m = 1 3 ( B + G + R ) .
where W and H denote the width and height of the target box, respectively, the variable i represents the position of a pixel, and W H signifies the total count of pixels within the target box. Additionally, B i denotes the value of pixel i in channel B.
The color information dimension is integrated with the goal and associated target area sizes. A list of areas is created for each target color information. The color and area information are aggregated according to the goal size. The outcome is illustrated in Figure 4. The clustering result figure indicates that, across various area categories, targets of differing sizes amalgamate the color information from the three channels they represent.
In Figure 4a, the color values represent the clustering distribution of the target color features. Each point represents a target region, and the color indicates the cluster to which it belongs. For example, yellow points represent Cluster 0, green points represent Cluster 1, dark green points represent Cluster 2, blue points represent Cluster 3, and purple points represent Cluster 4. In Figure 4b, the color values represent the relationship between the target area and clustering categories. The color of each point indicates the cluster to which it belongs, with the color mapping consistent with that in Figure 4a.

3.2.3. Position Information

Object positioning is crucial for various detection tasks, as it helps to understand the relative locations of objects within an image. Explicit encoding can be utilized to incorporate positional information as prior knowledge for feature fusion. This approach directly leverages coordinate information to generate feature maps that guide feature fusion. Using two-dimensional coordinates ( x , y ) , we construct explicit position encodings tailored for feature maps, as illustrated in Figure 5. In this study, we employ linear coordinate encoding, as detailed below:
P ( x , y ) = x W + y H
where W and H denote the width and height of the feature map, respectively. Normalizing the coordinates as x W and y H scales the position encoding values to the range [ 0 , 1 ] . This normalization captures both center- and boundary-related information, enhancing the model’s ability to perceive both global and local positional contexts in the PG detection task.

3.3. Multi-Scale Dynamic Weighted Fusion

Multi-scale dynamic weighted fusion refers to a method that combines information from various scales using dynamic weights to enhance the overall quality of data integration. We employ a multi-scale dynamic weighted fusion strategy, which is informed by prior information to fine-tune the significance of features across various scales adaptively. This method guarantees the model can proficiently adapt feature information across multiple scales to attain enhanced object detection accuracy.

3.3.1. Prior Guided Scale-Aware Convolutional

After re-weighting the prior information of parathyroid targets using the cluster-aware multi-scale alignment module, the target samples’ different sizes, colors, and positions are effectively correlated across multiple scales.
Parathyroid targets are categorized based on size, color, and position, resulting in three distinct weight sets: S = { S i } , C = { C i } , and P = { P i } , where i denotes the position of the multi-scale output layer, where i { 3 , , 7 } . The weight S i represents the magnitude associated with the target in the i-th layer, capturing size-related prior information. Weights from clustering various prior knowledge are combined to produce the final weight α i , with α 3 corresponding to the smallest scale and α 7 to the largest.
Each feature a i is uniquely linked to the five multi-scale feature maps derived from the Neck segment of the input. For instance, scale p 3 corresponds to low-level, high-resolution feature maps that provide detailed locational information, especially useful for detecting small objects. During the fusion process, the feature map at this scale is assigned the weight α 3 . This principle applies consistently across all multi-scale layers. The corresponding formula is as follows:
α i = S i + C i + P i p i α i

3.3.2. Dynamic Weighted Fusion

Additionally, the dynamic weighted fusion technique implemented in this study, guided by prior information about the target, can focus more accurately on the data from the feature map data across multiple layers. This differentiated attention mechanism improves multi-scale feature fusion, effectively addressing the issue of target size imbalance. As a result, this technology enhances the adaptability and robustness of the target detection network for targets of various scales. The multi-scale dynamic weighted fusion algorithm quantifies prior information about parathyroid targets to determine the weight proportions for each scale, which act as the weight coefficients in the fusion process. Individual weights are calculated by assessing the targets’ sizes, colors, and positions relative to their scales. These weights from different layers are then aggregated to establish the final weight proportions across the five scales.
Initially, the contribution of each scale feature map is determined by aligning the calculated weights with the corresponding multi-scale feature map information, facilitating the fusion of multi-scale features. Subsequently, the scale with the highest weight ratio is designated as all scales’ target feature map size. Finally, the information from all multi-scale feature maps is aggregated. The corresponding formula is as follows:
p o u t = p k , where k = argmax α i , C o u t = 1 L i = l min l m a x Resize α i · p i , p out .
where k denotes the position of the feature layer exhibiting the largest weight ratio inside the multi-scale representation, and p o u t = p k denotes the size of the feature map in the feature layer. l m i n represents the lowest layer of the multi-scale representation, whereas l m a x signifies the maximum layer. L is the quantity of multi-scale layers, and i { 3 , , 7 } . α i · p i is a weighted multi-scale output feature, with the weight coefficient determined by each feature layer’s weight ratio. Weighted features are resized to meet the feature map size p o u t of the layer with the highest weight ratio.
Next, the Non-Local Block is used to refine and enhance C o u t to obtain the final aggregated feature C r e f i n e . The formula is as follows:
C refine = NonLocal C out .
where C o u t is a feature aggregated from weighted multi-scale feature maps. The Non-Local function represents the operation of the Non-Local Block, which will perform attention processing on C o u t to extract global information and generate C r e f i n e . Then, the Resize operation restores C r e f i n e to the size of the original multi-scale feature map. Finally, the residual will be superimposed with the initial input along the channel dimension to obtain the fusion result. The fusion result is obtained by adding the refined feature C r e f i n e to the original input feature map:
p 3 i n , p 4 i n , p 5 i n , p 6 i n , p 7 i n = p in + C refine
where p in is the original input feature map and C refine is the features that are refined. Through Non-Local Block, the model can effectively fuse multi-scale information and capture long-distance dependencies during feature aggregation, thereby improving performance.

3.4. Feature Contribution Adaptation Module

We introduce a feature contribution adaptive module to achieve more precise adjustments in dynamic weighted fusion. This module is designed to automatically adjust feature contributions at various levels, aligning with the multi-scale properties of the target in the input image and ultimately enhancing detection accuracy, as illustrated in Figure 6. The approach leverages information from previous targets and incorporates adaptive learning. During the multi-scale feature fusion process, hyperparameter adaptive weights are applied to each input scale, enabling the creation of attention mechanisms. These mechanisms integrate and refine features by selectively emphasizing critical information and dynamically adjusting feature importance.
This accounts for the different resolutions of each feature map input, which impacts the overall output. With adaptive learning, the model can fine-tune the contributions of different scale features, resulting in more accurate target detection. This method offers the advantage of dynamically adjusting the feature fusion strategy according to the target’s scale distribution, thereby making the detection model more adaptable and robust for identifying multi-scale objects.
An adaptive weight set, { w 3 , w 4 , w 5 , w 6 , w 7 } , represents the contribution of each scale to the multi-scale feature maps { p 3 i n , p 4 i n , p 5 i n , p 6 i n , p 7 i n } . In the previous step, dynamically weighted feature fusion used a target’s prior information to distribute relevance across scales for the same structure. A similar network structure is employed here for adaptive learning, allowing the fusion results to align with the network model and address the multi-scale problem while preserving fused information. To accelerate training convergence, the multi-scale weights derived from the target’s prior information are directly used to initialize each weight, preventing the model from starting training in a “blind” state and expediting the search for the optimal solution. Specifically, the weights α i , obtained through clustering target information, are used to initialize the adaptive weights w i . These weights are then normalized and updated during training. All adaptive weights w i are constrained within the interval [ 0 , 1 ] , and their sum across multiple scales is set to 1, where i 3 , , 7 . The corresponding formula is as follows:
w i = P a r a m e t e r α i , w i = w i Sum ( w ) + ε
where ε = 1 × 10 4 and w i denote the trainable parameter continually modified throughout the network training process as the loss diminishes, ultimately converging to optimal values. Furthermore, w i undergoes a R e L U activation function within the network to guarantee non-negativity.
During the learning process, the model can discern and adjust to the most salient characteristics of objects across different scales. Consequently, during the forward reasoning phase, the acquired adaptive weights w i can be immediately used to execute multi-scale feature fusion. The formula is as follows:
C i = p i i n · w i C i = Resize C i , C k , k = argmax w i C out = 3 7 C i
where i { 3 , , 7 } , and p i i n represents the multi-scale information derived from the dynamic weighted fusion. For each scale, adaptive weights w i are employed for weighted fusion to derive C i . The feature maps produced at multiple scales possess differing sizes; thus, each scale is upsampled for the model to acquire the feature map size C k with the most significant weight allocation.
Subsequently, all multi-scale information is acquired through addition and aggregation, culminating in the output of the final multi-scale information via Non-Local refined features, which then proceeds to the Head for target classification and regression. The adaptive structure for scale feature contribution is consistent with the Neck part of the model’s central network architecture, as shown in Figure 1.

3.5. Loss Function

The loss function consists of two components: the target bounding box regression loss from the regression branch and the focal loss from the classification branch. The specific formulation of the target bounding box regression loss is as follows:
L t u , v = [ u 1 ] L l o c t u , v
where u denotes the true category label, and where u 1 signifies a positive sample. The term t u refers to the regression parameters t x u , t y u , t w u , t h u associated with category u, as predicted by the target bounding box regression branch. At the same time, v represents the bounding box regression parameters v x , v y , v w , v h of the target. L l o c represents the L 1 minimal absolute deviation loss function.
The formula for calculating L 1 loss is as follows:
L 1 = i = 1 n y i f x i
where y i represents the ground-truth values, while f x i denotes the corresponding predicted outputs. The objective is to minimize the sum of the absolute differences, known as the L 1 loss, between these predicted and target values.
The F o c a l L o s s function addresses the imbalance between positive and negative samples in detection problems. It assigns weights to samples based on how difficult they are to classify: easier samples receive lighter weights, whereas harder samples are given heavier weights. This approach allows the model to focus its loss function on the more challenging samples to discriminate. Samples with prediction confidence scores close to 1 or 0 are categorized as easy to detect, indicating high-confidence attributes. In contrast, the remaining samples are classified as difficult to detect, reflecting the model’s uncertainty in confirming those qualities. The precise formulation of the loss function is as follows:
FocalLoss p t = α t 1 p t y log p t p t = p y = 1 1 p otherwise α t = α y = 1 1 α otherwise
where y assumes the value of 1 for positive samples and a different value for negative samples. p denotes the anticipated category probability, where p ( 0 , 1 ) . The weight factor α ( 0 , 1 ) is assigned as α for positive samples and as 1 α γ for negative samples, thereby regulating the weight of easily classifiable and challenging negative samples, with 1 p t γ serving as the modulation coefficient.

4. Experimental Results

This section presents our experimental results, detailing the implementation and experimental settings. We evaluate the proposed approach compared to competing methods and perform a comprehensive model analysis. Additionally, ablation experiments are conducted to assess the impact of various plug-ins on model performance.

4.1. Implementation Details

4.1.1. Experimental Environment

We implemented our framework using PyTorch 1.11.0 on a workstation with NVIDIA L40 GPUs. For training, the input images are cropped to a resolution of 1280 × 720 and are augmented by randomly flipping and cropping. We use CSPDarknet [15] as our backbone. During training, we utilize the AdamW (Adam with Weight Decay) optimizer [21], using a momentum of 0.9 and a weight decay of 0.0001 . The batch size is 4, and the learning rate is 0.001 .

4.1.2. Datasets

We evaluated the effectiveness of our PG detection method using a dataset that included images of parathyroid glands sourced from real surgical scenarios [3]. This research received approval from the Ethics Committee of Fujian Medical University Union Hospital, and we secured permission to utilize video data and medical records [3]. We selected patients who had undergone endoscopic thyroid surgery at Fujian Medical University Union Hospital from August 2012 to August 2019. Of these, 166 patients whose videos were of good quality were chosen. Most of the videos were recorded using the Stryker 1288 system with a 10 mm camera. Stryker is a global medical technology company. Stryker’s endoscopy systems capture high-definition videos of surgical procedures in real time. A junior surgeon culled 249 clips from videos featuring parathyroid glands, each exhibiting a confidence level of over 50% regarding clear identification. A senior surgeon reviewed these clips and eliminated some clips that demonstrated less than 90% confidence in parathyroid gland identification, retaining only the remaining clips with over 90% confidence. We extracted images every second from these clips. After removing images exhibiting similar parathyroid features to avoid redundancy, we assigned 13,740 images for the dataset. These images were randomly divided into 70% training, 15% validation, and 15% test sets. Subsequently, surgeons utilized LabelMe software (https://github.com/wkentaro/labelme) to tag the location and classes of the parathyroid glands in these images based on set criteria.
The example of the parathyroid dataset used in this paper is shown in Figure 7. The complexity of this task primarily arises from various challenges [19], notably the abundant presence of surgical instruments like scalpels and forceps within the surgical environment, which significantly compromises the PG’s visibility, as shown in Figure 7a. The shape of the PG can change during surgical operations due to cutting or extrusion, which can result in missed detections, as shown in Figure 7b. Under varying lighting conditions, the PG image may exhibit blurring or color alteration, which can lead to erroneous detection, as shown in Figure 7c, or PG congestion during surgery, as shown in Figure 7d.

4.2. Evaluation Metrics

Frames Per Second (FPS) is a metric that represents the number of images processed in a second and is used to evaluate the model’s detection speed. We employ average precision (AP) to assess the model’s performance [22]. A prediction is considered accurate if the Intersection over Union (IOU) between the predicted and actual bounding boxes surpasses 0.5; otherwise, it is classified as inaccurate. Employing average precision as the assessment standard necessitates attaining elevated precision and recall. The formulas for calculating precision and recall are presented below.
Precision = T P T P + F P
Recall = T P T P + F N ,
where T P (True Positive) denotes the samples accurately classified as positive by the model, indicating that the detection result is a PG, which corresponds to the actual presence of a parathyroid gland. F P (False Positive) denotes negative samples incorrectly identified as positive by the algorithms. This indicates that the detection result is classified as a PG despite being related to a background area. F N (False Negative) represents positive samples misclassified as negative by the model, such as when a positive group is present but not predicted.
The formula for calculating A P is as follows:
A P = 0 1 Precision ( Recall ) d ( Recall )
A higher A P value indicates the model’s improved effectiveness [22]. The confidence level assigned to each predicted bounding box significantly impacts the resulting A P value during the computation. Specifically, higher confidence levels in prediction boxes significantly impact the overall A P score. In this experiment, A P [ x ] denotes the Intersection over the Union (IOU) threshold set at x. Commonly utilized measures include A P [ @ 0.5 ] , A P [ @ 0.75 ] , and A P [ @ 0.5 : 0.95 ] . A P [ @ 0.5 : 0.95 ] represents the average A P value calculated across IOU thresholds ranging from 0.5 to 0.95, incrementing by 0.05 for each threshold.

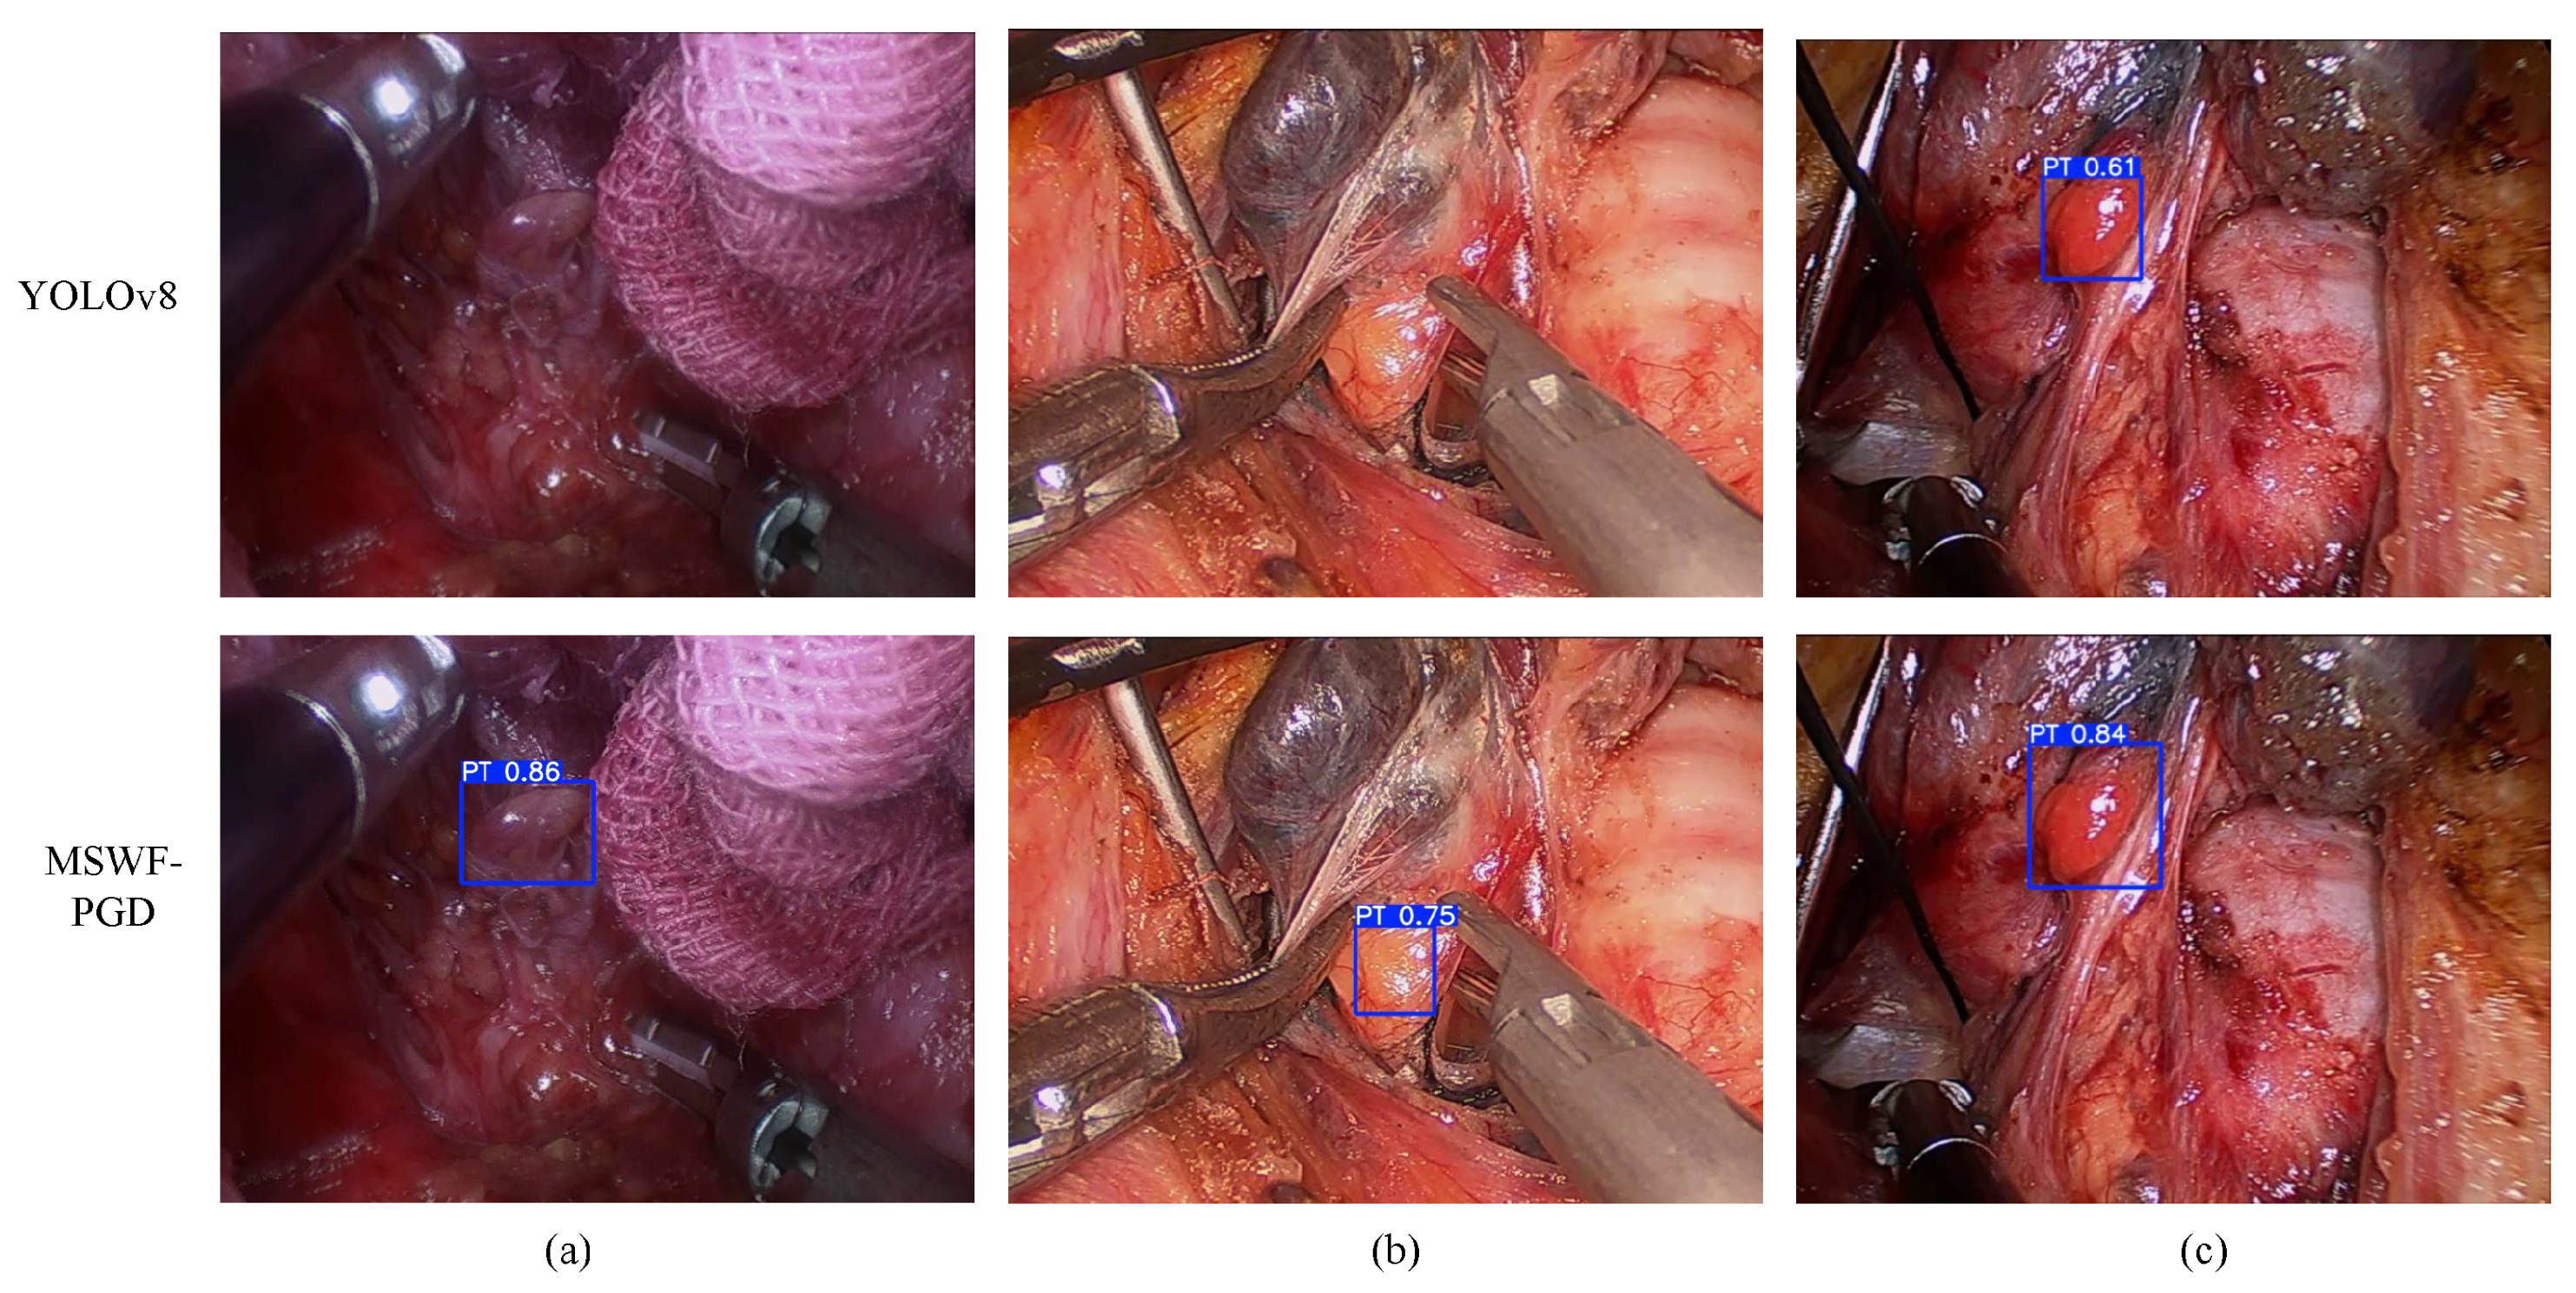
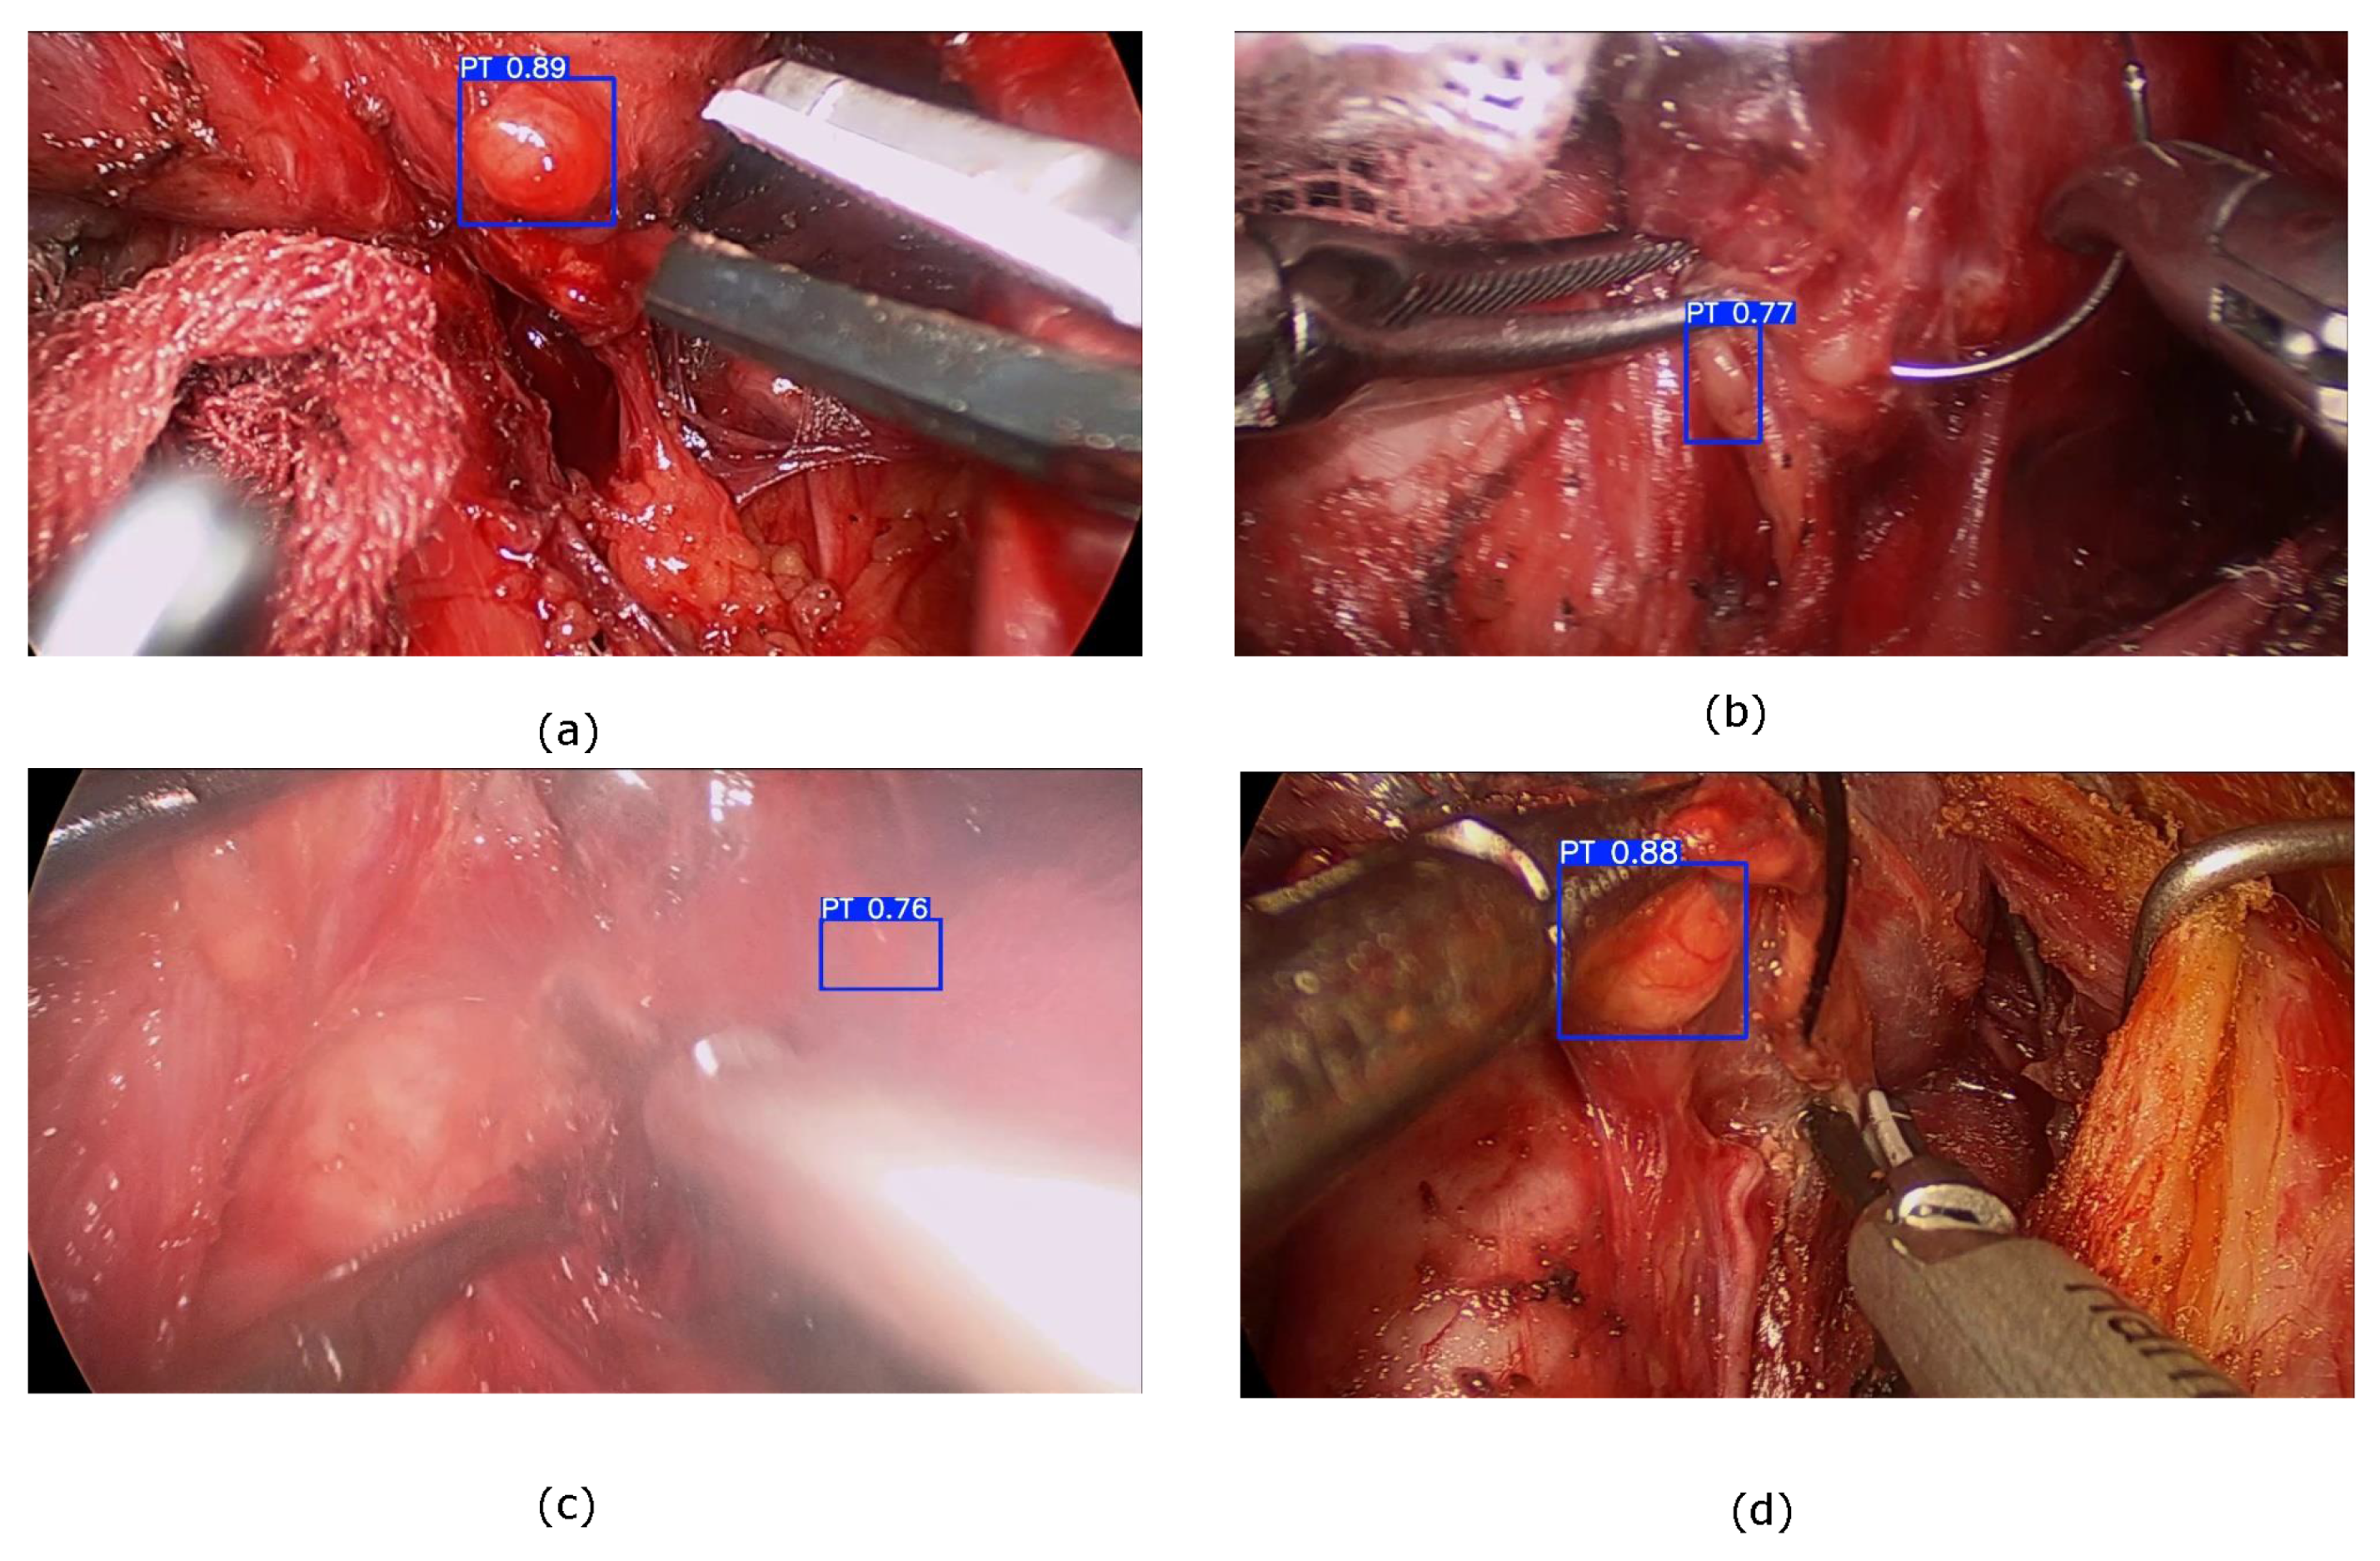
4.3. Comparative Experiments

In this section, we compare our method with other object detection algorithms [19]. This section presents a comparative analysis of our method against several single-stage object detection methods, including FCOS [12], RetinaNet [23], FoveaBox [17], EfficientDet [16], YOLOv3 [24], YOLOv5 [25], YOLOX [26], YOLOv8 [15], and YOLOv11 [27]. Table 1 shows the quantitative results for PG detection with FCOS, RetinaNet, FoveaBox, EfficientDet, YOLOv3, YOLOv5, YOLOX, YOLOv8, YOLOv11, and MSWF-PGD. Table 1 indicates that, for the identification of the parathyroid gland, our proposed method, MSWF-PGD, achieves a high accuracy of 94.1% A P @ 0.5 at a speed of 30.22 FPS, which is the highest among the compared single-stage real-time object detectors.
Table 1 presents a performance comparison of different algorithms based on the average precision and the efficiency of target detection. The proposed method achieves the highest A P 0.5 (94.1%) while maintaining real-time detection speed with an FPS of 30.22. In comparison, YOLOv8 ranks second in terms of A P 0.5 (91.3%), but its detection speed is significantly lower, with an FPS of only 26.4. Although YOLOv11 has a faster detection speed with an FPS of 31.4, its detection accuracy A P 0.5 is 1.8% lower than that of our method. Other algorithms exhibit even larger gaps in both AP values and FPS compared to the proposed method.
Here, we present comparative experimental results for various models evaluated on the parathyroid dataset. The A P @ 0.5 metric represents the average precision (AP) when the Intersection over the Union (IoU) threshold is set to 0.5. The dataset, collected from real surgical environments, includes numerous challenging scenarios. These challenges involve objects of varying sizes, unclear features in poorly lit conditions, and obstructions caused by surgical instruments such as scalpels, all of which complicate detection tasks. The comparative performance of the baseline model, YOLOv8, and our proposed method under these complex conditions is depicted in Figure 8.
The Yolov8 method might ignore parts of the target region in its detection results, especially for dimly lit environments and small targets, as shown in Figure 8a,b. Conversely, our method shows superior accuracy in detecting parathyroid gland (PG) targets, as shown in Figure 8.
To better evaluate the performance of this method in complex environments, we tested its detection effectiveness under conditions such as instrument interference, extrusion deformation, blurred illumination, and congestion. As shown in Figure 9, our method effectively detects PG targets in complex scenes.
More parathyroid gland detections using our method are visualized in Figure 10. Consequently, the model presented in this research demonstrates superior detection accuracy in the parathyroid dataset, enhanced precision and recall rates, and is more appropriate for application in intricate surgical contexts. The frame rate of 30.22 is sufficient for real-time parathyroid detection.

4.4. Ablation Experiments

We conducted several experiments to verify the efficacy of the main components of our network, including the Multi-scale Dynamic Weighted Fusion module (MDWF) and the Feature Contribution Adaptation module (FCA). We replaced the feature fusion neck of the baseline single-stage object detection model with the proposed method. The results of the ablation experiments are shown in Table 2.
Table 2 shows that the baseline model achieves the lowest detection performance, with an A P @ 0.5 of 91.3%. This is primarily because PG medical images often feature finely textured and detail-rich objects. CSPDarknet, initially designed for natural scene images, focuses on capturing prominent edges and larger objects. Its receptive field is insufficient for addressing the variations in multi-scale objects typically found in medical images. Detecting PGs of varying shapes and sizes poses significant challenges, leading to missed detections of small objects. Furthermore, lower layers of the network lack sufficient semantic information, making target localization more difficult.
This study introduces the Multi-scale Dynamic Weighted Fusion and Feature Contribution Adaptation modules to address these challenges. These modules align the fusion process with the scale distribution of the samples, enabling more effective utilization of PG-specific information. Refining multi-scale adaptive weights also balances high-level semantic information with low-level spatial location information. As a result, the A P @ 0.5 improves from 91.3% for the baseline to 94.1%, representing a 3% enhancement.
The impact of feature fusion across various multi-scale architectures is depicted in Figure 11. Figure 11a illustrates the fusion effect of the Feature Pyramid Network (FPN) in YOLOv8, while Figure 11b demonstrates the fusion effect of the proposed method. The Multi-scale Dynamic Weighted Fusion module and the Feature Contribution Adaptation module significantly enhance the feature fusion process, yielding more distinct target areas and improved detection of objects across different sizes.

5. Conclusions

Laparoscopic surgery poses significant challenges for parathyroid gland (PG) detection due to disruptions in blood supply, scalpel manipulation, and target blockages, which result in targets of varying sizes and notable disparities in brightness and contrast. These factors exacerbate the multi-scale problem in detection tasks.
This paper introduces a previous-information-guided, multi-scale weighted fusion method based on CSPDarknet to address the multi-scale challenges in PG detection. Feature maps at multiple scales are extracted and reweighted using cluster-aware multi-scale alignment to incorporate critical multi-scale information. These feature maps are then integrated through optimized scale weights using non-local attention mechanisms, enhancing localization accuracy. A Feature Contribution Adaptation module is employed to dynamically adjust the significance of scale features to further refine detection.
The effectiveness of the proposed method is validated through comparative experiments with alternative detection techniques on a parathyroid dataset obtained from real surgical scenarios. The results demonstrate that the algorithm achieves improved accuracy and speed, meeting the real-time requirements of PG detection in endoscopic surgical contexts.

Author Contributions

W.L. (Wanling Liu): Conceived and designed the study, supervised the project, and wrote the manuscript. W.L. (Wenhuan Lu): Conducted data analysis, implemented algorithms, and provided critical revisions to the manuscript. Y.L.: Developed the experimental framework and assisted in data analysis and interpretation. F.C.: Contributed to experimental design and provided technical support. F.J.: Contributed to the literature review, developed methodology, and edited the manuscript. J.W.: Assisted in interpreting the results and suggested improvements for the manuscript. B.W.: Participated in data collection and contributed to manuscript editing. W.Z.: Participated in data collection and contributed to manuscript editing. All authors have read and agreed to the published version of the manuscript.

Funding

This research was funded by the Clinical Research Center for Precision Management of Thyroid Cancer of Fujian Province (Grant No.: 2022Y2006); Joint Funds for the Innovation of Science and Technology, Fujian Province (Grant No.: 2023Y9190; 2023Y9135). Fujian Province Young and Middle-aged Teacher Education Research Project(Grant No.: JAT231010).

Data Availability Statement

This research received approval from the Ethics Committee of Fujian Medical University Union Hospital, and we secured permission to utilize video data and medical records. The data that support the findings of this study are available on request from the corresponding author. The data are not publicly available due to privacy or ethical restrictions.

Conflicts of Interest

The authors declare that they have no known competing financial interests or personal relationships that could have appeared to influence the work reported in this paper.

References

  1. Apostolopoulos, I.D.; Papandrianos, N.I.; Papageorgiou, E.I.; Apostolopoulos, D.J. Artificial Intelligence methods for identifying and localizing abnormal Parathyroid Glands: A review study. Mach. Learn. Knowl. Extr. 2022, 4, 814–826. [Google Scholar] [CrossRef]
  2. Liu, W.; Cai, Z.; Chen, F.; Wang, B.; Zhao, W.; Lu, W. Ellipse shape prior based anti-noise network for parathyroid detection. In Proceedings of the Fourteenth International Conference on Graphics and Image Processing (ICGIP 2022), SPIE, Nanjing, China, 21–23 October 2022; Volume 12705, pp. 897–909. [Google Scholar]
  3. Wang, B.; Yu, J.F.; Lin, S.Y.; Li, Y.J.; Huang, W.Y.; Yan, S.Y.; Wang, S.S.; Zhang, L.Y.; Cai, S.J.; Wu, S.B.; et al. Intraoperative AI-assisted early prediction of parathyroid and ischemia alert in endoscopic thyroid surgery. Head Neck 2024, 46, 1975–1987. [Google Scholar] [CrossRef] [PubMed]
  4. Zhou, Z.; Cui, Z.; Zang, Z.; Meng, X.; Cao, Z.; Yang, J. Ultrahi-prnet: An ultra-high precision deep learning network for dense multi-scale target detection in sar images. Remote Sens. 2022, 14, 5596. [Google Scholar] [CrossRef]
  5. Deng, J.; Xuan, X.; Wang, W.; Li, Z.; Yao, H.; Wang, Z. A review of research on object detection based on deep learning. J. Phys. Conf. Ser. 2020, 1684, 012028. [Google Scholar] [CrossRef]
  6. Liang, F.; Zhou, Y.; Chen, X.; Liu, F.; Zhang, C.; Wu, X. Review of target detection technology based on deep learning. In Proceedings of the 5th International Conference on Control Engineering and Artificial Intelligence, Sanya, China, 14–16 January 2021; pp. 132–135. [Google Scholar]
  7. Brunetti, A.; Buongiorno, D.; Trotta, G.F.; Bevilacqua, V. Computer vision and deep learning techniques for pedestrian detection and tracking: A survey. Neurocomputing 2018, 300, 17–33. [Google Scholar] [CrossRef]
  8. Girshick, R.; Donahue, J.; Darrell, T.; Malik, J. Rich feature hierarchies for accurate object detection and semantic segmentation. In Proceedings of the IEEE Conference on Computer Vision and Pattern Recognition, Columbus, OH, USA, 24–27 June 2014; pp. 580–587. [Google Scholar]
  9. Girshick, R. Fast r-cnn. In Proceedings of the IEEE International Conference on Computer Vision, Santiago, Chile, 7–13 December 2015; pp. 1440–1448. [Google Scholar]
  10. Ren, S.; He, K.; Girshick, R.; Sun, J. Faster R-CNN: Towards Real-Time Object Detection with Region Proposal Networks. IEEE Trans. Pattern Anal. Mach. Intell. 2017, 39, 1137–1149. [Google Scholar] [CrossRef] [PubMed]
  11. Liu, W.; Anguelov, D.; Erhan, D.; Szegedy, C.; Reed, S.; Fu, C.Y.; Berg, A.C. Ssd: Single shot multibox detector. In Proceedings of the European Conference on Computer Vision, Amsterdam, The Netherlands, 11–14 October 2016; Springer: Cham, Switzerland, 2016; pp. 21–37. [Google Scholar]
  12. Tian, Z.; Shen, C.; Chen, H.; He, T. FCOS: Fully Convolutional One-Stage Object Detection. In Proceedings of the 2019 IEEE/CVF International Conference on Computer Vision (ICCV), Seoul, Republic of Korea, 27 October–2 November 2019. [Google Scholar]
  13. Redmon, J.; Divvala, S.; Girshick, R.; Farhadi, A. You Only Look Once: Unified, Real-Time Object Detection. In Proceedings of the Computer Vision & Pattern Recognition, Las Vegas, NV, USA, 27–30 June 2016. [Google Scholar]
  14. Jiang, P.; Ergu, D.; Liu, F.; Cai, Y.; Ma, B. A Review of Yolo algorithm developments. Procedia Comput. Sci. 2022, 199, 1066–1073. [Google Scholar] [CrossRef]
  15. Hussain, M. YOLO-v1 to YOLO-v8, the rise of YOLO and its complementary nature toward digital manufacturing and industrial defect detection. Machines 2023, 11, 677. [Google Scholar] [CrossRef]
  16. Tan, M.; Pang, R.; Le, Q.V. Efficientdet: Scalable and efficient object detection. In Proceedings of the IEEE/CVF Conference on Computer Vision and Pattern Recognition, Seattle, WA, USA, 13–19 June 2020; pp. 10781–10790. [Google Scholar]
  17. Kong, T.; Sun, F.; Liu, H.; Jiang, Y.; Li, L.; Shi, J. Foveabox: Beyound anchor-based object detection. IEEE Trans. Image Process. 2020, 29, 7389–7398. [Google Scholar] [CrossRef]
  18. Yu, F.; Sang, T.; Kang, J.; Deng, X.; Guo, B.; Yang, H.; Chen, X.; Fan, Y.; Ding, X.; Wu, B. An automatic parathyroid recognition and segmentation model based on deep learning of near-infrared autofluorescence imaging. Cancer Med. 2024, 13, e7065. [Google Scholar] [CrossRef] [PubMed] [PubMed Central]
  19. Liu, W.; Lu, W.; Sun, Q.; Chen, F.; Wang, B.; Zhao, W. Real-Time Double-Layer Graph Attention Networks for Parathyroid Detection. In Proceedings of the 2024 IEEE International Conference on Bioinformatics and Biomedicine (BIBM), Lisboa, Portugal, 3–6 December 2024; pp. 1606–1610. [Google Scholar]
  20. Xia, B.; Hang, Y.; Tian, Y.; Yang, W.; Liao, Q.; Zhou, J. Efficient non-local contrastive attention for image super-resolution. Proc. AAAI Conf. Artif. Intell. 2022, 36, 2759–2767. [Google Scholar] [CrossRef]
  21. Llugsi, R.; El Yacoubi, S.; Fontaine, A.; Lupera, P. Comparison between Adam, AdaMax and Adam W optimizers to implement a Weather Forecast based on Neural Networks for the Andean city of Quito. In Proceedings of the 2021 IEEE Fifth Ecuador Technical Chapters Meeting (ETCM), Cuenca, Ecuador, 12–15 October 2021; pp. 1–6. [Google Scholar]
  22. Zou, Z.; Chen, K.; Shi, Z.; Guo, Y.; Ye, J. Object Detection in 20 Years: A Survey. Proc. IEEE 2023, 111, 257–276. [Google Scholar] [CrossRef]
  23. Lin, T.Y.; Dollár, P.; Girshick, R.; He, K.; Hariharan, B.; Belongie, S. Feature pyramid networks for object detection. In Proceedings of the IEEE Conference on Computer Vision and Pattern Recognition, Honolulu, HI, USA, 21–26 July 2017; pp. 2117–2125. [Google Scholar]
  24. Redmon, J.; Farhadi, A. Yolov3: An incremental improvement. arXiv 2018, arXiv:1804.02767. [Google Scholar]
  25. Mahaur, B.; Mishra, K.K. Small-object detection based on YOLOv5 in autonomous driving systems. Pattern Recognit. Lett. 2023, 168, 115–122. [Google Scholar] [CrossRef]
  26. Ge, Z. Yolox: Exceeding yolo series in 2021. arXiv 2021, arXiv:2107.08430. [Google Scholar]
  27. Khanam, R.; Hussain, M. YOLOv11: An Overview of the Key Architectural Enhancements. arXiv 2024, arXiv:2410.17725. [Google Scholar]
Figure 1. MSWF-PGD network structure: Multi-Scale Weighted Fusion Parathyroid Glands Detection framework includes a backbone network, a dynamic weighted fusion module led by previous information (Neck), a scale feature fine-tuning module, and a target detection head. First, the backbone extracts image features. Next, the Neck processes the features with multi-scale dynamic weighted fusion and adaptive fusion modules. The multi-scale dynamic weighted fusion module derives scale-specific weights for effective multi-scale fusion using parathyroid gland knowledge. After fusion, the multiple feature maps output uses adaptive hyperparameter weights to adjust multi-scale feature contributions. With this, the final multi-scale forecast fits the parathyroid gland samples’ scale distribution. The head classifies and positions candidate boxes using a classifier and regressor.
Electronics 14 01092 g001
Figure 2. Leveraging prior knowledge of the PG, the target frames are projected onto a two-dimensional plane and categorized using the GMM cluster-aware detector. The dark blue region in the lower left represents a smaller-scale target, while the light blue region denotes a larger-scale target.
Electronics 14 01092 g002
Figure 3. The three-channel RGB image of PG; some parathyroid glands display distinct color differences.
Electronics 14 01092 g003
Figure 4. Visualization of target area color information and clustering. (a) The color distribution of the target area, where the X, Y, and Z axes correspond to R m e a n , G m e a n , and B m e a n , respectively. Colors indicate different clustering categories. (b) Relationship between target area and clustering category. The X-axis represents the target area, the Y-axis denotes the clustering category, and colors indicate different categories.
Electronics 14 01092 g004
Figure 5. Position information of PG object: The blue box marks the PG location. Utilize a heatmap to visualize the location data of the PG object. Blue represents lower position values, while red represents higher position values, reflecting the normalized position information of the target area in the image.
Electronics 14 01092 g005
Figure 6. Feature Contribution Adaptation module encompasses Dynamic Channel Attention (adaptive Channel Attention) and Multi-Scale Feature Fusion. First, channel-wise weights are generated based on global information, and the features are weighted accordingly. Next, features from different scales are fused, with resolution alignment achieved through downsampling or upsampling. The network learns the weights of various features, enabling dynamic feature fusion based on these learned weights.
Electronics 14 01092 g006
Figure 7. Some examples of parathyroid datasets. (a) The image contains several medical instruments, including scalpels and medical cotton balls, significantly affecting the view of the PG; (b) Professional surgical procedures, such as cutting or squeezing the PG, can result in deformation; (c) lighting effects can lead to the blurring or alteration of PG images; (d) PG congestion during surgery.
Electronics 14 01092 g007
Figure 8. Comparative experiments: The baseline model may miss some detections in complex scenes. However, our method successfully identifies the target within the same environment. (a) The target features can be indistinguishable in dimly lit conditions. (b) The parathyroid gland can be hard to differentiate due to obstruction from the scalpel. (c) The parathyroid gland is relatively large, making it easier to detect.
Electronics 14 01092 g008
Figure 9. Visualization of parathyroid gland detection in complex environments: (a) instrument interference, (b) extrusion deformation, (c) blurred illumination, and (d) congestion.
Electronics 14 01092 g009
Figure 10. Visualization of parathyroid gland detection: Our method achieves enhanced detection outcomes in challenging real-world surgical environments, adeptly managing various PG sizes, scalpel interference, and congestion.
Electronics 14 01092 g010
Figure 11. Comparison of feature fusion: (a) the Feature Pyramid Network (FPN) of Yolov8, (b) effect of multi-scale feature fusion in our method, (c) results of parathyroid detection.
Electronics 14 01092 g011
Table 1. Comparison of different algorithms: The comparative experimental results for several models tested on the parathyroid dataset.
Models AP @ 0.5 AP @ 0.75 AP @ 0.5:0.95FPS
FCOS [12]80.136.240.420.75
YOLOv3 [24]80.930.531.320.18
RetinaNet [23]84.544.942.222.15
FoveaBox [17]87.745.647.619.87
EfficientDet [16]90.450.351.126.13
YOLOv5 [25]85.747.347.921.2
YOLOX [26]89.249.746.426.14
YOLOv8 [15]91.356.553.226.4
YOLOv11 [27]92.355.656.931.4
Ours94.166.367.730.22
Table 2. An ablation study was performed to evaluate the effectiveness of the MDWF and FCA module. The learning rate (LR) was established at 0.001.
CSPDarknetMDWFFCA AP @ 0.5 AP @ 0.75 AP @ 0.5:0.95
91.3%56.5%53.2%
91.8%57.3%57.5%
92.9%58.5%58.8%
94.1%66.3%67.7%
Disclaimer/Publisher’s Note: The statements, opinions and data contained in all publications are solely those of the individual author(s) and contributor(s) and not of MDPI and/or the editor(s). MDPI and/or the editor(s) disclaim responsibility for any injury to people or property resulting from any ideas, methods, instructions or products referred to in the content.

