Article

Interpretable Review Spammer Group Detection Model Based on Knowledge Distillation and Counterfactual Generation

1
School of Information Science and Engineering, Yanshan University, Qinhuangdao 066012, China
2
Hebei Key Laboratory of Computer Virtual Technology and System Integration, Qinhuangdao 066004, China
*
Author to whom correspondence should be addressed.
Electronics 2025, 14(6), 1086; https://doi.org/10.3390/electronics14061086
Submission received: 25 January 2025 / Revised: 5 March 2025 / Accepted: 6 March 2025 / Published: 10 March 2025

Abstract

:
Spammer group detection is necessary for curbing collusive review spammers on online shopping websites. However, the current detection approaches ignore exploring deep-level suspicious user review relationships and learning group features with low discrimination, which affects detection performance. Furthermore, the interpretation of detection results is easily influenced by noise features and unimportant group structures, leading to suboptimal interpretation performance. Aimed at addressing these concerns, we propose an interpretable review spammer group detection model based on knowledge distillation and counterfactual generation. First, we analyze user review information to generate a suspicious user review relationship graph, combining a graph agglomerative hierarchical clustering approach to discover candidate groups. Second, we devise a knowledge distillation network to learn discriminative candidate group features for detecting review spammer groups. Finally, we design a counterfactual generation model to search important subgraph structures for interpreting the detection results. The experiments indicate that the improvements in our model’s Precision@k and Recall@k are among the top-1000 state-of-the-art solutions on the Amazon, YelpChi, YelpNYC, and YelpZip datasets, which are [13.37%, 72.63%, 37.46%, and 18.83%] and [17.34%, 43.81%, 41.22%, and 21.05%], respectively. The Fidelities of our interpretation results under different Sparsity are around 6%, 7%, 7%, and 6% higher than that of the state-of-the-art solutions on the Amazon, YelpChi, YelpNYC, and YelpZip datasets, respectively.

1. Introduction

On internet shopping platforms, most customers refer to historical review information to make purchase decisions. This leads to the proliferation of fraudulent reviews. For instance, about 14% to 20% of reviews are fraudulent reviews on Yelp websites [1]. A user who publishes fraudulent comments is called a spammer. A collective of users who collusively publish fraudulent comments is called a review spammer group [2]. Review spammer groups seriously disrupt the normal market order and distort real product reviews, which misleads the consumers’ purchase decisions. Moreover, the review spammer detection results lack interpretability and cannot gain the trust of consumers. Therefore, the research on interpretable review spammer group detection is significant to purify the e-commerce environment and enhance the credibility of detection results.
Currently, researchers have presented diverse approaches to detecting review spammer groups. Most methods [3,4,5,6,7,8,9,10] mainly use community detection, graph partitioning, and frequent itemset mining (FIM) approaches to discover candidate groups, applying deep learning, reinforcement learning, or handcrafted indicator approaches to identify spammer groups. However, the existing detection methods ignore mining suspicious review relationships between users at a deep level to obtain candidate groups and learn group features with low discrimination. Moreover, the interpretation of detection results is easily influenced by group noise features and unimportant group structures, which can easily lead to feature selection bias that affects the interpretation. Meanwhile, the existing interpretation methods [11,12,13,14,15,16,17,18,19,20,21,22,23,24,25,26] are not suitable for interpreting review spammer groups without fixed structures. The motive of this work is to construct an interpretable review spammer group detection approach.
To tackle the aforementioned problems, we present an interpretable review spammer group detection model based on knowledge distillation and counterfactual generation, which is called KDCFG. First, we analyze the original dataset to construct a suspicious user review relationship graph and design a graph agglomerative hierarchical clustering approach to find candidate groups. Then, we devise a knowledge distillation network to learn vector representations of candidate groups and detect review spammer groups. Finally, we adopted the counterfactual generation method to generate counterfactual groups and compare them with the candidate groups, based on which we mined the important subgraph structures for interpreting the detection results of review spammer groups and validate the accuracy of the interpretation results to evaluate the value of counterfactual groups.
The contributions are three-fold:
(1)
We present a candidate group generation method based on graph agglomerative hierarchical clustering. In particular, we analyzed the user review information in the review dataset to generate a suspicious user review relationship graph. Meanwhile, we designed a graph agglomerative hierarchical clustering method to mine the close user relationships at a deeper level for learning candidate groups.
(2)
We present a knowledge distillation-based detection model (KDRSGD). In particular, we designed a graph masked autoencoder as the teacher mechanism to fully learn discriminative candidate group vector representations, helping the student mechanism better understand and learn complex group embeddings. Meanwhile, we design a simple graph autoencoder as the student mechanism to transfer knowledge from the teacher mechanism for detecting review spammer groups.
(3)
We proposed a counterfactual generation-based interpretation model (CFG). More specifically, we devised a counterfactual generation network consisting of a generator and a discriminator. We combined similarity masking and random masking methods to perform counterfactual operations on candidate groups by deleting or randomly adding edge relationships between user nodes and constructing a graph neural network as the generator to learn counterfactual groups. Meanwhile, we designed a discriminator to compare the distinctions between counterfactual groups and candidate groups, and mine the important subgraph structures to explain the detection results. We perform the experiments on the four datasets to compare KDCFG with the state-of-the-art detection and interpretation approaches.
The remaining sections are organized as follows: The related work and problem definition are given in Section 2 and Section 3, the KDCFG model is introduced in Section 4, and the experiments and conclusions are provided in Section 5 and Section 6.

2. Related Works

2.1. Review Spammer Group Detection

The current methods for detecting review spammer groups mainly include the conventional detection methods and deep learning-based detection methods.

2.1.1. The Conventional Detection Methods

The conventional detection methods mainly use individual and group indicators to calculate group suspiciousness and apply ranking or clustering methods to detect review spammer groups. Many researchers [2,3,4,5] first analyzed user ratings, review time, and review product information to construct the user review graph. Then, they utilized FIM, minimum cut, clique percolation, or label propagation approaches to discover candidate groups, which helped in identifying the potential collusive spammers. Finally, they learnt the indicators of individuals and groups to calculate the suspicion degree of candidate groups for detecting the most suspicious review spammer groups. The conventional methods rely on handcraft features or spam indicators to detect spammer groups and need prior knowledge. Unlike conventional methods, the proposed KDCFG uses a knowledge distillation network to learn group features for detecting review spammer groups.

2.1.2. Deep Learning-Based Detection Methods

Deep learning-based detection methods use deep learning techniques to detect review spammer groups. Researchers [6,7,8] first studied a heterogeneous information network or a heterogeneous graph and used an improved Deepwalk algorithm, a heterogeneous graph attention network, or a convolutional neural network to derive user node vectors. Then, they adopted a Canopy and K-means clustering algorithm or the optimized SCAN clustering to discover candidate groups. Finally, they utilized entropy, group classification, or autoencoder methods to detect collusive spammers. Researchers [9,10] used reinforcement learning or a generative adversarial network to detect dubious collusion spammers. They first modelled the dataset as a heterogeneous graph or a homogeneous graph, then applied the advanced reinforcement learning or DBSCAN to obtain candidate groups, before ultimately adopting an adversarial autoencoder or a generative adversarial network to identify the most dubious collusion spammers. Deep learning-based methods ignore mining suspicious review relationships between users at a deeper level to obtain candidate groups and learn group features with low discrimination. Furthermore, most deep learning-based techniques are deficient in providing a comprehensible explanation for their detection results. Unlike existing approaches, KDCFG adopts a graph agglomerative hierarchical clustering method to mine deep-level suspicious user relationships and devise a knowledge distillation network to learn the discriminative candidate group features. Meanwhile, our model provides an explanation for its detection results.

2.2. Approaches for Interpreting Classification Results

The existing approaches for interpreting classification results mainly focus on features/gradients, decomposition, surrogate, and perturbation.

2.2.1. Features/Gradients-Based Approaches

Features/gradients-based approaches use features or gradient as an approximation of the importance of the input to obtain interpretations of classification results. Researchers [11,12] used gradients-based methods to explain the classification results. They mined the most important input features as explanations of classification results by accumulating or comparing the gradients in the backpropagation process of graph neural networks. Researchers [13,14] used both gradients and features-based methods to interpret the classification results. They separated gradients and feature maps within the graph neural network and used LeakyReLU or Shapley to extract the essential characteristics for explaining the results of model classifications.

2.2.2. Decomposition-Based Approaches

Decomposition-based approaches decompose classification results to measure the important degree of inputs for interpreting the classification results. Researchers [15,16,17,18] used decomposition-based methods to explain classification results. They first projected visible and hidden information in the model into input data and decomposed the generation and aggregation mechanisms in a graph neural network. Then, they used the hierarchical correlation visualization method, higher order Taylor expansion method, subgraph-level interpretation algorithm, or tensor ring decomposition method to mine the key input features for explaining the results of model classifications.

2.2.3. Surrogate-Based Approaches

Surrogate-based methods use surrogate models to approximate complex deep models for achieving local interpretations of classification results. Researchers [19,20] used probability graph model and fuzzy rule method to interpret the results of model classifications. They first adopted a graph model to approximate target prediction and obtained the weighted data. Then, they used Bayesian networks or a local fuzzy interpretation mechanism to explain the results of model classification. Researchers [21,22] used locally interpretable surrogate methods to interpret the classification results. They adopted a locally interpretable model with global prior to extract the essential features for explaining the results of model classifications.

2.2.4. Perturbation-Based Approaches

Approaches based on perturbation are widely used to interpret depth image model classification results under different perturbations. Researchers [23,24,25,26] utilized perturbation-based methods to explain the classification results. They first used subgraph search, parameter interpretation, generative interpretation, or causal perturbation methods to perturb the input data. Then, they sampled the perturbed data and calculated their importance, and finally mined the essential perturbed features to interpret their classification results.
The aforementioned methods [11,12,13,14,15,16,17,18,19,20,21,22,23,24,25,26] are easily affected by noise features and graph structures. Moreover, they aim at the interpretation of image, text, and molecular graph classifications, which are not suitable for interpreting review spammer groups without fixed structures. Unlike these methods, KDCFG employs a counterfactual generation method to explain the detection results, which can mitigate the influence of interfering features on explanation performance. The difference between existing methods and our method is shown in Table 1.

3. Problem Definition

With the aim of observing distinct behavioral patterns often exhibited by collusive spammer activities, such as posting similar content within a short time period or forming closely related groups in the network, we designed a graph agglomerative hierarchical clustering approach to identify anomalous patterns and find candidate groups. Additionally, our method uses graph-based feature learning methods, which have been widely used in review spammer group detection due to their ability to capture group-level anomalies. After that, we constructed a knowledge distillation model and a counterfactual generation model to detect and interpret coordinated behavior in online platforms. Meanwhile, our model is constructed according to three assumptions:
Assumption 1.
Spammers in a group tend to write their reviews in shorter time intervals and with similar polarity ratings than genuine reviewers.
Assumption 2.
Transferring knowledge from a complex detection model to a lightweight model can improve the efficiency of review spammer group detection while maintaining high accuracy.
Assumption 3.
Generating counterfactual examples by perturbing key features of detected review spammer groups can enhance the interpretability of the detection results, providing insights into the critical factors driving the model’s decisions.
According to the rationale and assumptions of our model, the problem definition is as follows: Given a review dataset RD, we can model it as a suspicious user review relationship graph G. Our goal is to mine candidate groups C with close relationships and construct a detection model f to detect review spammer groups KSG, that is:
K S G f C ; θ
where θ is the detection model parameters.
Considering the opacity of model, a counterfactual generation model g is used to interpret the review spammer groups KSG. It is focused on mining the key subgraph structures ISG that influences the detection results KSG, that is:
I S G g K S G , C G ; θ
where CG denotes the initial counterfactual groups, while θ is the interpretation model parameters.
To facilitate discussion, the notations and descriptions are provided in Table 2.

4. Methodology

In this section, it begins with an overview of KDCFG and then describes KDCFG in detail.

4.1. Overview

The proposed KDCFG can be seen in Figure 1 and its components are concisely outlined below.
(1)
Discovering candidate groups. We analyze the review dataset to learn the suspicious user review relationship graph and use a binary coding approach to get user node vectors, based on which we design a graph agglomerative hierarchical clustering method to discover candidate groups with closer relationships.
(2)
The detection model based on knowledge distillation (KDRSGD). We design a graph masked autoencoder as a teacher mechanism to obtain the vector representations of candidate groups. Meanwhile, we design a graph autoencoder as a student mechanism to transfer the candidate group vectors from the teacher mechanism. We combine the teacher mechanism and the student mechanism to detect review spammer groups.
(3)
Counterfactual generation interpretation model (CFG). We design a counterfactual generation model to learn the counterfactual groups, based on which we compare the differences in detection results between candidate groups and counterfactual groups to extract the key subgraph structures for explaining the detection results.

4.2. Discovering Candidate Groups

The existing methods mainly discover candidate groups by learning user features or graph structures and need to determine the number of clusters, ignoring mining closer user relationships at a deeper level. Therefore, we design a graph agglomerative hierarchical clustering approach to learn candidate groups. More specifically, we first analyze the user review information to build the suspicious user review relationship graph and subsequently use a graph agglomerative hierarchical clustering approach to mine the more closely related candidate groups.

4.2.1. Constructing the Suspicious User Review Relationship Graph

The current approaches are difficult to learn structural information and semantic correlation [27,28] between nodes simultaneously, which can easily lead to certain information loss. Thus, we adopt the meta-path [29] to extract the suspicious user review relationships. Meanwhile, we combine the user review information to build the suspicious user review relationship graph. The detailed construction procedure is outlined below.
First, we combine meta-path and user review information to extract the suspicious user review relationships. Specifically, given two meta-paths MP1: ui-tik-pk-tjk-uj and MP2: ui-rik-pk-rjk-uj, where pk  P, ui, uj  U, tik and rik represent the time and scoring of user ui for product pk, respectively. If users have reviewed a product within a short period of time and make similar polarity ratings, the more suspicious their review behavior becomes, and the more likely the user is to be seen as a spammer. Meanwhile, the suspicion degree of user review will be higher, and the user relationship will be more suspicious. The definition of suspicion degree of user reviews is as follows.
Definition 1
(Suspicion degree of user review, SDUR). Given two meta-paths MP1:ui-tik-pk-tjk-uj and MP2: ui-rik-pk-rjk-uj, the suspicion degree of user review refers to the review suspiciousness of product pk between users ui and uj, that is:
S D U R i , j , k = 1 t i k - t j k 2 + r i k - r j k 2 + ε
where tik and tjk are the review time of ui and uj for pk, rik and rjk are the scorings of ui and uj for pk, and ε is set to a very small value, ensuring that the denominator is not 0.
Secondly, we calculate the average review suspiciousness ARS of all users on product pk, that is:
A R S i , j , k = 1 M e a n i , j U p k t i k - t j k 2 + r i k - r j k 2 + ε
where Mean represents the average function and U p k represents the set of users who have commented on product pk.
By considering the suspicion degree of user review as SDUR and the average review suspiciousness as ARS, if SDUR is higher than ARS, there is a suspicious review pattern between users. Based on this, we obtain the suspicious user review relationship matrix A U × U , that is:
A = 0 S R P u 1 , u | U | S R P u | U | , u 1 0
where S R P u i , u j i , j = 1 , 2 , , U represents the suspicious review pattern between ui and uj. If SRP(ui, uj) = 1, then there is an edge between ui and uj, i.e., eij = (ui, uj); thus we obtain the edge set E between user nodes.
Then, we apply binary coding [30] to initialize user node codes. We assign a fixed number of bits of binary coding. We utilize the user review information to learn a target product set (target products refer to products that have received similar ratings from at least two users within a short period of time), based on which we learn the target product sequence s q u i that each user ui has purchased. According to s q u i , we adopt Hash Function to obtain the binary coding x u i of each user node ui, which is:
x u i = HF ( s q u i , f n )
where HF represents the Hash Function, and fn represents the bits of binary coding (we set fn to l o g 2 U in our paper). According to the binary coding x u i of each user node ui, we obtain the user feature matrix X = x u 0 , , x u i , , x u U T .
Based on matrix A and X, we extract the suspicious user review relationship and user review information to construct a suspicious user review relationship graph G = V , E , X , where V, E, and X denote the node set, edge set, and user feature matrix, respectively.

4.2.2. Finding Candidate Groups Based on Graph Agglomerative Hierarchical Clustering

We design a graph agglomerative hierarchical clustering method to discover the more closely related candidate groups. In particular, we first initialize groups, and then combine the user node similarity and merging strategy to obtain candidate groups.
(1) Initializing groups. We consider each user node of suspicious user review relationship graph G as an initial group to obtain an initial group set C = C 1 , C 2 C n , where C i = v i , n represents the number of initial groups.
During the initialization of the groups, we do not need to perform any merge operation on the initial groups. Based on the initial group set C , an initial state is established for the subsequent graph agglomerative hierarchical clustering algorithm. Meanwhile, we initialize the similarity matrix S to record the similarity between user nodes.
(2) Merging groups. Combining the suspicious user review relationship matrix A and the user feature matrix X, we adopt the average linkage strategy [31] to mine the most similar groups and merge them to obtain a new group.
Definition 2
(User node similarity, UNS). Given any users vi, vj V, User node similarity is the similarity of vectors between user vi and user vj with edge relationship in A, that is:
U N S v i , v j = log x v i - x v j 2 2 + 1 x v i - x v j 2 2 + ε
where x v i and x v j are vector representations of user vi and user vj, respectively. 2 is a 2-norm, ε is set to 1 × 10⁻⁴.
By calculating the user node similarity UNS, we update the similarity matrix S and further calculate the similarity between two groups. We combine the average linkage strategy and similarity matrix S to calculate the group similarity GS.
Definition 3
(Group similarity, GS). Given any groups C i , C k C , group similarity is the average distance between user nodes in groups C i and C k , that is:
G S C i , C k = 1 C i × C k v i C i v k C k S v i , v k
where S v i , v k is the feature similarity of user vi and user vk, and C i is the number of nodes in group C i .
Based on group similarity GS, we select the most similar groups for merging to obtain a new group. Then, we recalculate the similarity between the new groups and update the similarity between them. Meanwhile, we preserve the edge relationships between the most similar nodes in two groups.
We perform step (2) to calculate the similarity between groups and merge the most similar groups until the iteration termination condition is reached. Ultimately, we obtain candidate groups with edge relationships C = C i | i = 1 , , n , where n is the number of candidate groups. We treat each candidate group as a graph structure with users as nodes, i.e., G = V ¯ , X , A , where V ¯ , X , and A represent the set of user nodes, feature matrix, and adjacency matrix in the candidate group. Algorithm 1 outlines the candidate group discovery process based on graph agglomerative hierarchical clustering.
Algorithm 1. Discovering candidate groups through graph agglomerative hierarchical clustering
Input: review dataset
   number of iterations loops
Output: candidate groups C
1  V U ; E Ø ; C Ø
2  obtain the user feature matrix X and the suspicious user review relationship matrix A and according to Equations (3)–(6)
3  for users um, un    U do
4    if A(um, un) = 1 then
5     E E u m , u n
6    end if
7  end for
8  build the suspicious user review relationship graph G = (V, E, X)
9  obtain the initial group set C and user node similarity according to Equation (7)
10   for i = 1 to loops do
11   S C Ø
12   obtain the group similarity GS according to Equation (8)
13   S C merge the most similar groups to generate the new groups
14   end for
15   C C S C
16   return C
Algorithm 1 first constructs the suspicious user review relationship graph (Lines 1–8), then adopts the graph agglomerative hierarchical clustering to discover candidate groups (Lines 9–15).

4.3. Review Spammer Group Detection Model Based on Knowledge Distillation

Currently, some detection methods ignore learning the discriminative candidate group embeddings, which affects the impact of review spammer group detection. Therefore, we present a detection model based on knowledge distillation (KDRSGD). The particulars of KDRSGD are outlined below.

4.3.1. The Construction of KDRSGD

The construction of review spammer group detection model mainly includes two parts: teacher mechanism and student mechanism.
(1) Teacher mechanism. To fully learn the edge structures and node features of candidate groups and obtain more discriminative group vector representations, we designed a graph masked autoencoder as the teacher mechanism. The graph masked autoencoder mainly includes three parts: mask learning, encoding, and decoding.
In the process of mask learning, we propose a similarity mask method to simultaneously learn the masks of node features and edge structures of candidate groups. According to candidate group structure G = V ¯ , A , X and the similarity matrix S in Section 4.2.2, for any user node v ¯ i , v ¯ j V ¯ in a candidate group Ci, we calculate the similarity average value SA of the nodes in Ci, that is:
S A = 1 m × m i = 1 m k = 1 , k i m S v ¯ i , v ¯ k
where m denotes the amount of user nodes in Ci.
According to similarity average value SA, if the similarity between user nodes is higher than the similarity average value, we select nodes with high degree centrality (the higher the degree centrality, the more edge relationships nodes have) as masked nodes, based on which we obtain a masked node set V ¯ m a s k . For any node v ¯ i V ¯ , the masked feature is calculated as follows:
x ¯ v ¯ i = x v ¯ i x ¯ m a s k , i f   v ¯ i V m a s k x v ¯ i , o t h e r w i s e
where x v ¯ i represents the vector representation of user node v ¯ i in candidate group Ci, x ¯ m a s k 0 , 1 d represents the masked vector, and d represents the vector dimension. By learning the masked features of all nodes in candidate groups, we obtain the masked feature matrix of candidate group X ¯ .
Meanwhile, according to the similarity average value SA, if the similarity of node pair ( v ¯ i , v ¯ j ) is higher than the similarity average value, we delete the review relationship of nodes v ¯ i and v ¯ j in the candidate group and obtain a masked adjacency matrix A ¯ , that is:
A ¯ v ¯ i , v ¯ j = 0 , i f   S v ¯ i , v ¯ j > A S A v ¯ i , v ¯ j = 1 A v ¯ i , v ¯ j , o t h e r w i s e
In the process of encoding, we propose an average neighborhood aggregation method to map the masked feature matrix to the hidden layer space. Combining the masked adjacency matrix A ¯ with masked feature matrix X ¯ , we aggregate the neighbor embeddings of node v ¯ i in candidate group and take the average. Then, we use a nonlinear transformation to update the node features, that is:
e v ¯ i = ReLU W 1 × x ¯ v ¯ i + v N v ¯ i x ¯ v N v ¯ i + b 1
where W1 and b1 are the weight and bias matrices of encoding process in teacher mechanism, respectively.
In the process of decoding, for a masked node v ¯ i V ¯ m a s k , we use a remask strategy [32] to obtain the remasked feature e ¯ v ¯ i . Based on this, we aggregate the neighbor node features of node v ¯ i and learn the reconstructed node feature h v ¯ i , that is:
h v ¯ i = sigmoid W 2 × e ¯ v ¯ i + v N v ¯ i e ¯ v N v ¯ i + b 2
where N v ¯ i denotes the neighbor node set of v ¯ i , and W2 and b2 are the weight and bias matrices of decoding process in teacher mechanism, respectively.
According to the constructed teacher mechanism, we adopt the log_softmax function to calculate the classification probability of candidate group Ci, that is:
h ¯ C i = log _ softmax W 3 v ¯ i C i e v ¯ i m + b 3
where W3 and b3 are the weight and bias matrices of candidate group classification process in teacher mechanism, respectively. m is the number of user nodes in candidate group.
(2) Student mechanism. We designed a simple graph autoencoder as the student mechanism to transfer candidate group feature output by the teacher mechanism. The graph autoencoder mainly includes two parts: encoding and decoding. In the process of encoding, for any node v ¯ V ¯ in the candidate group, we utilize a nonlinear mapping method to map the node feature to the hidden layer representation, that is:
o v ¯ i = tanh W e x v ¯ i + b e
where We and be represent the weight and bias matrices of the decoding process in the student mechanism, respectively. x v ¯ i represents the vector representation of user node v ¯ i in candidate group Ci.
In the process of decoding, we adopt a sigmoid function to reconstruct the hidden layer representation for obtaining the reconstructed user node feature p v ¯ i , that is:
p v ¯ i = sigmoid W d o v ¯ i + b d
where Wd and bd represent the weight and bias matrices of the decoding process in the student mechanism. According to the reconstructed user node feature p v ¯ i , we obtain the reconstructed feature matrix P of the candidate group, i.e., P = p v ¯ 1 , , p v ¯ i , , p v ¯ m T , where m represents the number of user nodes in the candidate group.
We utilize the graph autoencoder to learn the user node features of candidate groups. Then, we aggregate the hidden layer node features and calculate the classification probabilities of candidate groups, that is:
q C i = log _ softmax W c v ¯ i C i o v ¯ i m + b c
where bc and Wc denote the bias and weight matrices of the candidate group classification process in student mechanism, while m represents the amount of user nodes in candidate group.

4.3.2. Training of KDRSGD

We acquire a portion of the candidate group as the training set Ctrain to train the KDRSGD. The KDRSGD model loss mainly includes reconstruction and distillation loss. Reconstruction loss is adopted to measure the KDRSGD’s reconstruction error. Distillation loss is utilized to guide the output probability distribution of student mechanism to approximate that of teacher mechanism. Specifically, we utilize the mean square error to learn the reconstruction loss, that is:
L r e c = P - X 2 2
where P represents the reconstructed feature matrix, X represents the adjacency matrix of candidate group, and 2 is a 2-norm.
We employ a cross entropy loss function [33] to learn the distillation loss, that is:
L d i s = - C i C t r a i n y C i log y ^ C i + 1 - y C i log 1 - y ^ C i
where y C i represents the true label of candidate group Ci, which is obtained by the label of user nodes in candidate group Ci. The true label of candidate group Ci is set according to the fixed proportion of genuine users and spammers in the group. y ^ C i represents the predict label of candidate group Ci.
We combine the reconstruction loss and distillation loss as the KDRSGD model loss, that is:
L = λ 1 L r e c + λ 2 L d i s
According to the KDRSGD model loss, we adopt the Adam optimizer [34] to optimize the parameters of model.

4.3.3. Detection of Review Spammer Groups

We detect review spammer groups of test set Ctest by adopting the trained KDRSGD model. Specifically, we utilize the knowledge distillation model to obtain the embedding of test set Ctest and further acquire the classification probability q t e s t = q C i C i C t e s t , where q C i = p C i 0 , p C i 1 , while p C i 0 and p C i 1 represent the probabilities that candidate group Ci is classified as a non-spammer group and a spammer group, respectively. Based on this, we obtain a suspicious score sequence of the candidate groups S R = p C 0 1 , p C 1 1 , , p C i 1 and choose the more suspicious candidate groups as review spammer groups RSG. The detection process of review spammer group detection model is described in Algorithm 2.
Algorithm 2. Review spammer group detection model
Input: training set Ctrain
   test set Ctest
Output: RSG
1    initialize the parameters Θ of model
2    repeat
3       for Ci in Ctrain do
4               h ¯ C i use a teacher mechanism to obtain the classification probability of Ci according to Equations (9)–(14)
5               q C i use a student mechanism to transfer the knowledge of the teacher mechanism according to Equations (15)–(17)
6       end for
7       calculate the model loss according to Equations (18)–(20)
8       employ Adam to update the parameters Θ of model
9    until the model loss convergence
10   RSG use the trained model to detect review spammer groups in Ctest
11   return RSG
Algorithm 2 starts by initializing the parameters of the model (Line 1), subsequently training KDRSGD and updating the parameters of the model (Lines 2–9), before eventually obtaining the most suspicious spammer groups (Line 10).

4.4. Counterfactual Generation Interpretation Model

To avoid the effect of feature selection bias on interpretation results, we propose a counterfactual generation interpretation model (CFG). The proposed CFG consists of two parts: obtaining the counterfactual groups and interpreting the detection results.

4.4.1. Obtaining Counterfactual Groups

We present a counterfactual generation model to obtain counterfactual groups, which is composed of a discriminator and generator. Specifically, in a generator (Gen), we delete some edge relationships between similar nodes in the candidate group or randomly add the edge relationships between user nodes by combining similarity masking and random masking methods. Based on this, we perform mask learning on candidate groups to obtain the initial counterfactual groups CG and its masked adjacency matrix A c . Subsequently, we adopt the neighbor aggregation method to learn the features from the neighboring nodes of user node v ¯ i , that is:
z v ¯ i = v ˜ N v ¯ i tanh W g x v ˜ + b g
where x v ˜ denotes the embedding of v ˜ , N v ¯ i denotes a neighbor node set of v ¯ i .
Then, we use a nonlinear transformation method to acquire the embedding of counterfactual group CGi, that is:
z C G i = v ¯ i C G i ReLU W n × x v ¯ i + z v ¯ i + b n
where Wg, Wn, bg, and bn are the weight and bias matrices of the generator.
In a discriminator (Dis), we employ a log_softmax function to learn the classification probability of counterfactual group z ¯ C G i , that is:
z ¯ C G i = softmax W f z C G i + b f
where bf and Wf are the bias and weight matrices of discriminator.
To obtain the counterfactual groups that are completely opposite to the candidate group detection results, the training of the generator is designed as follows:
L G e n = log P CF Dis z C G i
where P CF Dis z C G i denotes the probability that counterfactual group is classified differently from candidate groups.
Meanwhile, to accurately distinguish between candidate groups and counterfactual groups, the training of discriminator is designed as follows:
L D i s = log P Norm g C G i log P Spam f C i
where P Norm g C G i denotes a probability that a counterfactual group is classified as a normal group, P Spam f C i denotes a probability that a candidate group is classified as a spam group, f denotes a detection model, and g denotes an interpretation model.

4.4.2. Interpreting the Detection Results

We generate the initial counterfactual groups by performing mask learning (e.g., deleting or randomly adding some edge relationships between similar nodes by combining similarity masking and random masking methods). These perturbations simulate potential noise or misinterpretation of the original data. We train our model not only on the original candidate groups but also on the counterfactual groups. This ensures that the model learns to be robust to edge variations within clusters, based on which we obtain the final counterfactual groups CG that is completely opposite to the classification results of the candidate groups. By comparing the differences between the detection results of counterfactual groups and candidate groups, we find that when edge information between similar nodes in the candidate groups is deleted, the detection results of the counterfactual groups are completely opposite. Based on this, we mine the deleted edge relationships as the important subgraph structure ISG, that is:
I S G = i s g 1 , , i s g i , , i s g C t e s t
Based on Equation (26), we obtain the important subgraph structure ISG as the interpretation of detection results. By incorporating counterfactual learning, the improved robustness to edge variations within clusters makes our model more tolerant to noise and data misinterpretation. Algorithm 3 describes the counterfactual generation interpretation model.
Algorithm 3. Counterfactual generation interpretation model
Input: the test set Ctest
   the classification probability of test set qtest
Output: ISG
1     I S G Ø
2     repeat
3         for each Ci in Ctest do
4               A ¯ learn the masked adjacency matrix of Ci through similarity mask
5               z C i construct a generator to learn the group feature of Ci with Equations (21) and (22)
6               z ¯ C i construct a discriminator to obtain the classification probability of Ci with Equation (23)
7         end for
8         calculate the model loss with Equations (24)–(25)
9         update the counterfactual generation model with Adam
10     until model loss convergence
11     obtain the counterfactual groups with trained counterfactual generation model
12       ISG obtain the important subgraphs as interpretation by comparing counterfactual groups and candidate groups according to Equation (26)
13     return ISG
Algorithm 3 first initializes the important subgraph structure set ISG (Line 1) before training the CFG model to obtain the important subgraphs ISG to explain the detection results of review spammer groups. (Lines 2–12).

5. Experiments

In this section, the primary motivation and purpose of our experiments is to evaluate the effectiveness of the proposed method for detecting and interpreting review spammer groups. Specifically, we aim to address the following key questions:
(1)
How does KDCFG perform in comparison with the baselines in detecting and interpreting review spammer groups?
(2)
How do parameters of KDCFG affect the detection and interpretation performance?
(3)
How do different model combinations affect the detection and interpretation performance?
The experiments are conducted on a server with Intel(R) Core(TM) i7-10700 CPU @ 2.90 GHz 32.0 GB RAM (Intel Corporation, Santa Clara, CA, USA) and NVIDIA GeForce RTX 3090 GPUs (Nvidia Corporation, Santa Clara, CA, USA) (each of which has 24 GB of vRAM). The software environment is Python 3.8 and Pytorch 1.7.

5.1. Experimental Datasets

The Yelp and Amazon datasets are adopted to evaluate KDCFG. Amazon dataset [35] was obtained from Amazon.cn, consisting of 5055 labeled users (3118 normal users and 1937 spammers), 53,777 reviews/ratings, and 17,610 products. The YelpChi dataset [36] was composed of review data from hotels and restaurants in Chicago, which included 38,063 labeled users (7739 spammers and 30,324 normal users), 201 products, and 67,395 reviews/ratings. The YelpNYC dataset [37] was composed of review data from restaurants in the New York area, which included 160,225 labeled users (28,504 spammers and 131,721 normal users), 923 products, and 359,052 reviews/ratings. The YelpZip dataset [37] was composed of review data from restaurants in the New Jersey, Vermont, Connecticut, and Pennsylvania areas, including 260,227 labeled users (62,228 spammers and 198,049 normal users), 5044 products, and 608,598 reviews/ratings.

5.2. Evaluation Metrics

We employ two metrics of Recall@k (R@k) and Precision@k (P@k) [38] to evaluate the KDRSGD model, that is:
P @ k = u s u t u s
R @ k = u s u t u t
where us is the detected spam reviewer set, while ut is the spam reviewer set in the test set.
We employ the metrics of Fidelity and Sparsity [39] to evaluate the interpretation effect of CFG, that is:
Fidelity = 1 N i = 1 N p C i y i - p C ^ i y i
Sparsity = 1 N i = 1 N 1 - M i C i
where N denotes the amount of candidate groups in Ctest, p C i y i denotes the probability that candidate group Ci is classified as yi, p C ^ i y i is the probability that group C ^ i is classified as yi, C ^ i denotes the group after deleting important nodes (i.e., the nodes in the important subgraphs ISG), Mi is the number of same nodes between spammer groups and important subgraphs ISG, and C i is the number of nodes in Ci.

5.3. The Comparison of Detection Performance

To test the detection performance of transferring knowledge from a complex detection model to a lightweight model in Assumption 2, we conducted experiments to compare KDRSGD with five baseline approaches on Amazon and three Yelp datasets (i.e., YelpChi, YelpNYC, and YelpZip). Parameters lr and dropout were set to {0.005, 0.2} on Amazon, {0.002, 0.4} on YelpChi, {0.005, 0.4} on YelpNYC, and {0.002, 0.3} on YelpZip, respectively. The parameters of five baseline approaches are set according to the original papers.
(1)
GSCPM [4]: A clique percolation algorithm-based fraudster group detection approach, which adopts the clique percolation algorithm and the group indicators to obtain the most suspicious fraudster groups.
(2)
LP-RSG [5]: A label propagation-based fraudster group detection approach, which uses a designed a label propagation approach and an indicator weighted approach to detect the most suspicious fraudster groups.
(3)
CSGD-NE [6]: A network embedding-based collusive spammer detection approach, which utilizes K-means and Canopy approach and an indicator weighted approach to identify the most suspicious fraudster groups.
(4)
GSDB [40]: A review explosion-based collusive spammer detection approach, which adopts a kernel density estimation approach and indicators to identify the most suspicious fraudster groups.
(5)
HIN-RNN [41]: A graph neural network-based collusive spammer detection approach, which combines time interval between reviews and RNN to identify the most suspicious groups.
Figure 2 and Figure 3 demonstrate the detection result comparisons of KDRSGD, GSCPM, GSDB, CSGD-NE, LP-RSG, and HIN-RNN on the Amazon, YelpChi, YelpNYC, and YelpZip datasets, respectively. Based on Figure 2 and Figure 3, we can draw the conclusions as follows:
(1)
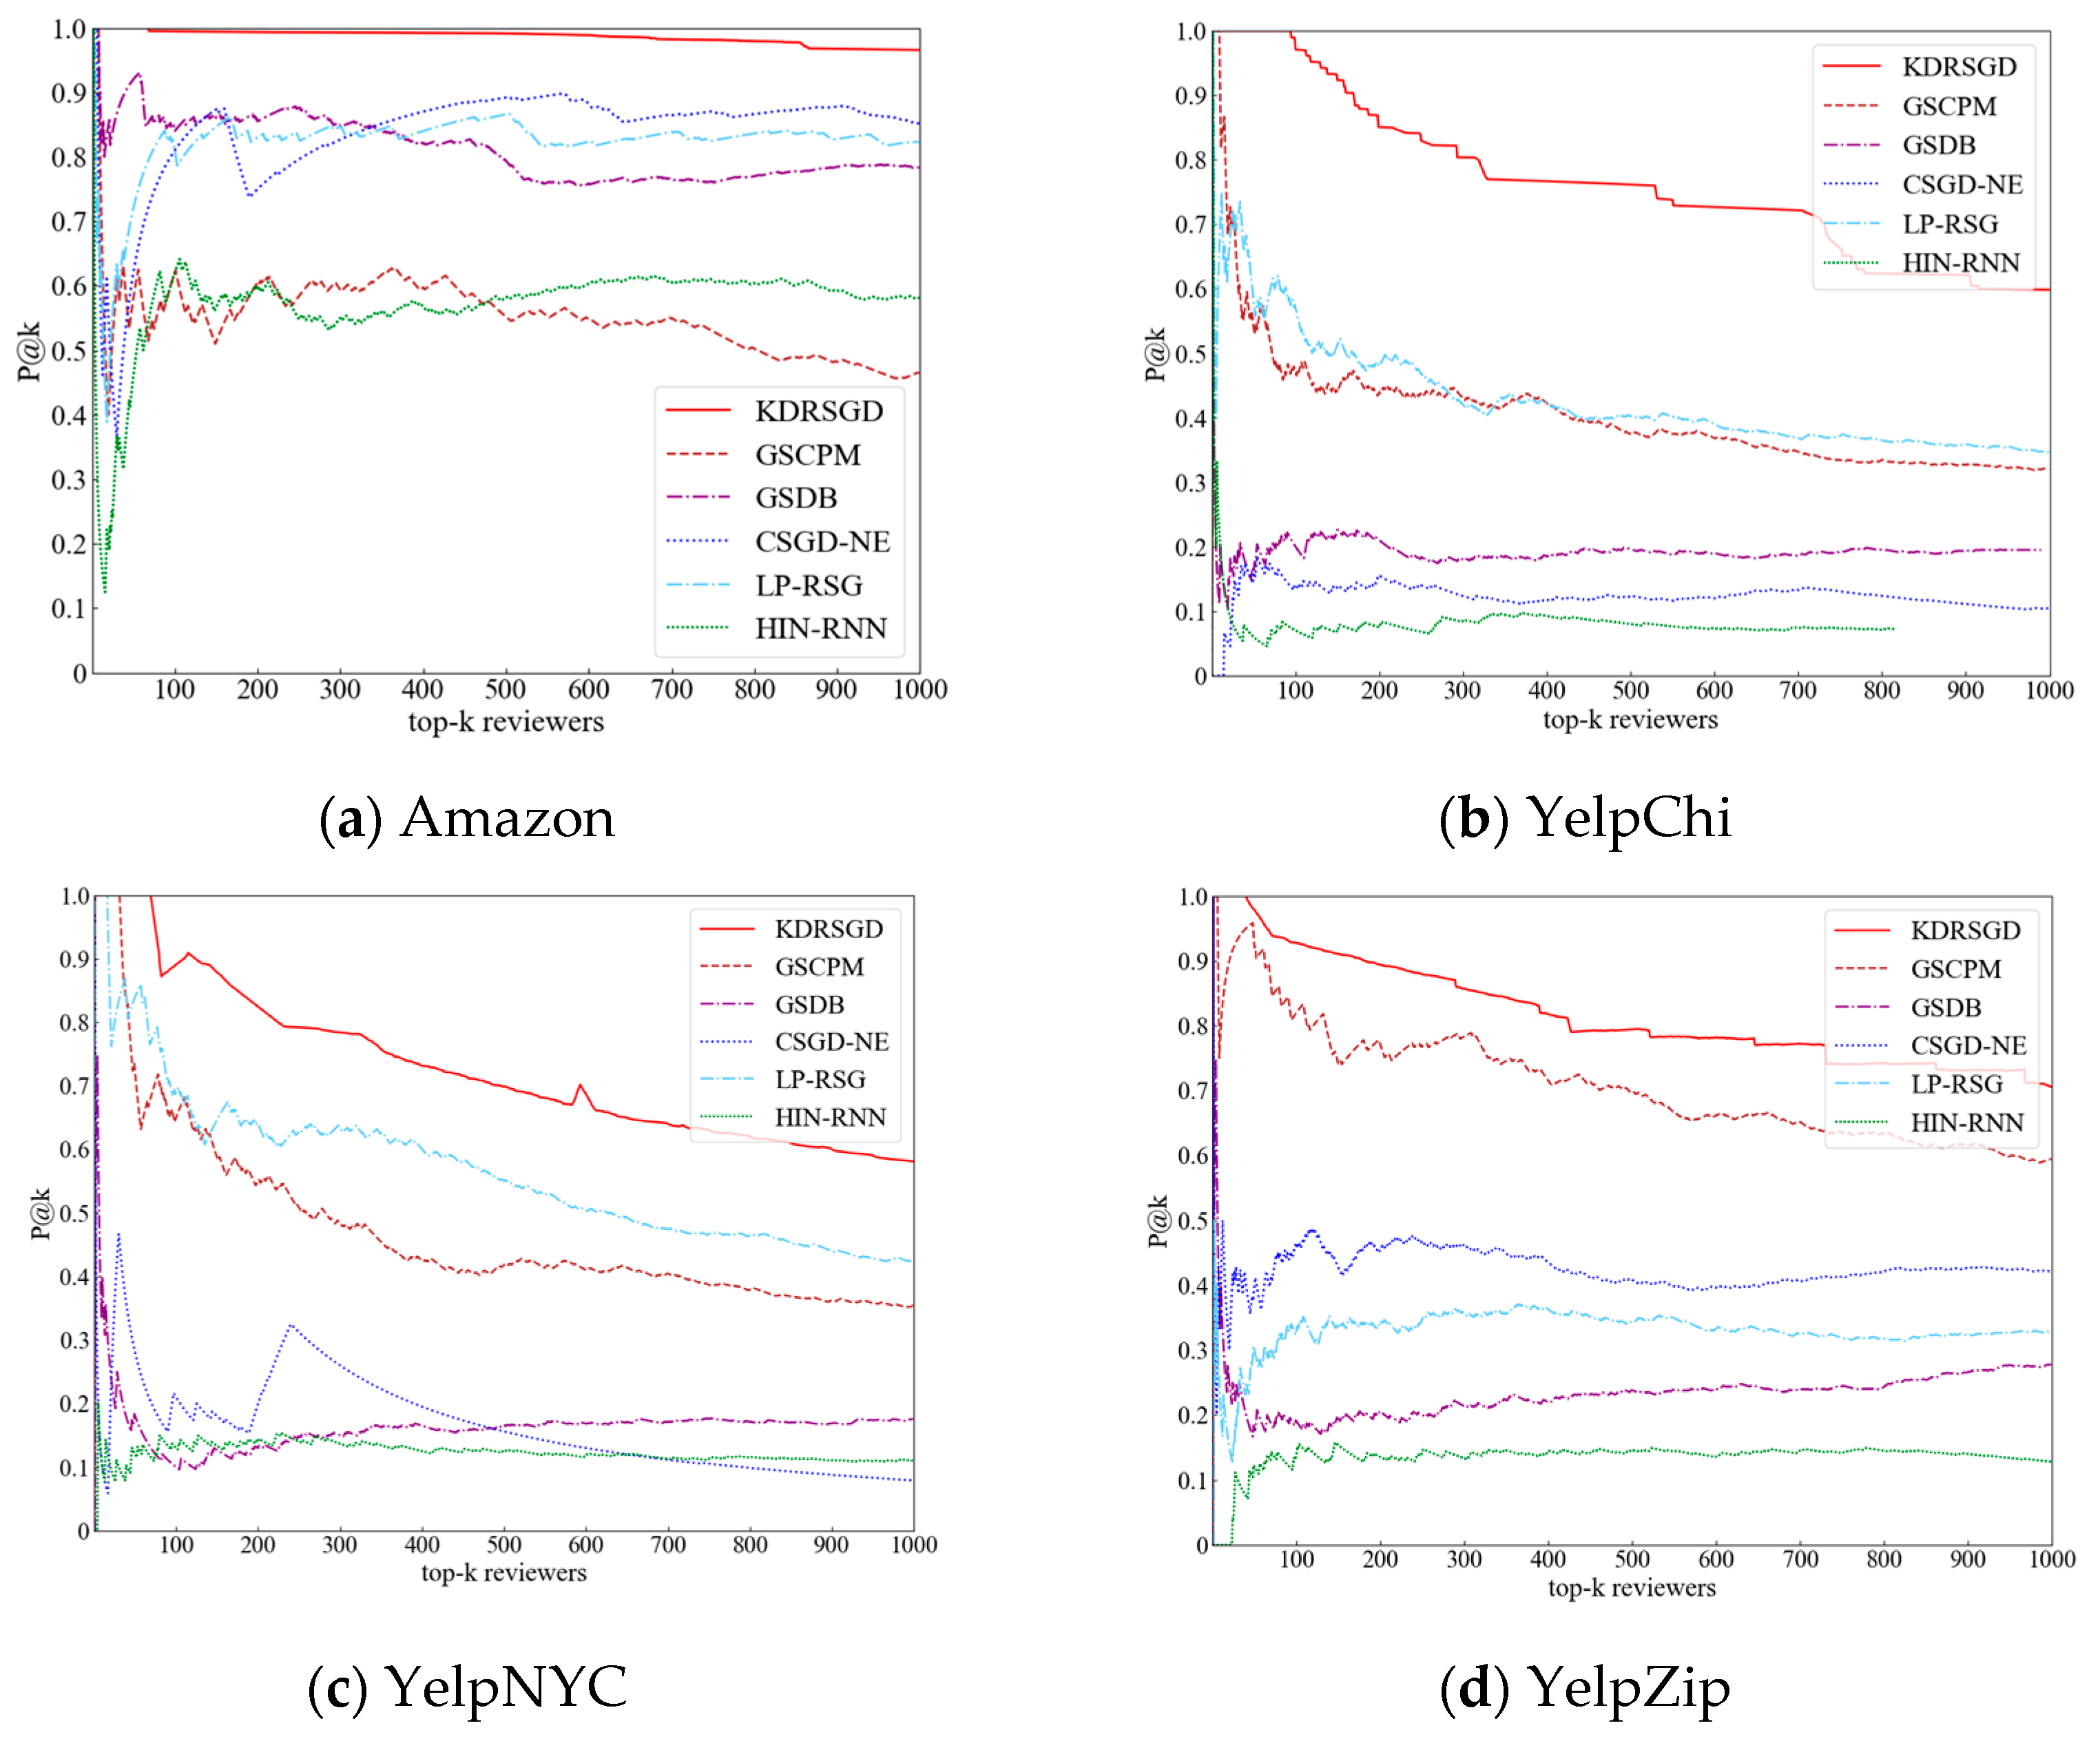
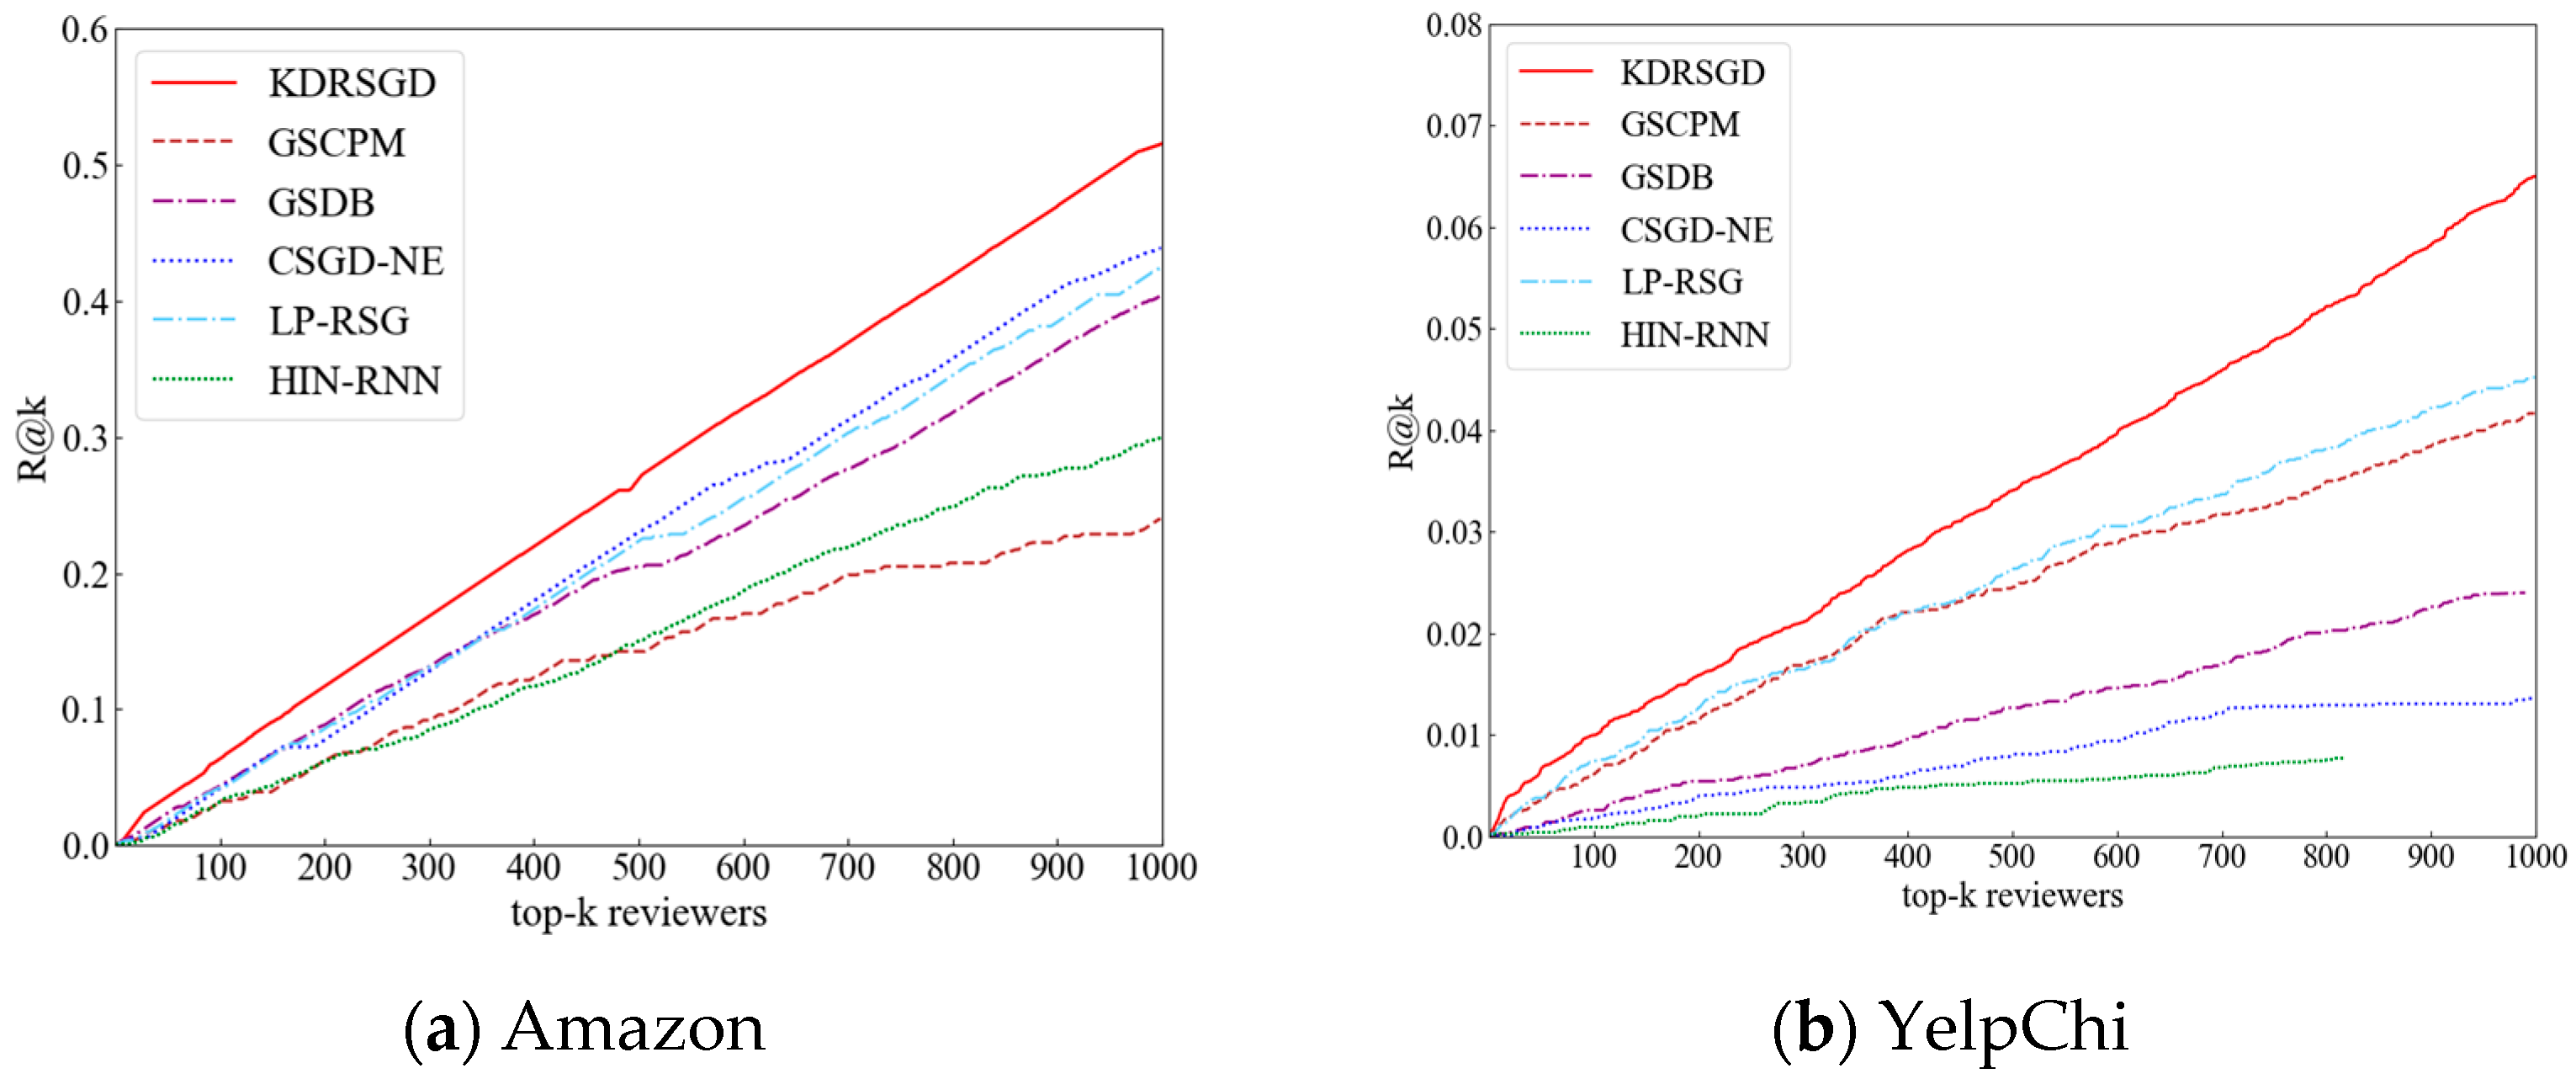
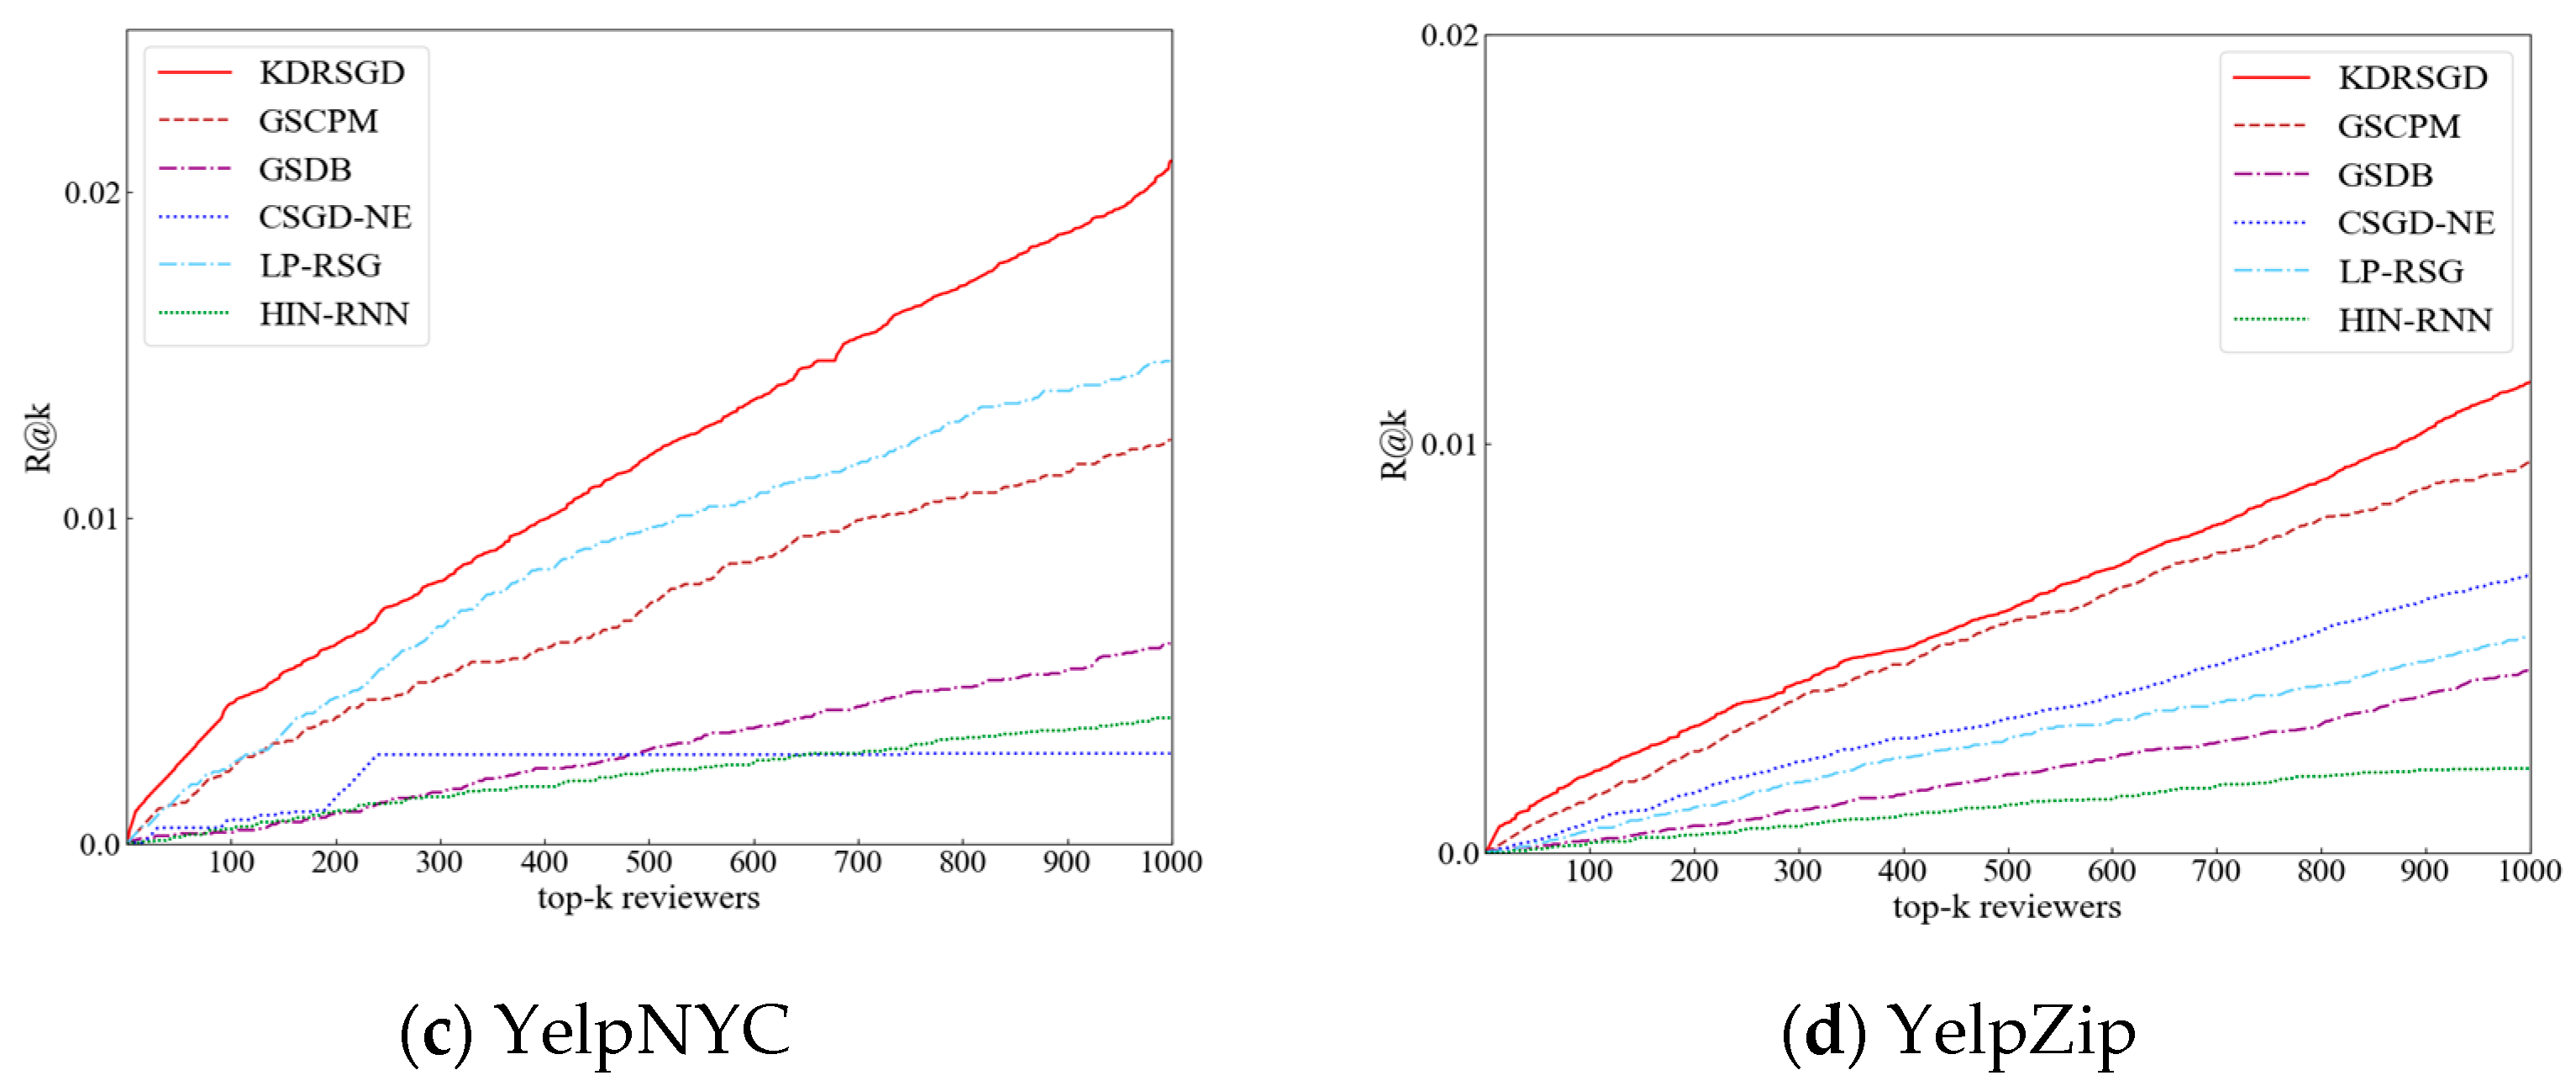
KDRSGD outperforms the other six methods on the four datasets. KDRSGD’s P@k and R@k are improved by {13.37%, 17.34%} on Amazon, {72.63%, 43.81%} on YelpChi, {37.46%, 41.22%} on YelpNYC, and {18.83%, 21.05%} on YelpZip, respectively, being among the top-1000 when compared with state-of-the-art approaches. The reason is that KDRSGD uses a graph agglomerative hierarchical clustering method to mine candidate groups with closer relationships at a deeper level. Meanwhile, KDRSGD constructs a knowledge distillation model to learn the discriminative candidate group vector representations, thereby improving the detection performance of review spammer groups.
(2)
GSDB, LP-RSG, and GSCPM show different trends of change on the four datasets. LP-RSG’s P@k and R@k are {35.77%, 18.44%} on Amazon, {3.96%, 0.36%} on YelpChi, and {6.91%, 0.24%} on YelpNYC, respectively, being among the top-1000 and higher than those of GSCPM. This may be because LP-RSG adopts the indicator weighting strategy to detect more collusive review spammers, but GSCPM only uses the group indicators to detect the suspicious spammer groups. GSDB has lower detection results than GSCPM and LP-RSG on three Yelp datasets. The possible reason is that the co-reviewing relationships between users in three Yelp datasets are sparse, making it difficult for the indicators used in GSDB to accurately identify collusive user relationships.
(3)
HIN-RNN and CSGD-NE have poor P@k and R@k on four datasets, e.g., their P@k values remain around 0 and 0.1042—among the top-1000—on YelpChi and around 0.1283 and 0.4218—among thetop-1000—on YelpZip, respectively. CSGD-NE and HIN-RNN’s R@k reach around 0 and 0.0136—among the top-1000—on YelpChi and around 0.0028 and 0.0039—among the top-1000—on YelpNYC, respectively. The main reason is that CSGD-NE uses the indicator weighting strategy to detect review spammer groups and HIN-RNN is unable to accurately mine the collusive user relationships on the sparse datasets, resulting in poor detection effect.

5.4. The Evaluation of Interpretation Results

To show the interpretation effect of CFG, we compare CFG with PGM-Explainer, SubgraphX, GNNExplainer, CAL, and Causal-GNN according to Sparsity and Fidelity on the Amazon and three Yelp datasets (i.e., YelpChi, YelpNYC, and YelpZip). Parameter weight_decay is all configured as 0.005 for the four datasets. The parameters of five baseline approaches are set according to the original papers.
(1)
PGM-Explainer [19]: A probabilistic graphical model-based interpretation method, which deletes unimportant data in the sampled data as the filtered data and inputs it into the probabilistic graphical model for interpreting the prediction results.
(2)
SubgraphX [23]: An interpretation method based on subgraph exploration, which calculates the importance of different subgraphs according to Shapley values and selects important subgraphs as the interpretations of the prediction results.
(3)
GNNExplainer [42]: A generative interpretation method based on graph neural networks, which labels the key features of paths and utilizes a maximizing mutual information approach to interpret the prediction results.
(4)
CAL [43]: A graph classification interpretation method based on causal attention learning, which applies a causal attention mechanism to search the causal information for explaining the prediction results.
(5)
Causal-GNN [44]: An interpretation method based on causal learning, which adopts the attention network and gated graph neural network to mine some causal features for interpretation results.

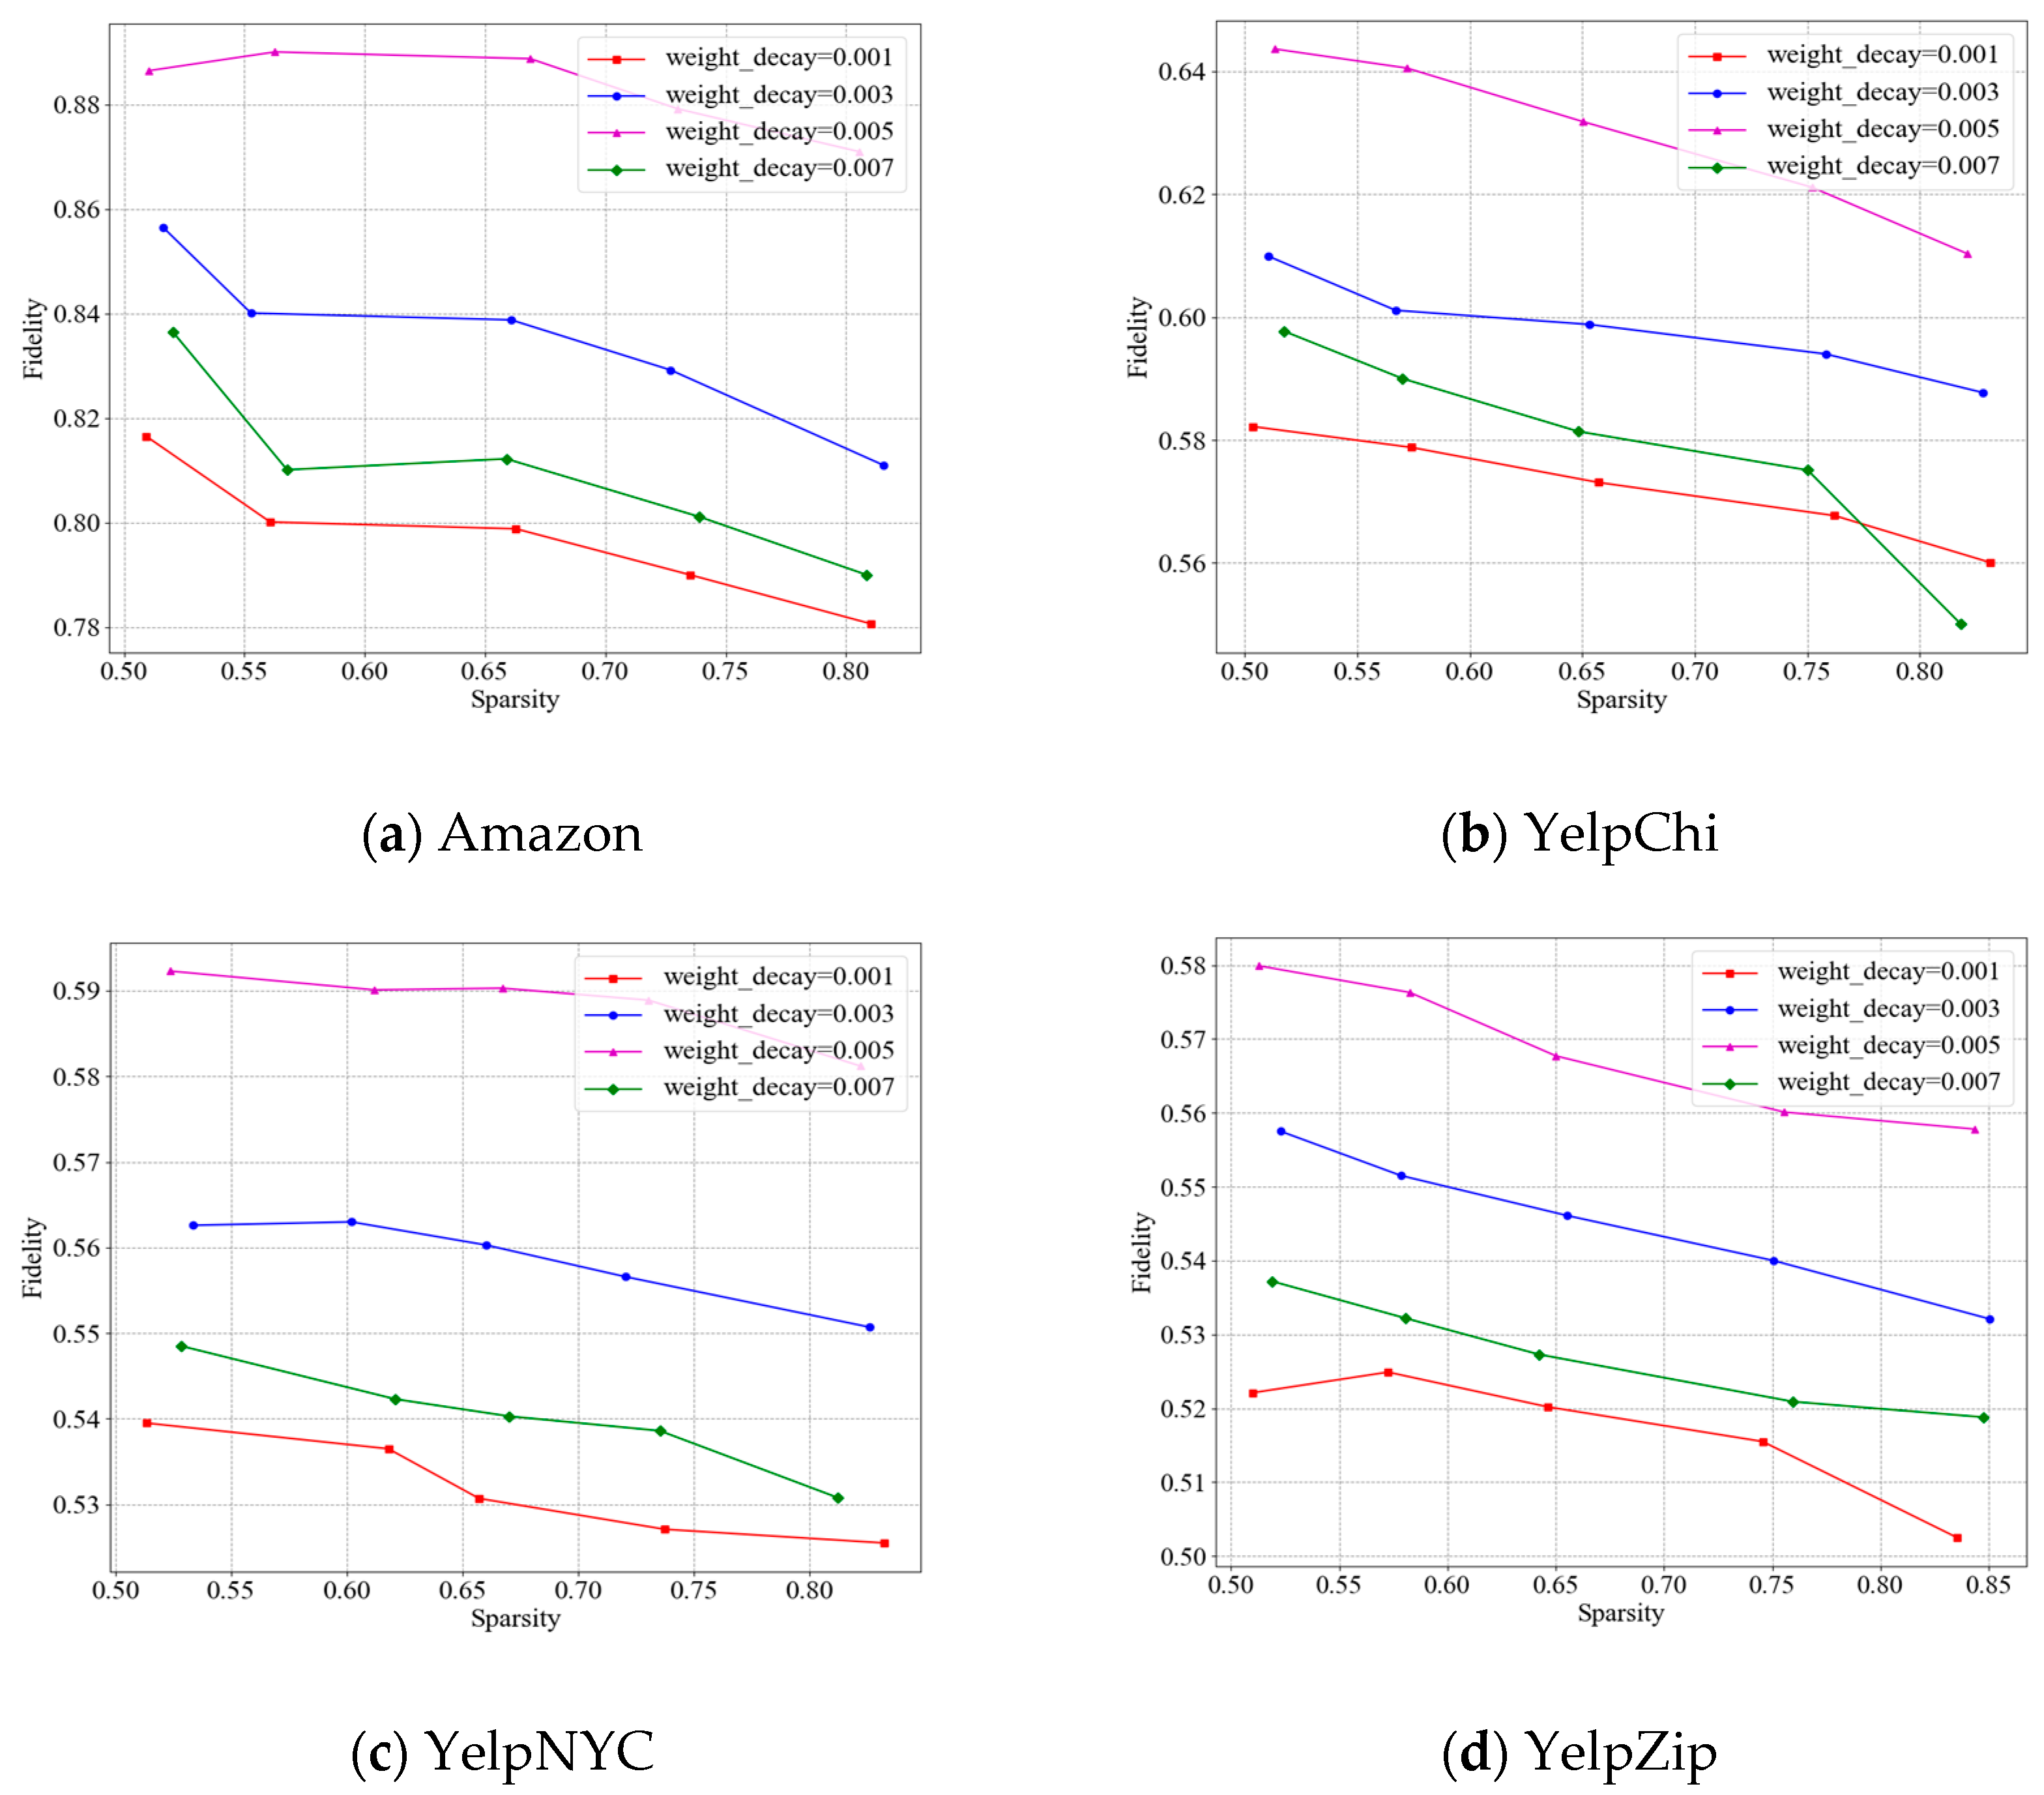
5.4.1. Comparison of Interpretation Effect on the Four Datasets

To test the interpretation performance of counterfactual generation model to a lightweight model in Assumption 3, we employ two metrics of Sparsity and Fidelity to measure the effect of CFG, PGM-Explainer, SubgraphX, GNNExplainer, CAL, and Causal-GNN.
Figure 4 shows the comparison of Fidelities of CFG, PGM-Explainer, SubgraphX, GNNExplainer, CAL, and Causal-GNN with diverse Sparsity on the four datasets. We have three observations according to Figure 4.
(1)
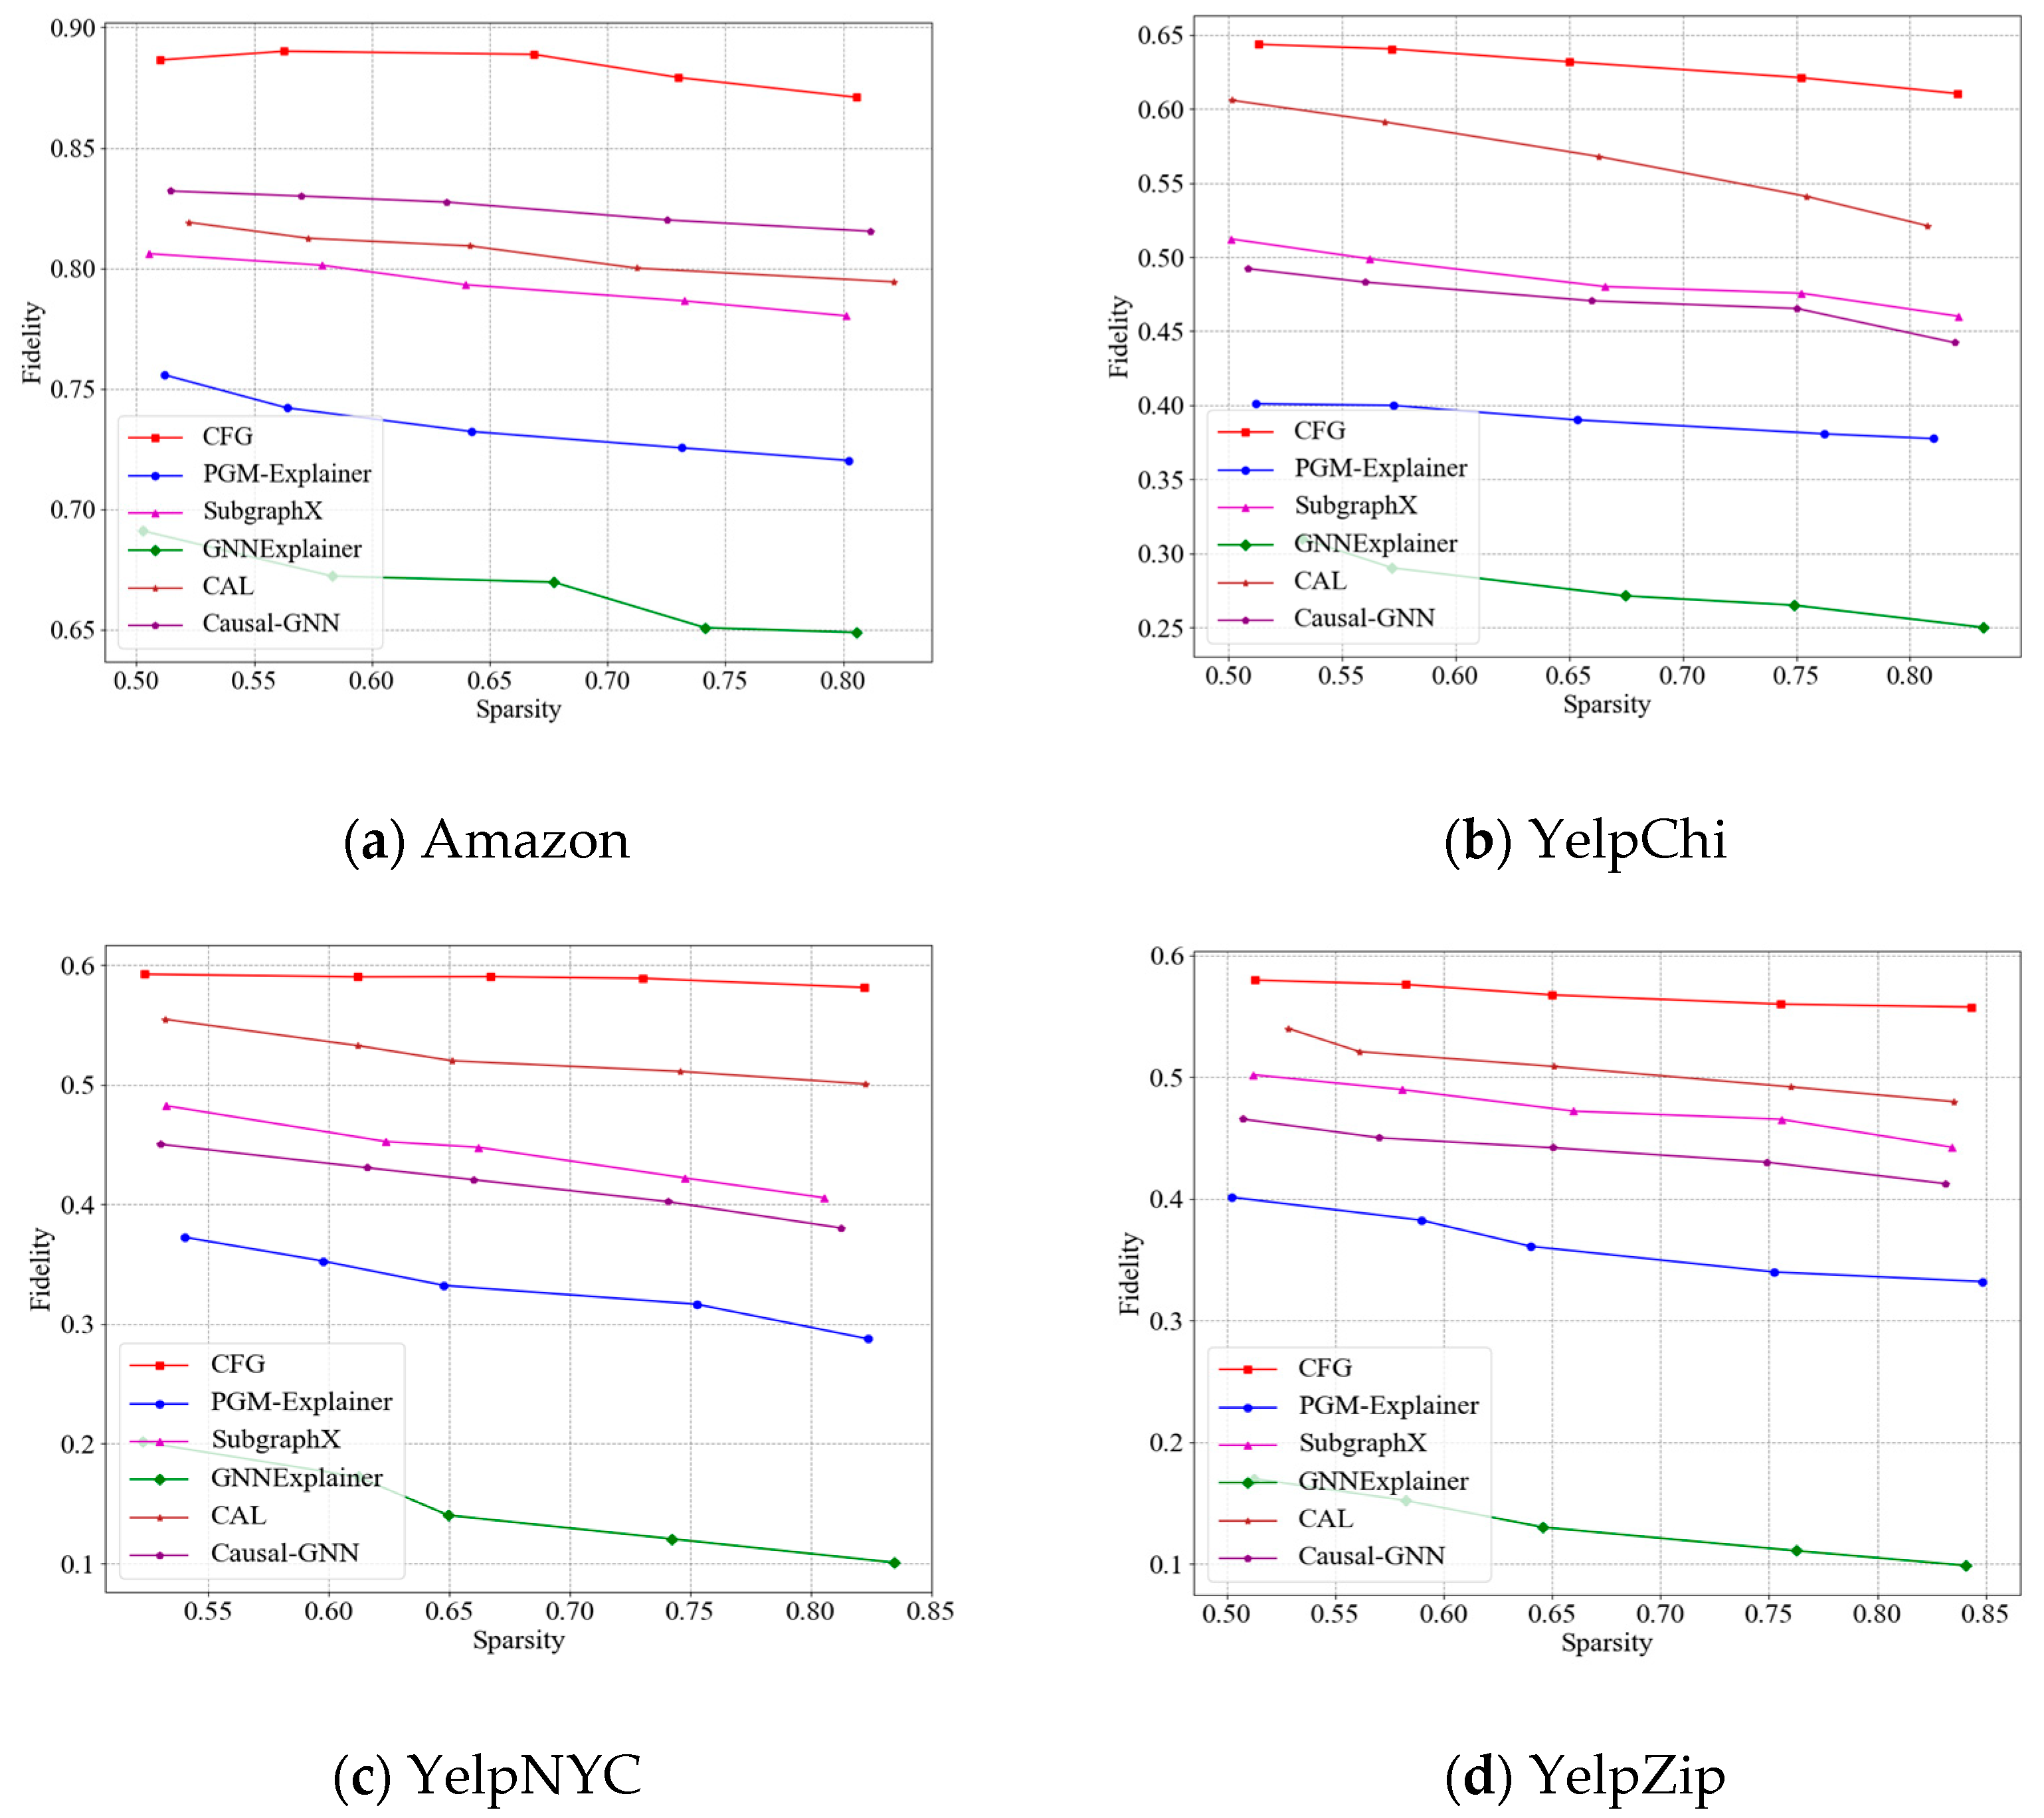
At diverse Sparsity, CFG’s Fidelity is superior to other methods on the four datasets. CFG’s Fidelity varies around 0.88, 0.63, 0.59, and 0.56 and is around 6%, 7%, 7%, and 6% higher than that of the optimal comparison methods, respectively. The reason is that CFG uses a counterfactual generation method to obtain counterfactual groups that are completely opposite to the detection results of candidate groups, which can further compare the candidate groups and counterfactual groups to accurately mine the important subgraph structures for the interpretation of the detection results.
(2)
Graph neural network-based methods (i.e., PGM-Explainer, SubgraphX, and GNNExplainer) display various changing trends of Fidelity with diverse Sparsity on the four datasets. SubgraphX’s Fidelity is 6%, 9%, 11%, and 10% greater than that of PGM-Explainer with diverse Sparsity on the four datasets, respectively. This shows that mining subgraphs to search the relational local topological structures of predictions is effective for interpreting the prediction results. The Fidelity of PGM-Explainer is 7%, 12%, 19%, and 23% greater than that of GNNExplainer with diverse Sparsity on the four datasets, respectively. The reason is that PGM-Explainer uses a probabilistic graphical model to obtain the accurate interpretations. GNNExplainer has poorer interpretation performance compared with PGM-Explainer and SubgraphX. The reason is that GNNExplainer ignores the interpretation of the detection results from a global structure and loses important node information.
(3)
Causal learning-based methods (i.e., CAL and Causal-GNN) perform better than graph neural network-based methods. CAL’s Fidelity is 9%, 10%, and 6% greater than that of Causal-GNN with diverse Sparsity on three Yelp datasets, respectively. The reason is that CAL fully considers the structural relationships of data to search the key causal features, but Causal-GNN only mines the causal relationships between input features and prediction results.

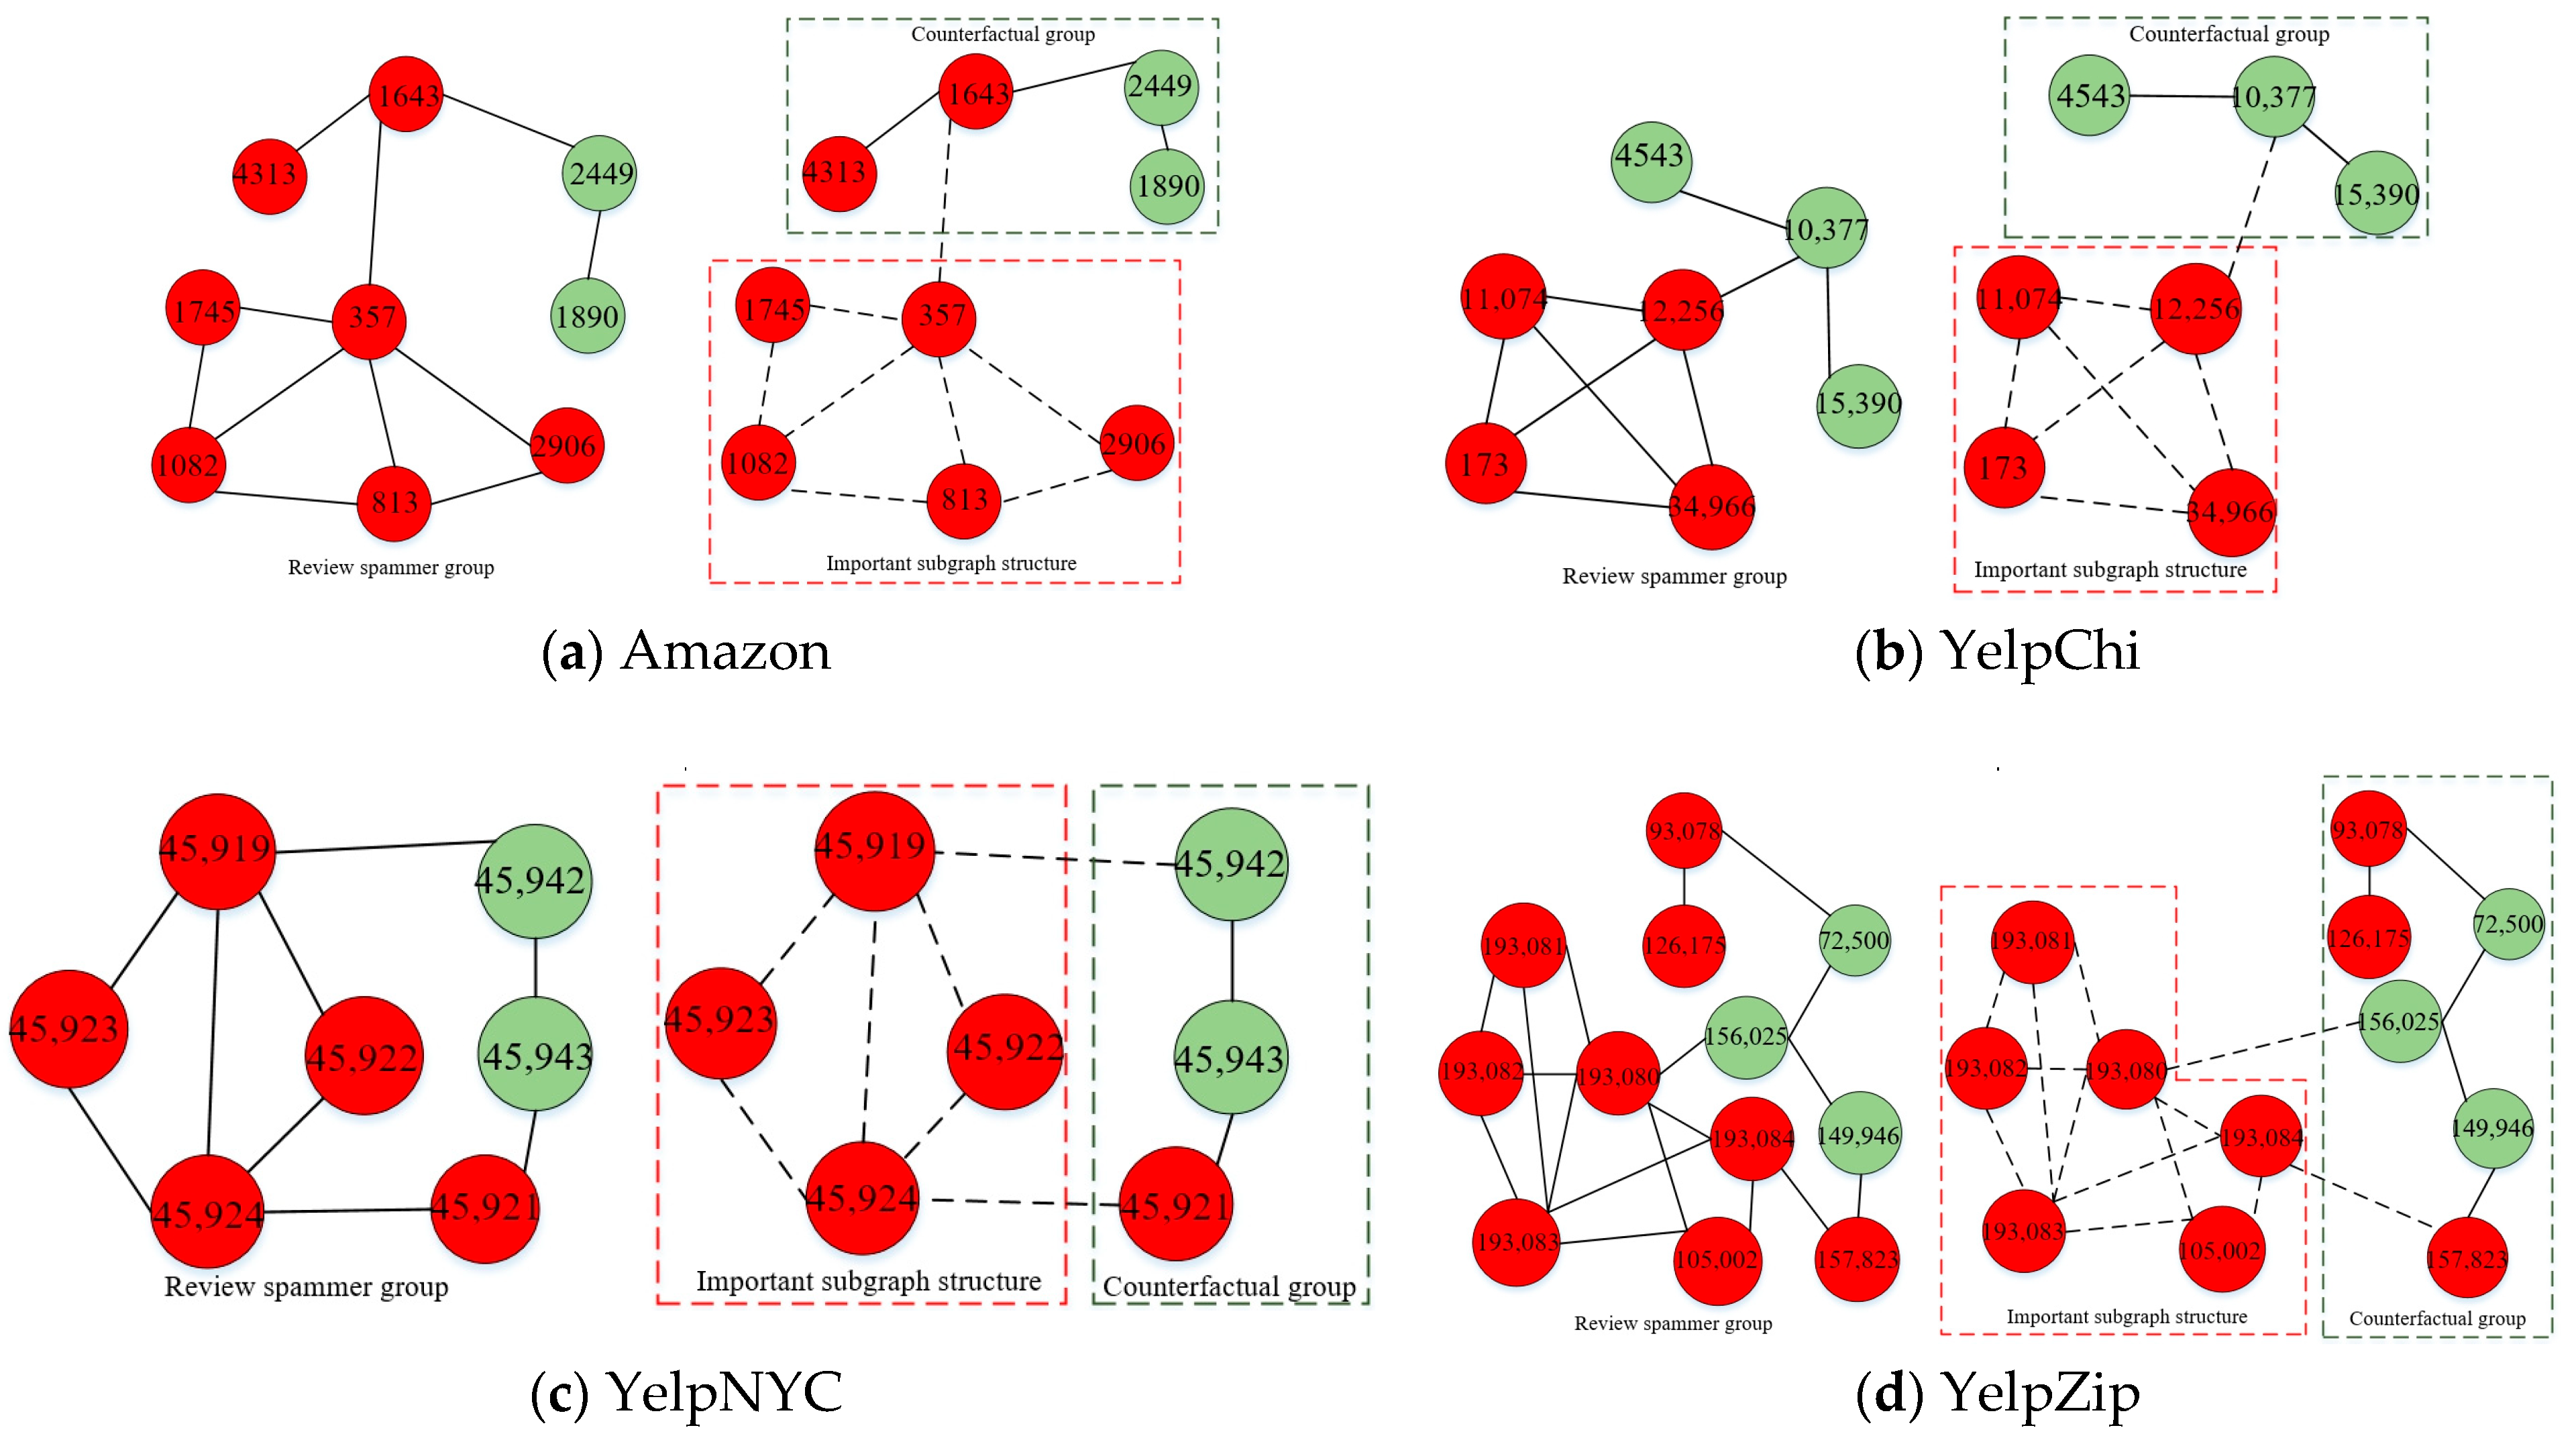
5.4.2. The Visualization of Interpretation Results

To visualize the interpretation results of CFG, we chose some review spammer groups to visualize the interpretation results at random on the four datasets, respectively.
Figure 5 visualizes the interpretation results of CFG on the four datasets. We compare the detection results between the candidate groups and counterfactual groups, and obtain the important subgraph structures (i.e., the red dashed boxes on the four datasets) as the explanations of detection results. As shown in Figure 5a, the review spammer group contains both spammers and normal users. When the counterfactual generation model is used to obtain the counterfactual groups, we delete the edge relationships among nodes 1745, 357, 1082, 813, and 2906. Meanwhile, we retain the edge relationships among nodes 4313, 1643, 2449, and 1890 as a counterfactual group. The detection result of the counterfactual group is completely opposite to that of the candidate group, which indicates that the suspicious collusion behavior of the group becomes weaker after deleting the edge relationships among spammers with collusion and cheating behavior. Therefore, we mine the deleted nodes as the important subgraph structure to explain the collusion and cheating behavior of review spammer group. As shown in Figure 5b–d, similar to the interpretation results of the Amazon dataset, the important subgraph structure is all composed of spammers. Meanwhile, we obtain the collusive spammers with closer review relationships as explanations. This indicates that CFG can mine the suspicious collusion spammers as the important subgraph structures, thus explaining the reason why candidate groups are classified as spammer groups and improve the interpretability of detection results.

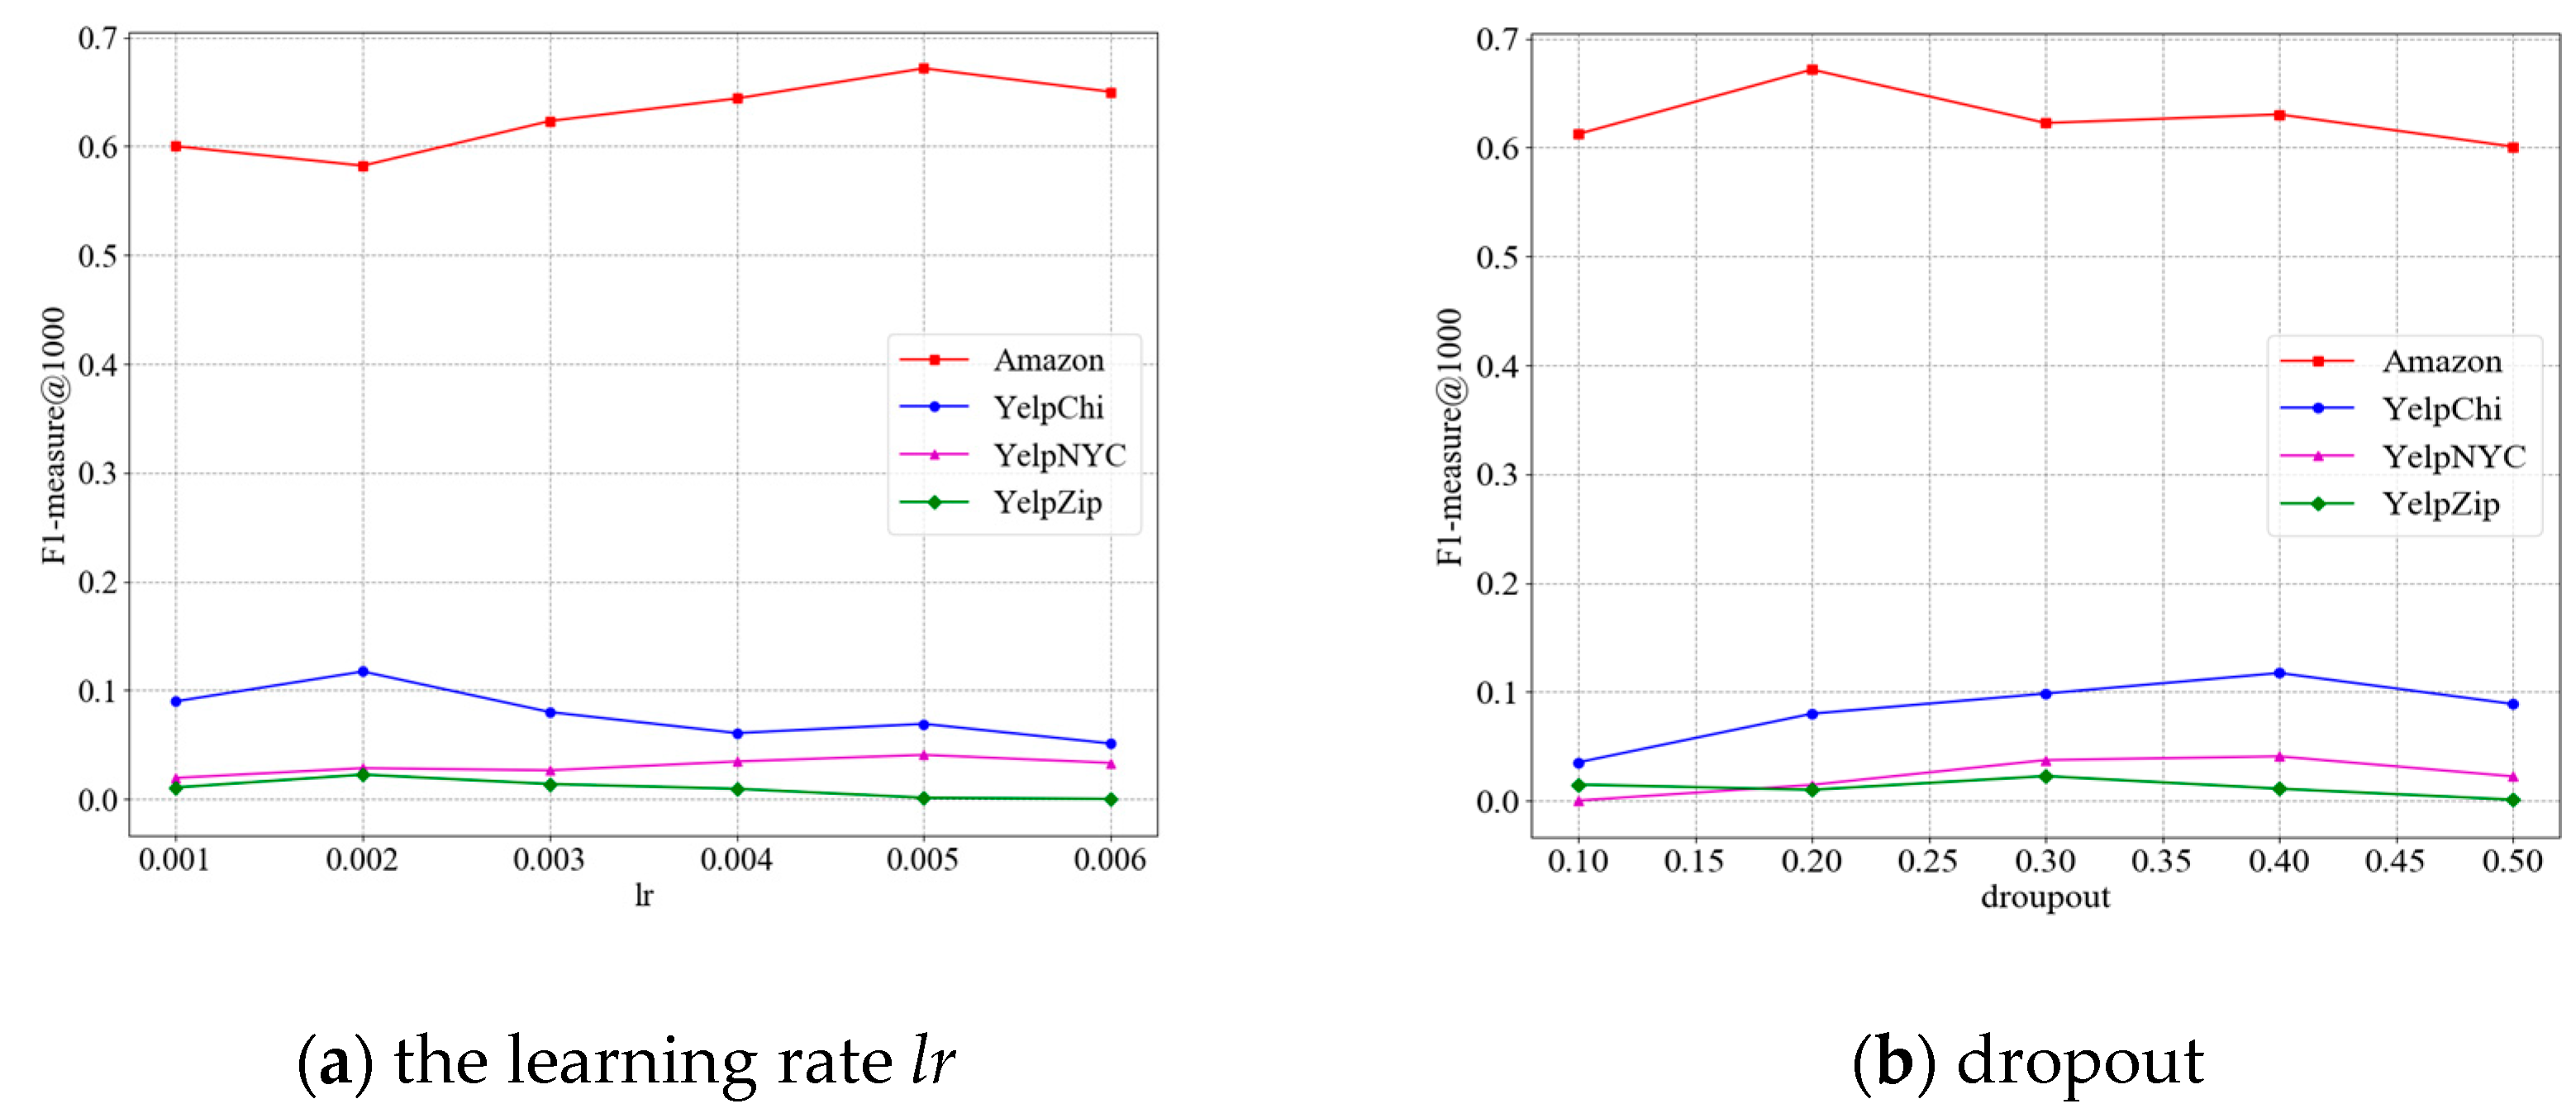
5.5. The Parameter Analysis of KDCFG

KDCFG includes three parameters: (a) learning rate lr, (b) dropout, and (c) weight_decay. lr is used to determine the amplitude of parameter updates, dropout is employed to reduce overfitting and enhance the generalization ability of model, and weight_decay is used to prevent overfitting. Figure 6 displays the impact of detection model parameters lr and dropout on F1-measure@1000. Figure 7 shows the influence of interpretation model parameter weight_decay on Fidelities under different Sparsity levels.
In Figure 6a, KDRSGD’s F1-measure@1000 on Amazon indicates a pattern of first declining and thereafter increasing as lr increases from 0.002 to 0.005, followed by a decreasing trend with the increase of lr. F1-measure@1000 of KDRSGD demonstrates a trend of first increasing and then declining as lr increases on the Yelp datasets. When lr is 0.05, 0.02, 0.05, and 0.02, F1-measure@1000 of KDRSGD achieves the optimal value on the four datasets, respectively. This is because the inappropriate setting for lr may make KDRSGD fail to converge or fall into the local optimum, thereby affecting the detection performance. Therefore, parameter lr is set to 0.05 for Amazon, 0.02 for YelpChi, 0.05 for YelpNYC, and 0.02 for YelpZip.
In Figure 6b, KDRSGD’s F1-measure@1000 on Amazon continuously grows with the increase of dropout from 0.1 to 0.2. After that, it demonstrates a trend of first declining, followed by a trend of decreasing with the increase of dropout from 0.2 to 0.4. Finally, it decreases with the increase of dropout from 0.4 to 0.5. When the dropout is 0.2, KDRSGD’s F1-measure@1000 achieves the upper limit on Amazon. On three Yelp datasets, F1-measure@1000 of KDRSGD indicates a pattern of initially rising and thereafter declining as the dropout grows. When dropout is 0.4, 0.4, and 0.3, F1-measure@1000 of KDRSGD achieves the optimal value on the Yelp datasets. This is because KDRSGD may overfit the training data when dropout is set too low, while a high dropout setting may make KDRSGD lose some information and cause the underfitting problem. Therefore, parameter dropout is set to 0.2 for Amazon, 0.4 for YelpChi, 0.4 for YelpNYC, and 0.3 for YelpZip.
In Figure 7, under different values of the parameter weight_decay, the Fidelity of CFG at different levels of Sparsity shows the different trends. When the weight_decay is 0.005, CFG achieves the optimal value of Fidelity under different levels of Sparsity on the four datasets. This is because the parameter weight_decay can modify the effect of complexity on the loss of model. If it is set too high, the loss of CFG will be excessive, which will negatively affect the explanatory performance of CFG. Therefore, the parameter weight_decay is established at 0.005 for the four datasets.

5.6. Ablation Study

Aiming at verifying the impact of various model combinations on detection and interpretation performance, we conducted a series of experiments on two datasets (i.e., Amazon and YelpChi). In these experiments, the configuration parameters for KDCFG remain consistent with those detailed in Section 5.5.

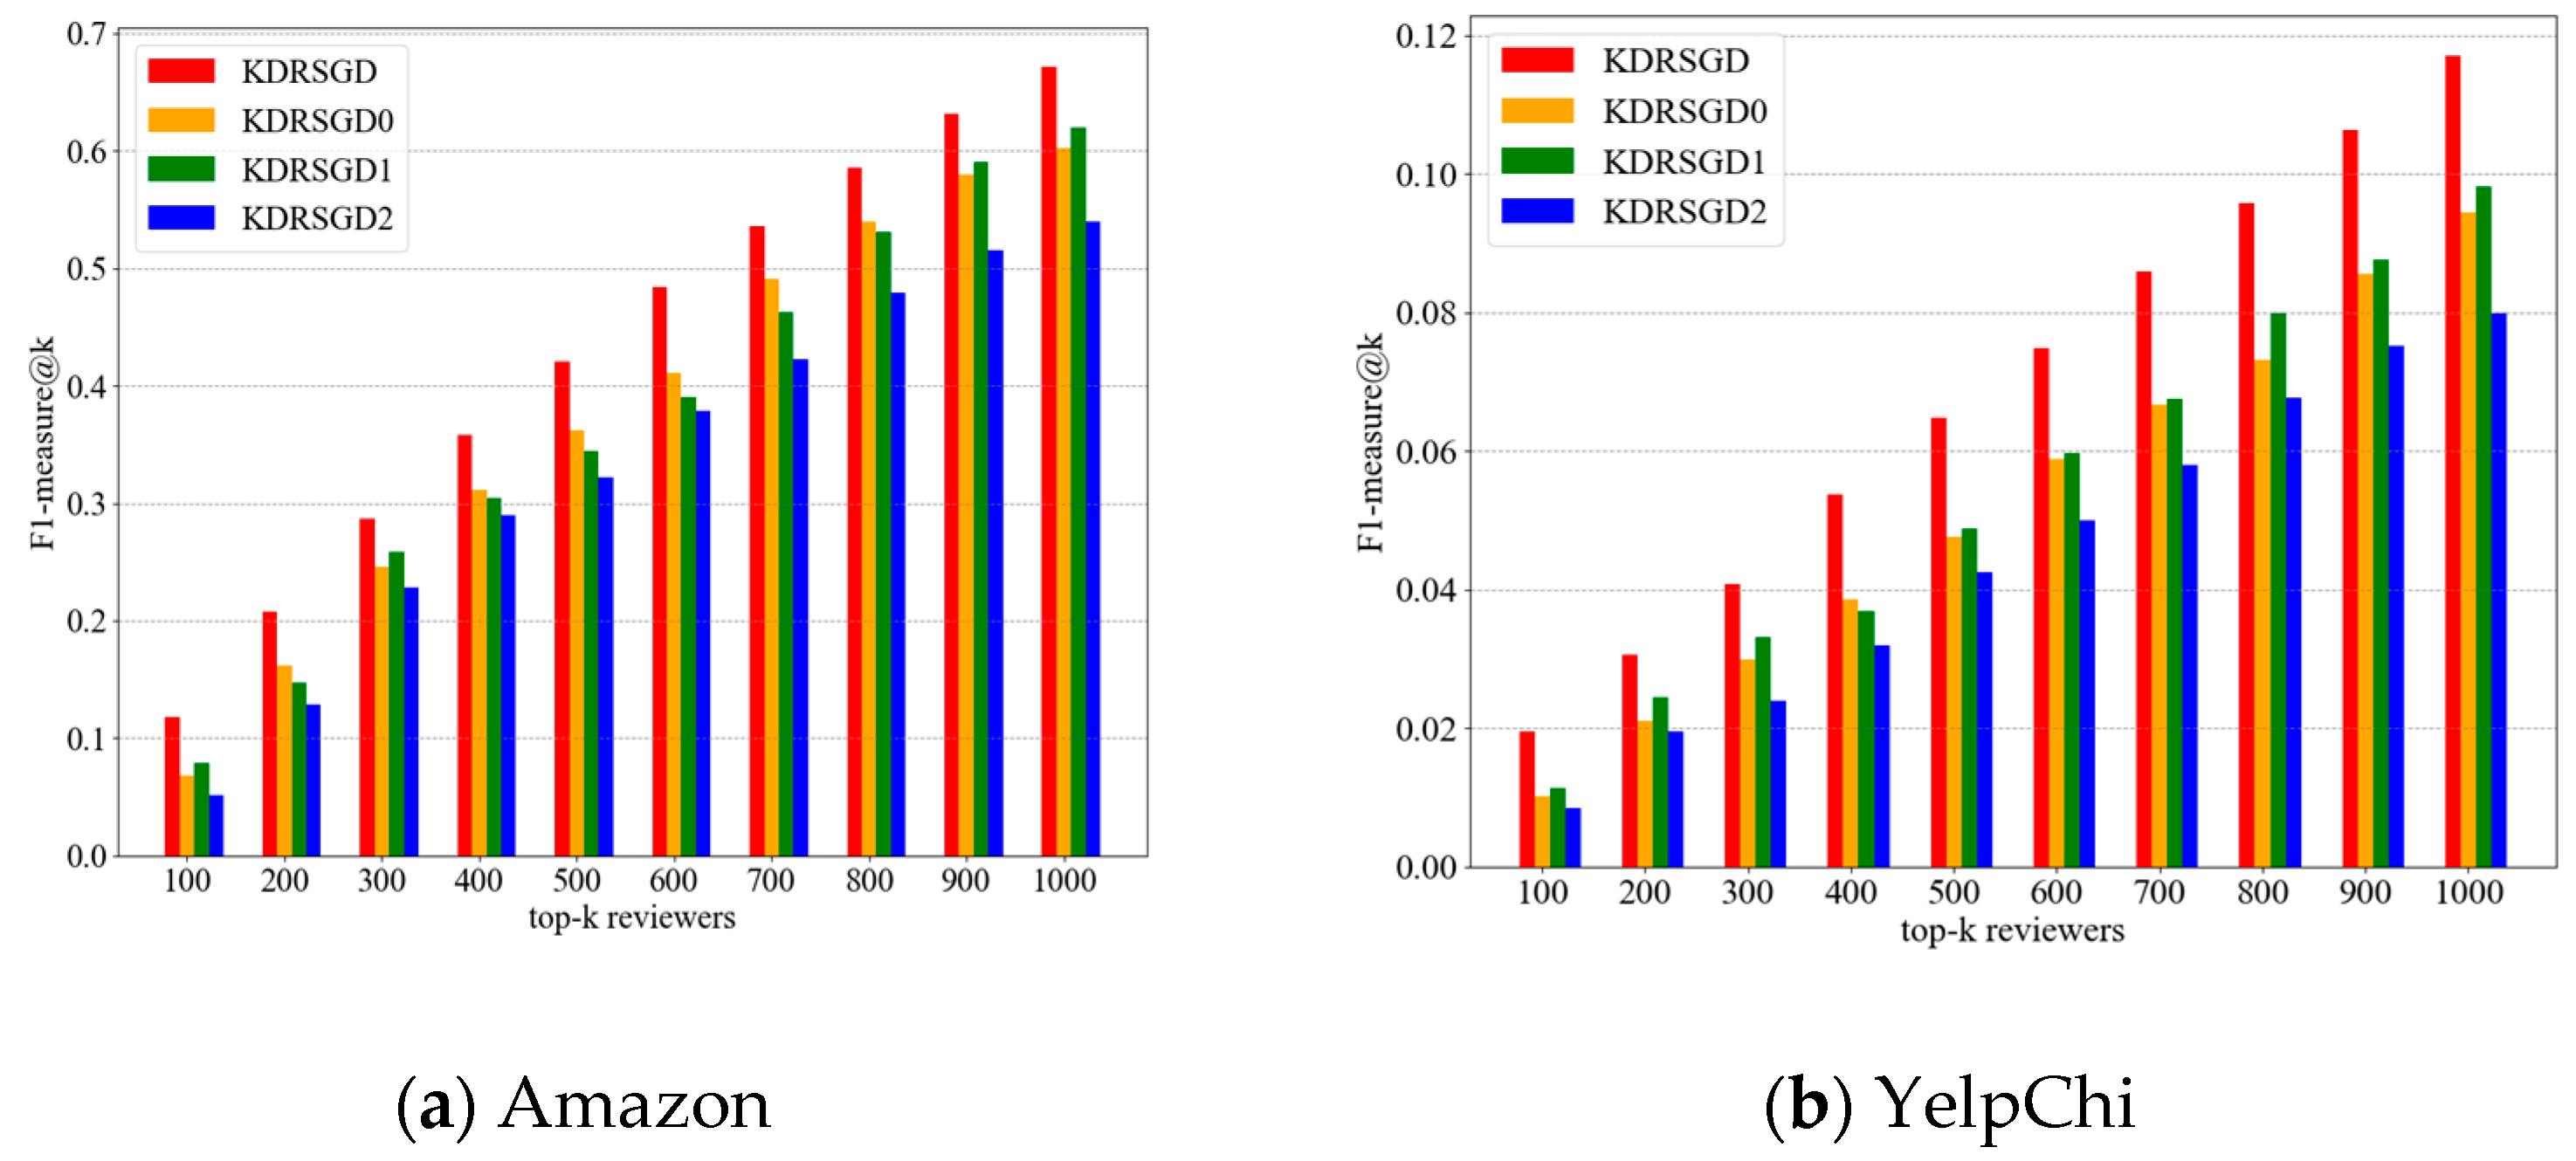
5.6.1. Ablation Study on Effect in Detection Performance

We conduct ablation experiments about detection effect on two datasets (i.e., Amazon and YelpChi). Three different variant methods are as follows:
(1)
Aiming at the Assumption 1, we consider the user review behavior in shorter time intervals and with similar polarity ratings in the process of constructing a suspicious user review relationship graph. To test Assumption 1, we propose a variant method KDRSGD0 (i.e., NURG+DBSCAN+KD) to verify changes in detection performance without considering the user review behavior, which learn the user relationship graph with N-nearest neighbor (NURG) to replace the suspicious user review relationship graph (SURG), and use a DBSCAN algorithm to replace the graph agglomerative hierarchical clustering approach (GAHC) for discovering candidate groups. KDRSGD0 first uses NURG and DBSCAN [10] to obtain candidate groups and subsequently uses a knowledge distillation model (KD) to identify the dubious spammer groups.
(2)
KDRSGD1 (i.e., SURG+GAHC+Autoencoder) replaces KD with an autoencoder. KDRSGD1 first utilizes SURG and GAHC to discover candidate groups, and then uses Autoencoder [9] to detect review spammer groups.
(3)
KDRSGD2 (i.e., SURG+GAHC+KD0) is a variant of KDRSGD. KDRSGD2 first uses SURG and GAHC to discover candidate groups and then replaces the similarity mask method in KD with a random mask method [45] to identify the dubious spammer groups.
Figure 8 shows the F1-measure@k of different variants under different top-k reviewers on two datasets (i.e., Amazon and YelpChi). In accordance with Figure 8, we make two conclusions:
(1)
SURG and GAHC can help improve the detection performance. Compared to KDRSGD0, KDRSGD’s F1-measure@1000 is improved by 11.54% and 24.05% on two datasets, respectively. This indicates that the graph agglomerative hierarchical clustering algorithm can mine the users with closer relationships to obtain candidate groups with high quality, which helps to detect the collusive spammers more accurately.
(2)
KDRSGD’s detection performance exceeds the performance of KDRSGD1 and KDRSGD2. Compared to KDRSGD1, KDRSGD’s F1-measure@1000 is improved by 8.29% and 19.25% on two datasets, respectively. This is because KDRSGD uses a knowledge distillation model to fully learn discriminative candidate group vectors, which help detect the collusive spammers accurately. Compared to KDRSGD2, KDRSGD’s F1-measure@1000 is improved by 24.39% and 46.56% on two datasets, respectively. This indicates that the use of similarity masking in KDRSGD helps reduce the noise and irrelevant feature information, which improves the detection performance of KDRSGD.

5.6.2. The Ablation Study on Effect on Interpretation Performance
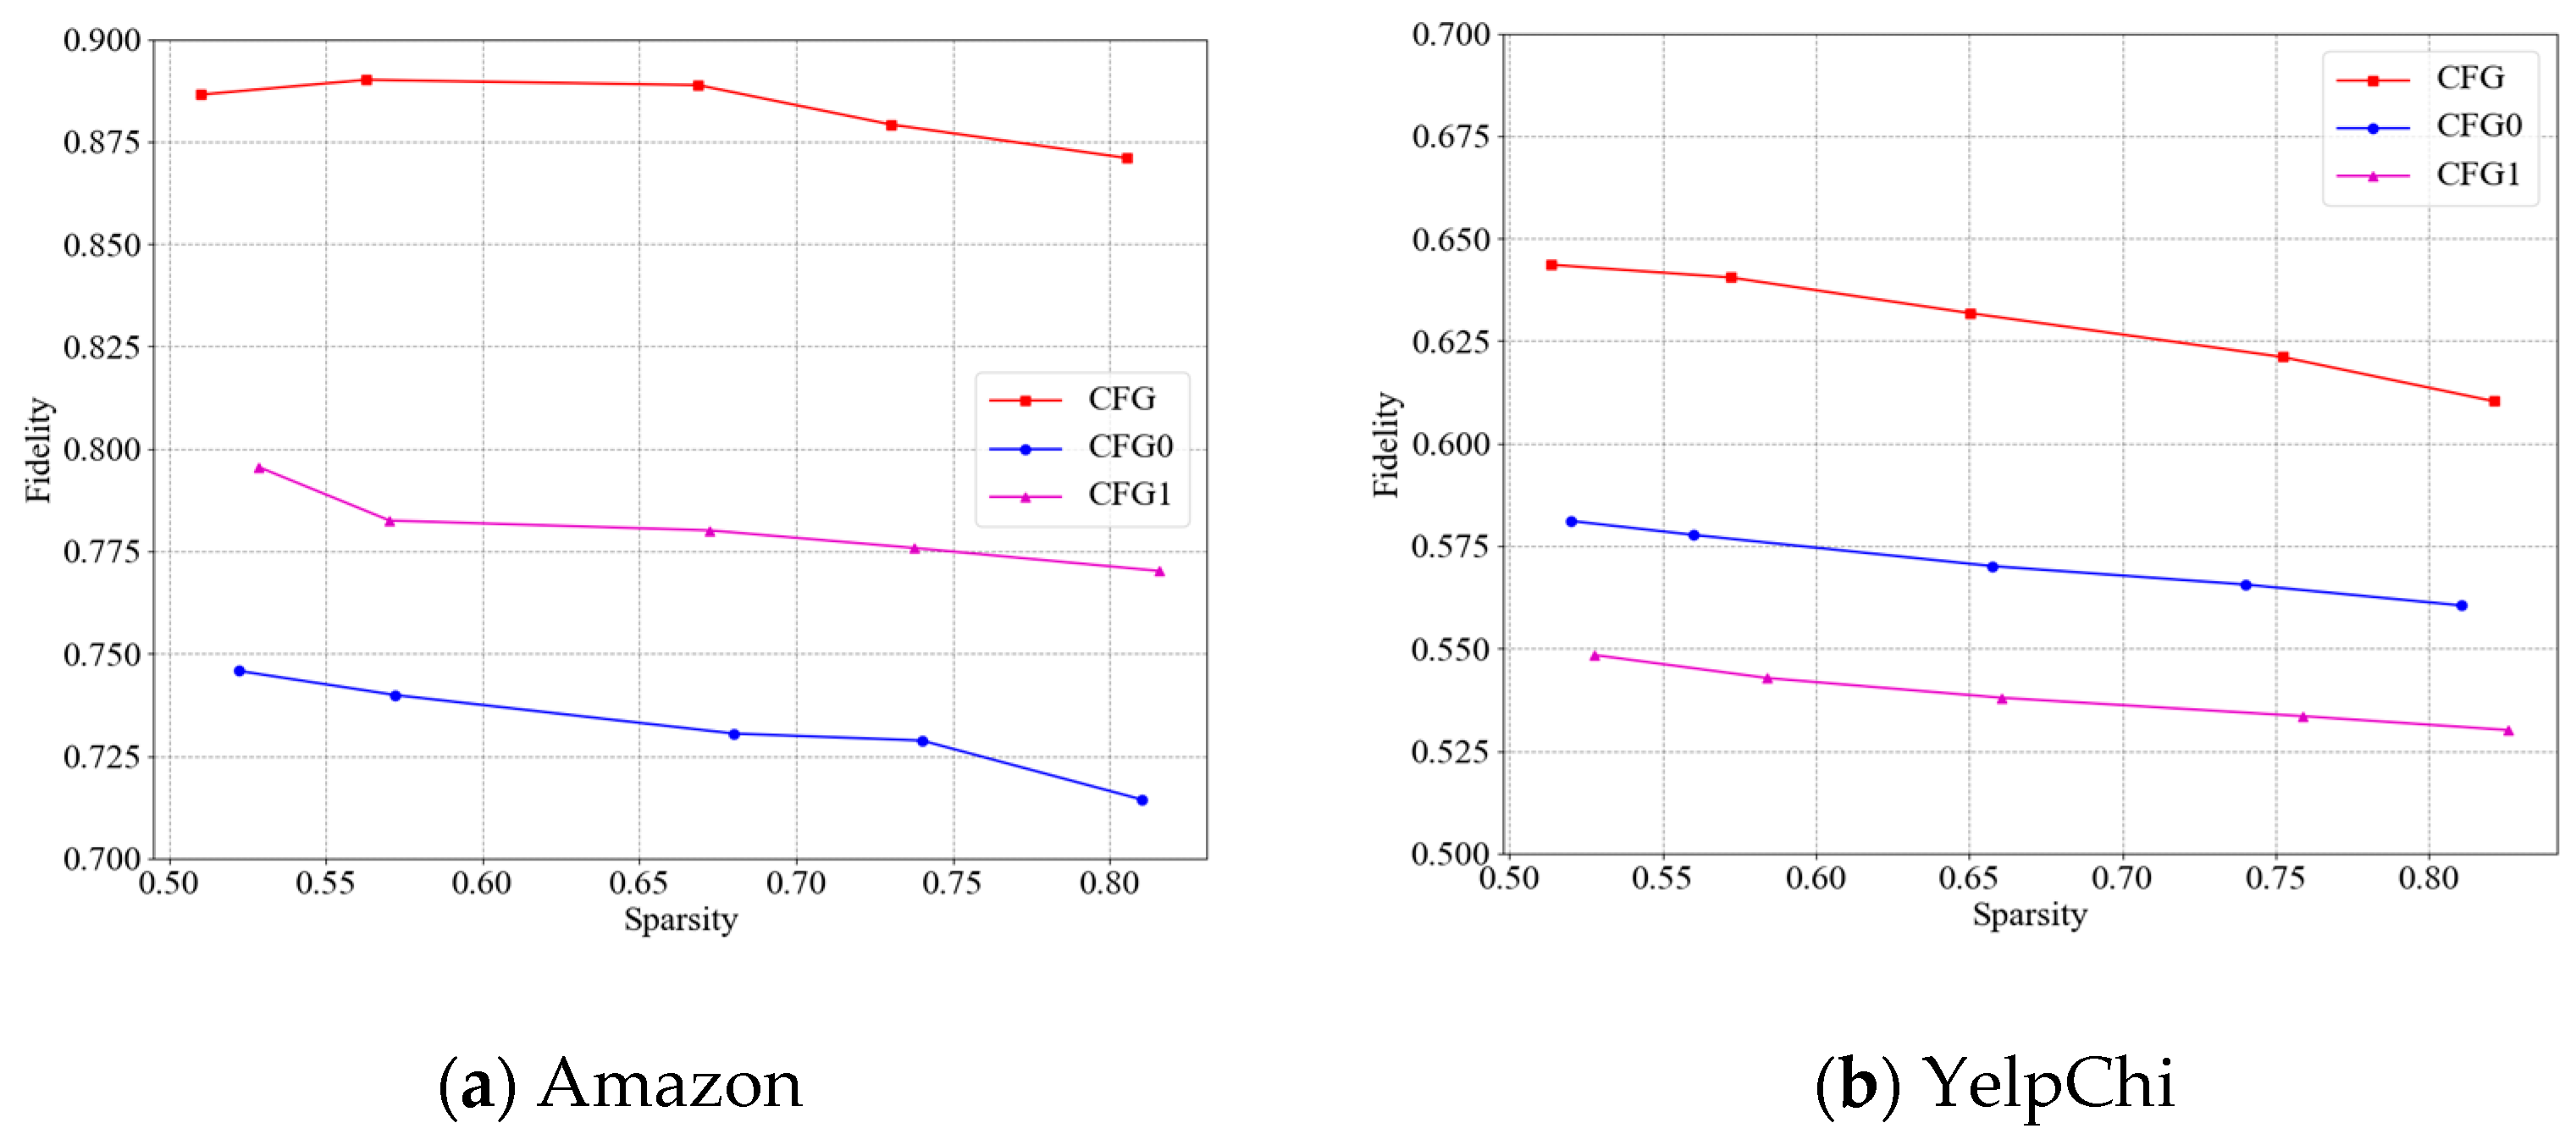
We conduct ablation experiments on the interpretation effect on two datasets (i.e., Amazon and YelpChi). Two different variant methods are as follows:
(1)
CFG0 replaces the counterfactual generative model with a Variational Autoencoder (VAE) [46]. CFG0 first uses a VAE to obtain the counterfactual groups and then compares the differences of detection results between the counterfactual groups and candidate groups to search the key subgraph structures for explaining the detection results.
(2)
CFG1 replaces the graph neural networks (GNNs) model in the generator with graph attention networks (GATs) [47]. CFG1 initially utilizes a counterfactual generation model that uses GAT as a generator to obtain counterfactual groups, and then compares the differences of detection results between the counterfactual groups and candidate groups to search the key subgraph structures for explaining the detection results.
Figure 9 shows the interpretation results of CFG and two variant methods. In accordance with Figure 9, we make two conclusions as follows:
(1)
CFG’s Fidelity is greater than that of CFG0 with diverse Sparsity on two datasets. The improvements of the Fidelity of CFG over CFG0 are around 21% on Amazon and 10% on YelpChi, respectively. This is because CFG uses a generative adversarial network as a counterfactual generation model, which can fully explore the causal relationships between candidate groups and detection results to obtain the counterfactual groups in accurately explaining the detection results.
(2)
CFG’s Fidelity is greater than that of CFG1 with diverse Sparsity on two datasets. The improvements of the Fidelity of CFG over CFG1 are around 13% on Amazon and 19% on YelpChi, respectively. This is because CFG uses a graph neural network as a generator, which can effectively learn and generate counterfactual groups that are completely opposite of the detection results of candidate groups, further improving the accuracy of interpretation.

5.7. Discussion

The collusive spamming on e-commerce platforms has produced plenty of fake reviews. Accurate detection and interpretation of collusive spammers can restrain collusive spamming behavior and enhance the credibility of consumers, which is of great significance to purify the evaluation environment on e-commerce platforms.
In this research, we propose a joint detection and interpretation framework, KDCFG, to detect and interpret review spammer groups. KDCFG can acquire outstanding detection and interpretation performance compared with the baseline methods. On the one hand, KDCFG designs a knowledge distillation-based detection model (KDRSGD). This structural design of the KDRSGD has two outstanding characteristics. Firstly, KDRSGD uses graph agglomerative hierarchical clustering to find candidate groups, which can mine closer user relationships from the suspicious user review relationship graph. Secondly, KDRSGD adopts a knowledge distillation-based detection model to detect review spammer groups, which can learn the more discriminative group vectors to improve the detection performance. The comparisons between P@k and R@k on the Amazon and three Yelp datasets (see Figure 2 and Figure 3) show that KDRSGD has a significant advantage compared with the five baseline approaches in detection performance. On the other hand, KDCFG designs a counterfactual generation model (CFG) to explain the detection results, which can accurately collect evidence for interpreting review spammer groups without a fixed structure. The comparisons of Fidelity under diverse Sparsity on the Amazon and three Yelp datasets (see Figure 4) show that CFG has a significant advantage compared with the five baseline approaches in terms of interpretation performance.
There are certain limitations that need to be solved in future work: Firstly, our method cannot support real-time data processing and lack consideration of the multiple spammer review modes pattern. Secondly, our method needs improvement in exploring causal relationships to enhance the interpretability of detection results. There are also several promising directions for future research and applications to help us develop an incremental version of our method to support real-time data processing. Examples include: (1) Incremental learning: By using incremental learning, gradually update the clustering results instead of recalculating the entire cluster each time. When new data arrives, only the similarity between the new data and the existing cluster centers is calculated, and the clustering structure is dynamically adjusted. (2) Sliding window mechanism: Use sliding windows to process real-time data streams, clustering only the data within the window. Data outside the window can be discarded or archived to reduce computational complexity. (3) Online learning and parallel computing: We can dynamically update the knowledge of student model in real-time data streams. When new data arrives, the teacher model generates soft labels, and the student model updates quickly through online learning. Utilizing GPU or distributed computing to accelerate the process of knowledge distillation. We can parallelize the reasoning process of teacher and student models to improve overall efficiency.

6. Conclusions and Future Work

We present an interpretable review spammer group detection method based on knowledge distillation and counterfactual generation (KDCFG). The specific conclusions are as follows:
(1)
We devise a graph agglomerative hierarchical clustering approach to obtain candidate groups. Our method obtains the suspicious user review relationship graph and learns the user node vector representations. A graph agglomerative hierarchical clustering method is designed to search the collusive user review relationships. The users with high similarity are continuously merged to discover candidate groups.
(2)
We propose an interpretable review spammer group detection method using knowledge distillation and counterfactual generation. Our method uses a knowledge distillation network consisting of a graph mask autoencoder and graph autoencoder to detect review spammer groups. Moreover, we adopt a counterfactual generation model to obtain the counterfactual groups and mine the important subgraph structures as interpretations.
The experiments verify the effectiveness of KDCFG. The improvements of Precision@1000 and the Fidelities under different Sparsity of our model over the state-of-the-art solutions are [13.37%, 6%] on Amazon, [72.63%, 7%] on YelpChi, [37.46%, 7%] on YelpNYC, and [18.83%, 6%] on YelpZip, respectively. KDCFG mainly focuses on the quality of candidate group vectors and the interpretable problem of the detection results. Our work has certain limitations in the detection performance under multiple spammer review patterns, and there are deficiencies in learning the causal relationships between input data and detection results. In future work, we will study methods that consider multiple possible spammer behavior to obtain high-quality candidate groups. Meanwhile, we will study the causal interpretation methods to interpret review spammer group detection results. Our plans for future applications include the following: We aim to develop an incremental version of the method to support real-time data processing. This would involve integrating online learning algorithms and optimizing the graph neural network for streaming data. Moreover, we will design a detection model for multiple spammer review modes to further improve the detection performance of the model

Author Contributions

C.H.: methodology, writing—original draft, software; Y.L.: validation, visualization; J.C.: investigation, formal analysis; F.Z.: conceptualization, writing—review and editing, project administration, funding acquisition, supervision. All authors have read and agreed to the published version of the manuscript.

Funding

This research was funded by the National Natural Science Foundation of China (No. 62072393) and Innovation Capability Improvement Plan Project of Hebei Province (No. 22567626H).

Data Availability Statement

The raw data supporting the conclusions of this article will be made available by the authors on request.

Conflicts of Interest

The authors declare that they have no conflicts of interest regarding the publication of this paper.

References

  1. Fei, G.; Mukherjee, A.; Liu, B.; Hsu, M.; Malu, C.; Riddhiman, G. Exploiting burstiness in reviews for review spammer detection. In Proceedings of the 7th International Conference on Weblogs and Social Media, Cambridge, MA, USA, 8–11 July 2013; pp. 175–184. [Google Scholar]
  2. Allahbakhsh, M.; Ignjatovic, A.; Benatallah, B.; Beheshti, S.; Bertino, E.; Foo, N. Collusion detection in online rating systems. Lect. Notes Comput. Sci. 2013, 7808, 196–207. [Google Scholar]
  3. Wang, Z.; Gu, S.; Zhao, X.; Xu, X. Graph-based review spammer group detection. Knowl. Inf. Systems. Syst. 2018, 55, 571–597. [Google Scholar] [CrossRef]
  4. Xu, G.; Hu, M.; Ma, C.; Daneshmand, M. GSCPM: CPM-based group spamming detection in online product reviews. In Proceedings of the 2019 IEEE International Conference on Communications, Shanghai, China, 20–24 May 2019; pp. 1–6. [Google Scholar]
  5. Zhang, F.; Hao, X.; Chao, J.; Yuan, S. Label propagation-based approach for detecting review spammer groups on e-commerce websites. Knowl Based Syst. 2020, 193, 105520. [Google Scholar] [CrossRef]
  6. Chao, J.; Zhao, C.; Zhang, F. Network embedding-based approach for detecting collusive spamming groups on e-commerce platforms. Secur. Commun. Networks. 2022, 2022, 4354086. [Google Scholar] [CrossRef]
  7. Shehnepoor, S.; Togneri, R.; Liu, W.; Bennamoun, M. Spatio-temporal graph representation learning for fraudster group detection. IEEE Trans. Neural Networks Learn. Sys. 2024, 35, 6628–6642. [Google Scholar] [CrossRef]
  8. Zhang, F.; Wu, J.; Zhang, P.; Ma, R.; Yu, H. Detecting collusive review spammers with heterogeneous graph attention network. Inf. Process. Manag. 2023, 60, 103282. [Google Scholar] [CrossRef]
  9. Zhang, F.; Yuan, S.; Wu, J.; Zhang, P.; Chao, J. Detecting collusive review spammers on e-commerce websites based on reinforcement learning and adversarial autoencoder. Expert Syst. Appl. 2022, 203, 117482. [Google Scholar] [CrossRef]
  10. Zhang, F.; Yuan, S.; Zhang, P.; Chao, J.; Yu, H. Detecting review spammer groups based on generative adversarial networks. Inf. Sci. 2022, 606, 819–836. [Google Scholar] [CrossRef]
  11. Baldassarre, F.; Azizpour, H. Explainability techniques for graph convolutional networks. In Proceedings of the 2019 Workshop on Learning and Reasoning with Graph-Structured Representations, Long Beach, CA, USA, 31 May 2019; pp. 2–4. [Google Scholar]
  12. Pope, P.E.; Kolouri, S.; Rostami, M.; Martin, C.E.; Hoffmann, H. Explainability methods for graph convolutional neural networks. In Proceedings of the 2019 IEEE/CVF Conference on Computer Vision and Pattern Recognition, Long Beach, CA, USA, 16–20 June 2019; pp. 10764–10773. [Google Scholar]
  13. Zheng, T.Y.; Wang, Q.; Shen, Y.; Ma, X.; Lin, X.T. High-resolution rectified gradient-based visual explanations for weakly supervised segmentation. Pattern Recognit. 2022, 129, 108724. [Google Scholar] [CrossRef]
  14. Zivkovic, T.; Nikolic, B.; Simic, V.; Pamucar, C.; Bacanin, N. Software defects prediction by metaheuristics tuned extreme gradient boosting and analysis based on Shapley Additive Explanations. Appl. Soft Comput. 2023, 146, 110659. [Google Scholar] [CrossRef]
  15. Schwarzenberg, R.; Hubner, M.; Harbecke, D.; Alt, C.; Hennig, L. Layerwise relevance visualization in convolutional text graph classifiers. In Proceedings of the EMNLP-IJCNLP 2019 Graph-Based Methods for Natural Language Processing, Hong Kong, China, 4 November 2019; pp. 58–62. [Google Scholar]
  16. Schnake, T.; Eberle, O.; Lederer, J.; Nakajima, S.; Schutt, K.T.; Mueller, K.R.; Montavon, G. Higher-order explanations of graph neural networks via relevant walks. IEEE Trans. Pattern Anal. Mach. Intell. 2022, 44, 7581–7596. [Google Scholar] [CrossRef] [PubMed]
  17. Feng, Q.; Liu, N.; Yang, F.; Tang, R.; Du, M.; Hu, X. Degree: Decomposition based explanation for graph neural networks. In Proceedings of the ICLR 2022 10th International Conference on Learning Representations, Online, 25–29 April 2022; pp. 1–19. [Google Scholar]
  18. Wu, P.; Zhao, X.; Ding, M.; Zheng, Y.; Cui, L.; Huang, T. Tensor ring decomposition-based model with interpretable gradient factors regularization for tensor completion. Knowl. Based Syst. 2023, 259, 110094. [Google Scholar] [CrossRef]
  19. Vu, M.N.; Thai, M.T. Pgm-explainer: Probabilistic graphical model explanations for graph neural networks. Adv. Neural Inf. Process. Syst. 2020, 33, 12225–12235. [Google Scholar]
  20. Zhu, X.; Wang, D.; Pedrycz, W.; Li, Z. Fuzzy Rule-Based Local Surrogate Models for Black-Box Model Explanation. IEEE Trans. Fuzzy Syst. 2023, 31, 2056–2064. [Google Scholar] [CrossRef]
  21. Holzinger, A.; Malle, B.; Saranti, A.; Pfeifer, B. Towards multi-modal causability with graph neural networks enabling information fusion for explainable AI. Inf. Fusion. 2021, 71, 28–37. [Google Scholar] [CrossRef]
  22. Li, X.; Xiong, H.; Li, X.; Zhang, X.; Liu, J.; Jiang, H.; Chen, Z.; Dou, Z. G-LIME: Statistical learning for local interpretations of deep neural networks using global priors. Artif. Intell. 2023, 314, 103823. [Google Scholar] [CrossRef]
  23. Yuan, H.; Yu, H.; Wang, J.; Li, K.; Ji, S. On explainability of graph neural networks via subgraph explorations. In Proceedings of the International Conference on Machine Learning, Online, 18–24 July 2021; pp. 12241–12252. [Google Scholar]
  24. Luo, D.; Cheng, W.; Xu, D.; Yu, W.; Zong, B.; Chen, H.; Zhang, X. Parameterized explainer for graph neural network. In Proceedings of the 34th Conference on Neural Information Processing Systems, Online, 6–12 December 2020; pp. 4–8. [Google Scholar]
  25. Tang, C.; Cui, Q.; Li, L.; Zhou, J. GINT: A Generative Interpretability method via perturbation in the latent space. Expert Syst. Appl. 2023, 232, 120570. [Google Scholar] [CrossRef]
  26. Arumugam, D.; Kiran, R. Interpreting denoising autoencoders with complex perturbation approach. Pattern Recognit. 2023, 136, 109212. [Google Scholar] [CrossRef]
  27. Manaskasemsak, B.; Chanmakho, C.; Klainongsuang, J.; Rungsawang, A. Opinion spam detection through user behavioral graph partitioning approach. In Proceedings of the 2019 3rd International Conference on Intelligent Systems, Male, Maldives, 23–24 March 2019; pp. 73–77. [Google Scholar]
  28. Wang, G.; Xie, S.; Liu, B.; Yu, P.S. Review graph based online store review spammer detection. In Proceedings of the IEEE 11th International Conference on Data Mining, Vancouver, BC, Canada, 11–14 December 2019; pp. 1242–1247. [Google Scholar]
  29. Hang, J.; Hong, Z.; Feng, X.; Wang, G.; Yang, G.; Li, F.; Song, X.; Zhang, D. Paths2pair: Meta-path based link prediction in billion-scale commercial heterogeneous graphs. In Proceedings of the 30th ACM SIGKDD Conference on Knowledge Discovery and Data Mining, Barcelona, Spain, 25–29 August 2024; pp. 5082–5092. [Google Scholar]
  30. Kim, J.; Park, J.; Low, C.Y.; Teoh, A.B.J. Cancellable biometrics based on the index-of-maximum hashing with random sparse binary encoding. Multimed. Tools Appl. 2024, 83, 59915–59942. [Google Scholar] [CrossRef]
  31. Hafeezallah, A.; Al-Dhamari, A.; Abu-Bakar, S.A.R. Motion segmentation using Ward’s hierarchical agglomerative clustering for crowd disaster risk mitigation. Int. J. Disast. Risk Reduct. 2024, 102, 104262. [Google Scholar] [CrossRef]
  32. Hou, Z.Y.; Liu, X.; Cen, Y.K.; Dong, Y.X.; Yang, H.X.; Wang, C.J.; Tang, J. GraphMAE: Self-Supervised Masked Graph Autoencoders. In Proceedings of the ACM SIGKDD International Conference on Knowledge Discovery and Data Mining, Washington, DC, USA, 14–18 August 2022; pp. 594–604. [Google Scholar]
  33. Chen, X.; Ding, M.; Wang, X.; Xin, Y.; Mo, S.; Wang, Y.; Han, S.; Luo, P.; Zeng, G.; Wang, J. Context autoencoder for self-supervised representation learning. Int. J. Comput. Vis. 2024, 132, 208–223. [Google Scholar] [CrossRef]
  34. Kingma, D.P.; Ba, J. Adam: A method for stochastic optimization. In Proceedings of the 3rd International Conference on Learning Representations, San Diego, CA, USA, 7–9 May 2015; pp. 1–5. [Google Scholar]
  35. Xu, C.; Zhang, J.; Long, C.; Chang, K. Uncovering collusive review spammers in Chinese review websites. In Proceedings of the 22nd ACM International Conference on Conference on Information & Knowledge Management, San Francisco, CA, USA, 27 October–1 November 2013; pp. 979–988. [Google Scholar]
  36. Mukherjee, A.; Venkataraman, V.; Liu, B.; Glance, N. What yelp fake review filter might be doing? In Proceedings of the 7th International Conference on Weblogs and Social Media, Cambridge, MA, USA, 8–11 July 2013; pp. 409–418. [Google Scholar]
  37. Rayana, S.; Akoglu, L. Collective opinion spam detection: Bridging review networks and metadata. In Proceedings of the 21st ACM SIGKDD International Conference on Knowledge Discovery and Data Mining, Sydney, NSW, Australia, 10–13 August 2015; pp. 985–994. [Google Scholar]
  38. Zhang, Y.; Tan, Y.; Zhang, M.; Liu, L.; Tal-Sang, C.; Ma, S. Catch the black sheep: Unified framework for shilling attack detection based on fraudulent action propagation. In Proceedings of the 24th International Joint Conference on Artificial Intelligence, Buenos Aires, Argentina, 25–31 July 2015; pp. 2408–2414. [Google Scholar]
  39. Yuan, H.; Yu, H.Y.; Gui, S.R.; Ji, S.W. Explainability in graph neural networks: A taxonomic survey. IEEE Trans. Pattern Anal. Mach. Intell. 2023, 45, 5782–5799. [Google Scholar] [CrossRef] [PubMed]
  40. Ji, S.; Zhang, Q.; Li, J.; Chiu, D.K.W.; Xu, S.; Yi, L.; Gong, M. A burst-based unsupervised method for detecting review spammer groups. Inf. Sci. 2020, 536, 454–469. [Google Scholar] [CrossRef]
  41. Shehnepoor, S.; Togneri, R.; Liu, W.; Bennamoun, M. HIN-RNN: A graph representation learning neural network for fraudster group detection with no handcrafted features. IEEE Trans. Neural Netw. Learn. Syst. 2023, 34, 4153–4166. [Google Scholar] [CrossRef]
  42. Ying, Z.; Bourgeois, D.; You, J.; Zitnik, M.; Leskovec, J. GNNExplainer: Generating explanations for graph neural networks. In Proceedings of the 33rd Annual Conference on Neural Information Processing Systems, Vancouver, BC, Canada, 8–14 December 2019; pp. 9244–9255. [Google Scholar]
  43. Sui, Y.; Wang, X.; Wu, J.; Lin, M.; He, X.; Chua, T. Causal attention for interpretable and generalizable graph classification. In Proceedings of the 28th ACM SIGKDD Conference on Knowledge Discovery and Data Mining, Washington, DC, USA, 14–18 August 2022; pp. 1696–1705. [Google Scholar]
  44. Zhai, P.Y.; Yang, Y.W.; Zhang, C.J. Causality based CTR prediction using graph neural networks. Inf. Process. Manag. 2023, 60, 103137. [Google Scholar] [CrossRef]
  45. Shi, Y.; Dong, Y.; Tan, Q.; Li, J.; Liu, N. GiGaMAE: Generalizable graph masked autoencoder via collaborative latent space reconstruction. In Proceedings of the 32nd ACM International Conference on Information and Knowledge Management, Birmingham, UK, 21–25 October 2023; pp. 2259–2269. [Google Scholar]
  46. Akkem, Y.; Biswas, S.K.; Varanasi, A. A comprehensive review of synthetic data generation in smart farming by using variational autoencoder and generative adversarial network. Eng. Appl. Artif. Intell. 2024, 131, 107881. [Google Scholar] [CrossRef]
  47. Huang, P.; Guo, J.; Liu, S.; Corman, F. Explainable train delay propagation: A graph attention network approach. Transp. Res. Part E Logist. Transp. Rev. 2024, 184, 103457. [Google Scholar] [CrossRef]
Figure 1. The framework of KDCFG. (a) A graph agglomerative hierarchical clustering approach to identify candidate groups in the suspicious user review relationship graph. (b) A knowledge distillation model to detect review spammer groups. (c) A counterfactual generation model to explain the detection results.
Electronics 14 01086 g001
Figure 2. Comparison of P@k for six approaches on the four datasets.
Electronics 14 01086 g002
Figure 3. Comparison of R@k for six approaches on the four datasets.
Electronics 14 01086 g003aElectronics 14 01086 g003b
Figure 4. Comparison of interpretation effect of six methods on the four datasets.
Electronics 14 01086 g004
Figure 5. The visualization of interpretation results of CFG on the four datasets. Note that a red circle represents a spammer, a green circle represents a normal user, a solid black line denotes the existence of edge relationships between nodes, and a dashed black line denotes the non-existence of edge relationships between nodes.
Electronics 14 01086 g005
Figure 6. The effect of parameters of KDRSGD on F1-measure@1000 on the four datasets.
Electronics 14 01086 g006
Figure 7. The effect of parameter on Fidelities with diverse Sparsity on the four datasets.
Electronics 14 01086 g007
Figure 8. Different variants of F1-measure@k on two datasets.
Electronics 14 01086 g008
Figure 9. Different variants of Fidelities under different Sparsity on two datasets.
Electronics 14 01086 g009
Table 1. The difference between existing methods and our method.
Aspect of DifferencesExisting MethodsOur Proposed Method
Prior knowledgeThe conventional methods need prior knowledge to detect review spammer groupsOur proposed method constructs a deep learning-based model to detect review spammer groups, avoiding the use of prior knowledge
Extract handcraft indicatorsThe conventional methods rely on handcraft indicators to detect spammer groupsOur proposed method designs a knowledge distillation network and does not require extracting handcraft indicators
Discriminability of candidate group featuresThe existing methods for detecting review spammer groups use max or mean methods to obtain group features, ignoring the discriminative power of group featuresOur proposed method designs a graph masked autoencoder as the teacher mechanism to learn the discriminative candidate group features
Interpretability of detection modelMost deep learning-based detection methods are deficient in providing an interpretation for their detection resultsOur proposed method designs a counterfactual generation model to interpret the detection results
The influence of noise features during the explanation processMost interpretation methods are easily affected by noise features and graph structures.KDCFG employs a counterfactual generation method to explain the detection results, which can mitigate the influence of interfering features on explanation performance
Interpreting graph data without fixed structuresExisting interpretation methods aim at the interpretation of image, text, and molecular graph classifications, which are not suitable for interpreting review spammer groups without fixed structureOur proposed method designs a counterfactual generation model to interpret review spammer groups without fixed structure
Table 2. Notations and descriptions.
NotationsDescriptions
GSuspicious user review relationship graph
P, U, E, VProduct set, user set, edge set, user node set
AThe suspicious user review relationship matrix
XUser feature matrix
SSimilarity matrix
X ¯ Masked feature matrix
A ¯ Masked adjacency matrix
e v ¯ i , h v ¯ i Encoding   and   decoding   feature   of   node   v ¯ i  of teacher mechanism
o v ¯ i , p v ¯ i Encoding   and   decoding   feature   of   node   v ¯ i  of student mechanism
q C i The classification probability of candidate group Ci
Ctrain, CtestTraining set and test set of candidate groups
Disclaimer/Publisher’s Note: The statements, opinions and data contained in all publications are solely those of the individual author(s) and contributor(s) and not of MDPI and/or the editor(s). MDPI and/or the editor(s) disclaim responsibility for any injury to people or property resulting from any ideas, methods, instructions or products referred to in the content.

