Article

User Behavior on Value Co-Creation in Human–Computer Interaction: A Meta-Analysis and Research Synthesis

1
School of Humanities and Social Science, University of Science and Technology Beijing, Beijing 100083, China
2
School of Public Policy and Management, Tsinghua University, Beijing 100084, China
*
Author to whom correspondence should be addressed.
Electronics 2025, 14(6), 1071; https://doi.org/10.3390/electronics14061071
Submission received: 21 January 2025 / Revised: 26 February 2025 / Accepted: 5 March 2025 / Published: 7 March 2025

Abstract

:
Value co-creation in online communities refers to a process in which all participants within a platform’s ecosystem exchange and integrate resources while engaging in mutually beneficial interactive processes to generate perceived value-in-use. User behavior plays a crucial role in influencing value co-creation in human–computer interaction. However, existing research contains controversies, and there is a lack of comprehensive studies exploring which factors of user behavior influence it and the mechanisms through which they operate. This paper employs meta-analysis to examine the factors and mechanisms based on 42 studies from 2006 to 2023 with a sample size of 30,016. It examines the relationships at the individual, interaction, and environment layers and explores moderating effects through subgroup analysis. The results reveal a positive overall effect between user behavior and value co-creation performance. Factors including self-efficacy, social identity, enjoyment, and belonging (individual layer); information support, social interaction, trust, and reciprocity (interaction layer); as well as shared values, incentives, community culture, and subjective norms (environment layer) positively influence value co-creation. The moderating effect of situational and measurement factors indicates that Chinese communities and monocultural environments have more significant effects than international and multicultural ones, while community type is not significant. Structural equation models and subjective collaboration willingness have a stronger moderating effect than linear regression and objective behavior, which constitutes a counterintuitive finding. This study enhances theoretical research on user behavior and provides insights for managing value co-creation in human–computer interaction.

1. Introduction

With the rapid development of information technology and computer science, human–computer interaction (HCI) has become an interdisciplinary field aimed at optimizing the interaction between human users and computer systems to improve user experience, operational efficiency, and system usability. HCI is not only about technology and interface design but also an integrative issue involving psychology, sociology and behavior science. By integrating psychological factors, such as user cognition and emotions, HCI can optimize user experience and enhance interaction efficiency. For example, based on the multimedia teaching system from the perspective of psychology through HCI, the results showed that multimedia teaching and students’ learning effect improved [1]. By utilizing artificial intelligence and HCI technology to construct a robot-assisted talent training model, students’ learning confidence and collaboration skills were significantly enhanced [2]. Some scholars are also gradually paying attention to the study of the relationship between HCI and sociology. Rezaev and Tregubova argue that sociologists should not focus solely on AI agents, as the introduction of new technologies is merely an environmental factor influencing the evolution of human relationships, while new forms of relations, interactions, and interdependencies are the core elements that shape society [3]. Fairness [4], trust [5], and anthropomorphism [6] are also important in interaction with AI.
With the rapid expansion of the internet and virtual platforms, user behavior has become increasingly influential in shaping value co-creation in HCI. User behavior primarily emphasizes collaborative actions within virtual communities. Value co-creation in online communities refers to a process in which all participants within the platform ecosystem exchange and integrate resources while engaging in mutually beneficial interactive processes to generate perceived value-in-use [7]. Key activities of this process include knowledge sharing [8] and the development of new ideas and solutions [9]. The core significance of HCI lies in achieving value co-creation. Because existing research suggests that communication technology and IT-mediated interactive platforms serve as effective channels at the technological level, facilitating the flow of users’ operant resources to support value co-creation through resource exchange and integration [10].
Existing studies have explored the relationship between user behavior and value co-creation in HCI, yet there are still several research limitations. On the one hand, there are controversies surrounding it. One view holds that user behavior has a positive impact on the value co-creation of virtual communities. For example, Zamiri and Esmaeili [11] found that knowledge sharing in online community is very helpful in problem-solving and innovation. Based on collective expertise, novel solutions can be created, and challenges can be solved more effectively. Beck et al. [12] found that open and collaborative practices in science is a whole process of producing and disseminating new insights and innovation, allowing to create more impactful knowledge in the world. Another view holds that user behavior has a negative impact on the value co-creation of virtual communities, which is mainly reflected in the unclear incentive mechanism, the phenomenon of “free riding”, the uneven distribution of resources and the complexity of the governance structure. For example, Liang et al. [13] provided support that the positive association between intrinsic motivation and task effort is reduced when a high level of extrinsic incentives is present. Zhang et al. [14] found that there are differences between volunteer and paid developers. Paid developers tend to contribute more than volunteers in open-source software communities, which means that the presence or absence of a salary will also affect member contributions.
On the other hand, most analyses focus on the micro and macro layers, while the meso-layer perspective remains underexplored. Tan [15] indicates that perspective of users and communities are the two influencing aspects on value co-creation. From the perspective of users, their interaction behaviors such as help-seeking and social interaction have significant impact on value co-creation [16]. Users’ sense of belonging can also affect value co-creation behavior [17]. From the perspective of the community, incentives and culture can improve the value co-creation [18] and supportive, fair, and ethical climate of communities are important as well [19].
It is evident that existing research on the impact of user behavior on value co-creation in HCI remains relatively fragmented, lacking a systematic and holistic perspective. There is no clear consensus on the comprehensive set of factors across different levels that influence value co-creation among virtual community members, nor on whether specific moderating variables play a critical role in shaping this relationship. Given these research gaps, this study is well-suited for a meta-analysis to conduct a comprehensive quantitative synthesis.
Compared with general descriptive synthesis methods, meta-analysis possesses two distinct advantages. First, it effectively integrates the strengths of both qualitative and quantitative analysis. Traditional literature review methods are primarily narrative in nature and lack the ability to statistically correct individual studies, which may lead to biased or even erroneous conclusions [20]. In contrast, meta-analysis systematically incorporates findings from multiple independent studies, employing rigorous literature retrieval and statistical techniques to quantify research outcomes through effect size measurements. By standardizing diverse research results, meta-analysis provides a robust statistical foundation that enhances the accuracy and reliability of conclusions. Second, meta-analysis results exhibit greater generalizability. It is recognized as a “more formal approach to synthesizing published research findings” [21] and has been widely applied across disciplines such as medicine, education, psychology, and management. Given that research outcomes are often influenced by factors such as study perspectives, methodological differences, researcher subjectivity, and social desirability bias, even studies addressing the same topic may yield conflicting conclusions. The key advantage of meta-analysis lies in its ability to integrate disparate research findings within a unified analytical framework, extract common effects across studies, and derive comprehensive conclusions regarding overall effect sizes. Within this context, this study aims to answer the following research questions:
(1)
Which factors of user behavior influence value co-creation in HCI?
(2)
Which factors moderate the relationship between user behavior and value co-creation in HCI?
In terms of theoretical significance, it aims to clarify the existing literature’s controversial issues while significantly enriching and expanding research on user behavior within the context of HCI. The findings reveal a positive overall effect between user behavior and value co-creation performance. Specifically, factors across micro-individual layer, meso-interaction layer, and macro-environment layer positively influence value co-creation. Furthermore, the moderating effects of situational and measurement factors, encompassing five groups of moderating variables, regulate the relationship between user behavior and value co-creation. In terms of practical significance, this study aims to provide valuable insights for various stakeholders, including virtual community designers, online community operators, and policymakers in the digital economy. By identifying and analyzing the core influencing factors of user behavior among community members, this research is helpful to enhance the operational efficiency of virtual communities, promote the platform’s design, and optimize value co-creation in HCI.

2. Materials and Methods

2.1. Meta-Analytic Procedures

This study employs Comprehensive Meta-Analysis (CMA) 3.0 to conduct a systematic meta-analysis. The statistical procedures include the following six steps. First, data collection and sample selection (Section 2.2). A structured search strategy was applied across major academic databases, and data collection was conducted using predefined search formulas. Additionally, manual verification by the research team ensured the accuracy and comprehensiveness of the selected sample literature. Second, data extraction and coding (Section 2.3). Following standardized data extraction protocols, all relevant variables were coded systematically before being entered into the meta-analysis software. This process ensured consistency and reliability in effect size estimation. Third, publication bias test (Section 3.1). A preliminary assessment of sample quality was conducted using Funnel Plots, followed by Begg’s test and Fail-safe N test for a more quantitative evaluation of potential publication bias. These tests ensured the robustness of the effect size estimates and minimized the risk of overestimating results due to selective reporting. Fourth, heterogeneity test (Section 3.2). To determine whether a fixed-effects model or random-effects model should be applied, Q-test and I2 statistics were used to measure heterogeneity across studies. A significant Q-value or high I2 indicated substantial heterogeneity, warranting the use of the random-effects model. Additionally, this step identified whether potential moderating variables influenced the relationship between user behavior and value co-creation in HCI. Fifth, effect size estimation and moderation analysis (Section 3.3). Using the random-effects model, the effect size (correlation coefficient r) and 95% confidence intervals were calculated to assess the significance of relationships. For subgroup analysis, effect sizes across different subgroups were compared, and Q-tests were conducted to determine whether inter-group differences were statistically significant. Sixth, robustness checks (Section 3.4). A leave-one-out sensitivity analysis was conducted to assess the stability of the results. This method systematically removes one study at a time to evaluate whether the overall conclusions are driven by any single study, ensuring the reliability of the findings.

2.2. Data Collection and Sample Selection

This study adopts a rigorous multi-step data collection and selection process to ensure the quality and reliability of the meta-analysis. The process involves systematic keyword searches, database filtering, manual screening, and multiple rounds of verification based on existing research [22].
The first step involved conducting systematic keyword searches in the Web of Science (WoS) database and the China National Knowledge Network (CNKI) database to collect the relevant literature. The search terms included “virtual community”, “IT community”, “network community”, “Internet community”, “online community”, “open innovation digital community”, “digital innovation community”, and other relevant terms. The initial search identified 16,715 articles, including 10,550 English and 6165 Chinese articles.
The second step focused on filtering high-quality literature from key management journals to ensure the sample’s academic rigor. For the English-language literature, this study specifically searched high-impact journals indexed in UTD24, FT50, and SSCI, leading to a selection of 777 English articles. For the Chinese-language literature, we reviewed 36 CSSCI management journals and 30 top journals recognized by the National Natural Science Foundation of China (NSFC), resulting in 204 articles from 49 Chinese journals after removing duplicates. A total of 981 articles were retrieved through the journal search.
The third step refined the selection by focusing on quantitative empirical studies. Since this meta-analysis relies on statistical synthesis, we filtered the literature based on methodology by searching for terms such as “quantitative”, “empirical”, “quantitative empirical”, and “research hypothesis”. This step reduced the selection to 362 articles including 218 English and 144 Chinese articles.
The fourth step ensured thematic alignment by refining the research focus. This study centers on analyzing the factors influencing value co-creation performance in virtual communities. We selected papers addressing themes such as “cooperation”, “collaboration”, “union”, “alliance”, “reciprocity”, “complementary collaboration”, “joint development”, “knowledge sharing”, and “collective intelligence”. After this refinement, 276 articles including 182 English and 94 Chinese articles remained.
Given that search algorithms and keyword-based retrieval methods may introduce systematic errors, a secondary manual screening was conducted to ensure sample quality. To eliminate potential biases and inconsistencies, we implemented a double-blind review process, where independent researchers cross-verified each paper. This process was further refined through three rounds of expert discussions with domain experts, ensuring objectivity and consistency. The final selection of papers was confirmed under the supervision of a professor. This study follows established scientific protocols for literature screening in existing quantitative meta-analysis [23]. Based on best practices, the following four filtering criteria were applied in the second screening phase. (1) Thematic relevance: The selected studies must investigate user behavior and value co-creation in HCI. Papers focusing on offline collaborations were excluded. (2) Methodological rigor: Only quantitative empirical research was retained. Studies relying on qualitative methods, such as grounded theory, literature reviews, and case studies, were excluded. (3) Availability of empirical data: Meta-analysis requires specific numerical data. Thus, studies lacking information such as sample size, correlation coefficients, effect sizes, or regression coefficients were excluded. (4) Sample independence: To prevent data redundancy, papers using the same dataset were carefully checked. In cases where multiple papers analyzed the same dataset, the earliest published study was retained. After applying the above systematic filtering procedures, a total of 42 high-quality studies (32 English and 10 Chinese) were selected for the meta-analysis. The data collection and sample selection are shown in Figure 1.

2.3. Data Extraction and Coding

Following the final screening of the sample literature, the data needed to be sorted and extracted. The data extraction and coding principles for this study were completed based on the previous research [24]. First, data standardization was conducted, which involved converting the information from the 42 selected studies into encoded data that could be recognized by meta-analysis software. The data that needed to be organized included the reference number, first author, publication time, independent sample size, independent variable, dependent variable, mediating variable, moderating variable, original effect size and type, and converted effect value. Since different articles deliver different effect values, given that some studies only report statistical measures such as t-values, F-values, d-values, and β-values, these statistics need to be converted into a unified effect size—correlation coefficient r. After conversion, the correlation coefficients r, sample size, and variable codes are input into the CMA 3.0 meta-analysis software. To ensure data stability, the CMA 3.0 software performs Fisher’s Z transformation on the correlation coefficient r, using the transformed correlation coefficient rz as the effect size for analysis [25].
Second, key variable consolidation and effect size summarization were performed. Since the two rounds of data cleaning ensured that all 42 selected studies focused on the relationship between user behavior and value co-creation in HCI, it was possible to confirm that the dependent variable remained consistent across all studies. Although the terminology for dependent variables varied slightly among studies, their conceptual meaning was unified, all reflecting the essence of value co-creation, such as knowledge-sharing performance or collaborative performance. For independent variables, all variables from the 42 studies were extracted. Given that the same independent variable may be labeled differently across different studies, variable consolidation was carried out to standardize synonymous variables under a unified naming convention. For instance, “user trust” and “trust” were merged under the category of “trust” to maintain consistency. After variable standardization, a total of 166 independent variables were identified across the 42 studies, with a combined sample size of 224,354, representing the cumulative sample from these studies.
Third, effect size confirmation. Although 166 independent variables had been extracted with a total sample size of 224,354, the data could yet be directly used for meta-analysis. The reason lies in the fact that among the 166 extracted effect sizes, some appear only once or twice. If a variable appeared only 1–2 times in a meta-analysis, its effect size may have failed to form a reliable confidence interval, leading to unstable analytical results. Therefore, it was recommended that variables included in a meta-analysis should be supported by at least three independent studies to mitigate the impact of extreme values from individual studies on the overall conclusions. According to existing research [26], this study included only independent variables that appeared at least three times in the final meta-analysis. This ensured the statistical robustness and interpretability of the analytical results. Finally, a total of 69 effect values with an independent sample size of 30,016 were used as the screening sample data for this study, representing the influence of the variables of user behavior on value co-creation in HCI.
For the 69 effect values of user behavior, they can be divided into three layers according to the factors: the individual layer, the interaction layer, and the environment layer. The individual layer mainly refers to the micro aspect of the virtual community, emphasizing the psychological characteristics of each subject. Based on the coding, we classified the individual level into four dimensions: self-efficacy, social identity, enjoyment and sense of belonging. According to the coding analysis of each variable, the number of effect values at the individual layer was 27, with a sample size of 9072. Among these, the number of self-efficacy effect values was 9, with a sample size of 3083; the number of social identity effect values was 8, with a sample size of 2394; the number of enjoyment effect values was 6, with a sample size of 2415; and the number of sense of belonging effect values was 4, with a sample size of 1180.
The interaction layer mainly refers to the meso aspect of virtual communities, emphasizing the interaction between various subjects. Based on the coding, we classified the interaction level into four dimensions: information support, social interaction, trust and reciprocity. According to the coding analysis of each variable, the number of effect values at the interaction layer was 24, with a sample size of 11,376. Among these, the number of information support effect values was 7, with a sample size of 4888; the number of social interaction effect values was 6, with a sample size of 2107; the number of trust effect values was 6, with a sample size of 2368; and the number of reciprocity effect values was 5, with a sample size of 2013.
The environment layer mainly refers to the macro aspect of virtual communities, emphasizing the influence of the external environment on individuals and their interactions. Based on the coding, we classified the environment level into four dimensions: shared values, incentives, community culture, and subjective norms. The number of effect values at the environment layer was 18, with a sample size of 9568. Among these, the number of shared values effect values was 6, with a sample size of 2147; the number of community incentives effect values was 4, with a sample size of 4066; the number of community culture effect values was 4, with a sample size of 1257; and the number of subjective norm effect sizes was 4, with a sample size of 2098.

3. Results

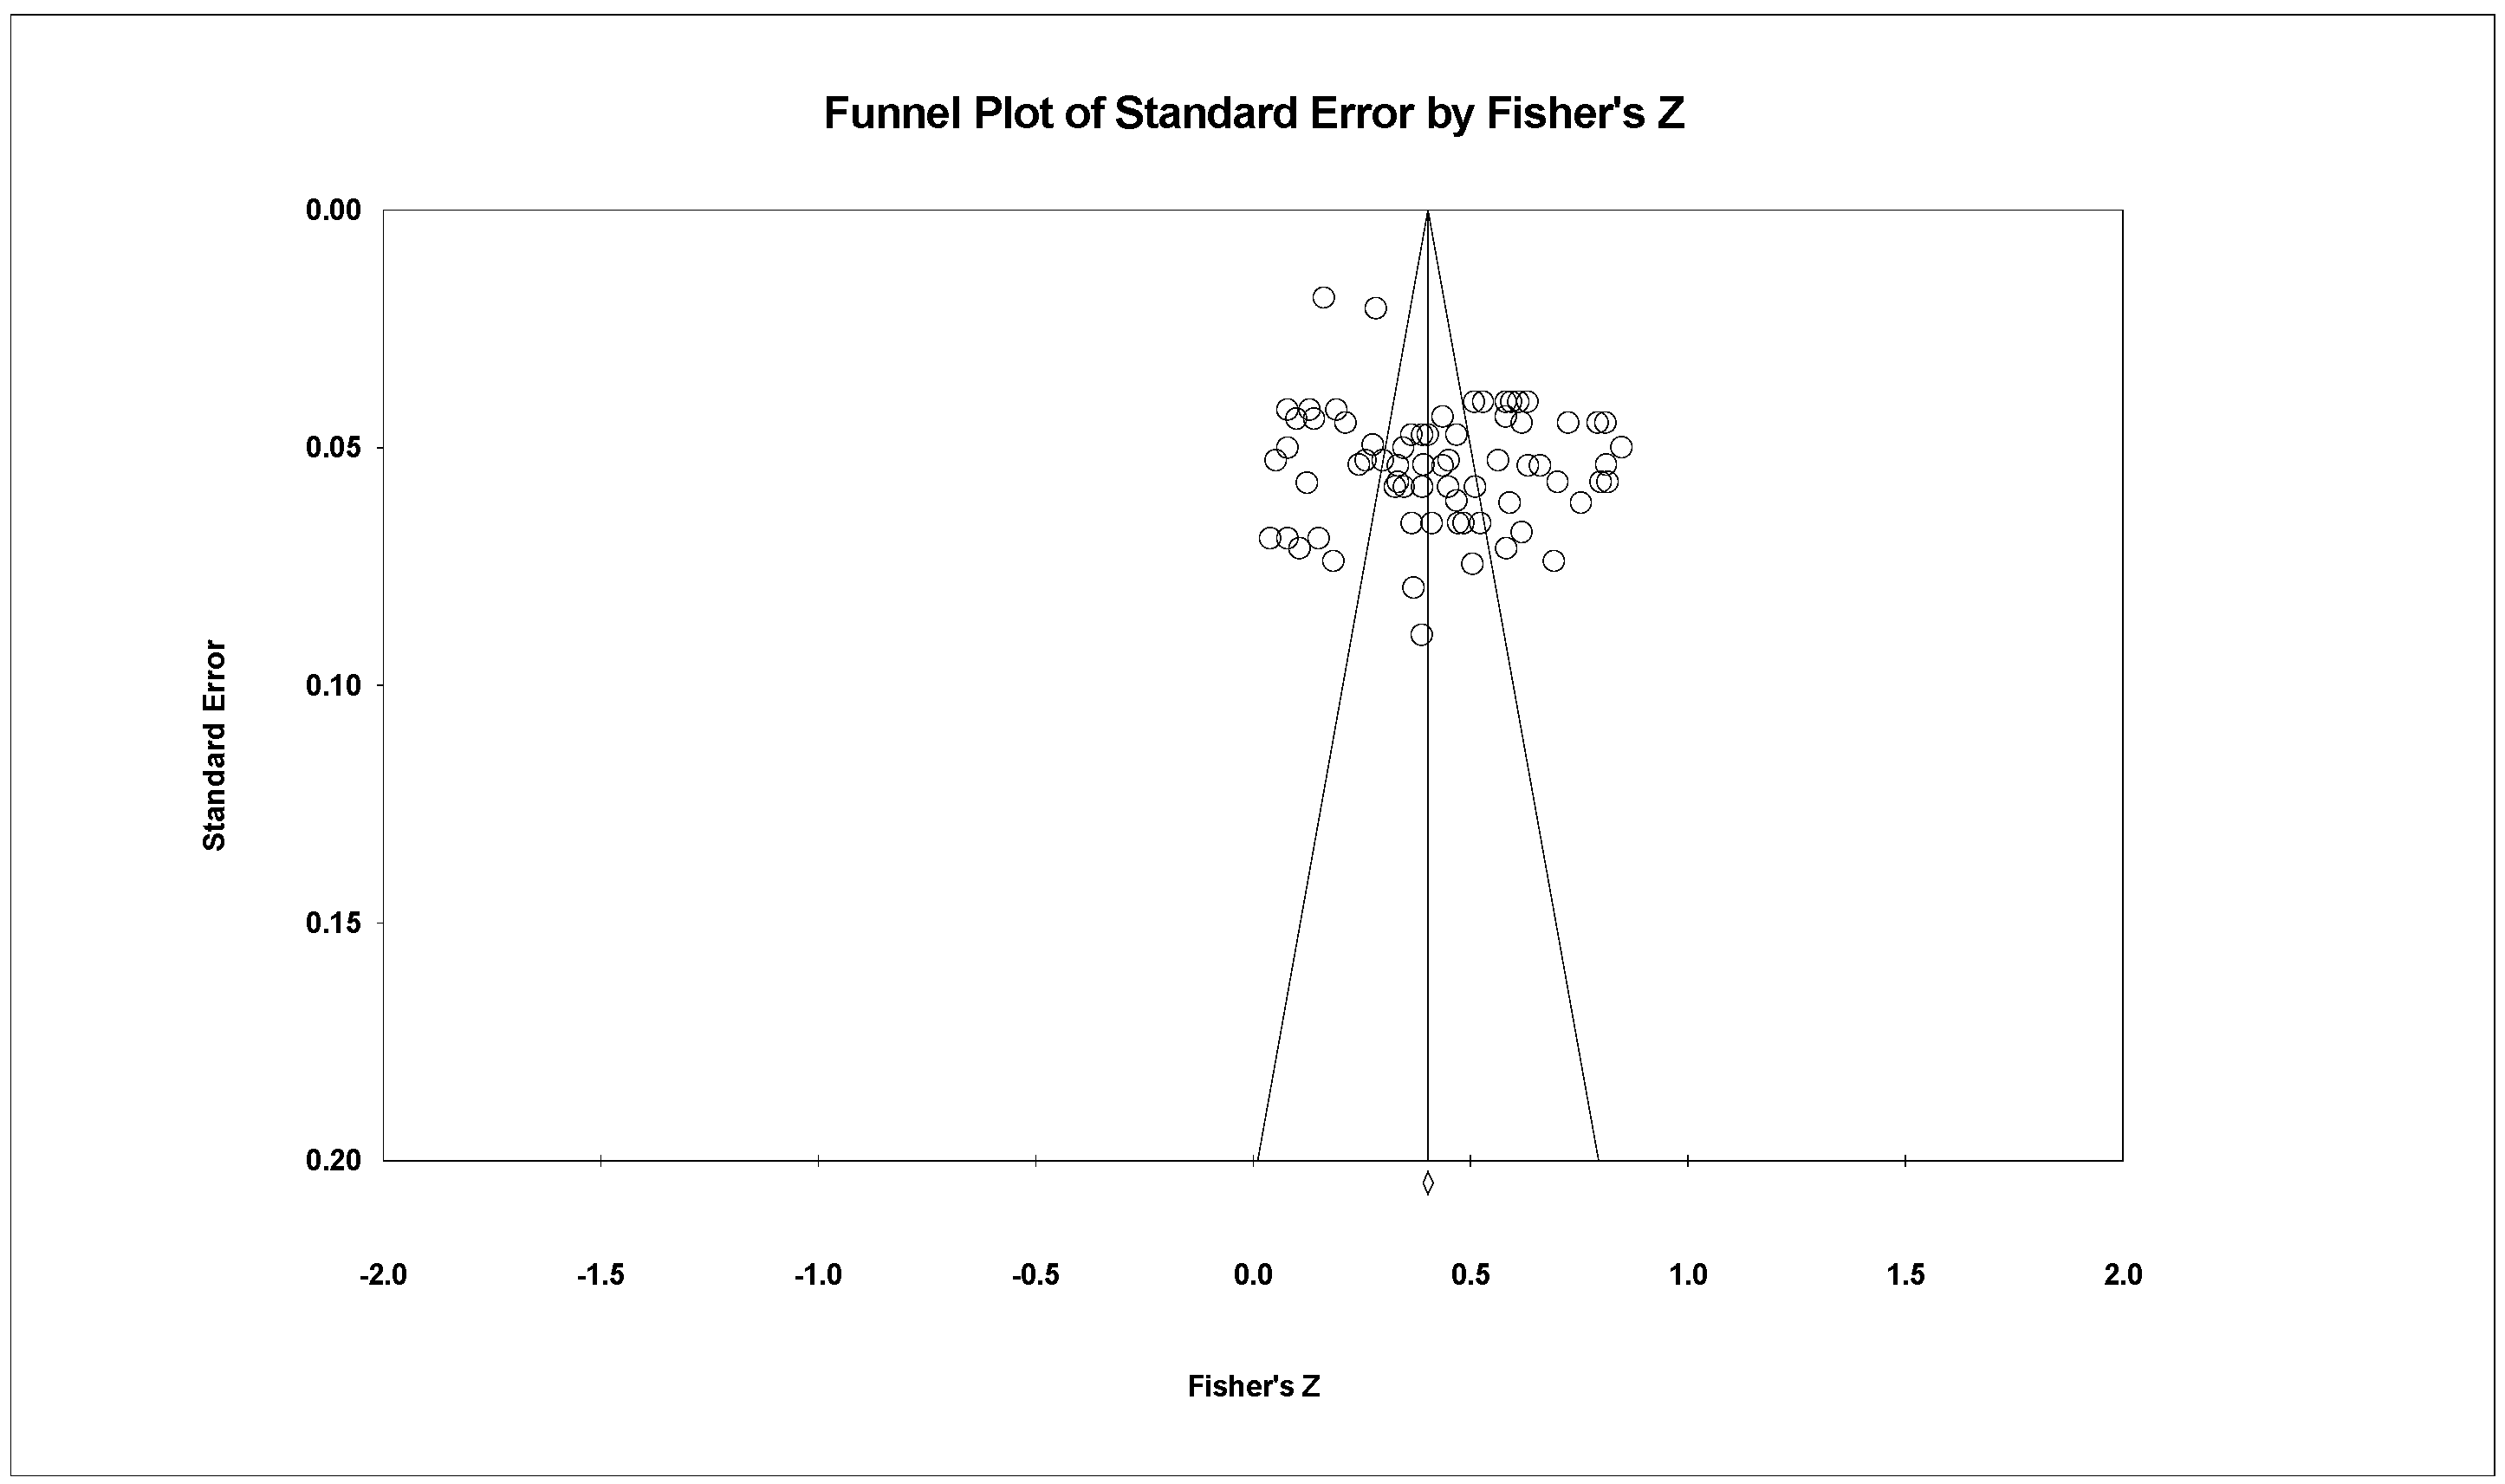
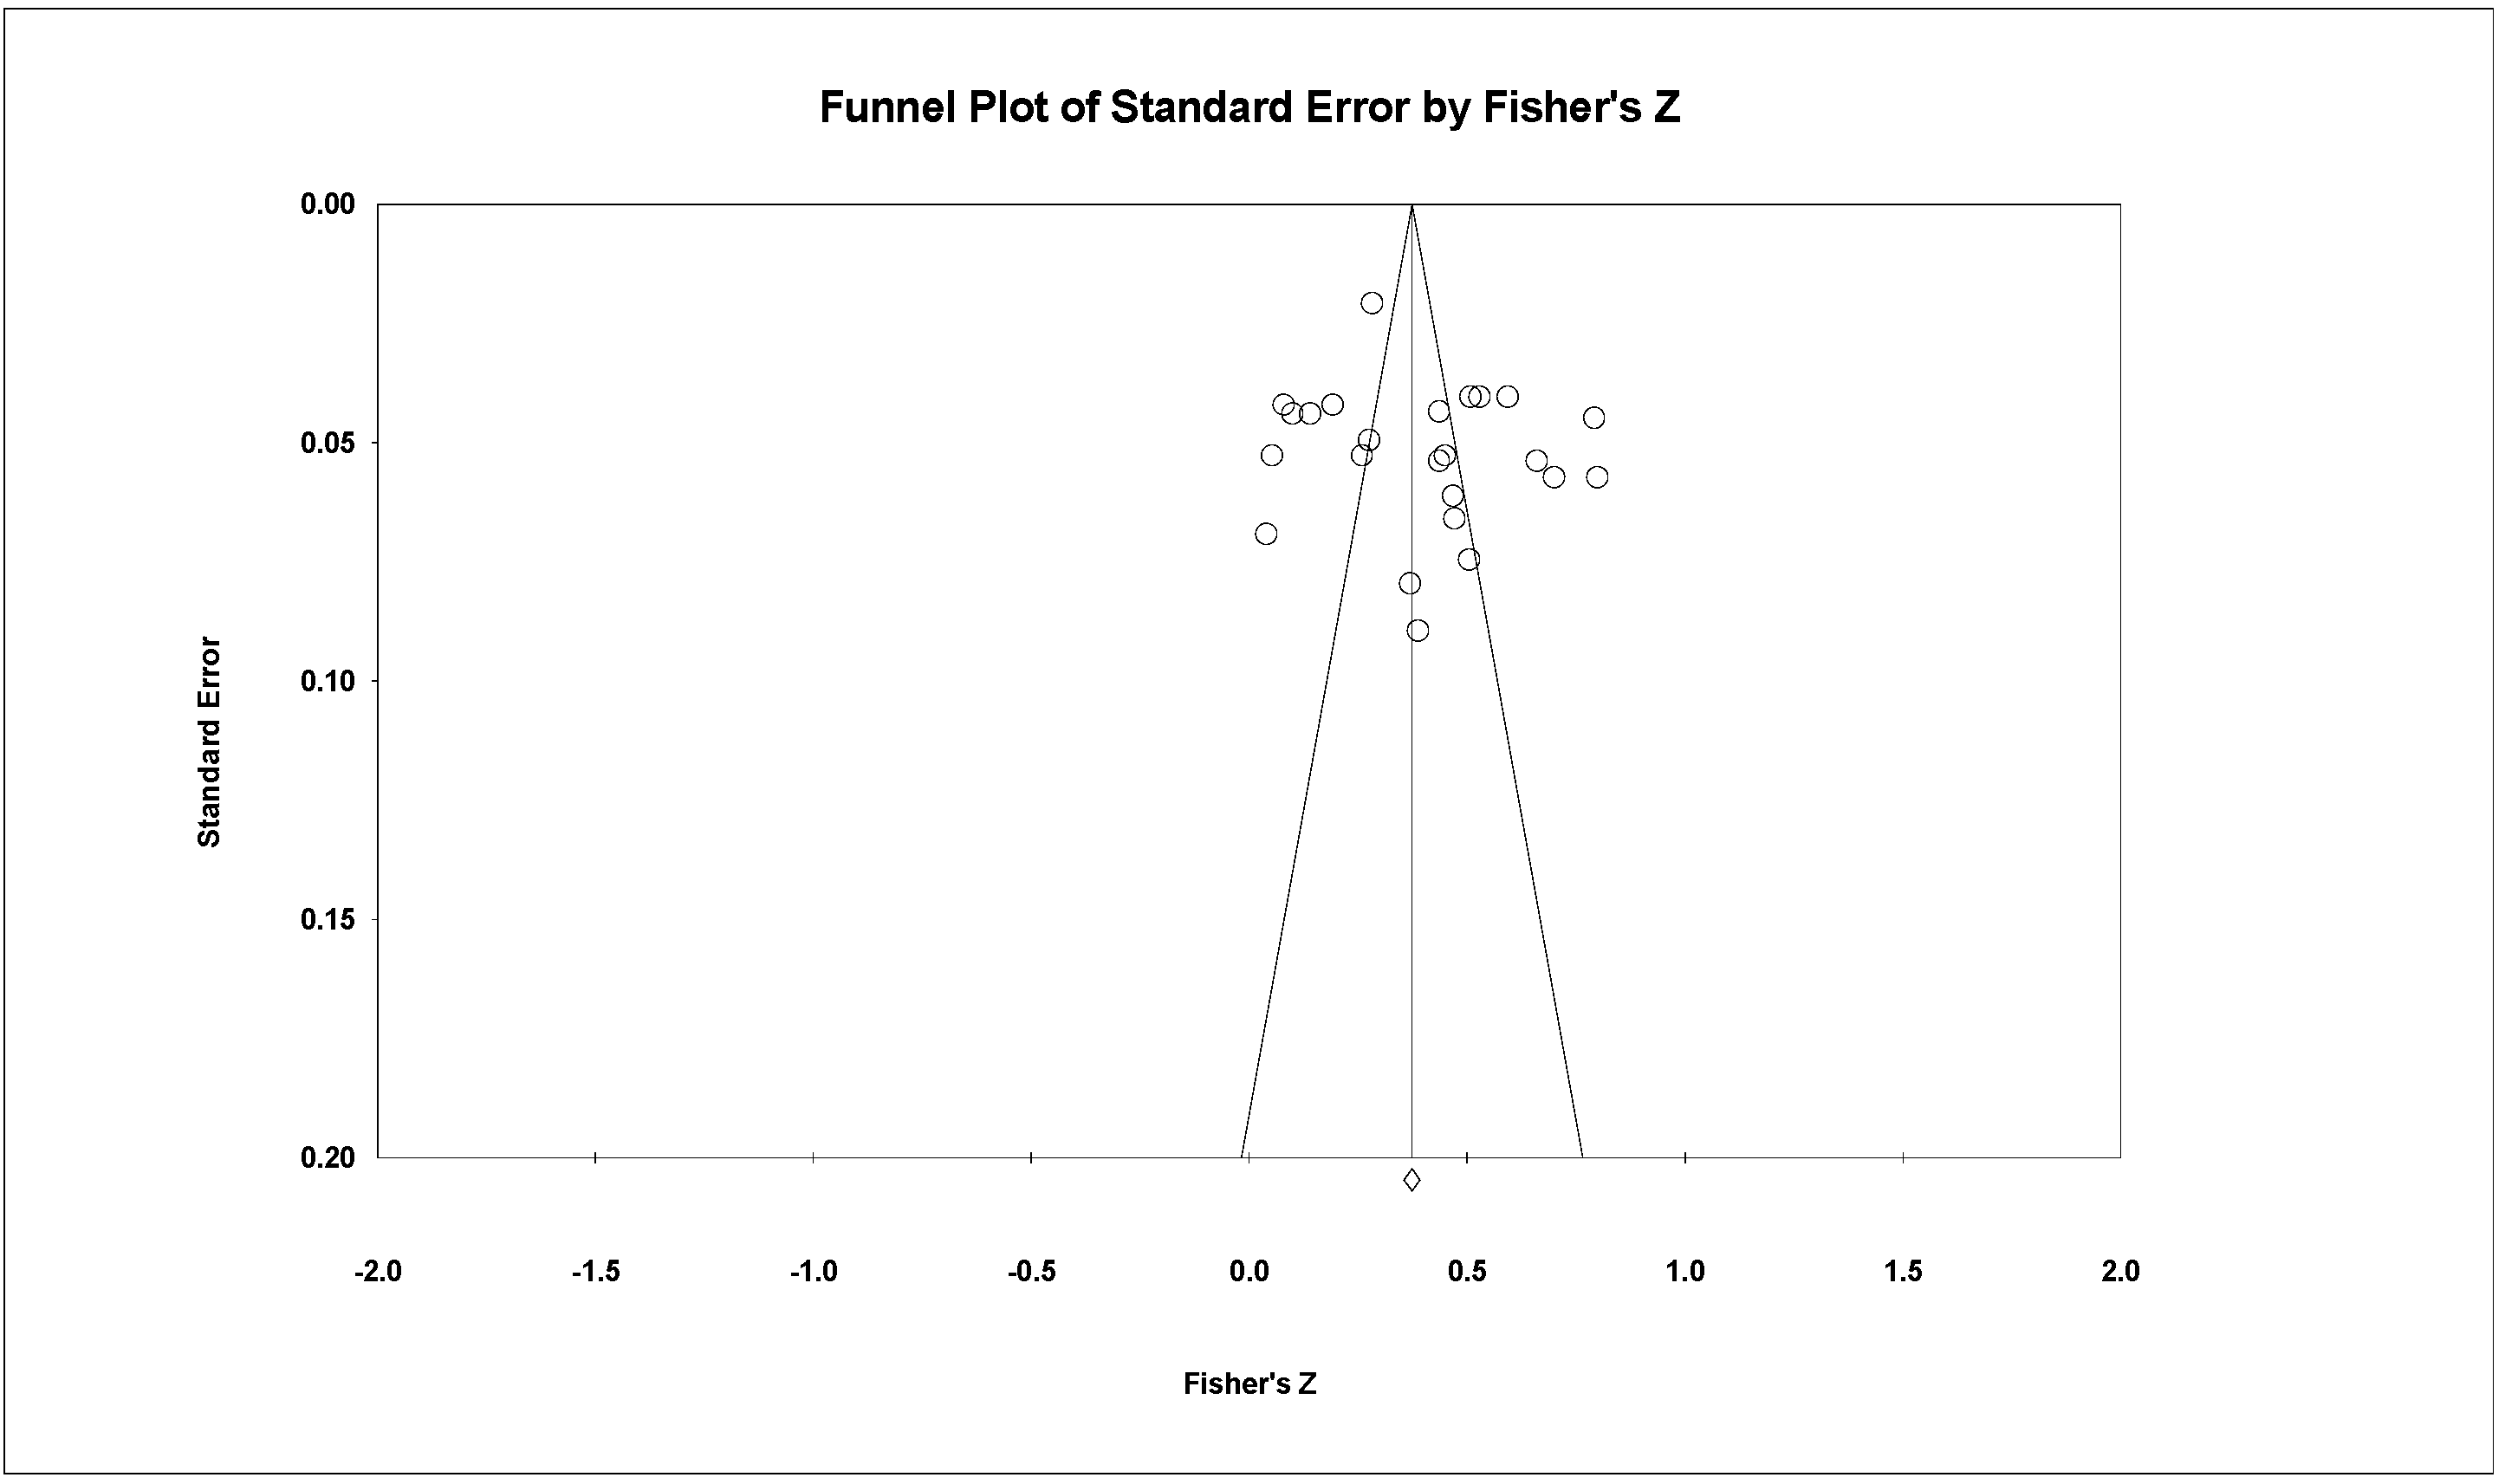
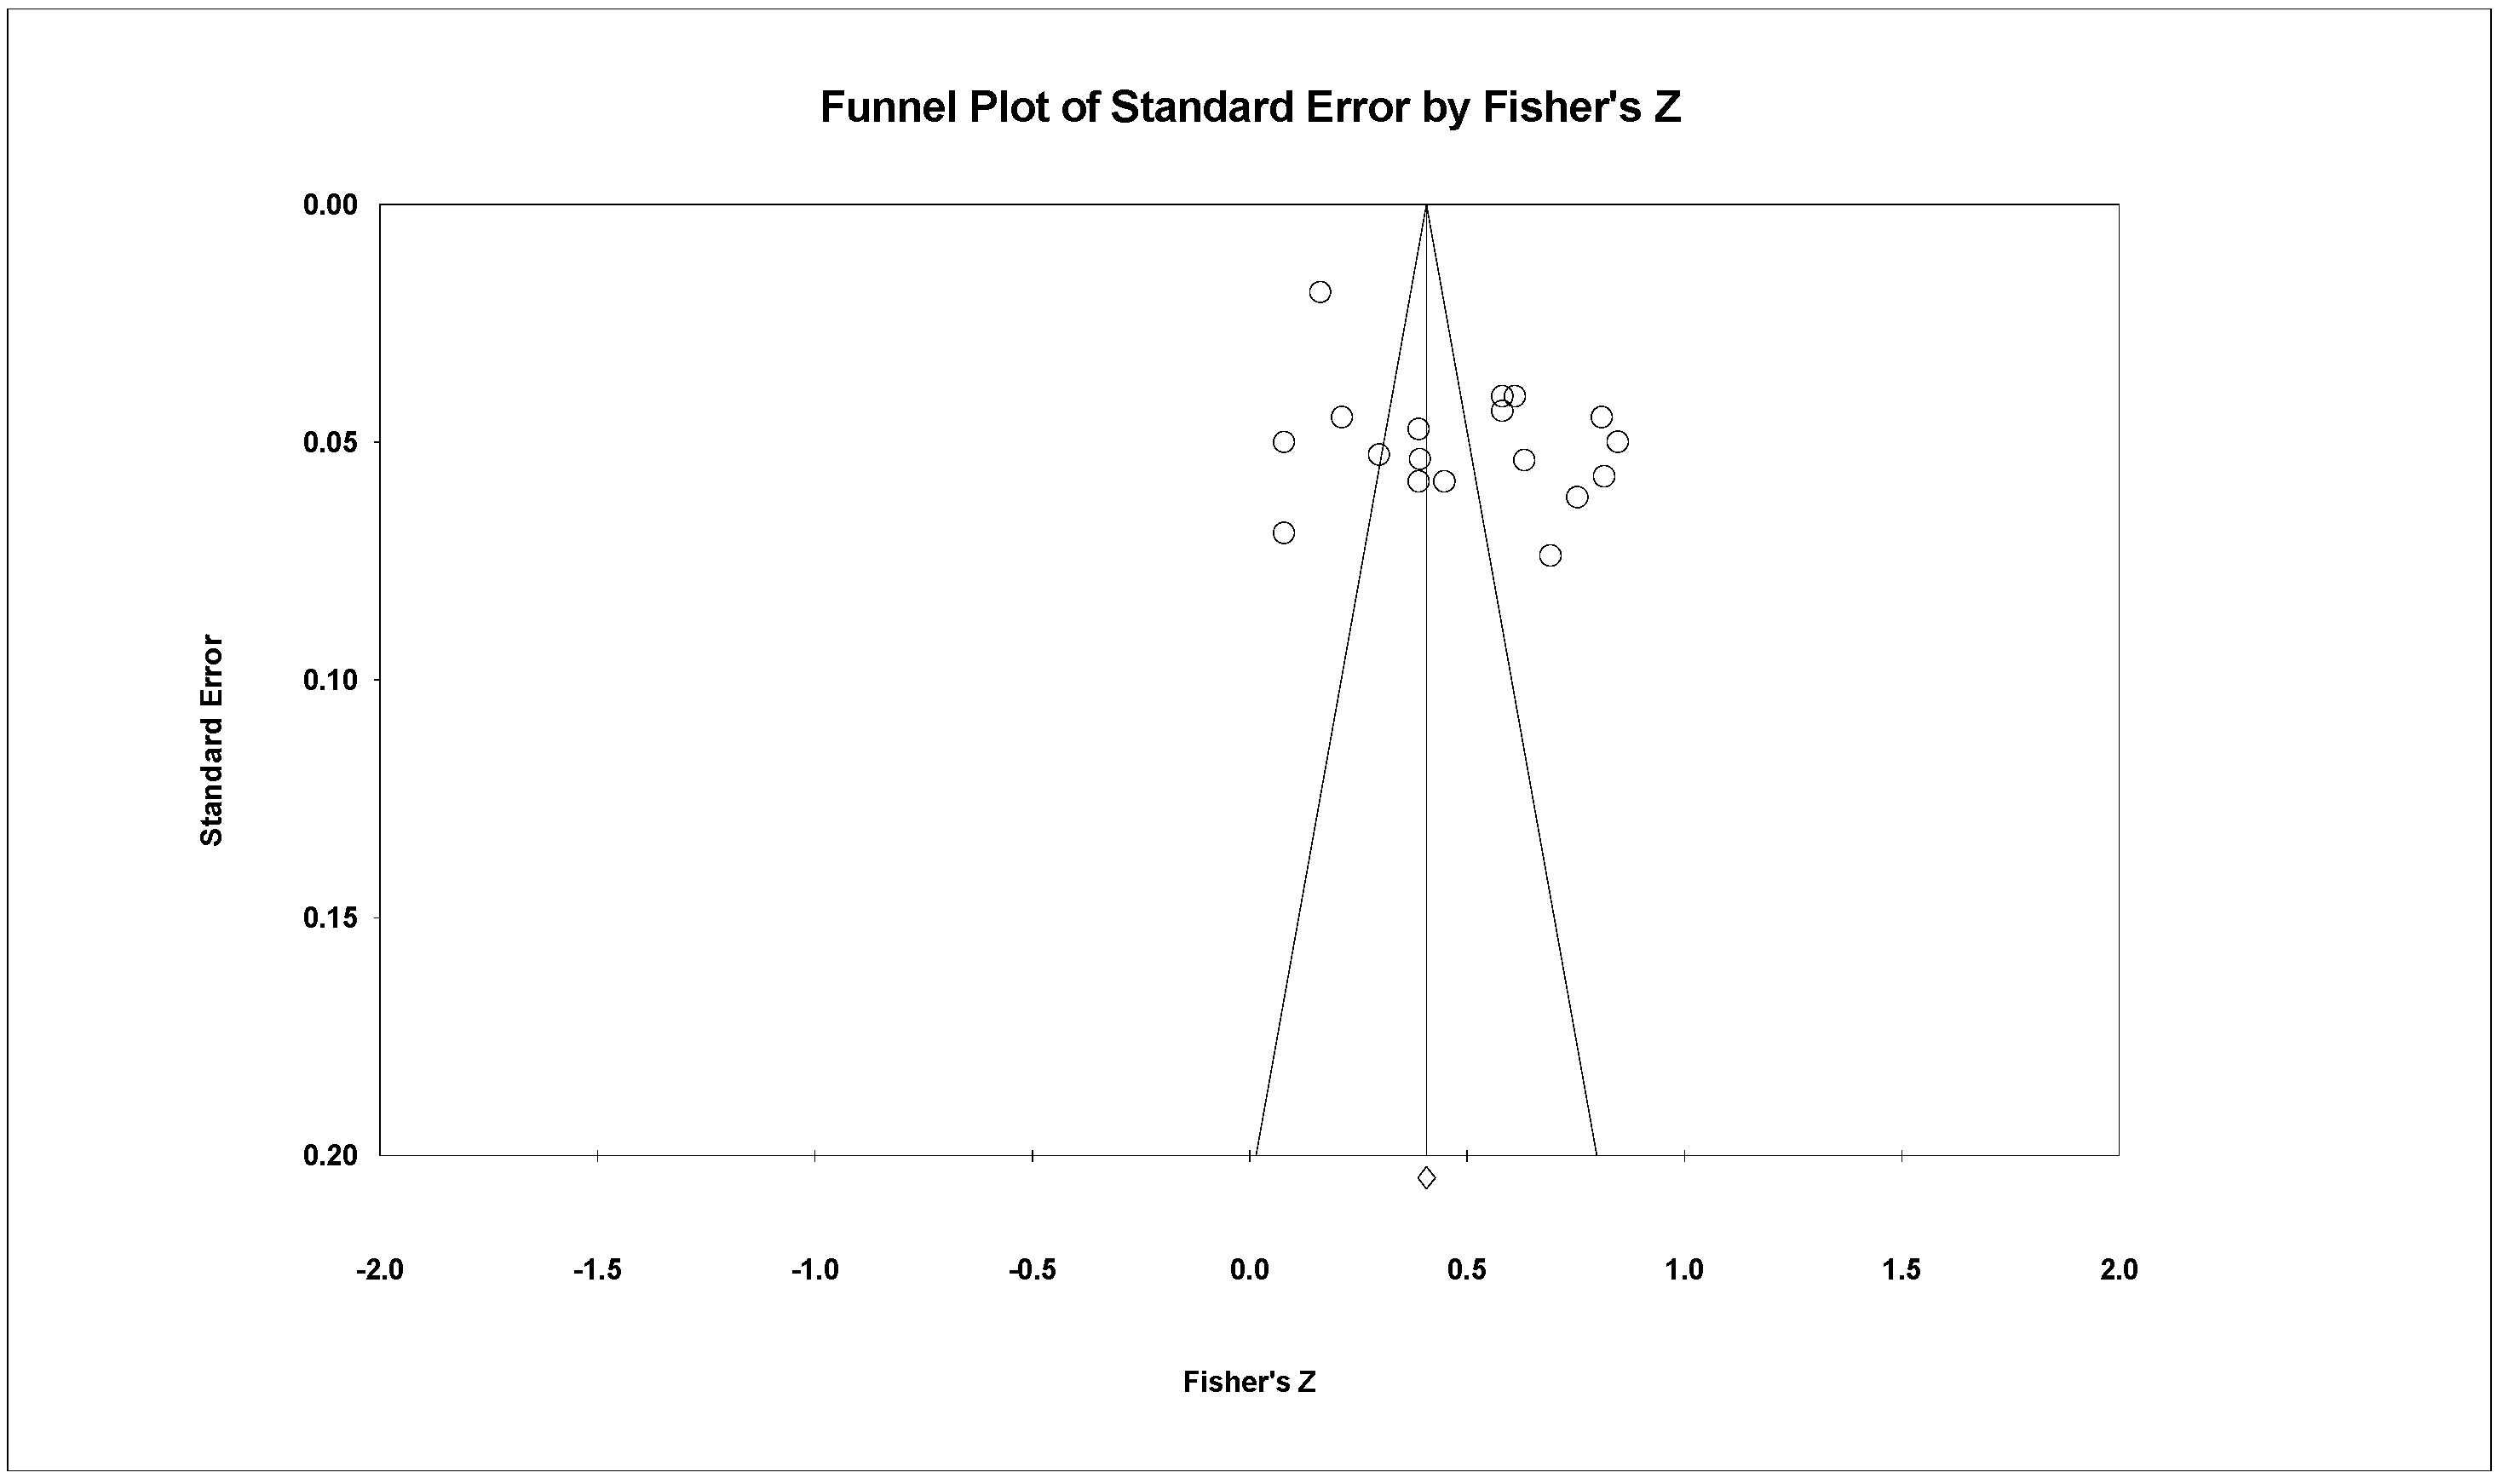
3.1. Publication Bias Test

A publication bias test mainly assesses the quality of the selected sample literature to ensure the authenticity and reliability of the research results. The reason for conducting a sample bias test is that, in general, studies with larger sample sizes and stronger statistical significance are more likely to be published than those with smaller sample sizes and weaker significance. Therefore, it is essential to conduct a thorough examination of sample quality to ensure the robustness of the findings [27]. Generally speaking, a Funnel Plot is a common method for publication bias testing. It mainly uses the converted Fisher’s Z effect value as the X-axis and the standard error as the Y-axis to examine publication bias by showing the relationship between user behavior and value co-creation in HCI. Small sample studies tend to have large sampling errors and high dispersion, and are usually located at the bottom of funnel plots. In contrast, the sampling error in large sample studies is relatively small, their dispersion is also wide, and they are typically positioned at the top of the funnel plot.
In this study, the funnel plots for the overall effect, individual layer, interaction layer, and environment layer on value co-creation in HCI are shown in Figure 2, Figure 3, Figure 4 and Figure 5, all of which were automatically generated after data analysis using the CMA 3.0 software. The small dots in the funnel plot represent the number of effect sizes. For example, in Figure 2, user behavior includes 69 effect sizes, so there are 69 small dots in the plot. The relationships between the four layers are interdependent. User behavior encompasses the influencing factors of the individual layer, interaction layer, and environment layer, forming an inclusive and hierarchical structure. Specifically, the individual layer mainly refers to the psychological traits of users at the micro level, accounting for 27 effect sizes (Figure 3). The interaction layer primarily represents meso-level interactions between different entities, with 24 effect sizes (Figure 4). The environmental layer refers to the macro-level external environment that influences individuals and their interactions, comprising 18 effect sizes (Figure 5). The small dots in each funnel plot are mainly concentrated at the top and are evenly distributed along the middle line and on both sides, indicating that the possibility of publication bias is low [28].
In addition, the Begg test and fail-safe N were used in this study for further quantitative verification, and the research results are shown in Table 1. The Begg test, proposed by Begg and Mazumdar in 1994, is based on using the Rank Correlation Coefficient to evaluate the correlation between the effect size estimates of independent studies and their standard errors in the meta-analysis. The p-value is commonly used to determine whether the correlation of the hypothesized relationship is statistically significant. When the p-value is below the significance level of 0.05, it is considered that there is sufficient evidence of publication bias. When the p-value is greater than 0.1, there is no evidence of publication bias. According to Table 1, the p-values of the Begg test for all of the hypothesized relationships are greater than 0.1, indicating that publication bias is not severe for the effect values covered in this study.
Fail-safe N refers to the number of studies with omissions or relevant conclusions that need to be added before the analysis results lose statistical significance. Generally speaking, the greater the fail-safe N, the smaller the possibility of publication bias. The critical value is equal to 5 × K + 10, where K is the number of sample size. If the Fail-safe N is greater than the critical value, the results of the meta-analysis are considered “safe” [29]. That is, even if there are unpublished studies, the conclusions of the meta-analysis are unlikely to be overturned, further indicating the absence of publication bias. Table 1 shows that the fail-safe N in all hypothesized relationships in this study is greater than the critical value (5 × K + 10), so the research results are relatively reliable and there is no publication bias.

3.2. Heterogeneity Test

The role of the heterogeneity test in this study is reflected in two aspects: first, to determine whether to select the random-effects model or the fixed-effects model; second, to identify whether moderating variables influence the research results, thereby laying the foundation for future studies. If heterogeneity exists among the data, the random-effects model should be applied for correction. This is because the fixed-effects model only considers within-study variance, and when the sample size of a study is small, it tends to underestimate the weight of small-sample studies while overestimating the weight of large-sample studies, thereby affecting the accuracy of the overall effect estimation. In contrast, the random-effects model accounts for both within-study variance and between-study variance, effectively avoiding the bias of underestimating small-sample weights or overestimating large-sample weights, leading to more reliable estimates. On the other hand, the presence of heterogeneity also indicates that moderating variables may influence the relationship between variables [30].
Typically, there are two methods for testing the degree of heterogeneity: Q value and I²value. For the former, if the p value corresponding to the Q value is less than 0.05, heterogeneity is considered to exist. For the latter, the I2 value measures the proportion of heterogeneity in the total variation and its value is from 0 to 100%. An I2 < 25% indicates slight heterogeneity among the data; when 25% ≤ I2 ≤ 50%, this indicates moderate heterogeneity; when I2 > 75%, high heterogeneity among the data is indicated [31].
According to Table 1, in all of them, there is high heterogeneity between user behavior and value co-creation in HCI (Q = 1433.159, p < 0.01; and I2 = 95.255%). In the experimental results for the individual layer, interaction layer and environment layer, the p values corresponding to the Q values are all significant, and the I2 values are 91.961%, 96.355% and 97.150%, respectively, all of which are greater than 50%, indicating the existence of strong heterogeneity; therefore, it is necessary to use the random effect model for the meta-analysis test. Moreover, the significant heterogeneity also suggested the presence of moderating variables in the relationship between user behavior and value co-creation in HCI.

3.3. Effect Value Test

3.3.1. Overall Effect

Based on the above heterogeneity test results, the random-effects model is adopted to examine the overall effect. To ensure the robustness of the model and facilitate comparison, this study presents the comprehensive effect values of each hypothesized relationship under both the fixed-effects model and the random-effects model. Generally speaking, when the effect value (r) of the correlation coefficient is 0.1 ≤ r < 0.4, it indicates a relationship of moderate strength. When r is greater than or equal to 0.4, it indicates a strong relationship [32]. If the upper and lower limits of the 95% confidence interval are both greater than or less than 0, it is considered that there is a significant correlation between the factors.
According to Table 2, under the random effects model, the comprehensive correlation coefficient between user behavior and value co-creation performance in HCI is 0.405, indicating a strong correlation, with a confidence interval of 0.360–0.448. Therefore, it can be concluded that user cooperative behavior in HCI positively affects value co-creation performance (p < 0.01).

3.3.2. Relationship Test of Different Layers’ User Behavior on Value Co-Creation in HCI

According to the random effects model shown in Table 3, the results indicate that user behavior at the individual, interaction, and environment layer significantly influences value co-creation in HCI. At the individual layer, self-efficacy, social identity, enjoyment, and a sense of belonging exhibit positive correlations with value co-creation. Among these, self-efficacy exerts the strongest influence (r = 0.492, p < 0.01), underscoring the role of user confidence and perceived capability in digital collaboration. This suggests that users who feel capable of contributing meaningfully are more likely to engage in co-creation activities. Similarly, the sense of belonging (r = 0.438, p < 0.01) plays a crucial role, reinforcing that emotional connection and group identity are critical factors in fostering engagement.
At the interaction layer, social interaction, reciprocity, trust, and information support all contribute significantly to value co-creation in HCI. Social interaction emerges as the most crucial factor (r = 0.452, p < 0.01), emphasizing the importance of communication and collaboration in virtual environments. The findings indicate that platforms facilitating active exchanges and relationship-building mechanisms encourage more effective co-creation processes. Reciprocity (r = 0.406, p < 0.01) and trust (r = 0.352, p < 0.01) also play fundamental roles, suggesting that mutual reliance and positive exchange dynamics are essential for sustained user engagement.
At the environment layer, shared values, incentives, community culture, and subjective norms significantly influence virtual community collaborative performance. Among these, subjective norms (r = 0.536, p < 0.01) exert the most substantial effect, suggesting that clearly defined community expectations and behavioral norms enhance user engagement. The results indicate that a strong normative structure encourages users to align with community goals, thereby improving co-creation performance. Community culture (r = 0.532, p < 0.01) further strengthens engagement by fostering a shared sense of purpose and collaboration.

3.3.3. Moderating Effects Test on the Relationship Between User Behavior and Value Co-Creation

Based on the heterogeneity test results, it is evident that moderating factors influence the relationship between user behavior and value co-creation in HCI. Therefore, drawing from existing theoretical and empirical studies, this study selects two categories comprising five groups of moderating variables for subgroup analysis to explore which factors may affect the strength or direction of this relationship.
One type is situational factors, including location, cultural diversity, and community type. Location factors are linked to the geographic location of both the founder of the virtual community and the main customer groups. This study divides virtual communities into Chinese and International communities. The rationale for this classification is twofold. On the one hand, based on the authors’ practical survey of open-source community developers, it is evident that virtual communities created in China differ from internationally oriented communities established abroad. On the other hand, according to the study by Li and Ren [33], virtual learning communities in the United States and China exhibit distinct characteristics in online education models. The U.S. is characterized by advanced educational models, innovative technological applications, and extensive practical experience, whereas China places a strong emphasis on the importance of technological application and innovation in online education. This research finding directly illustrates the different influences of geographical location on virtual communities. From the perspective of cultural diversity level, these are divided into two categories: monoculture and multiculture. The monocultural teams primarily emphasize that team members come from a single country [34]. Multicultural teams consist of members from various cultural backgrounds, working together to achieve a common goal for the organization or another stakeholder [35]. Accordingly, we classified community culture into monoculture and multiculture communities. Based on the main functions and purposes of virtual communities, this study divides them into four types: transaction-oriented community, interest-oriented community, relationship-oriented community, and mixed community.
The other type is measurement factors, including empirical research methods and performance measurement. From the perspective of empirical research methods, these are divided into structural equation modeling which focuses on the path coefficients between variables, and the OLS method which focuses on the regression coefficients. From the perspective of collaborative performance, there are three categories: subjective collaboration intention (whether users are willing to participate in value co-creation), objective collaboration behavior (whether users actually participate in value co-creation), and subjective + objective (which involves both of the above performance measures).
The subgroup analysis examines how situational and measurement factors moderate these relationships, providing additional insights into the contextual dependencies of value co-creation in HCI. If the Q value of inter-group heterogeneity is significant (p < 0.05), it indicates that the moderating variable has caused a significant difference in effect sizes between different subgroups.
According to Table 4, for situational factors, geographic location plays a notable role with user behavior exhibiting a stronger effect on value co-creation in Chinese virtual communities (r = 0.442, p < 0.01) compared to international communities (r = 0.320, p < 0.01). The presence of significant heterogeneity (Q = 5.388, p < 0.05) suggests that cultural familiarity and localized engagement dynamics may enhance collaboration. Similarly, cultural diversity influences the strength of value co-creation effects, with monocultural communities (r = 0.422, p < 0.01) demonstrating higher performance than multicultural communities (r = 0.301, p < 0.01), with notable inter-group heterogeneity (Q = 4.706, p < 0.05). This aligns with self-categorization theory, which posits that greater cultural similarity fosters stronger collaboration and trust. The results indicate that diverse cultural backgrounds may introduce communication challenges, reducing co-creation efficiency. The study also explores the impact of different community types, revealing that mixed communities (r = 0.457, p < 0.01) achieve the highest co-creation performance. However, inter-group heterogeneity is not statistically significant (Q = 1.694, p > 0.1), implying that while community type influences engagement dynamics, it does not significantly alter the fundamental relationship between user behavior and value co-creation.
Regarding measurement factors, empirical research methods and performance indicators also shape the observed effects. Studies using structural equation modeling (SEM) (r = 0.430, p < 0.01) report stronger relationships than those using OLS regression (r = 0.287, p < 0.01), with significant heterogeneity (Q = 6.622, p < 0.05). This suggests that SEM captures latent variables and indirect effects more effectively than traditional regression models. Additionally, the impact of user behavior on value co-creation is more pronounced when subjective collaboration intention (r = 0.510, p < 0.01) is used as a measure, rather than objective collaboration behavior (r = 0.350, p < 0.01). The presence of significant inter-group heterogeneity (Q = 17.711, p < 0.01) reinforces the idea that perceived willingness to co-create is a stronger predictor of engagement than observed behavioral metrics.

3.4. Robustness Checks

In the meta-analysis, the focus of the sensitivity analysis was to evaluate whether the combined results were robust. Therefore, this study adopts a leave-one-out procedure for the sensitivity analysis [36]. For each excluded study’s effect value, the comprehensive correlation coefficient of the remaining studies is calculated to investigate whether the results have undergone any essential changes. After excluding any study, the comprehensive effect value and 95% confidence interval under the random effects model did not change significantly. In other words, the relationship between user behavior and value co-creation was stable and not influenced by a single effect value, which indicates that the meta-analysis results are stable and reliable.

4. Discussion

4.1. Effects of User Behavior on Value Co-Creation in HCI

This study conducts a comprehensive analysis of the factors influencing user behavior in HCI and divides these factors into three levels for a holistic analysis. The research shows that, overall, user behavior contributes to value co-creation in virtual communities with the specific explanatory mechanisms outlined as follows.

4.2. Different Layers Effect of User Behavior

4.2.1. At Individual Layer

Self-efficacy, social identity, enjoyment, and sense of belonging at the individual level positively impact value co-creation performance in HCI. The reason why self-efficacy matters most is that higher self-efficacy leads to greater trust and sense of responsibility, enhancing their perceived value and usability. This trust and motivation from a sense of capability promote deeper involvement in value co-creation processes, particularly in AI-enabled environments. For example, Zhao [37] suggested that the perception of an AI’s self-efficacy directly influences users’ willingness to participate in AI community. For some other factors, members with a high level of social identity will have a high degree of self-value identification and behave more positively. Based on social identity theory, individuals who align themselves with the organization’s values, culture, and rules are more inclined to engage in behaviors that contribute to the attainment of organizational objectives [38]. When participants actively engage in community activities and devote more time to them, they will feel a stronger sense of community belonging than those who are less active. This increases the persistence of collaborators, strengthens information flow, and promotes mutual support and collaboration among the members.

4.2.2. At Interaction Layer

Information support, social interaction, user trust, and reciprocity at the interaction level significantly and positively impact value co-creation performance in HCI, with social interaction having the strongest influence. Studies indicate that strong social networks significantly enhance users’ ability to share knowledge and ideas, which is crucial for value co-creation. Sun et al. [39] pointed out that basic and essential individual collaborative problem solving behaviors and key interactive patterns are important to successful problem-solving performance. Furthermore, user knowledge is a public good, and users may be reluctant to contribute knowledge unless they can gain information from others that will benefit them. This interrelationship with other users has been shown to improve relationship quality, increase self-efficacy, reduce the risk of anxiety and thus promote knowledge sharing. Finally, reciprocity is an important motivator that impacts information sharing in online communities [40]. When members benefit from others, e.g., receiving advice, they would like to perceive the need to return the favor by giving opinions [40].

4.2.3. At Environment Layer

Shared values, incentives, community culture, and subjective norms at the environment layer significantly and positively impact value co-creation performance in HCI, with subjective norms having the strongest influence. This is because subjective norms play a key role in shaping behavioral consistency in HCI. It is shaped by three psychological mechanisms: internalization from expert sources, interpersonal sources from peer influence, and external sources of information [41]. When users perceive that specific behaviors are expected and reinforced by the community, they are more likely to repeat those behaviors. Therefore, when platforms design systems that emphasize normative behaviors, such as sharing content or providing feedback, users are more likely to comply, leading to higher performance in value co-creation processes. If a comment violates the site’s norms, moderators in the community will either delete it themselves or request the author to do so [42]. Regarding other factors, such as shared values, when community users align on common goals and values, it positively impacts their intention to continue using the platform [43]. As for incentives, according to the classic “economic man” hypothesis, offering economic incentives in online knowledge communities can motivate individuals to generate knowledge, as people are generally inclined to act in their own interest, particularly when monetary benefits are involved [44]. Compared to material and financial rewards, most participants prioritize the enhancement of their virtual reputation, such as rankings and points, as these symbolize exceptional abilities, higher social standing, and a sense of achievement [45].

4.3. Moderating Factors Effect on the Relationship Between User Behavior and Value Co-Creation

4.3.1. Situational Factors

From the perspective of the country where the internet community is created and the geographical location of the majority of its users, Chinese communities are more effective than international communities in moderating the impact of user behavior on value co-creation. This is because, in Chinese communities, users typically have stronger social connections and a higher level of trust, which helps reduce uncertainty in collaboration and enhances participants’ willingness to interact. High levels of trust facilitate knowledge sharing and value co-creation. In contrast, in international communities, just like inter-organizational contexts, lack of trust, various organizational cultures, and lack of effective communication may hinder knowledge sharing [46].
From the perspective of community cultural diversity, it was originally assumed that the more diverse the culture in a virtual community, the more it would facilitate value co-creation among members. However, this study found that monocultural environments are more effective in moderating the impact of user behavior on value co-creation than multicultural ones, which is a very interesting research finding. The reasons for this can be explained from both psychological and sociological perspectives. From a psychological viewpoint, there is a theory called self-categorization theory, which developed from social identity theory, primarily used to explain the emergence of subgroups within teams [47]. This theory suggests that after joining a collaborative team, individual members automatically categorize themselves into a certain group, establishing an identity with other members. Those categorized into the same group tend to positively evaluate their own team, while holding negative views towards members of different groups [48]. According to this theory, in a multicultural context of virtual communities, members may face an increased risk of subgroup formation due to differences in cultural background, work habits, and other factors, which in turn amplifies the sense of dis-identification with members of different groups. This, consequently, affects cooperation efficiency and value co-creation performance.
Simultaneously, the similarity–attraction theory, rooted in social psychology, also offers a compelling explanation of the role of individual similarity in interpersonal attraction and social interaction. According to this theory, when collaborating in teams, members are more likely to choose to cooperate with others who share similar cultural backgrounds or values [49]. When the cultural diversity among team members is higher, it amplifies the differences between individuals, which can hinder social integration and team cohesion, increasing the likelihood of mistrust, conflict, misunderstandings, or disagreements [50,51]. Therefore, in a multicultural virtual community, due to the stronger diversity compared to a monocultural context, team cohesion is more susceptible to being affected, which in turn hinders value co-creation.
In this meta-analysis, it was found that community type does not moderate the impact of user behavior on value co-creation. Whether the community is interest-oriented, relationship-oriented, or transaction-oriented, the underlying motivations for participating in virtual communities—such as the desire for social interaction, status, or reciprocity—remain largely the same and are consistent across different community types.

4.3.2. Measurement Factors

From a statistical measurement perspective, structural equation modeling is better able to moderate the impact of user behavior on value co-creation. This is due to its ability to simultaneously consider multiple interrelated dependent variables, making it a comprehensive approach for studying such multifaceted phenomena. In the context of user behavior and virtual community value co-creation, many factors, such as those involving subjective internal psychology or aspects of thought, are difficult to observe or measure directly, requiring the use of indirect estimation methods or latent variable modeling techniques. SEM can capture complex characteristics (i.e., latent variables) that are not directly measurable but can be inferred through observed indicators. Moreover, SEM excels in handling error terms. Unlike traditional methods, SEM enables researchers to account for both measurement errors and model specification errors, which are common in studies involving user behavior in HCI, where variables are influenced by numerous unobservant factors. This ability to incorporate errors into the model enhances the accuracy and robustness of the research findings.
From the perspective of the measurement indicators of value co-creation performance, an interesting finding is that subjective willingness to cooperate better moderates the impact of user behavior on value co-creation. Because subjective willingness to cooperate not only reflects the current collaboration status but also predicts the potential quality and future success of collaboration, partners with a positive attitude and sustained commitment are more likely to mobilize resources and enhance communication which is important in long-term collaboration success. Additionally, subjective willingness to cooperate better captures the influence of cultural and psychological factors. In virtual communities, these factors are crucial for fostering trust and psychological alignment, which are essential for value co-creation. In contrast, while objective behavior data (e.g., meeting frequency, document exchange) provide direct insights, they may not fully reflect the dynamic nature of collaboration.

5. Conclusions and Implications

5.1. Theoretical Contributions

This study conducted a meta-analysis to comprehensively examine the impact of user behavior on value co-creation in HCI based on 42 independent studies published between 2006 and 2023. Theoretically, it resolves the existing literature’s controversies and significantly enriches research on user behavior within the context of HCI, consolidating prior research through a structured and quantitative approach. Practically, this study provides valuable insights for multiple stakeholders, including virtual community designers, online community operators, and policymakers in the digital economy. By identifying key determinants of value co-creation, the findings can help enhance the operational efficiency of virtual communities, improve platform design, and optimize collaborative user engagement.
The findings contribute a structured understanding of how individual, interactional, and environmental factors influence value co-creation. At the individual layer, self-efficacy, social identity, enjoyment, and sense of belonging are all significantly positively correlated with value co-creation performance. Among these, self-efficacy has the most significant impact, indicating that users’ confidence and perceived capabilities are key drivers of value co-creation. At the interaction layer, information support, social interaction, trust, and reciprocity have the most significant effects on value co-creation, with social interaction being particularly crucial for cooperation and knowledge sharing. At the environment layer, shared values, community incentives, community culture, and subjective norms also significantly influence value co-creation, with subjective norms having the strongest effect. This suggests that the clarity of community culture and behavioral norms is essential for promoting user behavior and enhancing value co-creation performance. Additionally, this study examines the moderating effects of situational and measurement factors on the relationship between user behavior and value co-creation. The findings indicate that factors such as geographic location, cultural differences, and platform characteristics influence how user behavior translates into value co-creation in HCI. These insights suggest that adaptive strategies are necessary to optimize virtual environments and maximize user-driven co-creation outcomes.

5.2. Implications for Practice

Based on the findings of this study, user behavior plays a critical role in shaping value co-creation in HCI. This section provides detailed recommendations for platform designers, virtual community managers, and policymakers to optimize user behavior and enhance value co-creation performance.
First, to enhance user self-efficacy at the individual layer, platform designers can take steps to ensure that users have the tools and support they need to engage meaningfully in value co-creation. Since self-efficacy has the most significant impact on value co-creation at this level, platforms should provide clear task instructions and user-friendly tools that make it easy for users to participate in collaborative processes. Additionally, providing timely feedback on user contributions helps users feel validated and recognized for their efforts, which builds their confidence in their ability to contribute effectively. User-friendly interfaces that offer step-by-step guidance, as well as interactive tutorials, can make the user experience smoother and more engaging. For virtual community managers, it is crucial to implement incentive mechanisms, such as rewarding users for consistent participation or innovative contributions. These rewards, which could range from badges to tangible incentives, reinforce engagement and motivation, helping users feel empowered and confident in their ability to co-create value. By focusing on boosting self-efficacy, platforms can foster an environment that encourages active user participation and knowledge sharing.
Second, promoting social interaction at the interaction layer is essential for enhancing collaboration and value co-creation. Since social interaction significantly impacts value co-creation at this layer, platform designers can create spaces such as discussion forums, group chats, and real-time collaboration tools that encourage users to exchange ideas, solve problems collaboratively, and form meaningful relationships. These tools are crucial for fostering strong bonds among community members and building a network of collaboration. Social interaction features like comment sections or user-generated content spaces can encourage users to share their experiences and insights, thereby fostering a more cohesive community. Additionally, community managers can encourage transparency by creating systems where contributions are clearly visible to all members. This helps build trust among users, as they can see the value of their contributions recognized by others. Transparent practices also ensure that users feel more connected to the community, encouraging them to actively participate. By fostering social interactions, platforms can help users build stronger connections and enhance collaboration, thereby improving the overall performance of value co-creation.
Third, at the environmental layer, strengthening subjective norms is crucial for influencing user behavior in virtual communities. Subjective norms, which reflect the shared values and behaviors of a community, have a profound impact on the way users engage with the platform. Platform designers can foster a strong community culture by clearly articulating the mission and values of the platform. This helps users understand the purpose of the platform and how their behavior aligns with the community’s goals. Setting clear behavioral expectations within the community is also essential. Community managers can facilitate this by creating guidelines on acceptable behaviors, such as encouraging respectful communication, cooperative efforts, and ethical conduct. Positive reinforcement through rewards for following these norms helps further reinforce the desired behaviors. By cultivating a strong sense of shared values, platforms can increase user collaboration, encourage trust-building, and contribute to successful value co-creation efforts.
Fourth, considering the moderating factors in platform design is critical for ensuring that platforms meet the needs of diverse user groups. This study emphasizes that different cultural, geographical, and demographic factors can moderate the impact of user behavior on value co-creation. Platform designers should conduct research to understand the cultural characteristics and social behaviors of their user base before developing or optimizing platform features. For example, platforms serving international audiences may need to incorporate features that cater to specific cultural communication styles and language preferences, which may vary significantly across regions. Policymakers and platform managers should also consider how local social behaviors and cultural expectations affect user engagement. For instance, users from high-context cultures may prefer indirect communication and collective decision-making, while those from low-context cultures might prioritize directness and individual autonomy. Tailoring the platform’s features to accommodate these differences can help increase user engagement and foster more effective collaboration. Cultural intelligence should be considered as part of the platform’s design and community management strategies. Understanding these factors can enhance collaboration across diverse communities and facilitate greater value co-creation.

5.3. Limitations and Directions for Future Research

Of course, there are some limitations in this paper, which could be addressed in future research. First, potential biases in study selection may exist despite this study having passed the publication bias test. Because studies with significant results are more likely to be published. Future research can further minimize this bias by incorporating a broader range of sources, including diverse language studies. Second, this study is based on cross-sectional meta-analytic data, which provide a robust synthesis of existing findings but does not establish causal relationships over time. While the results offer strong empirical support for the impact of user behavior on value co-creation, longitudinal research is encouraged in the future to explore the long-term effects. Third, contextual applicability remains an important consideration. This study accounts for situational and measurement factors such as geographic location and cultural differences, which influence user behavior in HCI. However, additional factors such as industry domain, and evolving technological environments may also play a role. Future research may consider a comparative approach across different digital ecosystems to further refine the theoretical model and enhance generalizability.

Author Contributions

Conceptualization: X.C. and Y.Z.; methodology: X.C. and Y.Z.; software: X.C.; validation: X.C.; formal analysis: X.C.; resources: X.C. and Y.Z.; data curation: X.C. and Y.Z.; writing—original draft preparation: X.C.; writing—review and editing: X.C. and Y.Z.; visualization: X.C.; supervision: Y.Z.; project administration: X.C.; funding acquisition: X.C. and Y.Z. All authors have read and agreed to the published version of the manuscript.

Funding

This paper was funded by the Humanities and Social Science Youth Fund of Ministry of Education of China (Grant: 23YJC630014); Humanities and Social Sciences Fund of Ministry of Education of China (Grant: 16JDGC011); National Natural Science Foundation of China (Grant: 71974107); National Natural Science Foundation of China (Grant: L2424237); the National Social Science Foundation of China.

Data Availability Statement

The datasets used and/or analyzed during the current study are available from the corresponding author on reasonable request.

Conflicts of Interest

The authors declare no potential conflicts of interest with respect to the research, authorship, and/or publication of this article.

References

  1. Wang, X. Multimedia teaching mode in colleges and universities based on psychology-based human-computer interaction interface design. Int. J. Hum.–Comput. Interact. 2024, 40, 3507–3515. [Google Scholar] [CrossRef]
  2. Yang, Y. The talent training mode of international service design using a human–computer interaction intelligent service robot from the perspective of cognitive psychology. Front. Psychol. 2021, 12, 600218. [Google Scholar] [CrossRef] [PubMed]
  3. Rezaev, A.V.; Tregubova, N.D. Looking at human-centered artificial intelligence as a problem and prospect for sociology: An analytic review. Curr. Sociol. 2025, 73, 120–138. [Google Scholar] [CrossRef]
  4. Shulner-Tal, A.; Kuflik, T.; Kliger, D. Enhancing fairness perception—Towards humancentred AI and personalized explanations understanding the factors influencing laypeople’s fairness perceptions of algorithmic decisions. Int. J. Hum.–Comput. Interact. 2022; ahead of print. [Google Scholar] [CrossRef]
  5. Dikmen, M.; Burns, C. The effects of domain knowledge on trust in explainable AI and task performance: A case of peer-to-peer lending. Int. J. Hum.-Comput. Stud. 2022, 162, 102792. [Google Scholar] [CrossRef]
  6. Young, J.S. Anthropomorphism in human-centered AI: Determinants and consequences of applying human knowledge to AI agents. In Human-Centered Artificial Intelligence: Research and Applications; Nam, C.S., Jung, J.-Y., Lee, S., Eds.; Academic Press: Cambridge, MA, USA, 2022; pp. 103–116. [Google Scholar]
  7. Rubio, N.; Villaseñor, N.; Yague, M.J. Does Use of Different Platforms Influence the Relationship between Cocreation Value-in-Use and Participants’ Cocreation Behaviors? An Application in Third-Party Managed Virtual Communities. Complexity 2019, 2019, 7562903. [Google Scholar] [CrossRef]
  8. Zhang, Y.; Zhang, M.L.; Luo, N.; Wang, Y.; Niu, T. Understanding the formation mechanism of high-quality knowledge in social question and answer communities: A knowledge co-creation perspective. J. Inf. Manag. 2019, 48, 72–84. [Google Scholar] [CrossRef]
  9. Füller, J.; Schroll, R.; Von Hippel, E. User generated brands and their contribution to the diffusion of user innovations. Res. Policy 2013, 42, 1197–1209. [Google Scholar] [CrossRef]
  10. Shang, S.S.; Wu, Y.L.; Li, E.Y. Field effects of social media platforms on information-sharing continuance: Do reach and richness matter? Inf. Manag. 2017, 54, 241–255. [Google Scholar] [CrossRef]
  11. Zamiri, M.; Esmaeili, A. Methods and technologies for supporting knowledge sharing within learning communities: A systematic literature review. Adm. Sci. 2024, 14, 17. [Google Scholar] [CrossRef]
  12. Beck, S.; Bergenholtz, C.; Bogers, M.; Brasseur, T.-M.; Conradsen, M.L.; Di Marco, D.; Distel, A.P.; Dobusch, L.; Dörler, D.; Effert, A.; et al. The Open Innovation in Science research field: A collaborative conceptualisation approach. Ind. Innov. 2022, 29, 136–185. [Google Scholar] [CrossRef]
  13. Liang, H.; Wang, M.M.; Wang, J.J.; Xue, Y. How intrinsic motivation and extrinsic incentives affect task effort in crowdsourcing contests: A mediated moderation model. Comput. Hum. Behav. 2018, 81, 168–176. [Google Scholar] [CrossRef]
  14. Zhang, Y.; Qin, M.; Stol, K.-J.; Zhou, M.; Liu, H. How Are Paid and Volunteer Open Source Developers Different? A Study of the Rust Project. In Proceedings of the IEEE/ACM 46th International Conference on Software Engineering, ICSE ’24, New York, NY, USA, 14–20 April 2024; Association for Computing Machinery: New York, NY, USA, 2024; pp. 1–13. [Google Scholar]
  15. Tan, Q.; Tan, J.; Gao, X. How does the online innovation community climate affect the user’s value co-creation behavior: The mediating role of motivation. PLoS ONE 2024, 19, e0301299. [Google Scholar] [CrossRef] [PubMed]
  16. Liu, G.; Li, Y. Research on the Impact of User Interaction on Value Co-creation Behavior-A Case Study of Online Fitness Community. Jiangxi Soc. Sci. 2021, 41, 197–207 + 256. [Google Scholar]
  17. Bui, T.; Jeng, J.F. Capture coproduction behavior in networking alumni communities: Progress from platform belongingness, knowledge sharing, and citizenship behavior. J. Enterprising Communities People Places Glob. Econ. 2022, 16, 46–73. [Google Scholar] [CrossRef]
  18. Ind, N.; Coates, N.; Lerman, K. The gift of co-creation: What motivates customers to participate. J. Brand Manag. 2020, 27, 181–194. [Google Scholar] [CrossRef]
  19. Zhao, J.; Tao, J.; Xiong, G. Online brand community climate, psychological capital, and customer value cocreation. Soc. Behav. Personal. Int. J. 2019, 47, 1–14. [Google Scholar] [CrossRef]
  20. Golicic, S.L.; Smith, C.D. A meta-analysis of environmentally sustain-able supply chain management practices and firm performance. J. Supply Chain Manag. 2013, 49, 78–95. [Google Scholar] [CrossRef]
  21. Hjorland, B. Why is meta analysis neglected by information scientists? J. Am. Soc. Inf. Sci. Technol. 2001, 52, 1193–1194. [Google Scholar] [CrossRef]
  22. Chen, X.M.; Wu, X.J.; Wang, X.Q.; Lan, H.L. A Qualitative Meta-Analysis Study on the Reverse Cross-border M&As Integration Process of Chinese Enterprises. J. Manag. World 2021, 37, 159–183 + 11–15. [Google Scholar] [CrossRef]
  23. Xie, X.M.; Chen, J.L. The multi-dimensional collaborative innovation of supply chain and firm performance: A test based on meta-analysis. J. Ind. Eng. Eng. Manag. 2022, 36, 20–36. [Google Scholar]
  24. Liu, Y.; Zhang, H.T.; Zhang, X.R.; Zhang, C.L. Influencing Factors of Users’ Online Health Information Seeking Behavior Based on MetaAnalysis. Inf. Sci. 2022, 40, 169–176. [Google Scholar]
  25. Zhang, H.Y.; Li, D.F.; Yao, Q. A meta-analysis on the relationship between high performance work system and firm performance in the context of China. Nankai Bus. Rev. 2012, 15, 139–149. [Google Scholar]
  26. Liu, Y.C.; Li, R.; Wang, Q.; Gao, Z.T.; Xie, N.C. Influencing Factors of Online Trust in Virtual Communities: Evidences from Meta-Analysis. Inf. Sci. 2021, 39, 32–39. [Google Scholar]
  27. Cooper, H. Research Synthesis and Meta-Analysis: A Step-by-Step Approach; Li, C.; Zhang, Y., Translators; Gu, G., Jin, J., Eds.; China Renmin University Press: Beijing, China, 2020. [Google Scholar]
  28. Xie, X.; Liu, X.; Chen, J. A meta-analysis of the relationship between collaborative innovation and innovation performance: The role of formal and informal institutions. Technovation 2023, 124, 102740. [Google Scholar] [CrossRef]
  29. Rosenthal, R. The file drawer problem and tolerance for null results. Psychol. Bull. 1979, 86, 638–641. [Google Scholar] [CrossRef]
  30. Wang, J.; Cheng, G.H.L.; Chen, T.; Leung, K. Team creativity/innovation in culturally diverse teams: A meta-analysis. J. Organ. Behav. 2019, 40, 693–708. [Google Scholar] [CrossRef]
  31. Higgins, J.P.T.; Thompson, S.G. Quantifying heterogeneity in a meta-analysis. Stat. Med. 2002, 21, 1539–1558. [Google Scholar] [CrossRef]
  32. Lipsey, M.W.; Wilson, D.B. Practical Meta-Analysis; Sage: Thousand Oaks, CA, USA, 2001. [Google Scholar]
  33. Li, Y.; Ren, L. Comparison of Virtual Learning Community Construction between China and the United States Based on KH Coder Text Data Mining. J. Educ. Educ. Res. 2024, 8, 205–211. [Google Scholar] [CrossRef]
  34. Leifels, K.; Bowen, P. The dark side of teamwork–the relationship between social stressors, social resources and team member well-being in monocultural and multicultural work teams. Cross Cult. Strateg. Manag. 2021, 28, 867–893. [Google Scholar] [CrossRef]
  35. Stahl, G.K.; Mäkelä, K.; Zander, L.; Maznevski, M.L. A look at the bright side of multicultural team diversity. Scand. J. Manag. 2010, 26, 439–447. [Google Scholar] [CrossRef]
  36. Rudolph, C.W.; Chang, C.K.; Rauvola, R.S.; Zacher, H. Meta-analysis in vocational behavior: A systematic review and recommendations for best practices. J. Vocat. Behav. 2020, 118, 103397. [Google Scholar] [CrossRef]
  37. Zhao, Y.; Chen, Y.; Zhou, R.; Ci, Y. Factors influencing customers’willingness to participate in virtual brand community’s value co-creation: The moderating effect of customer involvement. Online Inf. Rev. 2019, 43, 440–461. [Google Scholar] [CrossRef]
  38. Lee, E.S.; Park, T.Y.; Koo, B. Identifying organizational identification as a basis for attitudes and behaviors: A meta-analytic review. Psychol. Bull. 2015, 141, 1049–1080. [Google Scholar] [CrossRef]
  39. Hossain, M.A.; Jahan, N.; Fang, Y.; Hoque, S.; Hossain, M.S. Nexus of Electronic Word-Of-Mouth to Social Networking Sites: A Sustainable Chatter of New Digital Social Media. Sustainability 2019, 11, 759. [Google Scholar] [CrossRef]
  40. Gharib, R.K.; Garcia-Perez, A.; Dibb, S.; Iskoujina, Z. Trust and reciprocity effect on electronic word-of-mouth in online review communities. J. Enterp. Inf. Manag. 2019, 33, 120–138. [Google Scholar] [CrossRef]
  41. Kabir, Z.S.; Kang, K.; Sohaib, O. Perceived Subjective Norms Influence Continuance Intention in Augmented Reality Platforms: A User Experience Study. AMCIS 2024 Proceedings. 4. Available online: https://aisel.aisnet.org/amcis2024/cog_res/cog_res/4 (accessed on 25 February 2025).
  42. Cheriyan, J.; Savarimuthu, B.T.R.; Cranefield, S. Norm violation in online communities—A study of stack overflow comments. In Proceedings of the Coordination, Organizations, Institutions, Norms, and Ethics for Governance of Multi-Agent Systems XIII: International Workshops COIN 2017 and COINE 2020, Sao Paulo, Brazil, 8–9 May 2017 and Virtual Event, 9 May 2020; Revised Selected Papers; Springer International Publishing: Cham, Switzerland, 2021; pp. 20–34. [Google Scholar]
  43. Li, C.; Bernoff, J. Groundswell, Expanded and Revised Edition: Winning in a World Transformed by Social Technologies. J. Inf. Priv. Secur. 2011, 29, 75–78. [Google Scholar]
  44. Huang, M.C.; Chiu, Y.P.; Lu, T.C. Knowledge governance mechanisms and repatriate’s knowledge sharing: The mediating roles of motivation and opportunity. J. Knowl. Manag. 2013, 17, 677–694. [Google Scholar] [CrossRef]
  45. Roy, P.K.; Singh, J.P.; Baabdullah, A.M.; Kizgin, H.; Rana, N.P. Identifying reputation collectors in community question answering (CQA) sites: Exploring the dark side of social media. Int. J. Inf. Manag. 2018, 42, 25–35. [Google Scholar] [CrossRef]
  46. Easterby-Smith, M.; Lyles, M.A.; Tsang, E.W.K. Inter-organizational knowledge transfer: Current themes and future prospects. J. Manag. Stud. 2008, 45, 677–690. [Google Scholar] [CrossRef]
  47. Harrison, D.A.; Price, K.H.; Bell, M.P. Beyond relational demography: Time and the effectsof surface- and deep-level diversity on work group cohesion. Acad. Manag. J. 1998, 41, 96–107. [Google Scholar] [CrossRef]
  48. Stahl, G.; Maznevski, M.; Voigt, A.; Jonsen, K. Unraveling the effects of cultural diversity in teams: A meta-analysis of research on multicultural work groups. J. Int. Bus. Stud. 2010, 41, 690–709. [Google Scholar] [CrossRef]
  49. Williams, K.; O’Reilly, C. Demography and diversity in organizations: A review of 40 Years of research. In Research in Organizational Behavior; Staw, B.M., Cummings, L.L., Eds.; JAI Press: Greenwitch, CT, USA, 1998; Volume 20, pp. 77–140. [Google Scholar]
  50. Leifels, K. A quantitative analysis of the perception of social stressors and their effects amongmembers of culturally diverse work teams. J. Cult. Divers. 2020, 27, 65–68. [Google Scholar]
  51. Vigier, M.; Spencer-Oatey, H. The interplay of rules, asymmetries in language fluency, and team dynamics in culturally diverse teams: Case study insights. Cross Cult. Strateg. Manag. 2018, 25, 157–182. [Google Scholar] [CrossRef]
Figure 1. Data Collection and Sample Selection.
Electronics 14 01071 g001
Figure 2. Overall Effect on Value Co-creation Performance.
Electronics 14 01071 g002
Figure 3. Individual Layer on Value Co-creation Performance.
Electronics 14 01071 g003
Figure 4. Interaction Layer on Value Co-creation Performance.
Electronics 14 01071 g004
Figure 5. Environment Layer on Value Co-creation Performance.
Electronics 14 01071 g005
Table 1. Results of Heterogeneity Test and Publication Bias Test.
Heterogeneity TestPublication Bias Test
User Behavior AnalysisNumber of Effect Size (K)Q Valuep
Value
dfI2 (%)Fail-Safe N5 × K + 10Begg Tests the p-Value
Overall effect691433.1590.0006895.25562803550.988
Individual Layer27323.4180.0002691.96111101450.393
 Self-efficacy960.0000.000886.6672029550.754
 Social Identity819.5670.007764.225343500.266
 Enjoyment6144.0460.000596.529644400.707
 Belonging45.7780.123348.081258300.308
Interaction layer24495.1320.0002396.35595311300.535
 Information Support7117.0910.000694.876712450.548
 Social Interaction620.0650.001575.081724400.707
 Trust 6183.4010.000597.274490400.707
 Reciprocity5108.3320.000496.308465350.462
Environment layer18596.5760.0001797.15081861000.970
 Shared Values688.7910.000594.369658400.707
 Incentives476.4680.000396.077263300.308
 Community Culture4138.2380.000397.830417300.734
 Subjective Norms442.1280.000392.879779300.734
Table 2. Results of the Overall Effect Test.
Number of Effect SizesSample SizeEffect Size (r)95% Confidence IntervalZ Value
Fixed effect model6930,0160.3820.372~0.39269.454 ***
Random effects model6930,0160.4050.360~0.44815.941 ***
Significance level: *** p < 0.01.
Table 3. Results of Relationship Test of Different Layers’ User Behavior on Value Co-Creation in HCI.
User Behavior AnalysisModelsNumber of
Effect Sizes
Sample SizeEffect Size95% Confidence
Interval
Z Value
Individual LayerFixed effect model2790720.4080.391~0.42541.086 ***
Random effects model2790720.3970.333~0.45711.218 ***
 Self-efficacyFixed effects model930830.4920.464~0.51829.746 ***
Random effects model930830.4920.414~0.56310.784 ***
 Social IdentityFixed effects model823940.2680.231~0.30513.393 ***
Random effects model823940.2610.197~0.3237.687 ***
 EnjoymentFixed effect model624150.4150.382~0.44821.642 ***
Random effects model624150.3880.188~0.5573.658 ***
 BelongingFixed effects model411800.4320.384~0.47715.795 ***
Random effects model411800.4380.370~0.50111.321 ***
Interaction layerFixed effects model24113760.3570.341~0.37339.740 ***
Random effects model24113760.3770.300~0.4508.875 ***
 Information SupportFixed effect model748880.2890.263~0.31420.733 ***
Random effects model748880.3150.187~0.4324.676 ***
 Social InteractionFixed effects model621070.4600.425~0.49322.712 ***
Random effects model621070.4520.378~0.52110.581 ***
 Trust Fixed effects model623680.3600.324~0.39418.243 ***
Random effects model623680.3520.119~0.5482.906 ***
 ReciprocityFixed effect model520130.4040.367~0.44019.157 ***
Random effects model520130.4060.197~0.5803.653 ***
Environment layerFixed effects model1895680.3860.369~0.40339.680 ***
Random effects model1895680.4520.348~0.5457.691 ***
 Shared ValuesFixed effects model621470.4370.402~0.47121.637 ***
Random effects model621470.4120.251~0.5514.731 ***
 IncentivesFixed effect model440660.2220.193~0.25114.383 ***
Random effects model440660.3330.144~0.4983.377 ***
 Community CultureFixed effect model412570.5080.465~0.54819.739 ***
Random effects model412570.5320.207~0.7513.035 ***
 Subjective NormsFixed effects model420980.5400.509~0.57027.583 ***
Random effects model420980.5360.412~0.6417.280 ***
Significance level: *** p < 0.01.
Table 4. Subgroup Analysis Results of the Moderating Variables.
Moderating VariablesNumber of Effect SizesEffect Size (r)95% Confidence IntervalsZ-ValuesI2Qdf
Location factorChinese community430.4420.396~0.48516.93892.478558.339 ***42
International community220.3200.220~0.4136.02796.786653.327 ***21
Inter-group heterogeneity 5.388 **1
Cultural differencesMonoculture540.4220.372~0.46815.17394.7811015.481 ***53
Multiculture110.3010.195~0.3985.42493.815161.686 ***10
Inter-group heterogeneity 4.706 **1
Community
Type
Interest-oriented community350.3910.326~0.45110.99794.855660.886 ***34
Transaction-oriented Community160.3900.274~0.4946.22596.536432.983 ***15
Relationship-oriented Community80.4320.309~0.5416.35196.003175.134 ***7
Mixed Community60.4570.364~0.5418.66986.11736.016 ***5
Inter-group heterogeneity 1.6943
Empirical research methodsStructural equations560.4300.383~0.47416.26594.263958.755 ***55
OLS130.2870.180~0.3865.14795.089244.362 ***12
Inter-group heterogeneity 6.622 **1
Performance measurementSubjective willingness to cooperate170.5100.452~0.56214.83491.443186.985 ***16
Objective cooperative behavior420.3500.295~0.40311.66494.084693.037 ***41
Subjective + Objective50.314 3.73292.67754.626 ***4
Inter-group heterogeneity 17.711 ***2
Significance level: ** p < 0.05, *** p < 0.01.
Disclaimer/Publisher’s Note: The statements, opinions and data contained in all publications are solely those of the individual author(s) and contributor(s) and not of MDPI and/or the editor(s). MDPI and/or the editor(s) disclaim responsibility for any injury to people or property resulting from any ideas, methods, instructions or products referred to in the content.

