1. Introduction
Recommender systems provide recommendations based on user preferences or past interactions. Common methods for recommendation include collaborative filtering, content-based filtering, and matrix factorization [
1], while recent approaches use machine learning and deep learning techniques. Previous studies have primarily focused on improving the accuracy of recommendations; however, explaining the reasoning behind these recommendations can enhance user trust and improve the interpretability of the recommendation system.
Explainable recommendations provide comprehensible explanations for recommended items, such as “This item is recommended because you like this brand”. Some systems employ user reviews as input for explanation generation, utilizing the richness, diversity, and context-awareness of natural language to produce recommendations that users can easily understand. As a result, explainable recommendations have emerged as an important research area in recent years.
Approaches for generating textual explanations, in general, include template-based methods [
2,
3,
4,
5] and natural language generation (NLG) methods [
6,
7,
8,
9,
10,
11,
12]. Template-based methods use predefined templates, extracting features or keywords to fill the blanks in the templates to produce explanations. These approaches have limited diversity and are very time-consuming because they require predefined templates and feature extraction.
NLG-based methods, on the other hand, employ models to generate textual explanations. Recurrent Neural Networks (RNNs) were traditionally employed in this domain. However, contemporary research has demonstrated that Transformer-based architectures [
13] offer enhanced performance. These models process sentences in parallel using attention mechanisms. For example, the PETER+ model [
10] incorporates review-related keywords to aid explanation generation, while the MMCT model [
8] enhances the process by integrating sentiment analysis and visual elements. Despite these advancements, existing methods still face challenges in generating personalized explanations.
The generation of personalized explanations can benefit from an analysis of user preferences, item features, and user review information. For example, the words used in a user’s reviews of high-rated items often differ from those of low-rated items, reflecting individual preferences that can serve as a basis for customized explanations. Although ratings have been considered in previous research, the primary focus is on rating prediction rather than improving explanation quality. By learning the relationship between personalized ratings and review vocabulary, recommendation systems can generate more tailored explanations.
Moreover, reviews highlight the aspects of interest to the user related to the item. The titles of items frequently reflect their theme and characteristics. Enabling the model to focus on item titles can yield explanations that are more relevant to the attributes of items. Additionally, users’ attention to specific features in their reviews reveals their personal preferences. Extracting feature-related keywords from user reviews can help discriminate between individual preferences so that the explanations can align with users’ interests. Summarizing review features can significantly improve the quality of personalized explanations in explainable recommender systems.
To address these challenges, we propose the EPER (Enhanced Personalized Explainable Recommendation) model, which enhances the personalization and interpretability of explainable recommendation systems. The key contributions of this work are as follows:
Transformer-based explanation generation: Unlike prior methods that rely on RNN-based models, our approach employs Transformer architectures for improved parallel processing and contextual understanding.
Customized attention masking mechanism: We introduce a masking technique that prevents interference between the rating prediction and explanation generation tasks, improving the overall effectiveness of personalized recommendations.
Feature handling for personalized explanations: The model incorporates feature-related keywords extracted from user reviews and item titles to generate more relevant and personalized textual explanations.
Performance gains without image processing: Unlike MMCT [
8], which requires image information for improved performance, our model achieves competitive or superior results without the need for image data, making it more flexible for practical applications.
Extensive empirical validation: We conduct comprehensive experiments on public datasets, demonstrating that EPER outperforms well-known models (e.g., NETE, PETER+, MMCT) in both rating prediction and explanation generation tasks.
The remainder of this paper is organized as follows:
Section 2 reviews related work on explainable recommendation models, covering both traditional template-based and modern neural-based approaches.
Section 3 introduces the proposed EPER model, detailing its architecture.
Section 4 describes the experimental setup, datasets, evaluation metrics, and comparative analysis with state-of-the-art models.
Section 5 concludes the paper.
2. Related Work
Explainable recommendation aims to generate human-interpretable justifications for suggested items while maintaining recommendation accuracy. In the literature, however, the terms “justification” and “explanation” are often used interchangeably. It is important to note that justifications generally refer to natural language statements that rationalize a model’s decisions, whereas explanations encompass a broader set of interpretability techniques—including context prediction, personalized feature handling, and other model-internal insights. In this work, our focus is on generating explanations that integrate these diverse interpretability strategies.
2.1. Template-Based Methods
Early research in explainable recommendation relied on template-based methods, which generate explanations by extracting structured product information (e.g., features, ratings, or keywords) and fitting them into predefined sentence templates. Representative works such as EFM [
5], TriRank [
2], and sCVR [
4] apply phrase-level sentiment analysis to extract important aspects from user reviews and map them into fixed template-based sentences that align with user interests. NARRE [
14] extends this approach by incorporating attention mechanisms to select relevant user reviews and present them as explanations.
Despite their interpretability, template-based methods suffer from limited adaptability and diversity, as they rely on manually predefined sentence templates. This lack of flexibility prevents them from generating highly personalized explanations tailored to individual user preferences. Moreover, manually constructing templates requires domain-specific expertise, making these methods less scalable for diverse recommendation scenarios.
2.2. RNN-Based and Hybrid NLG Methods
To improve upon template-based approaches, RNN-based NLG methods introduced more flexible text generation capabilities by leveraging deep learning. One of the first hybrid approaches, NETE [
3], integrates template-based methods with neural generation techniques. It employs a Multi-Layer Perceptron (MLP) for rating prediction and a Gated Fusion Recurrent Unit (GFRU) for explanation generation. The GFRU consists of two GRU components: one for generating item feature words and another for sentence context words, with a Gated Fusion Unit (GFU) determining the final explanation at each time step.
Further improvements were introduced by SAER [
11], which focuses on sentiment alignment between generated explanations and the predicted rating score. It incorporates Sentiment and Attribute Gates into a GRU-based model, allowing word selection to be directly influenced by the recommender module. This approach ensures that explanations are emotionally aligned with user expectations, improving personalization.
Additional developments in this category include ACMLM [
15], which introduced personalized generation models for explanation tasks. R3 [
16] enhances recommendation accuracy and explainability by extracting rationales from reviews, reducing spurious correlations. Despite these improvements, RNN-based models struggle with long-range dependencies, making them less effective in capturing complex contextual information. Additionally, their sequential nature prevents efficient parallelization, resulting in slower training and inference times compared with Transformer-based models.
2.3. Transformer-Based NLG Methods
With the emergence of self-attention mechanisms in Transformer-based architectures, explainable recommendation models have significantly improved in terms of efficiency, contextual learning, and parallel computation. Unlike RNNs, Transformers allow global dependencies across words, making them more effective at generating coherent and context-aware explanations. We briefly review the Transformer architecture [
13] here.
The Transformer model leverages a self-attention mechanism that evaluates the importance of each word in the context of all other words in a sentence. This approach allows the model to capture global dependencies. Unlike RNNs that process words sequentially, Transformers consider the entire input simultaneously. This global view enhances the model’s ability to understand context and generate more coherent explanations. The approach also enables parallel processing by processing tokens in parallel to substantially reduce training and inference times, which is especially beneficial when dealing with large datasets. It also enhances contextual learning because the self-attention mechanism dynamically weighs the contribution of each word, leading to richer representations that improve both rating prediction and explanation generation.
Despite these advantages, Transformers come with challenges. Their parallel architecture demands significant computational resources and memory, making them computationally intensive compared with RNNs. Furthermore, while the self-attention mechanism enhances performance, it can also lead to difficulties in interpreting which specific parts of the input most strongly influence the final output.
One of the first Transformer-based models for explainable recommendations, PETER+ [
10], employs a Transformer decoder to generate explanations while simultaneously predicting user ratings. It takes as input user IDs, item IDs, preprocessed feature words, and summary reviews, using customized attention masking to restrict unnecessary interactions between input components. While PETER+ provides high-quality textual explanations, it lacks dynamic feature integration, limiting its ability to adapt to missing or incomplete interaction data.
Building upon PETER+, MMCT [
8] introduces multi-modal fusion, incorporating textual features, sentiment attributes, item images, and user reviews to enhance explanation diversity. It applies contrastive learning to improve personalization, using a Transformer-based encoder to model user–item relationships and a Transformer decoder for explanation generation. While MMCT demonstrates strong performance, its reliance on image-based features makes it less practical for scenarios where visual content is unavailable.
Another notable Transformer-based approach, PEPLER [
17], employs pretrained language models for generating personalized explanations. It introduces discrete and continuous prompt learning techniques, treating user and item IDs as prompts to enhance the model’s understanding of recommendation contexts. Unlike standard Transformer architectures, PEPLER benefits from pretraining on large-scale text corpora, improving fluency and coherence in generated explanations.
In addition to the works discussed above, several studies have specifically focused on natural language justifications. For example, a comprehensive survey on “Explanation and Justification in Machine Learning” that delineates the differences between natural language justifications and broader explanations is provided in [
18]. Other notable works, such as those corresponding to [
19,
20,
21], have also investigated justification generation strategies. While these studies primarily address justification—defined as natural language statements that rationalize decisions—our work focuses on generating broader explanations that integrate multiple interpretability techniques.
2.4. EPER: Enhancing Transformer-Based Explanation Models
Our proposed EPER (Enhanced Personalization for Explainable Recommendation) model builds upon Transformer-based NLG techniques while addressing key limitations of prior models.
EPER improves upon PETER+ by introducing a feature-handling mechanism that dynamically estimates missing interaction features during inference. Unlike previous models that rely solely on preprocessed feature words, EPER incorporates user–item features extracted from user reviews, ensuring that personalized explanations can be generated even when explicit feature data is missing.
In addition, EPER introduces a customized attention masking mechanism to prevent interference between rating prediction and explanation generation tasks. Prior models, such as NETE and SAER, often struggle to balance recommendation accuracy with explanation quality, as they tend to overemphasize either rating prediction or explanation generation. EPER effectively resolves this issue by employing multi-task learning, optimizing both objectives simultaneously.
Unlike MMCT, which requires multi-modal inputs, EPER achieves comparable or superior performance using only textual data. This makes EPER particularly useful in text-only recommendation settings, where additional image or sentiment features are unavailable. Moreover, compared with PEPLER, which leverages pretrained Transformers, EPER explicitly models user–item interactions and personalized feature selection, ensuring that generated explanations remain highly relevant to individual users.
2.5. Recent Advances in Explainable Recommendation
Beyond NLG-based methods, knowledge-enhanced and reinforcement learning approaches have emerged to further improve explainability. SKGAN (Social-Enhanced Knowledge Graph Attention Network) [
22] integrates social network data with knowledge graphs, allowing for explainable recommendations that incorporate user relationships. Similarly, KRRL [
23] applies reinforcement learning to enhance knowledge-aware reasoning in explainable recommendations. SERMON [
24] integrates multi-modal contrastive learning to better model user preferences and item characteristics, facilitating reciprocal learning between textual and visual modalities for improved explainability.
Other recent advancements include PR4SR [
25], which utilizes hierarchical reinforcement learning for session-based recommendations, and CrossDR-Gen [
26], which incorporates spatial–temporal disentanglement representation to improve next-POI (point of interest) recommendations. These techniques demonstrate alternative strategies for explainable recommendations beyond Transformer-based NLG models.
3. Proposed Model
The goal of explainable recommendation is to provide a predicted rating and explanation for the recommended item. Given a user ID u and an item ID i, rating prediction is to predict the user’s rating for the item, denoted as . The explanation generation is to generate an explanation for the user u with respect to the item i, denoted as , where , is the t-th word in the explanation, 1 ≤ t ≤ T, and T is the length of the explanation.
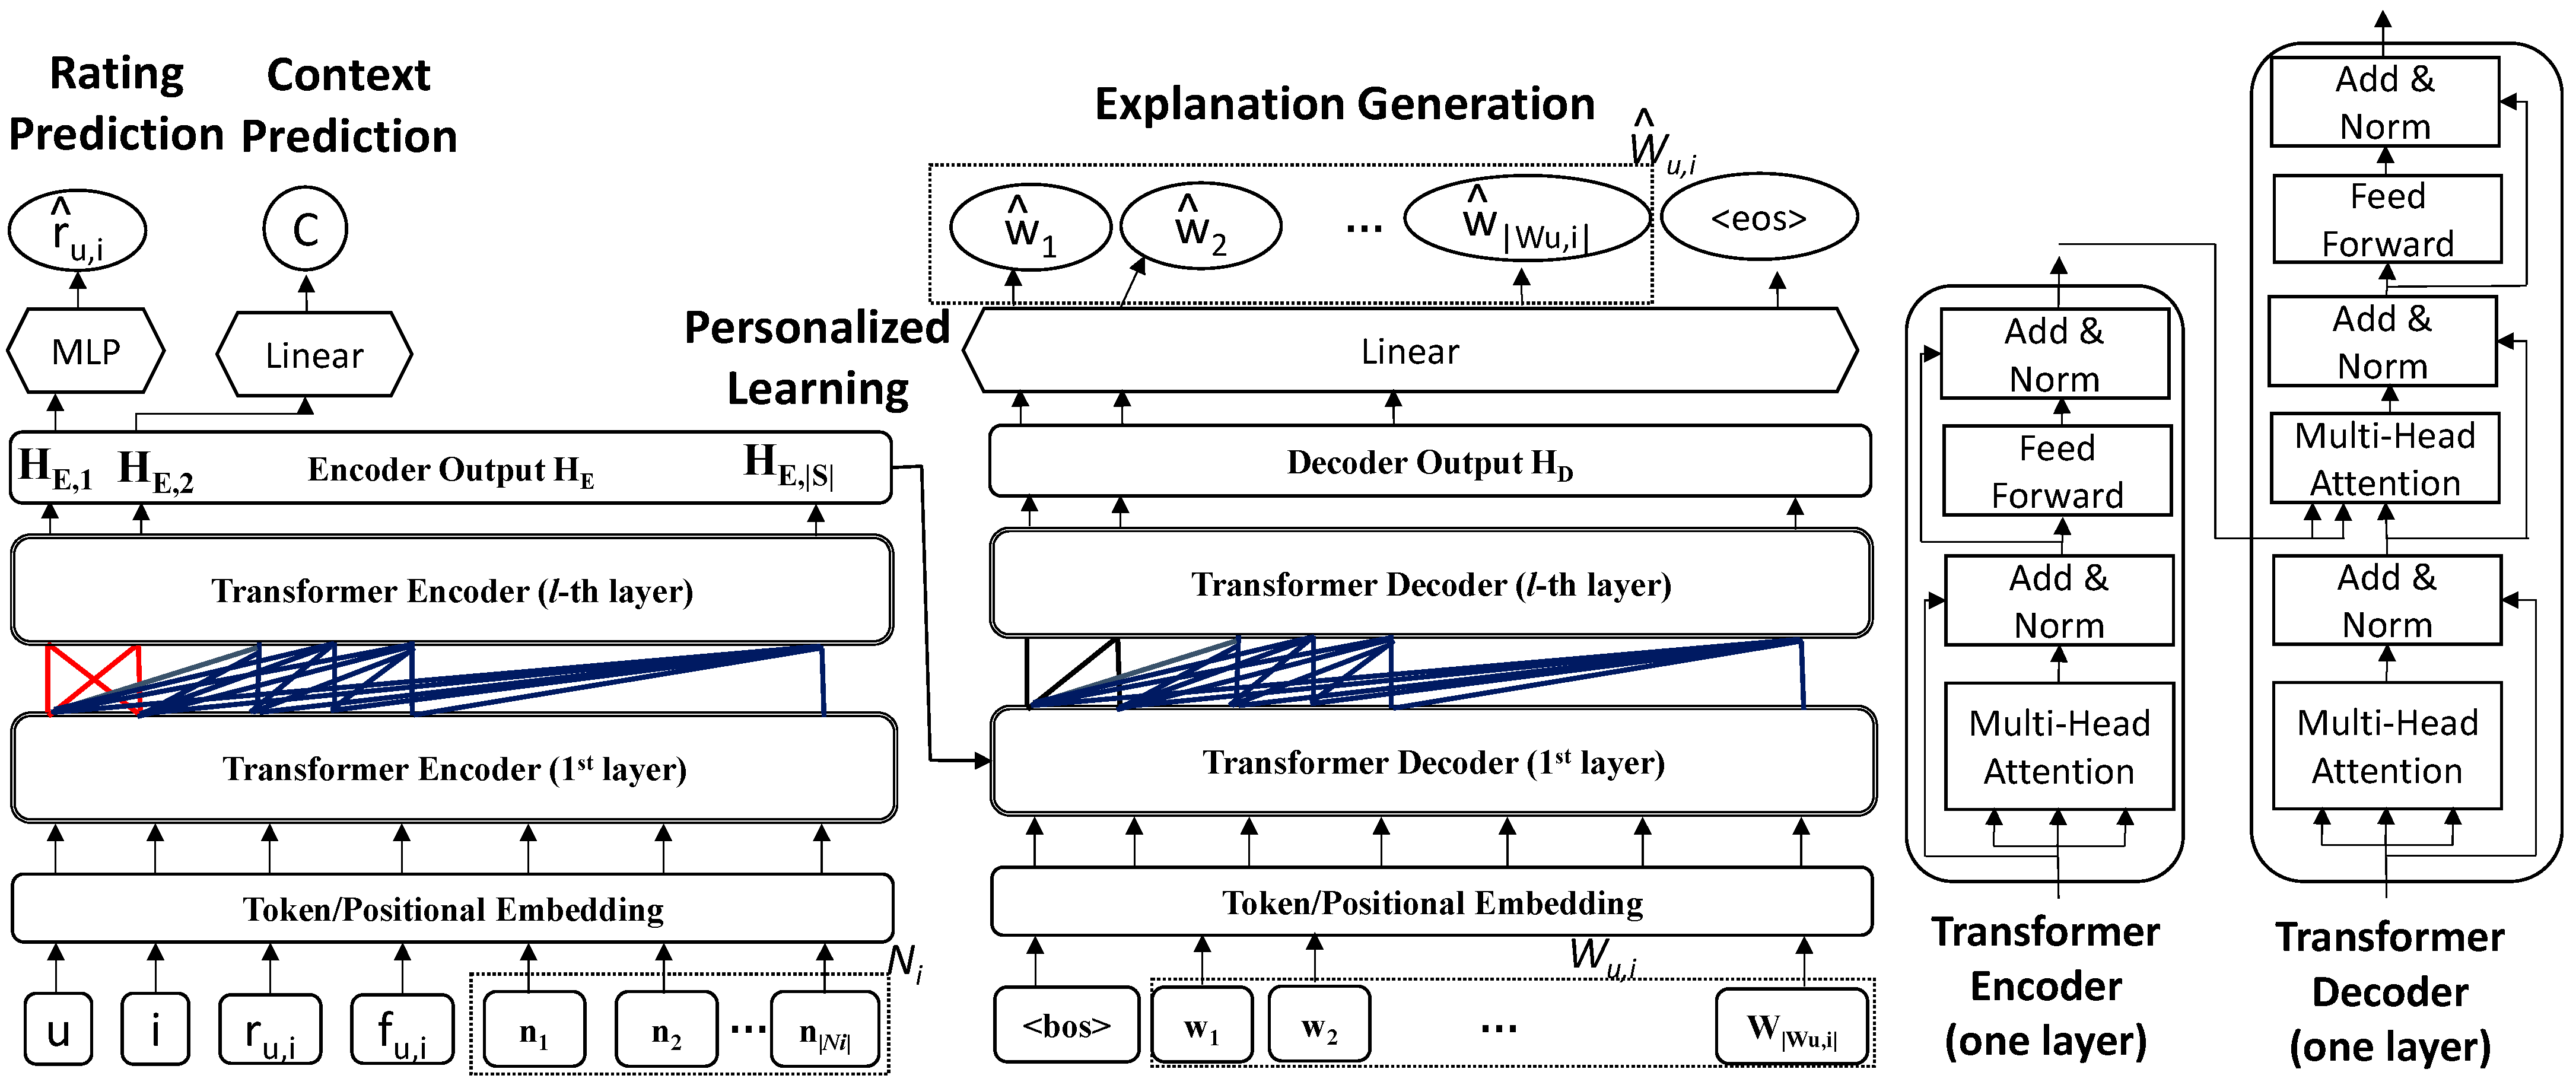
Figure 1 shows the overall architecture of the proposed EPER (Enhanced Personalization for Explainable Recommendation) model. In
Figure 1, the encoder block is depicted as consisting of multiple layers, each of which contains a multi-head self-attention layer followed by a position-wise feed-forward network. Residual connections and layer normalization accompany each sublayer to ensure stability during training. The decoder block is similarly structured, but with a key difference: it incorporates a masked multi-head self-attention layer in the first stage to prevent the decoder from accessing future tokens, followed by an encoder–decoder attention layer that fuses contextual information from the encoder, and finally a feed-forward network with the same residual and normalization operations. The Transformer encoder and Transformer decoder both contain two identical layers in our study.
The EPER performs two tasks using the Transformer: rating prediction and explanation generation. During the construction (training) of the model for explainable recommendation, an input sequence S and the corresponding review are provided, where (1 ≤ i ≤ |Wu,i|) is a word in the vocabulary and |Wu,i| is the length of the review. The sequence contains u, i, the rating of user for item , the feature words in user ’s review for item , and the corresponding item name for item (Ni = {n1, n2, …, n|Ni|}, where ni (1 ≤ i ≤ |Ni|) is a word in the vocabulary). The input to the Transformer encoder consists of corresponding embeddings, including user embeddings. The <bos> is the beginning-of-sentence token.
The task of rating prediction is to find the relationship between user–item pair () and its rating ru,i. After training, the Transformer encoder learned the relationship, and the first element of the encoder output (the hidden layer ) is used to predict the rating .
The task of explanation generation produces corresponding explainable text. It is aided by two subtasks, one subtask performs context prediction (C) on ; the other subtask performs personalized learning, which captures the important information from the input sequence by the Transformer encoder, as the output hidden layer (). The entire is input into the Transformer decoder to generate the explanation text (the review text), i.e., the explanation generation task. The results are output as the (decoder) hidden layer () representation, and text explanations () are generated one by one.
3.1. Rating Prediction
The user–item ID pair (
) is fed into the Transformer encoder, with the resulting output denoted as
. The (
u,
i) is passed to the embedding layer with the positional coding and then added up as the input for the later layers, like common Transformer input. The attention mechanism in the Transformer may learn the interactions of (
u,
i). A Multi-Layer Perceptron (MLP) processes
, applying the sigmoid activation function to produce the numerical rating score, denoted as
:
where
,
,
,
. Here,
is the sigmoid function, W
1 and W
2 are weight parameters, b
1 and b
2 are bias, and
d is the dimensionality.
For the rating prediction task, we use Mean Square Error (MSE) as the loss function, and the loss of rating prediction
Lr is computed as
where
is the ground-truth rating,
is the predicted rating,
is the size of user–item pairs in the training set τ.
3.2. Context Prediction and Personalized Learning
Context prediction and personalized learning are two subtasks used to assist the explanation generation task. Context prediction captures interactions from user–item pairs (u, i) and produces the corresponding result. The result is converted into a probability distribution over all words in the vocabulary so as to correspond to the probability differences in words in the actual review explanation. Personalized learning uses a customized masking with the Transformer encoder to learn the attention relationships among (u,i) interactions and then inputs into the Transformer decoder to assist the explanation generation, ultimately improving the overall effectiveness of generating explanations. The processes of the two subtasks are described below.
Context Prediction As illustrated in
Figure 1, the context prediction module leverages the hidden representation produced by the Transformer encoder, denoted as
HE. Notably,
HE is composed of multiple elements, and we empirically select the second element,
HE,2, because it has been found to capture essential contextual nuances from the user–item interactions. By applying a linear transformation (with weight matrix W and bias b) to
HE,2, followed by the softmax function [
13], we obtain a probability distribution over the vocabulary V:
where
is a vector of size |V|,
is weight parameters,
is bias, and
d is the dimensionality. This formulation ensures that each component of C reflects the likelihood of the corresponding token, thereby guiding the explanation generation process.
In context prediction tasks, we use Negative Log-Likelihood (NLL) as the loss function, and the loss of context prediction
Lc is computed as:
where in
represents the corresponding word at time step
in the actual review
,
represents the probability value in
corresponding to each word contained in
,
represents the length of the review text,
is the size of user–item pairs in the training set τ.
Personalized Learning As shown in
Figure 1, sequence S =
, after item embedding and positional embedding, is passed to the Transformer encoder to learn the interactions of user, item, rating, focused features, and item titles. Note that a custom masking method [
10] is used to capture the relationships between sequences while preventing interference between the rating prediction and explanation generation tasks. The custom masking method allows the mutual attention between
and
only, without referencing other information in the sequence S. The other elements in S can attend to one another using standard attention computations. The output is represented as
[
], where
captures the personalized learning feature representations of (
), aiding in the subsequent explanation generation task.
3.3. Explanation Generation
The input for explanation generation, comprising the personalized representation HE, a special token <bos>, and , is processed by the Transformer decoder, after item embedding and positional encoding. Similar to a standard Transformer, for each output position, the model uses the input sequence up to t − 1 and at time step t to predict current word . The final explanation is .
Let the output of the Transformer decoder be represented as
[
]. Using the softmax function, the output probability results are represented as
. The probability distribution for the
t-th word is computed as
where
is a vector of size |V|,
is weight parameters,
is bias, and
d is the dimensionality. Then, the predicted word
is the word of highest probability in the vocabulary. In explanation generation task, we use the NLL as the loss function, and the loss of explanation generation
Le is computed as
where in
represents the corresponding word at time step
in the actual review
,
represents the probability value in
, corresponding to each word contained in
,
is the length of the review,
is the size of user–item pairs in the training set τ.
3.4. Model Optimization and Model Inference
The overall model architecture integrates the loss from various tasks for optimization. The total loss
L is computed as
where
, and
are the respective weight coefficients for
Lr,
Lc, and
Le.
When the model is used to predict the rating and the explanation during model inference, the only input required are u, i, fu,i, and Ni. The rating prediction uses u, i, and the hidden representation HE, and produces the rating . The explanation generation takes fu,i, Ni, and <bos> to generate the final explanation .
3.5. User–Item Feature
The proposed EPER model, along with existing explainable recommendation models such as PETER+ [
10] and MMCT [
8], incorporates user–item features
during inference. However, in real-world applications, these features are often unavailable because they are typically extracted from historical user reviews. This issue is particularly critical when making recommendations for new interactions, where the user has not provided a prior review for the item.
Example: Consider an e-commerce platform where a user purchases a newly released product. Since the user has not written a review for this product, existing explainable recommendation models cannot directly retrieve feature-based user preferences (e.g., “comfortable fit” and “durable material”). As a result, models relying solely on textual review-based feature extraction may fail to generate meaningful personalized explanations.
To address this challenge, we propose a feature-generation mechanism using a Transformer encoder. This mechanism predicts user–item features dynamically by leveraging user history and similar item attributes, enabling the model to generate explanations even in cases where interaction-based features do not exist. This method ensures that EPER remains effective in real-world scenarios, where explicit feature-based reviews are not always available.
The preprocessing uses a Transformer encoder. The Transformer encoder inputs a user–item pair (
u,
i), the output of the feature vector
HE,2 from the second hidden layer of the Transformer encoder is utilized for the prediction. The
HE,2 is processed using the softmax function, converting the output into a probability, denoted as
F, representing the probability distribution of all feature tokens in the feature set
VF as follows:
where
is a vector of size |
Vf|,
is the weight parameter, and
is the bias, d is the dimensionality, and
Vf is the feature set of user
u for item
i. Then, we apply the argmax function to extract the feature with the highest corresponding probability and treat it as the predicted feature:
.
In this feature prediction, we use NLL as the loss function, and the loss of feature prediction
LF is computed as
where in
,
represents the ground-truth feature,
represents the probability value in
corresponding to feature,
is the size of user–item pairs in the training set τ.
Finally, the substitutes the in the inference phase of the described model EPER, and this practically used model is named EPER_F.
4. Experiments
To evaluate the effectiveness of the proposed EPER model, we conduct a series of experiments using public datasets and compare our results with existing baseline methods. This section details the experimental setup, datasets, baseline models, and evaluation metrics. We present comprehensive results on both explanation generation and rating prediction tasks, followed by a comparative analysis across different datasets. Additionally, an ablation study is conducted to analyze the impact of various design choices in our model. The experimental findings demonstrate the advantages of EPER over competing methods, particularly in generating high-quality, personalized explanations while maintaining competitive rating prediction performance.
4.1. Experimental Datasets and Setup
To assess the performance of the proposed EPER model, we conducted comprehensive experiments using well-established public datasets. The Amazon (
https://cseweb.ucsd.edu/~jmcauley/datasets/amazon/links.html, accessed on 10 January 2024) e-commerce dataset [
3,
5,
6,
8,
10,
14,
15,
16,
17,
24], specifically its Clothing, Shoes, and Jewelry and Movies and TV subsets, as well as the Yelp (
https://www.yelp.com/dataset, accessed on 10 January 2024) Challenge 2019 dataset [
2,
4,
6,
9,
11,
12,
14,
16,
22], were selected based on their widespread usage in explainable recommendation research. These datasets have been utilized in prior studies to evaluate personalized recommendation models and natural language generation for recommendation explanations [
2,
3,
4,
5,
6,
8,
9,
10,
11,
12,
14,
15,
16,
17,
22]. Their rich textual reviews, user–item interactions, and structured rating information make them ideal for both rating prediction and explanation generation tasks. Unless otherwise specified, the dataset used in the following context is the Amazon Clothing dataset.
While the Amazon e-commerce and Yelp Challenge datasets are widely used benchmarks for explainable recommendation tasks, we acknowledge that these datasets are primarily focused on e-commerce and service-based domains. The generalizability of the EPER model to other domains, such as healthcare, education, or financial services, depends on the availability of structured user–item interactions and textual reviews. Since the EPER model relies on Transformer-based architectures, it can learn meaningful representations from domain-specific text, making it adaptable with appropriate fine-tuning.
To address concerns about unreliable or low-quality data, our model incorporates attention mechanisms that emphasize relevant content while reducing noise from uninformative reviews. Additionally, feature extraction techniques, such as sentiment analysis and aspect-based filtering, help mitigate issues related to data sparsity and inconsistent review quality. Future research may explore domain adaptation techniques, such as pretraining on diverse datasets or incorporating external knowledge graphs, to further enhance the robustness of EPER across different domains.
Table 1 presents the statistics of the datasets after preprocessing. The data preprocessing method is the same as modern research for explainable recommendations: using a phrase-level sentiment analysis toolkit [
27] to preprocess text reviews. Each review includes a user ID, item ID, rating (1–5), a review explanation, and a feature word. The top 20,000 most frequent words are retained as the vocabulary
V. The dataset is randomly divided into three subsets: 80% for training, 10% for validation, and 10% for testing. The testing set ensures that each user and item is included in the training set. Each user and item in the training set has at least one review.
Our experimental datasets represent large-scale benchmarks in the research on explainable recommendations: the Amazon Clothing dataset contains 179 K records, Amazon Movies comprises 441 K records, and the Yelp dataset includes 1.293 M records. These figures illustrate that EPER has been evaluated on data of substantial size.
With respect to performance evaluation, rating prediction uses metrics Root Mean Square Error (RMSE) and Mean Absolute Error (MAE), where lower scores indicate better performance. The evaluation of explanation generation includes two aspects: the quality of the generated text reviews and the level of personalization. The quality of the generated reviews is assessed by two common metrics: BLEU (Bilingual Evaluation Understudy) [
28] and ROUGE (Recall-Oriented Understudy for Gisting Evaluation) [
29] are metrics used to evaluate the quality of generated text. Higher scores in these metrics indicate that the generated text is more similar to the actual text, suggesting better explanation generation quality. The level of personalization is evaluated using three metrics [
3]: Feature Matching Ratio (FMR), Feature Coverage Ratio (FCR), and Feature Diversity (DIV). Among these, only a lower DIV score signifies better performance.
In addition to the standard BLEU and ROUGE metrics for assessing text quality, we evaluate the level of personalization using three metrics: Feature Matching Ratio (FMR), Feature Coverage Ratio (FCR), and Feature Diversity (DIV). Their formulas are defined as follows:
where
denotes the explanation generated for the user–item pair (
u,i),
represents the feature words present in the ground-truth summary review. |
N| represents the total number of generated sentences.
() is an indicator function: it equals 1 if the generated explanation contains a feature word from the ground-truth summary review; otherwise, it equals 0, indicating that the feature word is not included.
where |
F| represents the total number of feature terms in the entire dataset, and
Ng denotes the number of distinct feature terms included in the generated explanations.
where |
N| denotes the total number of user–item summary reviews in the test set.
and
represent the feature sets corresponding to two different user–item pairs, respectively.
The experimental model was implemented using Python 3.8.16 and PyTorch 2.0.0 with CUDA 11.7 support, the GPU was NVIDIA GeForce RTX 2080 Ti. The training parameters were set as follows: maximum training epochs (Epoch): 100, embedding size (d): 512, Transformer layers and Attention Heads (H): 2, feed-forward neural network size: 2048, MLP layers: 2, and : 0.1, 1.0, 1.0, optimization: SGD, batch size: 128, and : 15. On the Amazon Clothing dataset, the model requires approximately 2.4 min per epoch for training, while on the Yelp dataset the training time is about 6.9 min per epoch. These measurements were obtained under identical conditions using a batch size of 128. Such results demonstrate that the EPER model is computationally efficient, making it suitable for practical applications in real-world recommendation systems.
4.2. Baseline Models
In this study, the baseline models are categorized into two tasks: rating prediction and explanation generation. Of these baseline models, only ACMLM [
15] excludes a rating prediction component.
ACMLM [
15]: Uses fine-tuned BERT [
30] to generate personalized and diverse explanations.
NETE [
3]: Utilizes a customized GRU model to learn and integrate specific features into sentence templates for better explanation generation.
PETER+ [
10]: Incorporates personalized Transformer models with user and item IDs and feature words to aid in explanation generation.
SAER [
11]: Employs a GRU model and includes an emotion alignment task, enabling recommendations to directly influence explanation generation.
MMCT [
8]: Utilizes a personalized Transformer model to integrate multi-modal information and uses contrastive learning to generate explanations, improving quality. Requires item images for generating recommendation explanations.
4.3. Experimental Results
In this subsection, we present the experimental results of the EPER model, focusing on its performance in explanation generation and rating prediction compared with baseline models. We evaluate the quality of generated explanations using standard NLP metrics such as BLEU and ROUGE, followed by an analysis of personalization effectiveness through FMR, FCR, and DIV metrics. Next, we assess the model’s accuracy in rating prediction using RMSE and MAE. Additionally, we compare EPER across different datasets and conduct an ablation study to examine the impact of various design components. These results collectively highlight the strengths of EPER in producing personalized, high-quality recommendation explanations while maintaining strong predictive performance.
4.3.1. Performance of Explanation Generation
Table 2 shows the performance of different methods on the Amazon Clothing dataset. In the following context, bold scores indicate the best performance in each row, while underlined scores indicate the second best. Improv.(
%) shows the improvement percentage of our proposed EPER model to the best model. In the table, “⭡” indicates that a higher value is better for the metric, and “⭣” indicates that a lower value is better.
Compared with ACMLM, NETE, SAER, and PETER+, MMCT shows only a small enhancement in text quality. When compared with the explainable recommendation methods mentioned above, our proposed EPER model demonstrates superior performance in text quality metrics (BLEU and ROUGE), as shown in
Table 2. The EPER model outperforms other explanation generation methods in most indicators, with improvements of 1.71% in R1_P, 0.86% in R1_F, 3.27% in R2_P, 0.11% in R2_R, and 1.94% in R2_F. However, it slightly underperforms MMCT in B1, B4, and R1_R, with gaps of 4.44%, 2.3%, and 1.23%, respectively.
Next, we evaluate metrics using FMR, FCR, and DIV to measure the level of personalization in the generated text. As shown in
Table 2, our EPER model outperforms or performs on par with all the other methods, indicating that our EPER model not only generates specific item features but also effectively incorporates feature information in the decoding generation process, making the explanations more personalized. Compared with the second-best method, our model achieves a 1.05% improvement in FMR, a 6.82% improvement in FCR, and performs equally well in DIV.
EPER’s superiority is highlighted by its significant improvements in key performance indicators. Although EPER shows slight underperformance in B1, B4, and R1_R compared with MMCT, its enhancements in personalization metrics (FMR and FCR) and in-text quality metrics (with improvements of 1.71% in R1_P and 3.27% in R2_P) clearly demonstrate its effectiveness. These results indicate that EPER is more adept at integrating feature-level information and contextual cues, thereby generating more personalized and high-quality explanations.
4.3.2. Performance of Rating Prediction
Table 3 presents the performance of rating prediction of various methods on the Amazon Clothing dataset. Although EPER’s RMSE (1.05) is marginally higher than that of MMCT (1.04), its superior performance in MAE (0.83 vs. 0.84) indicates more accurate overall rating predictions. The slight difference in RMSE can be attributed to the joint optimization strategy that balances rating prediction with explanation generation, ultimately enhancing the overall recommendation quality. This indicates mutual support between the generation task and the recommendation task during training. Additionally, learning user- and item-related information influences the effectiveness of recommendation performance.
4.3.3. Performance on Different Datasets
Various explainable recommendation methods were compared on the Amazon Movies and Yelp datasets. Because MMCT requires images, which are not available for all items in the Yelp dataset, the experimental results exclude the performance of MMCT.
Table 4 shows that on the Amazon Movies dataset, EPER outperforms other methods in terms of text quality with respect to the ROUGE metric, while EPER is second best for other metrics.
Table 5 shows that on the Yelp dataset, except for the DIV metric where EPER is second best, EPER outperforms all the other methods for all the other metrics. By observing the characteristics of the Amazon Movies dataset, we can see that the item names influence the performance of the EPER model. It was found that there is no clear relationship between item names and review content, whereas there is a more obvious relationship between item names and review content in the Amazon Clothing and Yelp datasets.
Based on the above analysis, our proposed EPER model generally performs the best or slightly lags behind MMCT. However, MMCT requires the inclusion of image information, which is not always available for all items in practical applications. In brief, our proposed EPER model can achieve good results or even better ones without the need for image processing, making it more flexible in terms of dataset applicability.
4.3.4. Ablation Study
Several ablation studies were conducted to evaluate the impact of various design aspects of the EPER model.
Table 6 presents the experimental results, which can be analyzed from three perspectives: (1) The impact of eliminating certain inputs from the model, (2) The effect of individual loss components, and (3) The role of the masking mechanism.
(1) Elimination of Certain Inputs: The absence of any of the three key inputs—user ratings (), item titles (Ni), or user–item features ()—results in a degradation of model performance across rating prediction, review quality, and personalization level metrics. The most crucial input is rating (), followed by item titles (Ni), and then user–item feature (). The most notable observation is that removing user–item features results in a sharp decline in explainability and personalization quality. This is because represents key user preferences extracted from past reviews, which helps generate more personalized explanations. When unavailable, the model struggles to provide user-specific explanations.
In practical recommendation systems, interaction-based features like
are often missing during inference, especially in cold-start scenarios or when recommending new products. To address this, EPER incorporates a feature-generation mechanism that dynamically predicts missing features using a Transformer encoder. This technique significantly improves performance, as seen in
Table 6, but there is still room for enhancement, particularly in handling low-quality or noisy inferred features.
(2) The Effect of Individual Loss Components: Removing the rating loss generally reduces review quality, as indicated by lower BLEU and ROUGE scores. However, precision scores for ROUGE_1, ROUGE_2, and the ROUGE_2 F-measure remain relatively stable.
Removing the context prediction loss has a greater negative impact than removing , leading to consistent performance degradation across rating prediction, explanation quality, and personalization metrics. This highlights the importance of context prediction in generating high-quality explanations.
(3) The Role of the Masking Mechanism: The EPER_N variant (
Table 6) represents EPER without the customized masking mechanism. Without masking, the model’s personalization and review quality significantly degrade, as unintended attention interactions introduce noise into explanation generation. However, the impact on rating prediction is minimal, reinforcing that the masking mechanism is primarily beneficial for improving explanation quality.
4.3.5. Performance on User–Item Feature
As indicated in
Table 6 and in
Section 4.3.4, the performance is greatly decreased without the user–item feature
. However, we have pointed out that the user–item feature
is not available in practice. Therefore, an experiment to evaluate whether using the user–item feature
, obtained by the mechanism described in
Section 3.5, may approach the performance of using the real user–item feature
. The model used in the comparison was PETER+, which also used
to substitute
for evaluation. Note that even the overlap between
and
is not much, the performance improvement is still noticeable.
Table 7 shows that, when user–item feature
is unavailable, EPER outperforms PETER+ in rating prediction, review quality, and personalization level. EPER has better scores in all the metrics including RMSE, MAE, the BLEU and ROUGE, and the FMR, FCR, and DIV scores.
Table 8 shows that, using the user–item feature
computed from our mechanism, both models obtain performance gains, except BLEU. Overall, EPER still outperforms PETER+.
4.3.6. Comparisons of Explanation Cases
Table 9 presents examples of explanations generated by different models on the Amazon Clothing dataset. In Case 1, the ground-truth user review is “The price is great” for a product rated 5.0, and in Case 2, the ground-truth states “It was very small in the waist” for a product rated 1.0. In addition to the numerical performance comparisons provided in previous sections, we now offer a deeper qualitative analysis of these explanation cases to assess their effectiveness, interpretability, and potential impact on user understanding.
Case 1 Analysis: In this example, EPER, MMCT, and PETER+ all generate explanations that mention the product’s price. Notably, EPER’s explanation—“The price was great and the quality is great”—not only emphasizes the attractive price but also supplements it with a comment on quality. This dual focus likely enhances the explanation’s clarity and relevance, helping users better understand the rationale behind the recommendation. Such a balanced explanation can increase user trust by aligning closely with the sentiments expressed in the ground-truth.
Case 2 Analysis: For the second example, where the ground-truth highlights a concern regarding the small waist size, EPER produces the explanation “They are a bit tight in the waist”. This output effectively captures the key issue and presents it in a concise manner, which is crucial for user interpretability. In contrast, PETER+ fails to address the concern properly, providing a vague statement that does not reflect the critical aspect of the user’s review. The clear, focused nature of EPER’s explanation suggests that it is better suited to inform users about specific product attributes that influence their purchasing decision.
Overall Qualitative Insights: Our expanded analysis indicates that EPER’s explanations tend to be more aligned with the underlying review sentiments and user preferences. By integrating multiple interpretability techniques, EPER not only achieves higher scores on standard metrics (BLEU, ROUGE, FMR, FCR, and DIV) but also produces explanations that are clearer and more actionable. This qualitative improvement is significant for applications where user understanding and trust in the recommendation system are paramount.
5. Conclusions
We have proposed an explainable recommendation model, EPER, based on the Transformer architecture, which provides both recommendation scores and personalized natural language explanations for items recommended to users. EPER simultaneously considers user–item IDs, user ratings, feature words, and item title information, effectively improving the text quality of personalized recommendation explanations. A masking mechanism is incorporated into the model design, enabling the rating and explanation tasks to complement each other without interference. Additionally, we proposed a feature-handling method to address the limitations of previous approaches that relied on interaction features not yet present in the model.
Extensive experiments demonstrate that EPER achieves significant improvements in both explanation quality and recommendation scores compared with other methods. Notably, without requiring the preprocessing of image information, EPER outperforms or matches the overall performance of the well-known MMCT model. EPER overcomes the limitations of datasets lacking item image information, making it more widely applicable in practical applications. Furthermore, our proposed feature-handling method enhances the practical implementation while delivering high-quality personalized recommendation explanations.
While our experimental results demonstrate the effectiveness of EPER in explainable recommendations within e-commerce and service domains, several limitations should be acknowledged. First, the model assumes that textual explanations and structured metadata (e.g., user reviews and item names) are available. However, in domains with sparse or low-quality review data, performance may degrade significantly. Second, although the attention mechanisms improve explainability, the model does not explicitly model temporal user preferences—future extensions could incorporate sequential modeling techniques. Third, our current implementation does not incorporate multi-modal information such as product images or audio reviews, which could further enhance the personalization and relevance of generated explanations. Finally, the computational complexity of Transformer-based models remains a concern, particularly for real-time recommendation applications, necessitating future optimization strategies such as knowledge distillation or efficient Transformer architectures.
To address these challenges, future work can focus on adapting EPER to additional domains, such as healthcare, finance, and education, where explainability is essential but data structures differ significantly. Additionally, domain adaptation techniques, including self-supervised pretraining on multiple datasets, could help the model generalize beyond e-commerce recommendations. Exploring multi-modal learning approaches, where textual explanations are supplemented with visual and contextual information, could improve both accuracy and interpretability. Enhancing fairness and interpretability in recommendation explanations using causal inference or counterfactual reasoning techniques is another promising direction to minimize bias and improve trustworthiness in AI-driven recommendations.
In summary, the EPER model, by incorporating real ratings and item names as features into the learning process, effectively enhances the quality of explanation generation. It also successfully identifies the features users are concerned about, producing personalized recommendation explanations.


