Article

Tea Harvest Robot Navigation Path Generation Algorithm Based on Semantic Segmentation Using a Visual Sensor

1
School of Mechanical and Electrical Engineering, Xinjiang Agricultural University, Urumqi 830052, China
2
Intelligent Equipment Research Center, Beijing Academy of Agricultural and Forestry Sciences, Beijing 100097, China
*
Author to whom correspondence should be addressed.
Electronics 2025, 14(5), 988; https://doi.org/10.3390/electronics14050988
Submission received: 27 January 2025 / Revised: 24 February 2025 / Accepted: 26 February 2025 / Published: 28 February 2025

Abstract

:
During the process of autonomous tea harvesting, it is essential for the tea-harvesting robots to navigate along the tea canopy while obtaining real-time and precise information about these tea canopies. Considering that most tea gardens are located in hilly and mountainous areas, GNSS signals often encounter disturbances, and laser sensors provide insufficient information, which fails to meet the navigation requirements of tea-harvesting robots. This study develops a vision-based semantic segmentation method for the identification of tea canopies and the generation of navigation paths. The proposed CDSC-Deeplabv3+ model integrates a Convnext backbone network with the DenseASP_SP module for feature fusion and a CFF module for enhanced semantic segmentation. The experimental results demonstrate that our proposed CDSC-Deeplabv3+ model achieves mAP, mIoU, F1-score, and FPS metrics of 96.99%, 94.71%, 98.66%, and 5.0, respectively; both the accuracy and speed performance indicators meet the practical requirements outlined in this study. Among the three compared methods for fitting the navigation central line, RANSAC shows superior performance, with minimum average angle deviations of 2.02°, 0.36°, and 0.46° at camera tilt angles of 50°, 45°, and 40°, respectively, validating the effectiveness of our approach in extracting stable tea canopy information and generating navigation paths.

1. Introduction

As a significant cash crop globally, tea is extensively cultivated across more than 50 countries. In 2023, the global area dedicated to tea cultivation is projected to reach 5.09 million hectares, with the total tea production expected to attain 6.269 million tons. The tea industry plays a crucial role in global economic and social development. However, it is currently confronted with significant challenges, including a severe labor shortage and low production efficiency. The aging trend among tea farmers is becoming increasingly pronounced. Simultaneously, the characteristics of a limited tea-picking window and stringent harvesting requirements result in a significant surge in labor demand during the harvest season, leading to consistently high labor costs. These factors severely hinder the sustainable development of the tea industry. In recent years, the rapid advancement of artificial intelligence and robotics has led to a heightened focus on the research and development of unmanned tea bud-harvesting robots in major tea-producing countries worldwide. Nations such as China and Japan have significantly increased their investment in this area, actively promoting technological innovation and the application of harvesting robots [1,2].
The unmanned tea-harvesting robot must first ensure the precise acquisition of navigation information to guarantee the stable operation and accurate control of the vehicle. This includes obtaining both the absolute and relative position data for the robot [3]. Building upon this foundation, the robot also needs to accurately gather relevant information regarding the tea tree canopy to facilitate the precise harvesting of tea leaves. This involves identifying tea buds and determining the relative pose between the surface of the tea canopy and the tea-harvesting robot [4]. In recent years, there has been a significant amount of research focused on tea information acquisition, with deep learning methods being employed to achieve high recognition rates [5,6]. However, studies addressing robot navigation information acquisition in tea plantation environments remain relatively scarce. Clearly, the stability and precision of robot navigation are fundamental prerequisites for the successful implementation of unmanned tea harvesting.
The acquisition of precise location information is essential for the autonomous navigation of unmanned harvesting robots, enabling them to navigate independently based on both the absolute location data and memorized path information. Moeller [7] developed an autonomous navigation system for agricultural robots that incorporates an RTK-GPS module, facilitating accurate access to potato plants affected by viruses for removal. Oksanen [8] designed a navigation system for a four-wheel-steered agricultural tractor that utilizes GNSS signals as input; this approach considers factors such as speed and heading angle to achieve effective autonomous navigation functionality for the tractor. Yan Fei [9] proposed a combined positioning algorithm that integrates the Beidou Satellite Navigation System (BDS) with GPS, thereby enhancing positioning accuracy in complex environments encountered by agricultural machinery. Gao [10] integrated multiple sensor data sources, including RTK-GNSS and inertial measurement units, and introduced an improved neural network positioning algorithm based on autoencoders, achieving precise localization for agricultural mobile robots. However, when navigating along the tea canopy, information regarding the centerline of the tea canopy serves as critical relative positioning data necessary to ensure accurate vehicle navigation.
Ultrasonic sensors, laser sensors, and other distance measurement devices are essential tools for acquiring relative positioning information and are widely employed in robotic navigation due to their compact data size and high real-time performance. Corno [11] implemented tractor positioning in vineyards by utilizing adaptive ultrasonic sensors. They improved the measurement data through filtering algorithms, calibrated the positions of grapevine rows based on sensor signals, and successfully conducted semi-automatic navigation path planning. Wang [12] achieved complex environmental perception and map construction using 3D LiDAR technology, completing the task of navigation path extraction by identifying obstacle locations through point cloud data. However, ultrasonic sensors capture information solely from the nearest point and exhibit extremely poor angular resolution. In scenarios where vigorous branches obstruct the tea canopy surface or when local tea bushes die—resulting in cavities on the canopy surface—significant measurement errors can occur. Laser sensors typically scan the tea canopy from an overhead perspective; different tea canopies are distinguished by abrupt changes in distance measurements between the canopy surface and pathways below. When distances between adjacent tea canopies are relatively short or when pathways are narrow, segmentation errors may arise during identification processes, leading to unstable results. Furthermore, laser sensors designed for outdoor applications tend to be prohibitively expensive, which restricts their use within agricultural contexts.
Visual sensors have been increasingly utilized for environmental perception in recent years, particularly within the realm of robotic navigation. With advancements in deep learning technology, the ability to extract environmental feature information and derive navigation data has significantly improved. De Silva [13] proposed a deep learning-based approach for detecting beet crop rows which accurately identifies these rows and extracts navigation lines amidst complex natural environments characterized by varying growth stages and weed interference. To tackle the challenges posed by differing light conditions and obstacles affecting navigation path recognition, Li [14] introduced a novel semantic segmentation model known as VC-UNet. This model enables rapid and precise segmentation as well as the extraction of navigation lines for rapeseed crop rows. Notably, this method achieves an impressive segmentation accuracy of 94.11% in rapeseed fields while also demonstrating commendable transfer performance across other crops such as soybeans and corn. Adhikari [15] integrated Deep Neural Networks (DNNs) with convolutional encoder–decoder networks to detect crop rows within rice fields. They employed semantic segmentation to extract crop areas, thereby optimizing navigation routes and facilitating autonomous tractor operation. These studies indicate that compared to ultrasonic and laser sensors, image-based systems can provide more comprehensive and stable relative position information. However, the existing visual models exhibit certain limitations. First, these models often lack robustness against noise and are vulnerable to disruptions from environmental factors, which results in decreased segmentation accuracy. Furthermore, when addressing multi-scale features, these models encounter difficulties in effectively integrating global and local information, leading to the inaccurate identification of targets such as tea canopies especially when their edge shapes are irregularly defined. Such shortcomings significantly impact the overall segmentation performance of the model; consequently, this results in navigation central lines that inadequately meet precise navigational requirements.
This study aims to enhance the capacity of visual sensors in extracting navigation central lines from tea canopies by optimizing the Deeplabv3+ semantic segmentation network. The Convnext architecture is adopted as the backbone network to capitalize on its powerful feature extraction capabilities, thereby enhancing both the segmentation accuracy and the model speed. Secondly, by integrating the DenseASPP and SP structures, a DenceASP_SP module is established to expand the receptive field of the model. This improvement boosts its ability to perceive features of various scales and increases the accuracy in identifying local details along the edges of tea canopies. Additionally, to better retain and utilize multi-level feature information, a CFF module is designed within the network encoder. This integration effectively consolidates features at different levels, further enriching the model’s semantic information and laying a solid foundation for generating high-precision semantic segmentation results. Concerning the fitting of navigation central lines, this study will utilize the RANSAC algorithm to extract the tea canopy navigation central lines. The performance of this method will be compared with that of the least squares estimation and Hough transform techniques in order to validate its advantages in effectively fitting the tea canopy navigation central lines.

2. Materials and Methods

2.1. Collection and Labeling of Tea Canopy Data

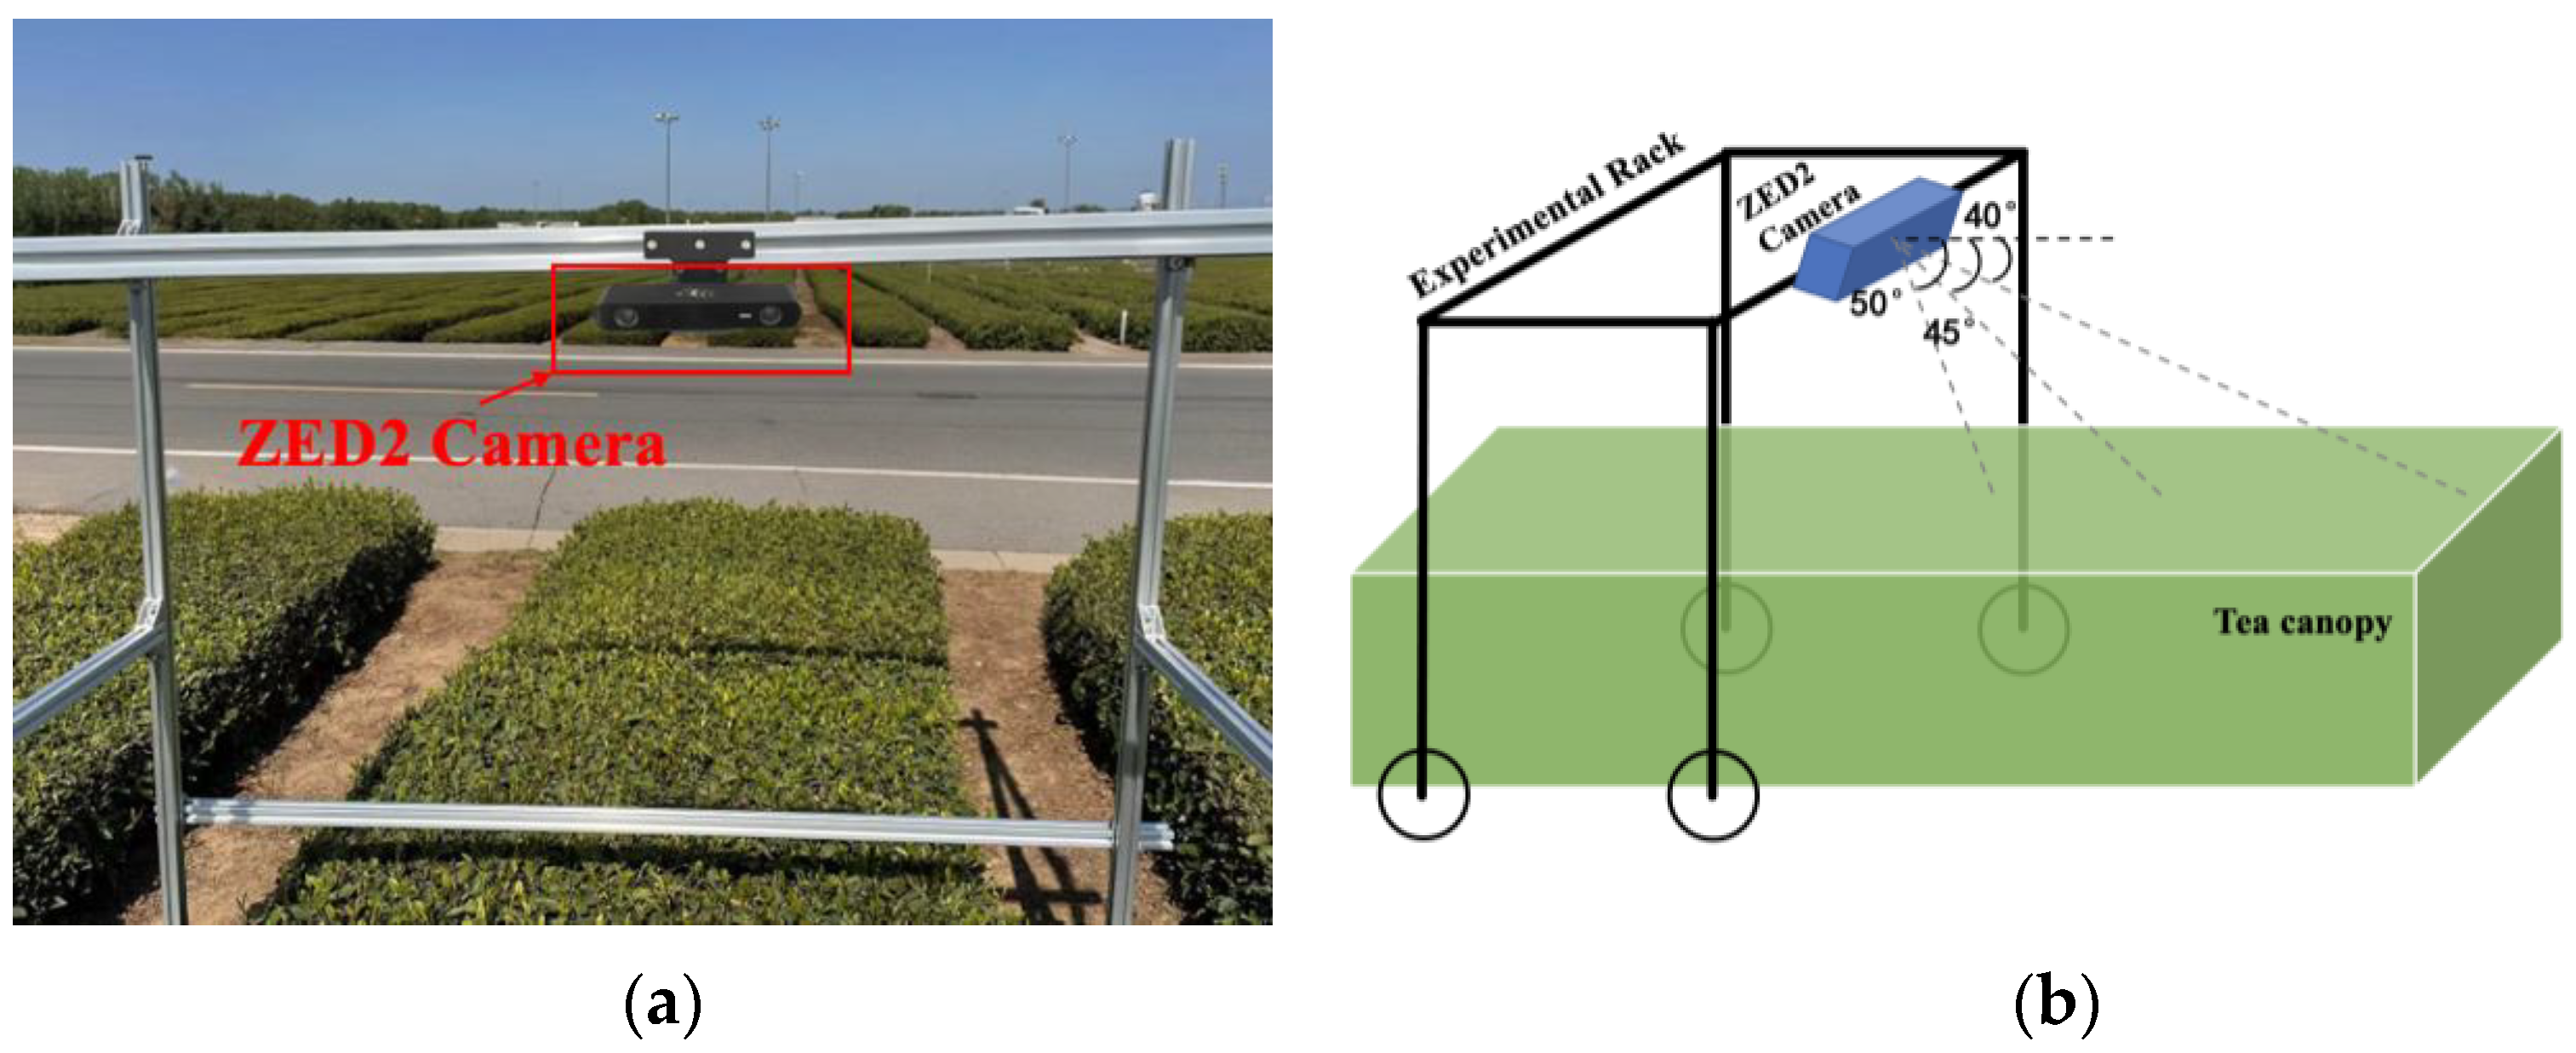
2.1.1. Data Acquisition

The data collection for tea canopies was successfully completed in the tea garden planting base located in Lanshan District, Rizhao City, Shandong Province. The spacing between the tea canopies within the garden ranged from 30 to 50 cm. The data collection period spanned from 20 May to 5 June 2024, with operational hours set from 7 a.m. to 6 p.m. For image acquisition, a ZED2 stereo camera was employed, positioned at a height of 1.5 m above the tea canopy. The experimental platform traversed along the centerline of the tea canopy at a speed of 0.5 m per second. To replicate the camera shake induced by uneven terrain, the camera was slightly tilted and pitched at three distinct angles: 50°, 45°, and 40°, as illustrated in Figure 1b. The resolution of the captured image data was configured at 2208 × 1242 pixels, achieved by converting the original video footage recorded in HD2K quality at a frame rate of 15 FPS using internal functions provided by the ZED SDK. A total of 1050 images were collected during this experiment, comprising 350 images for each of the three specified tilt angles.

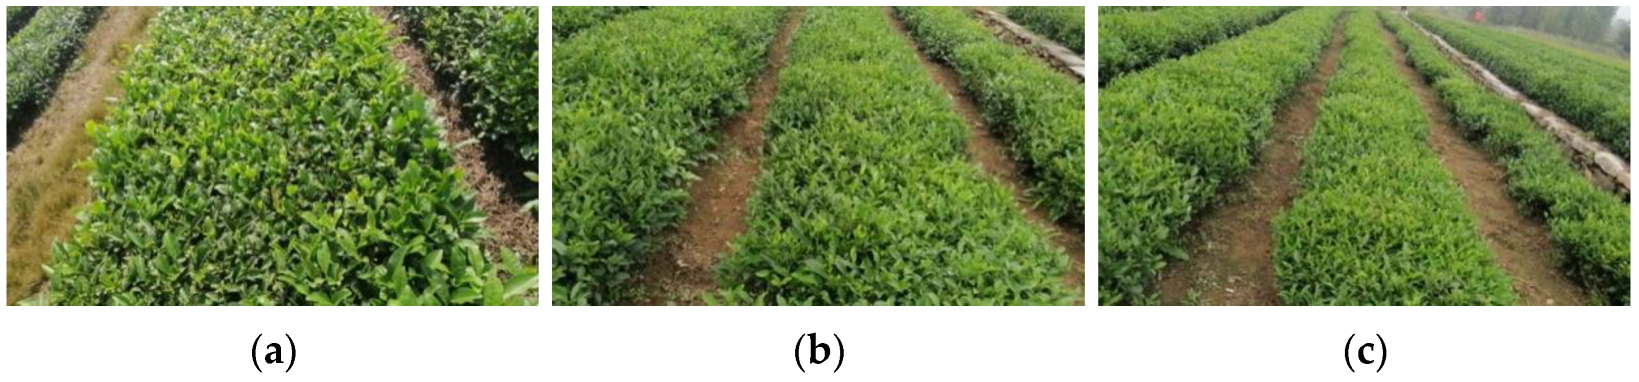
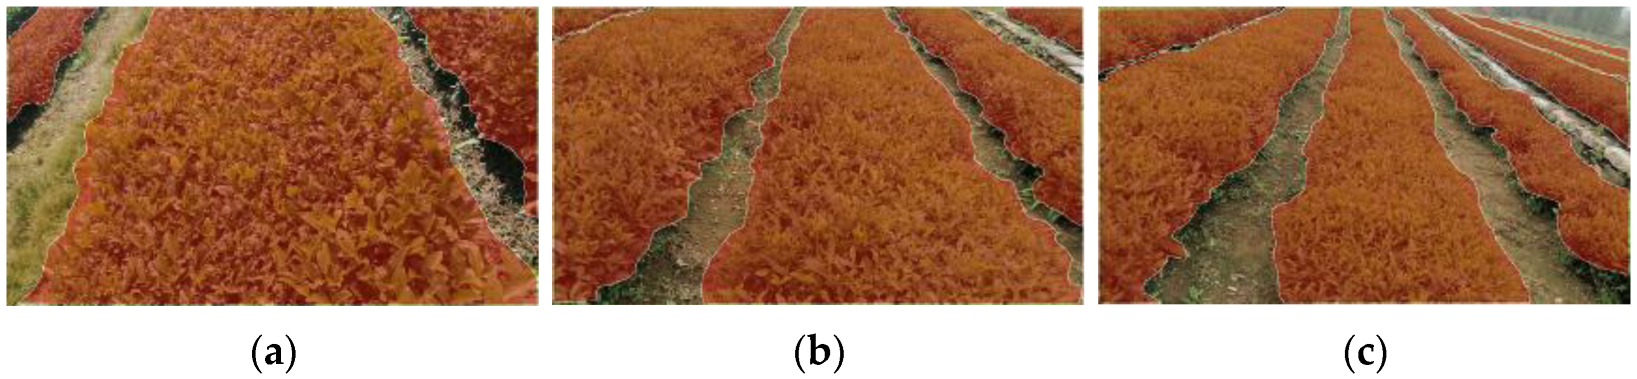
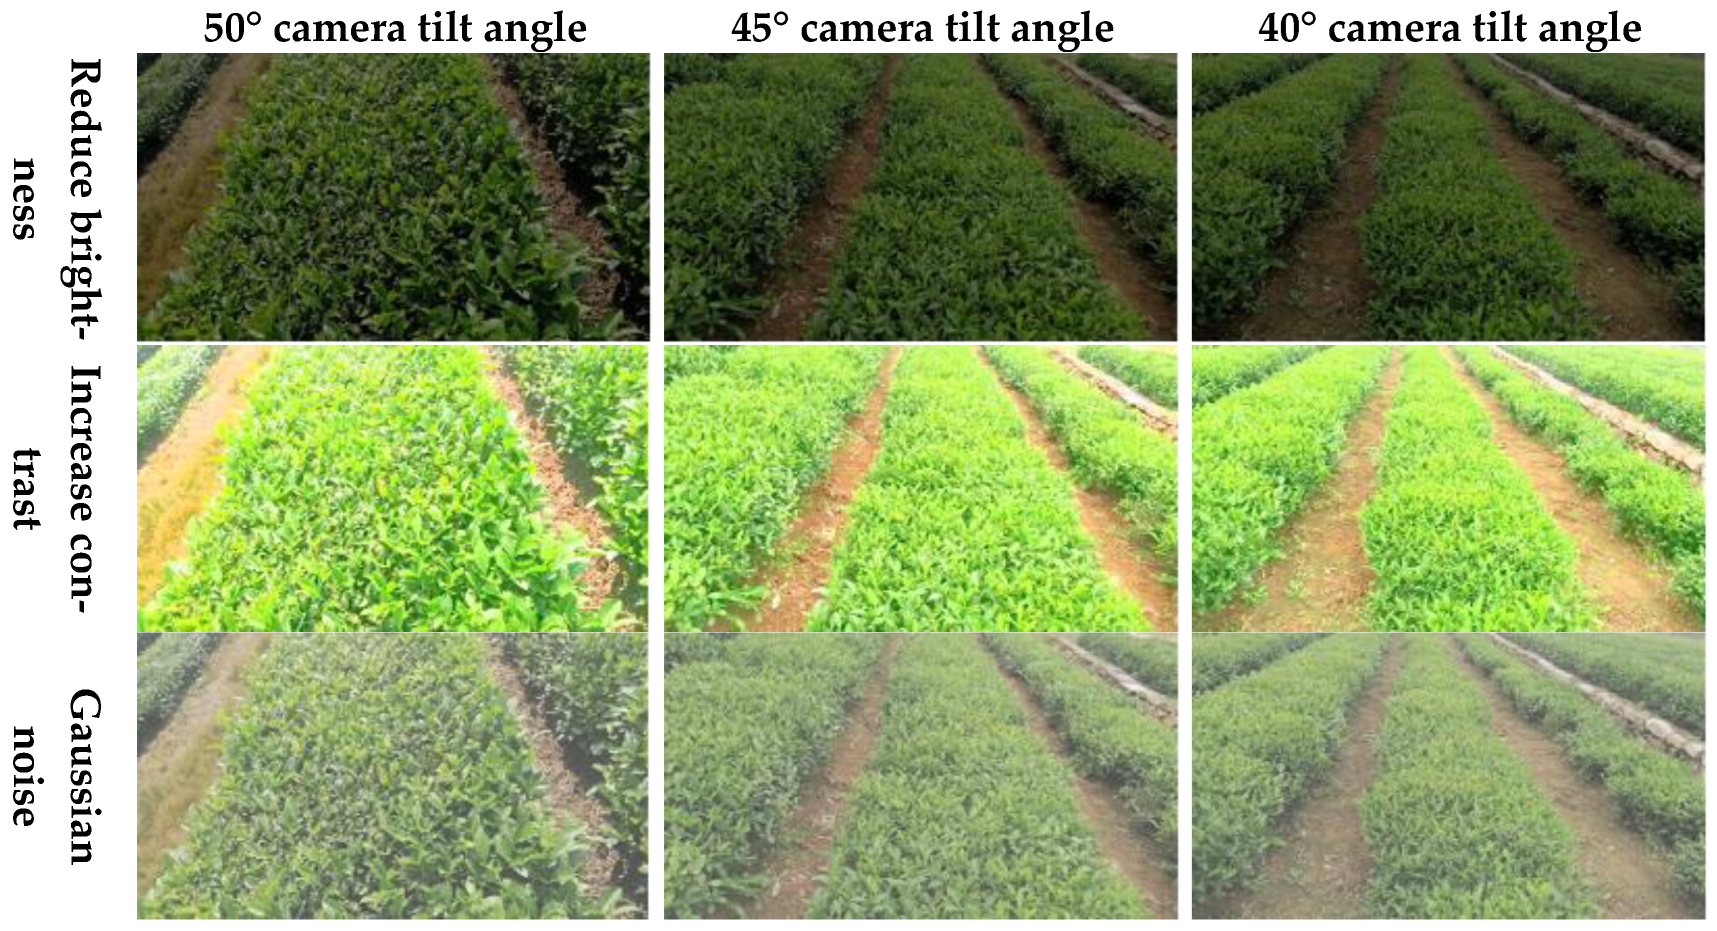
2.1.2. Dataset Production

We utilized the Labelme software(version number:1.8.6) to annotate the original dataset of 1050 images, generate the corresponding JSON annotation files, and convert these into labeled images. As illustrated in Figure 2 and Figure 3, the original images captured by the camera at various tilt angles are presented alongside the label images produced by the program.
To enhance the generalization capability of the model in real-world tea garden environments, we conducted enhancement processing on the labeled tea canopy dataset. A scripting program was utilized to adjust the brightness, increase contrast, and introduce Gaussian noise to select portions of the dataset. These modifications aim to improve the model’s adaptability under conditions such as low light, overexposure, and foggy weather. The effects of these enhancements are illustrated in Figure 4. Building upon this foundation, we randomly partitioned the enhanced dataset into training, validation, and test sets. Specifically, the training set comprised 2500 images, while both the validation and test sets contained 315 images each.

2.2. Establishment of Tea Canopy Segmentation Model

2.2.1. Deeplabv3+ Model

In the realm of environmental perception, semantic segmentation technology driven by deep learning has seen widespread application, effectively showcasing that convolutional neural networks (CNNs) can achieve accurate segmentation across diverse scenes. The current leading deep learning models for semantic segmentation include Deeplabv3+ [16], PspNet [17], and U-Net [18]. These models represent the extensions and enhancements of the fully convolutional network (FCN). The most recent model in the Deeplab series is the Deeplabv3+ model, which operates as an encoder–decoder framework based on FCN. This architecture excels in performing pixel-level image-to-image learning tasks. The Deeplabv3+ model processes tea canopy images through the encoder component, employing backbones such as Xception, ResNet, and MobileNet [19,20,21] to extract both the shallow and deep features from these images. The deep features are subsequently processed by the Atrous Spatial Pyramid Pooling (ASPP) module to capture multi-scale semantic information, which is then concatenated with the channels of the feature map. Following this step, a 1 × 1 convolution operation is applied to generate new deep features. In the decoder segment, these newly generated deep features undergo upsampling via bilinear interpolation to ensure they match the resolution of the shallow features. To prevent diminishing returns on deep feature quality, the shallow features are reduced in dimensionality using another 1 × 1 convolution. Finally, the shallow and newly created deep features are concatenated along the channel dimension and fused through a 3 × 3 convolution layer. After additional upsampling operations have been completed, a segmentation image of tea canopies at their original resolution is produced.

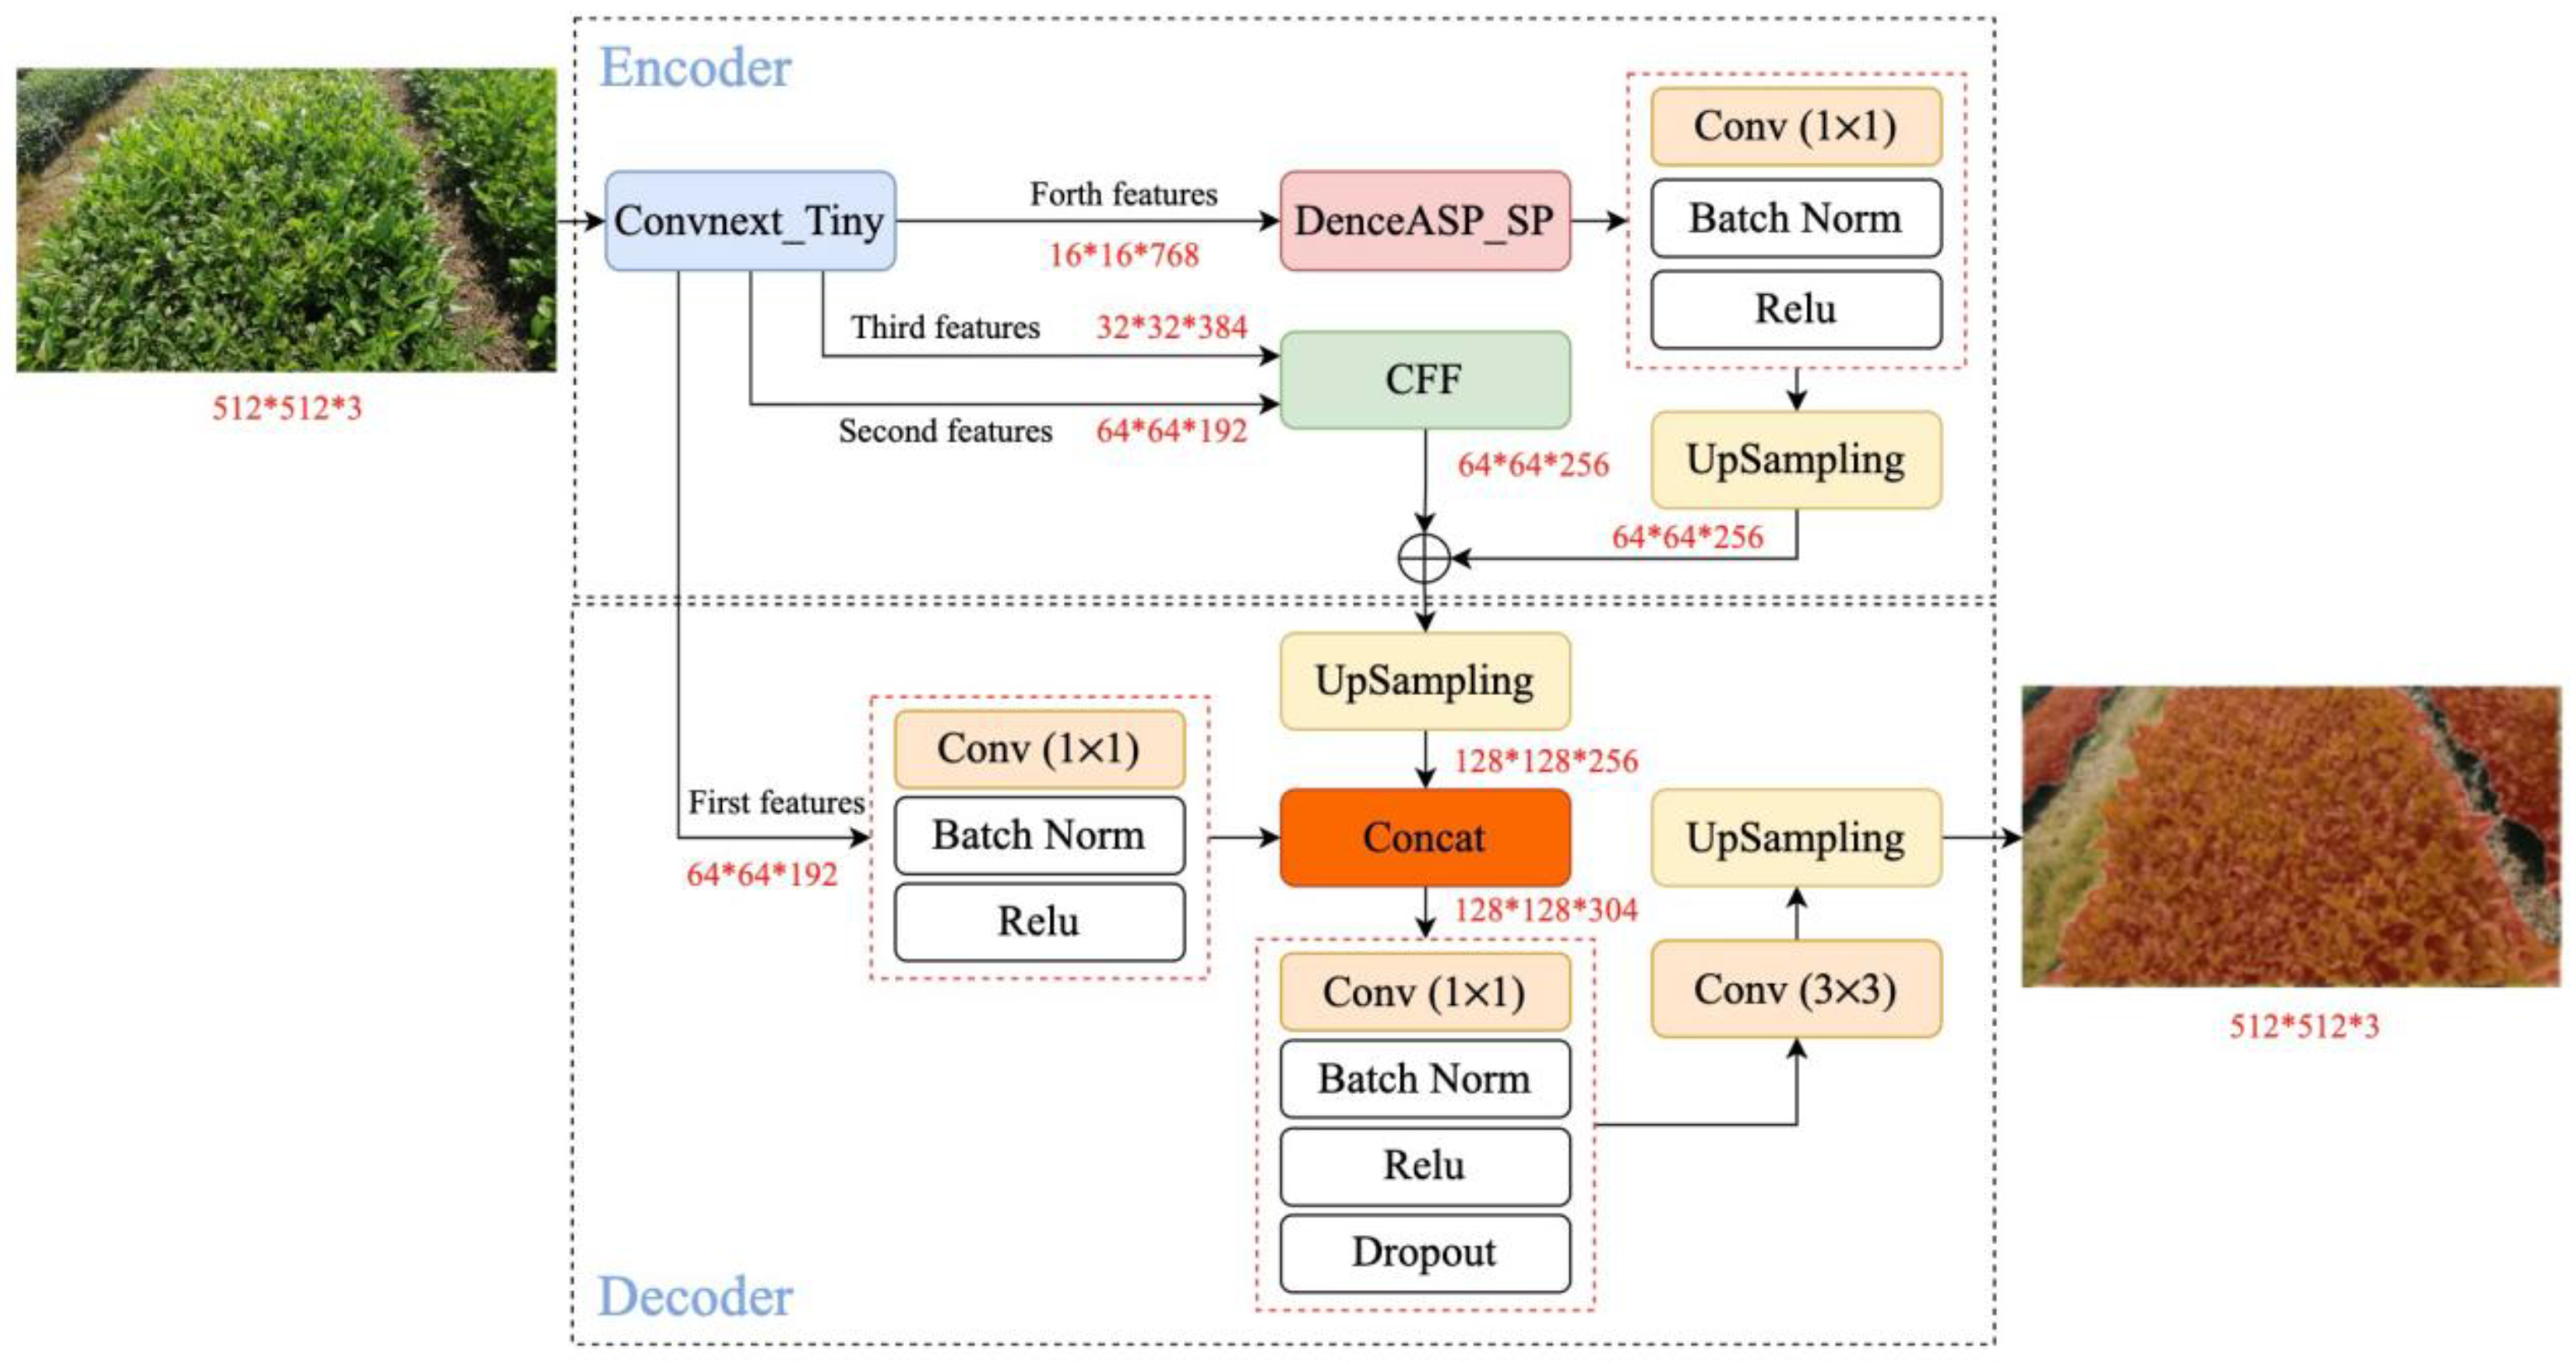
2.2.2. CDSC-Deeplabv3+ Model

The accuracy of semantic segmentation for tea canopy images is closely linked to the feature extraction capabilities of the model’s encoder. The original Deeplabv3+ model exhibits limitations in segmenting tea canopies, primarily due to its reliance on only one shallow feature and one deep feature processed by the ASPP module from the encoder output. This simplistic approach to feature extraction and fusion struggles to adequately capture the intricate structural features inherent in tea canopies, resulting in constrained segmentation accuracy. To address these challenges, we propose an enhanced CDSC-Deeplabv3+ model, as illustrated in Figure 5. Initially, we replaced the original backbone network with a Convnext architecture to extract semantic information from four layers of features, thereby bolstering the model’s capability for feature extraction. Additionally, we introduced an improved DenseASPP module within the original architecture and incorporated a Strip Pooling (SP) branch into this module. This modification allows us to capture semantic information over a broader spatial range while mitigating convolution degradation issues that can arise from excessive dilation rates. Furthermore, we designed a Cascade Feature Fusion (CFF) module that facilitates the cascaded fusion of features from both the second and third layers while integrating them with fourth-layer features. This strategy effectively amalgamates multi-scale characteristics pertinent to tea canopies. Finally, during the decoding phase, we concatenated the fused features produced by the encoder with first-layer features to yield higher-precision semantic segmentation results.

2.2.3. Convnext Backbone Network

The semantic segmentation model developed in this study utilizes Convnext as its backbone network. In comparison to Xception, MobileNetV2, and ResNet50 networks, Convnext demonstrates superior performance in both model inference speed and segmentation accuracy. By integrating multiple optimization strategies, Convnext ensures that the tea garden tea-harvesting robot can achieve high-precision segmentation quality even under the demanding conditions of rapid tea canopy segmentation [22]. The overall architecture of the network is illustrated in Figure 6. From a broad perspective, Convnext draws inspiration from several advanced methodologies: it adopts the training approach of Swin Transformer [23], incorporates Group Convolution concepts from ResNeXt, employs the Inverted Bottleneck structure found in MobileNetV2, and integrates large convolution kernels sized at 7 × 7. On a more detailed level, Convnext replaces the Gelu activation function between 1 × 1 convolutions with the ReLU function and substitutes Batch Normalization (BN) with Layer Normalization (LN) prior to the first 1 × 1 convolution. The experimental results indicate that on the ImageNet-1k dataset, these enhancements do not significantly increase model parameters or compromise inference speed while markedly improving segmentation accuracy [24], thereby highlighting the performance advantages inherent to the Convnext network. Consequently, this paper adopts Convnext as the feature extraction network for its semantic segmentation model.

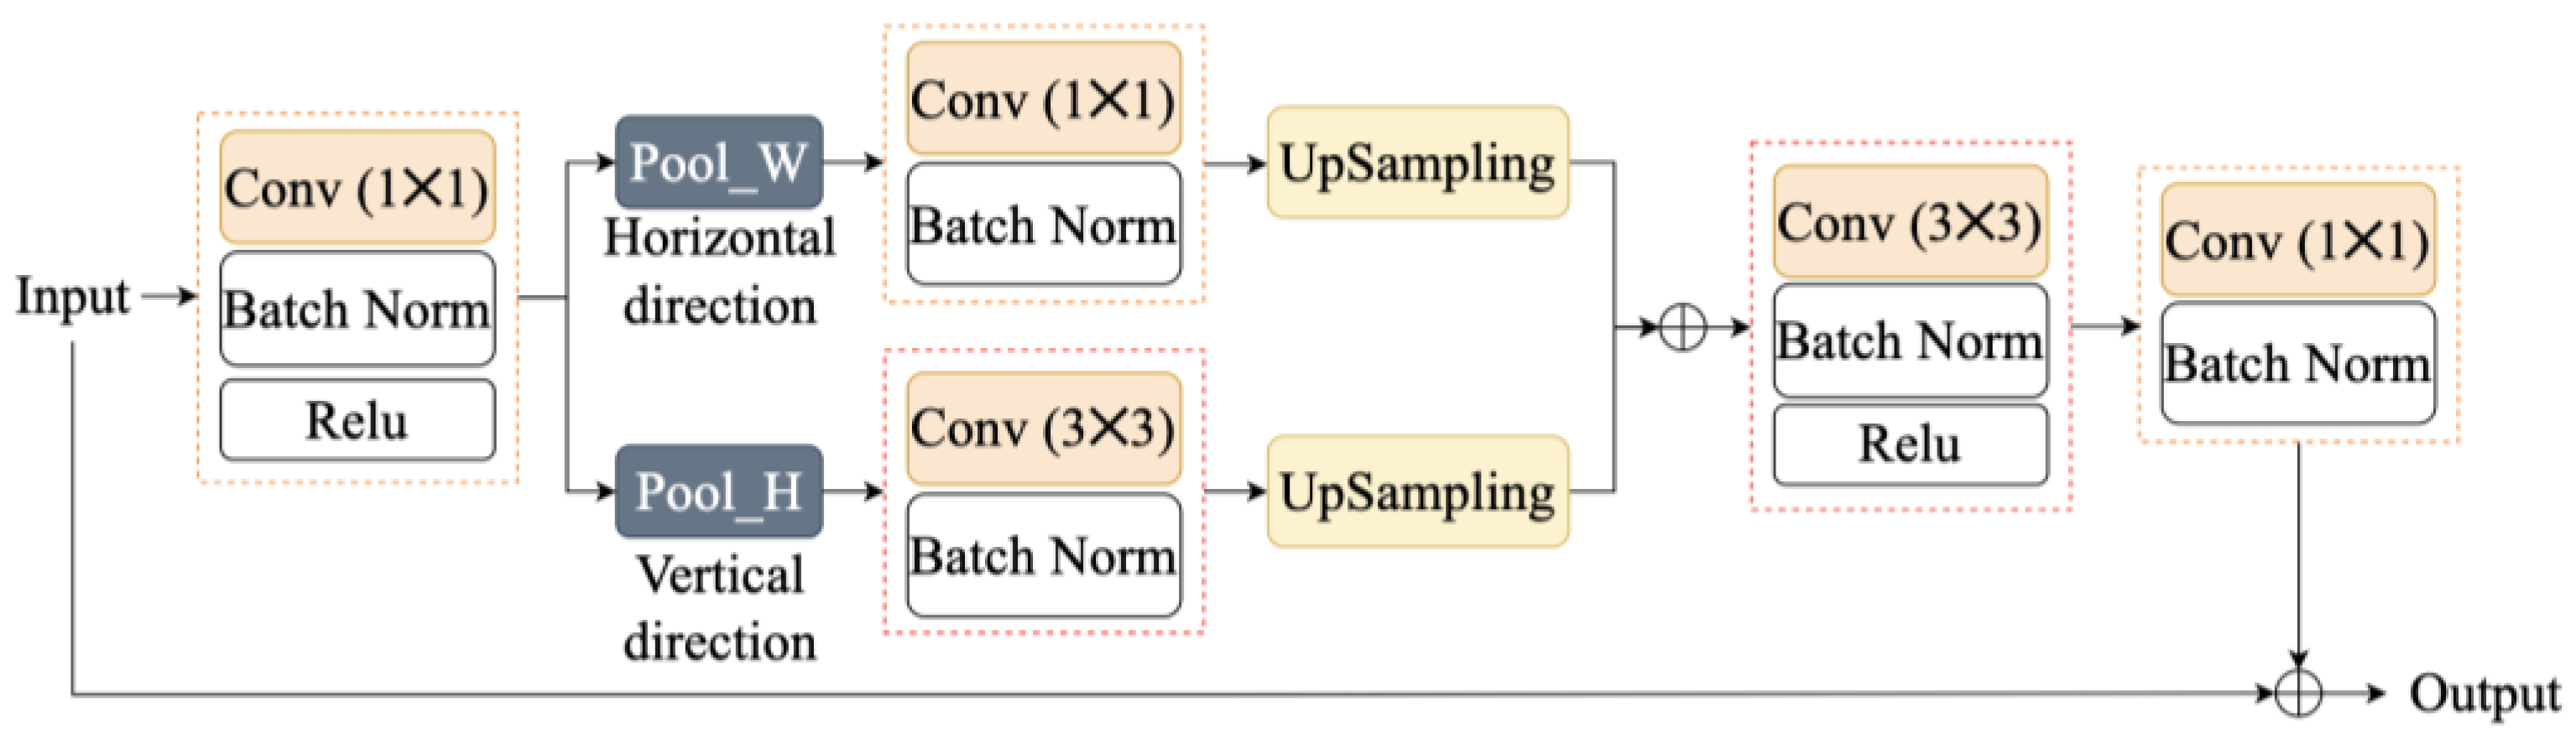
2.2.4. DenceASP_SP Module
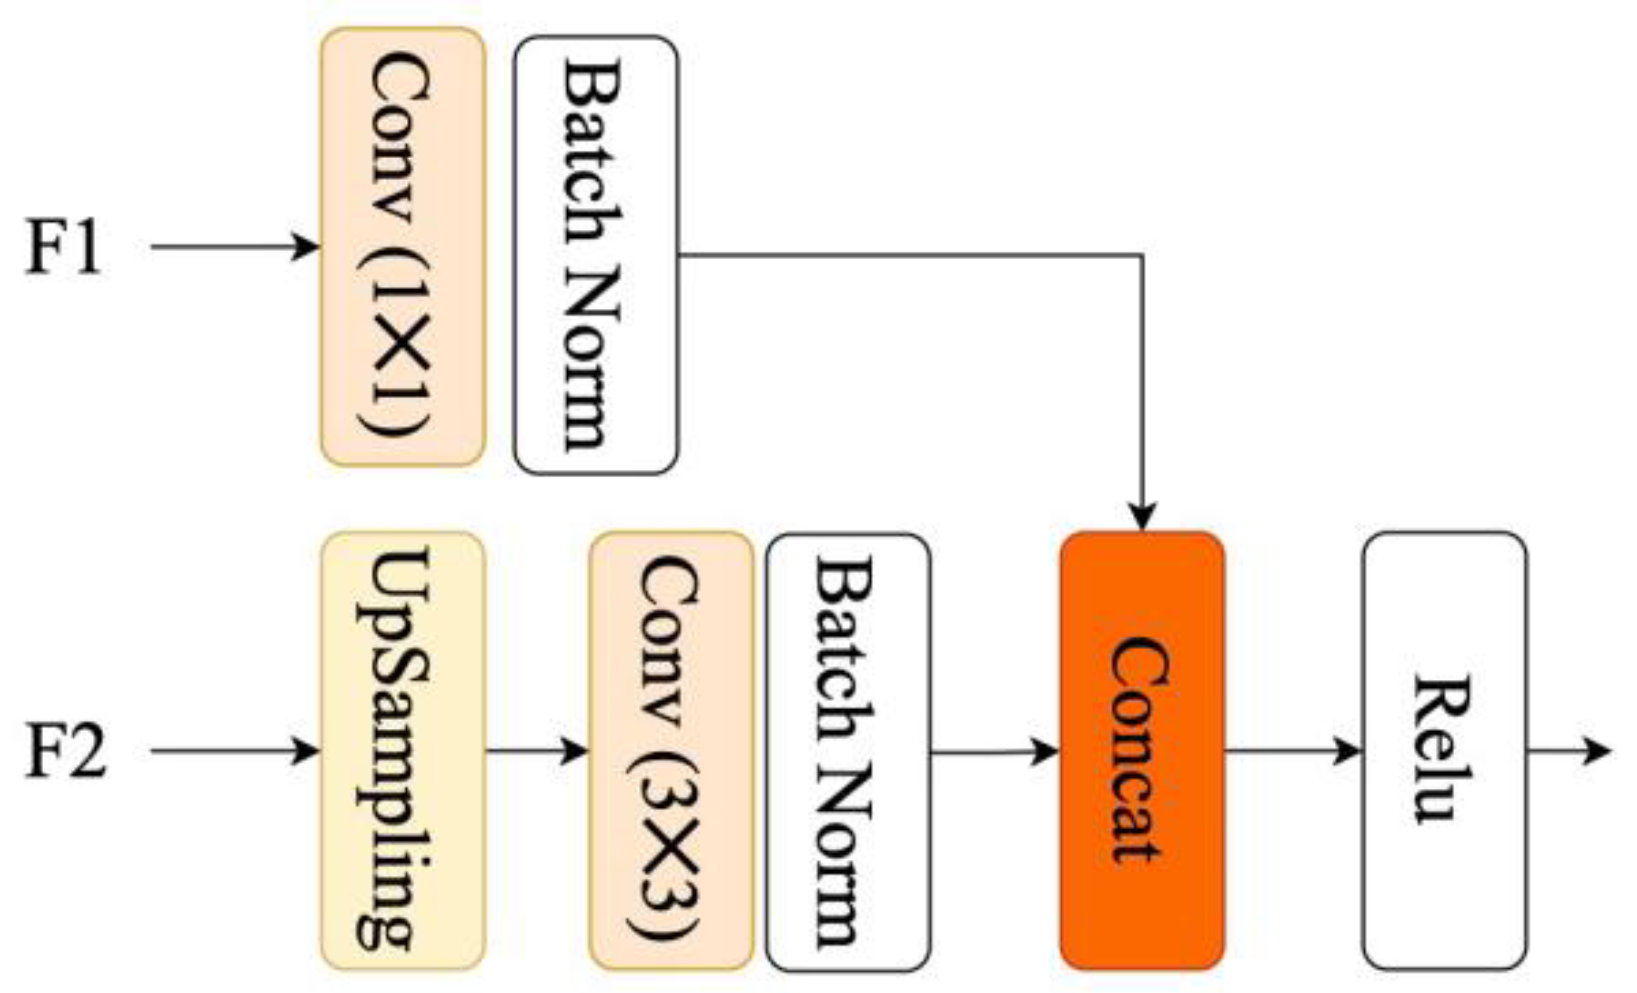
In the camera’s field of view, the area of the tea canopy is relatively extensive, presenting a large-scale segmentation target. The ASPP module conducts feature extraction and fusion based on dilated convolution, utilizing default dilation rates of 6, 12, and 18. However, to enhance the segmentation accuracy for tea canopies, it is essential for neurons to possess a larger receptive field. Merely increasing the dilation rate within the ASPP module to achieve a broader receptive field can lead to the degradation and loss of functionality in dilated convolution as the dilation rate escalates [25]. As illustrated in Figure 7, this study introduces an improved DenseASP_SP module that incorporates an SP branch into the DenseASSP framework. This enhancement enables the effective acquisition of larger-scale feature information pertaining to tea canopies while simultaneously reinforcing feature dependency relationships in both vertical and horizontal orientations. The DenseASP_SP module employs dilated convolutions with varying dilation rates of 3, 6, 12, 18, and 24 for comprehensive feature extraction. Each scale’s input features are synthesized from multiple scales derived from preceding layers. Thus, employing a dense connection method helps mitigate potential degradation associated with dilated convolution thereby facilitating access to semantic information over a broader coverage. Furthermore, prior to each dilated convolution operation, a 1 × 1 convolution is executed to minimize channel numbers and alleviate computational demands on the module. The SP branch functions as the global feature extraction component within this architecture; it enhances spatial position representation capabilities within the feature map, ultimately aiding in better recognition of regular arrangement patterns characteristic of tea canopies and consequently improving segmentation accuracy [26]. The overall structure of this module is depicted in Figure 8.

2.2.5. CFF Module

To fully exploit the multi-scale features of tea canopies within the network, specifically, to enhance semantic information through low-resolution features and detail information through high-resolution features, this study incorporates the CFF module introduced in the ICNet semantic segmentation network [27] into the encoder component of the network, as illustrated in Figure 9. This module utilizes the 1/8 and 1/16 feature maps extracted by the backbone network as input for F1 and F2, respectively, generating new features via concatenation. Subsequently, these newly created features are fused with the output from the DenceASP_SP module, thereby effectively integrating both semantic information and detailed data at the output stage of the encoder.

2.2.6. Indicators for Model Evaluation

To evaluate the performance of the model, this study selects mAP, mIoU, and F1-score as evaluation metrics. The mAP refers to the mean average pixel accuracy of categories, and its calculation formula is shown in (1). The mIoU refers to the mean intersection over union, and its calculation formula is shown in (2). The F1-score is a performance metric that combines precision and recall, and its calculation formula is shown in (3).
m A P = 1 k i = 0 k p i i j = 0 k p i j
m I o U = 1 k i = 0 k p i i j = 0 k p i j + j = 0 k p j i p i i
F 1 s c o r e = 2 × P × R P + R
where pii is the total number of pixels belonging to category i and predicted to be category i, pij denotes the total number of pixels belonging to category i but predicted to be category j, pji is the total number of pixels belonging to category j but predicted to be by category i, and k is the number of categories.

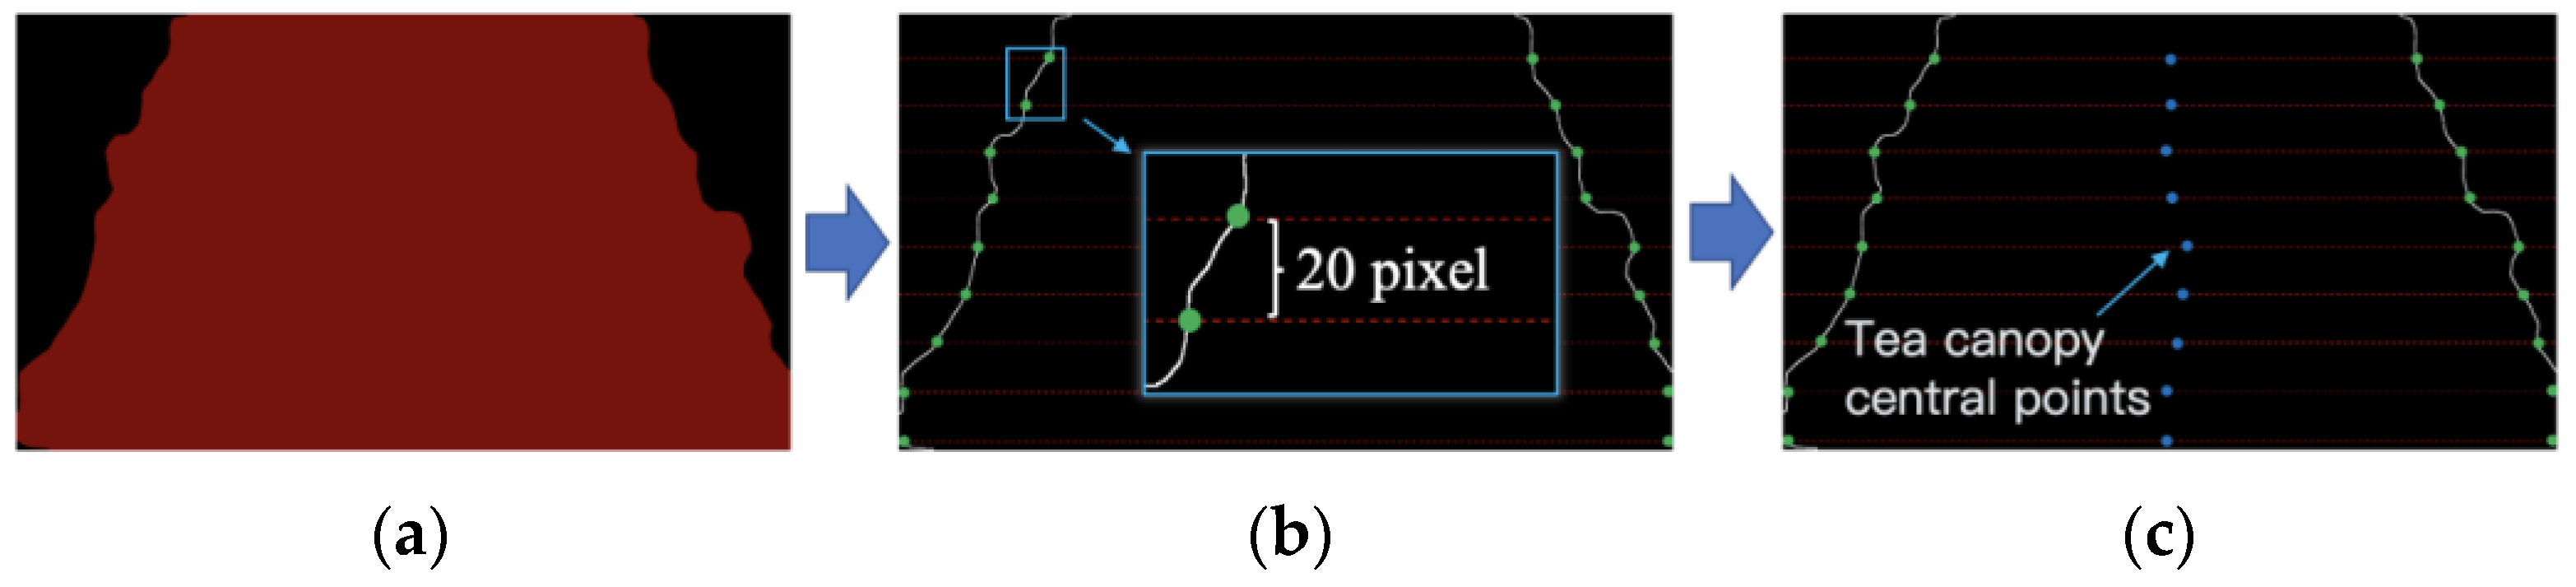
2.3. Tea Canopy Navigation Central Line Extraction

2.3.1. Sequence Extraction of Tea Canopy Central Points

In this study, the Canny edge detection algorithm was employed to extract the edges of the tea canopy from binary images following segmentation. The parameters for the Canny algorithm were configured as follows: a low threshold (threshold1) of 150 was utilized for detecting weak edges, while a high threshold (threshold2) of 300 was applied for identifying strong edges. Additionally, an aperture size of 3 was selected, which corresponds to the dimensions of the Sobel operator kernel used in calculating the image gradient [28]. To effectively capture edge feature points, a horizontal scanning strategy was implemented every 20 pixels in the vertical direction within the binary image. This approach allowed for the precise acquisition of pixel coordinates along the tea canopy edge, as illustrated in Figure 10b. By computing the midpoint positions between edge coordinate points on either side of the extracted tea canopies, we derived a sequence representing center points along these canopies. This sequence subsequently facilitated fitting for navigation central lines, as depicted in Figure 10c.

2.3.2. Fitting of Tea Canopy Navigation Central Lines

Due to the uneven growth patterns of various parts of tea canopies, the edges of the tea canopy exhibit irregularities. Furthermore, segmentation errors from the semantic segmentation model contribute to this inconsistency. Consequently, the sequence of central points extracted from segmented tea canopies often contains noise points. However, when establishing tea plantations, they are typically arranged in a relatively regular pattern for management convenience. Notably, in the short local area immediately in front of a tea-harvesting robot, these rows can be approximated as straight lines. In this study, we adopt a linear fitting method to derive a fitted straight line representing the sequence of central points from the tea canopies; this line will serve as our navigation reference. The RANSAC algorithm has gained widespread acceptance in crop row navigation research due to its remarkable robustness. For example, Guo [29] effectively addressed the outlier issues caused by weed interference during corn row navigation using RANSAC. Winterhalter [30] enhanced navigational accuracy in cotton row guidance through improvements made to the RANSAC method. In applying these techniques for extracting central lines for tea canopy navigation, we postulate that while RANSAC may yield favorable results similar to those found with other crops’ navigation central lines given the inherent differences between tea canopies and those of other crops, we also compare extraction outcomes utilizing both Hough transform [31] and least squares methods [32], alongside employing RANSAC for retrieving navigational lines specific to tea canopies.

2.3.3. Evaluation Indicators for Tea Canopy Navigation Central Line Fitting Performance

To assess the fitting accuracy of the tea canopy navigation central lines, this study employs fitting time and angular deviation as the evaluation indicators. A smaller angular deviation between the manually labeled navigation central lines and those extracted by the system indicates a higher accuracy in navigation central line fitting. Formula 4 is presented below [33]:
θ = a r c t a n a 1 a r c t a n a 2
where a1 and a2 represent the slopes of the two types of lines, respectively.
In order to evaluate the fitting efficiency of the algorithm, we statistically calculate the average fitting time for the tea canopy navigation central lines, as illustrated in Formula 5:
t = m = 1 M t m M
where tm denotes the time required to fit the navigation central line for the m-th image, and M represents the total number of sampled images within the video.

3. Results

3.1. Experimental Parameter Setting

The hardware configuration utilized for model training in this study is as follows: the CPU employed is an Intel(R) Xeon(R) Silver 4214, operating at a frequency of 2.20 GHz and featuring 48 cores; additionally, two NVIDIA GeForce RTX 2080 Ti GPUs are incorporated into the setup. Throughout all the model training processes, the hyperparameters are consistently maintained. The specific parameter settings are detailed below: The total number of training epochs is set to 300, with the initial freezing stage comprising 50 epochs. During this freezing phase, the batch size is configured to be eight, which is subsequently adjusted to four during the unfreezing stage. The maximum learning rate has been established at 7 × 10⁻³, while the minimum learning rate corresponds to 0.01 times the maximum learning rate. The chosen optimizer for this study is SGD, and the strategy for learning rate decay employs the Cosine Annealing Learning Rate method.

3.2. Experiment on Semantic Segmentation of Tea Canopy

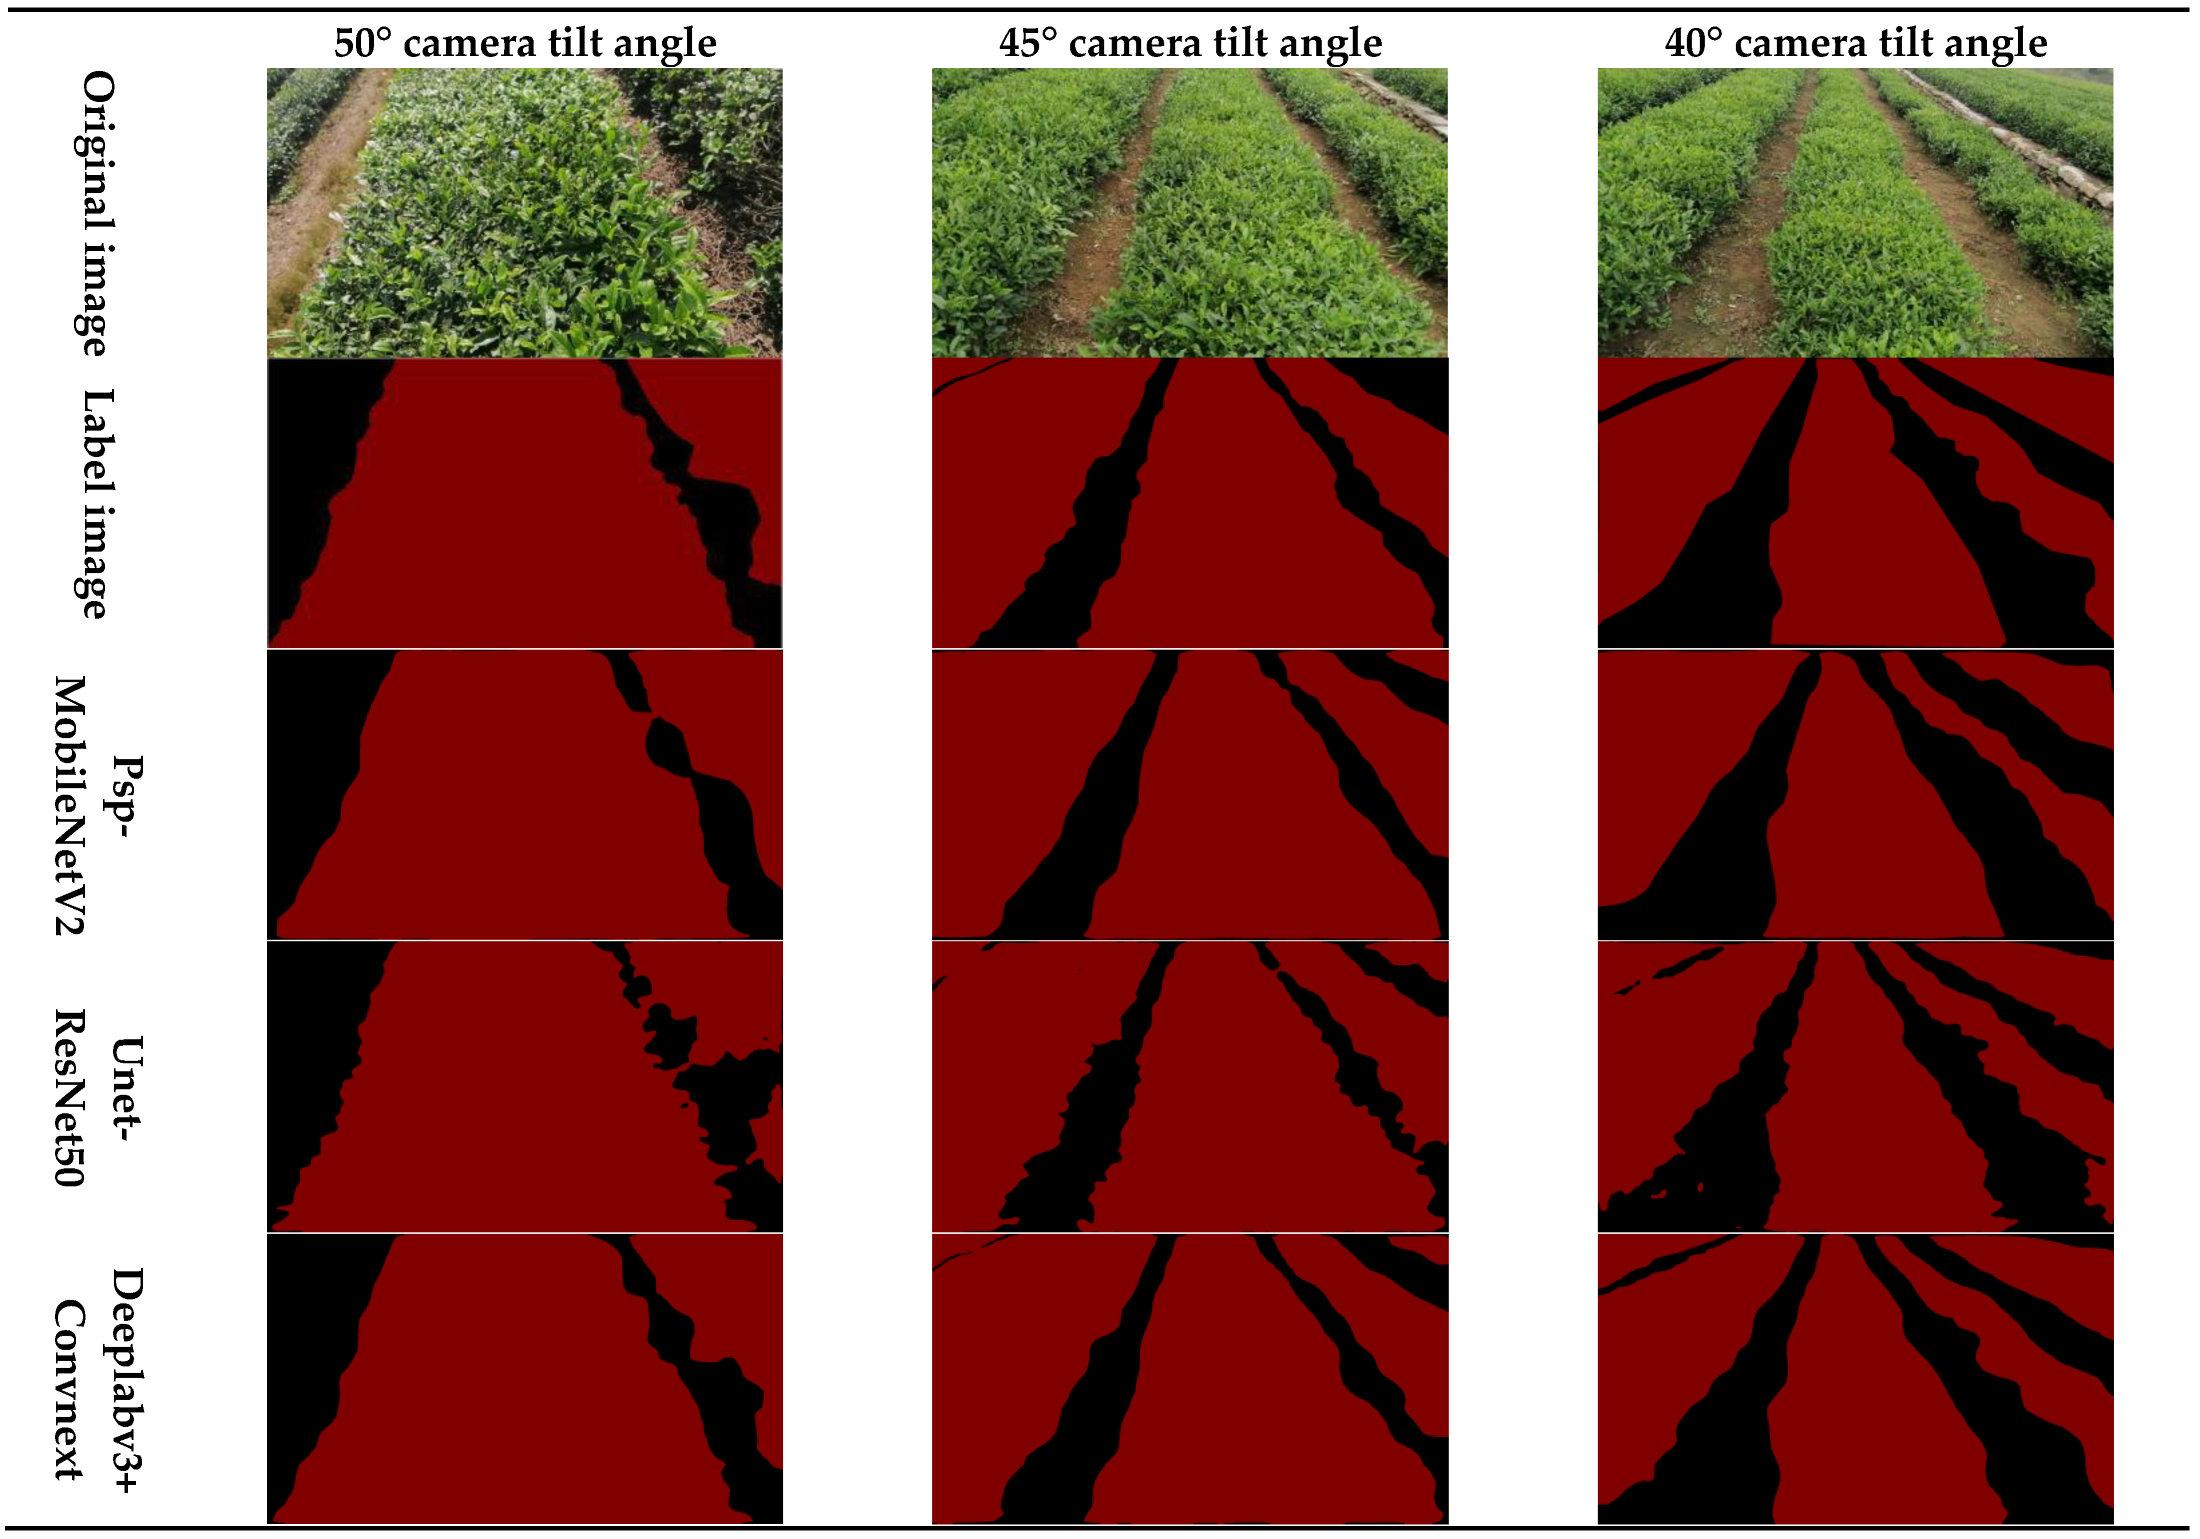
3.2.1. Comparative Experiments with Multiple Framework Models

We selected three widely used and high-performance semantic segmentation frameworks PspNet, U-Net, and Deeplabv3+ for comparative experiments conducted in recent years. Table 1 presents a comparison of the segmentation metrics for these three different framework models on the validation set. From the table, it is evident that the mIoU of the Deeplabv3+Convnext model reaches 93.75%, which represents an improvement of 2.1% and 9.54% compared to the PspNet and U-Net network framework models, respectively, under identical backbone network conditions. When comparing with the optimal segmentation models within the PspNet and U-Net frameworks, namely PspNet+MobileNetV2 and U-Net+ResNet50, we observe that the mIoU increases by 1.52%, while mAP rises by 1.68%, and F1-score improves by 1.46% for Deeplabv3+Convnext against PspNet; similarly, there are enhancements of 0.91%, 1.71%, and 2.18%, respectively, when compared with U-Net. Although the parameter size of the Deeplabv3+Convnext model is recorded at 118.57 MB which exceeds that of PspNet+MobileNetV2 at just 2.38 MB and U-Net+ResNet50 at approximately 43.93 MB and its inference speed stands at only 6.4 FPS, it still fulfills the practical application requirements outlined in this study effectively.
Figure 11 illustrates the segmentation results from the leading models across all three frameworks at various camera tilt angles. In scenarios with a camera tilt angle of 50°, only the Deeplabv3+Convnext model was able to completely segment the tea canopies; conversely, both PspNet and U-Net exhibited adhesion between the tea canopies while processing along the right edge of the middle tea canopy, resulting in incomplete segmentation outcomes. At camera tilt angles of 45° and 40°, when addressing relatively blurry tea canopies located at a distance, this same model consistently maintained accurate segmentation results by successfully isolating each row of tea canopies entirely and independently. In contrast, the other models misidentified multiple rows as a single row due to significant segmentation errors.

3.2.2. Basic Comparison Experiment

This study is grounded in the Deeplabv3+ model, with experiments conducted utilizing the enhanced CDSC-Deeplabv3+ network. Here, CDSC refers to the Convnext network employed as the feature extraction backbone, incorporating DenseASPP, SP, and CFF modules. To validate the effectiveness of the improvements made to CDSC-Deeplabv3+ and mitigate any potential influence of Convnext as the backbone on experimental outcomes, we performed comparative experiments using Convnext, MobileNetV2, and ResNet50 as respective backbone networks.
Figure 12 illustrates the loss curves of each model throughout the training process. Notably, C-Deeplabv3+ denotes the Deeplabv3+ model utilizing Convnext as its backbone network; MDSC-Deeplabv3+ and RDSC-Deeplabv3+, on the other hand, represent improved versions employing MobileNetV2 and ResNet50, respectively. As shown in Figure 12b, all four models based on the Deeplabv3+ framework exhibit favorable convergence characteristics; however, it is evident that the CDSC-Deeplabv3+ model achieves a lower loss value compared to the others.
Figure 13 presents an analysis of prediction accuracy for these four models against a test dataset during their training stages. The fitting curves indicate that throughout training, the CDSC-Deeplabv3+ model consistently maintains superior prediction accuracy for tea canopies compared to all the alternative models while achieving peak accuracy levels.
Table 2 presents the detection results of the optimal models across four network frameworks on the test set. As illustrated in the table, the goodness of fit R2, accuracy, mAP, mIoU, and F1-score for the CDSC-Deeplabv3+ network is recorded at 0.88, 97.32%, 96.99%, 94.71%, and 98.66%, respectively, all representing the highest values among the compared models. Notably, CDSC-Deeplabv3+ exhibits superior segmentation performance relative to other models; particularly, with respect to the accuracy and mIoU metrics, it outperforms C-Deeplabv3+ by increments of 1.98% and 0.96%, respectively. Furthermore, the parameter size for CDSC-Deeplabv3+ is measured at 123.56 MB, only an increase of 4.99 MB over its pre-improved counterpart C-Deeplabv3+. The reduction in inference speed is minimal at just 1.4 FPS. In practical applications such as tea harvesting operations, it is noted that the typical traveling speed for tea-harvesting robots ranges from 1.0 to 2.5 km/s [34]. This translates to a forward distance traveled by the robot of less than 0.14 m within a program cycle duration of approximately 200 ms. Additionally, tea canopies are generally arranged in straight lines or exhibit low curvature without significant angle steering during robot operation control processes. Therefore, considering these factors associated with low-speed motion scenarios inherent in tea harvesting tasks, the currently achieved frame rate ensures stable control over robotic operations within this context.
Figure 14 illustrates the comparative segmentation performance of four models at three distinct camera tilt angles: 50°, 45°, and 40°. From the figure, it is evident that the CDSC-Deeplabv3+ network exhibits significant performance advantages across all three camera tilt angles. Notably, in complex scenarios such as regions with narrow tea canopy spacings (for instance, the lower right corner of the scene captured at a 50° camera tilt angle), this model successfully segments each individual tea canopy while the other models struggle with adhesion issues between canopies.
In the scene featuring a 40° camera tilt angle, for instance, regarding the two columns of tea canopies located in the upper left corner of the image, the CDSC-Deeplabv3+ model accurately differentiates them. In contrast, the other models incorrectly identify these canopies as a single entity. Although the C-Deeplabv3+ model also manages to distinguish these tea canopies correctly, its segmentation accuracy remains inferior compared to that of the CDSC-Deeplabv3+ model. Furthermore, when compared to manual labeling practices, the CDSC-Deeplabv3+ model demonstrates a higher overlap rate across various scenarios. This indicates that the enhanced model possesses robust capabilities and strong generalization abilities.

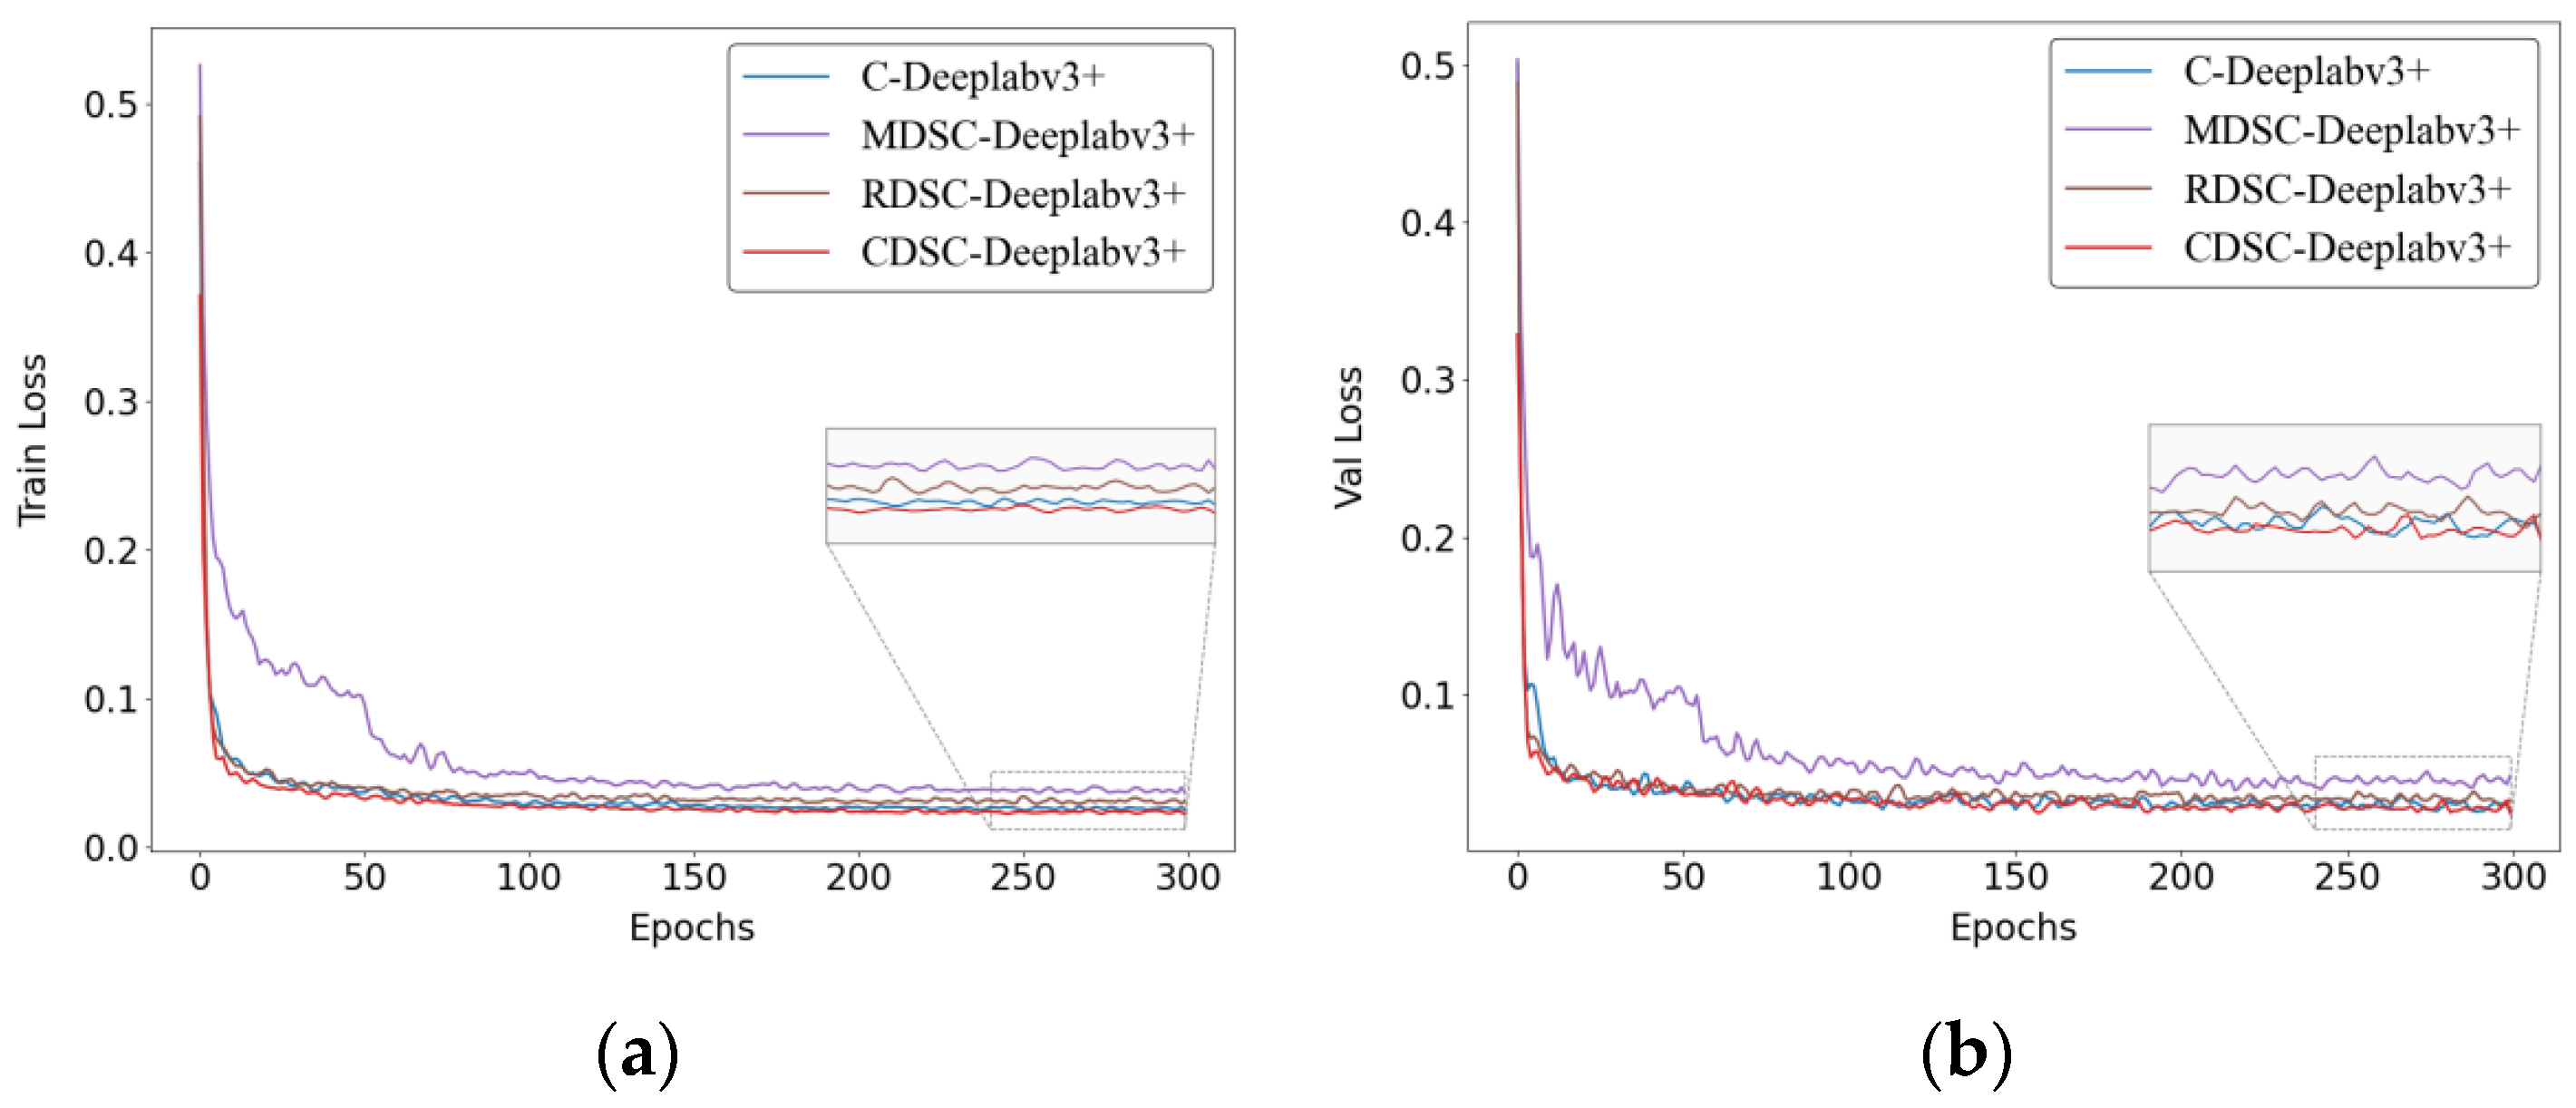
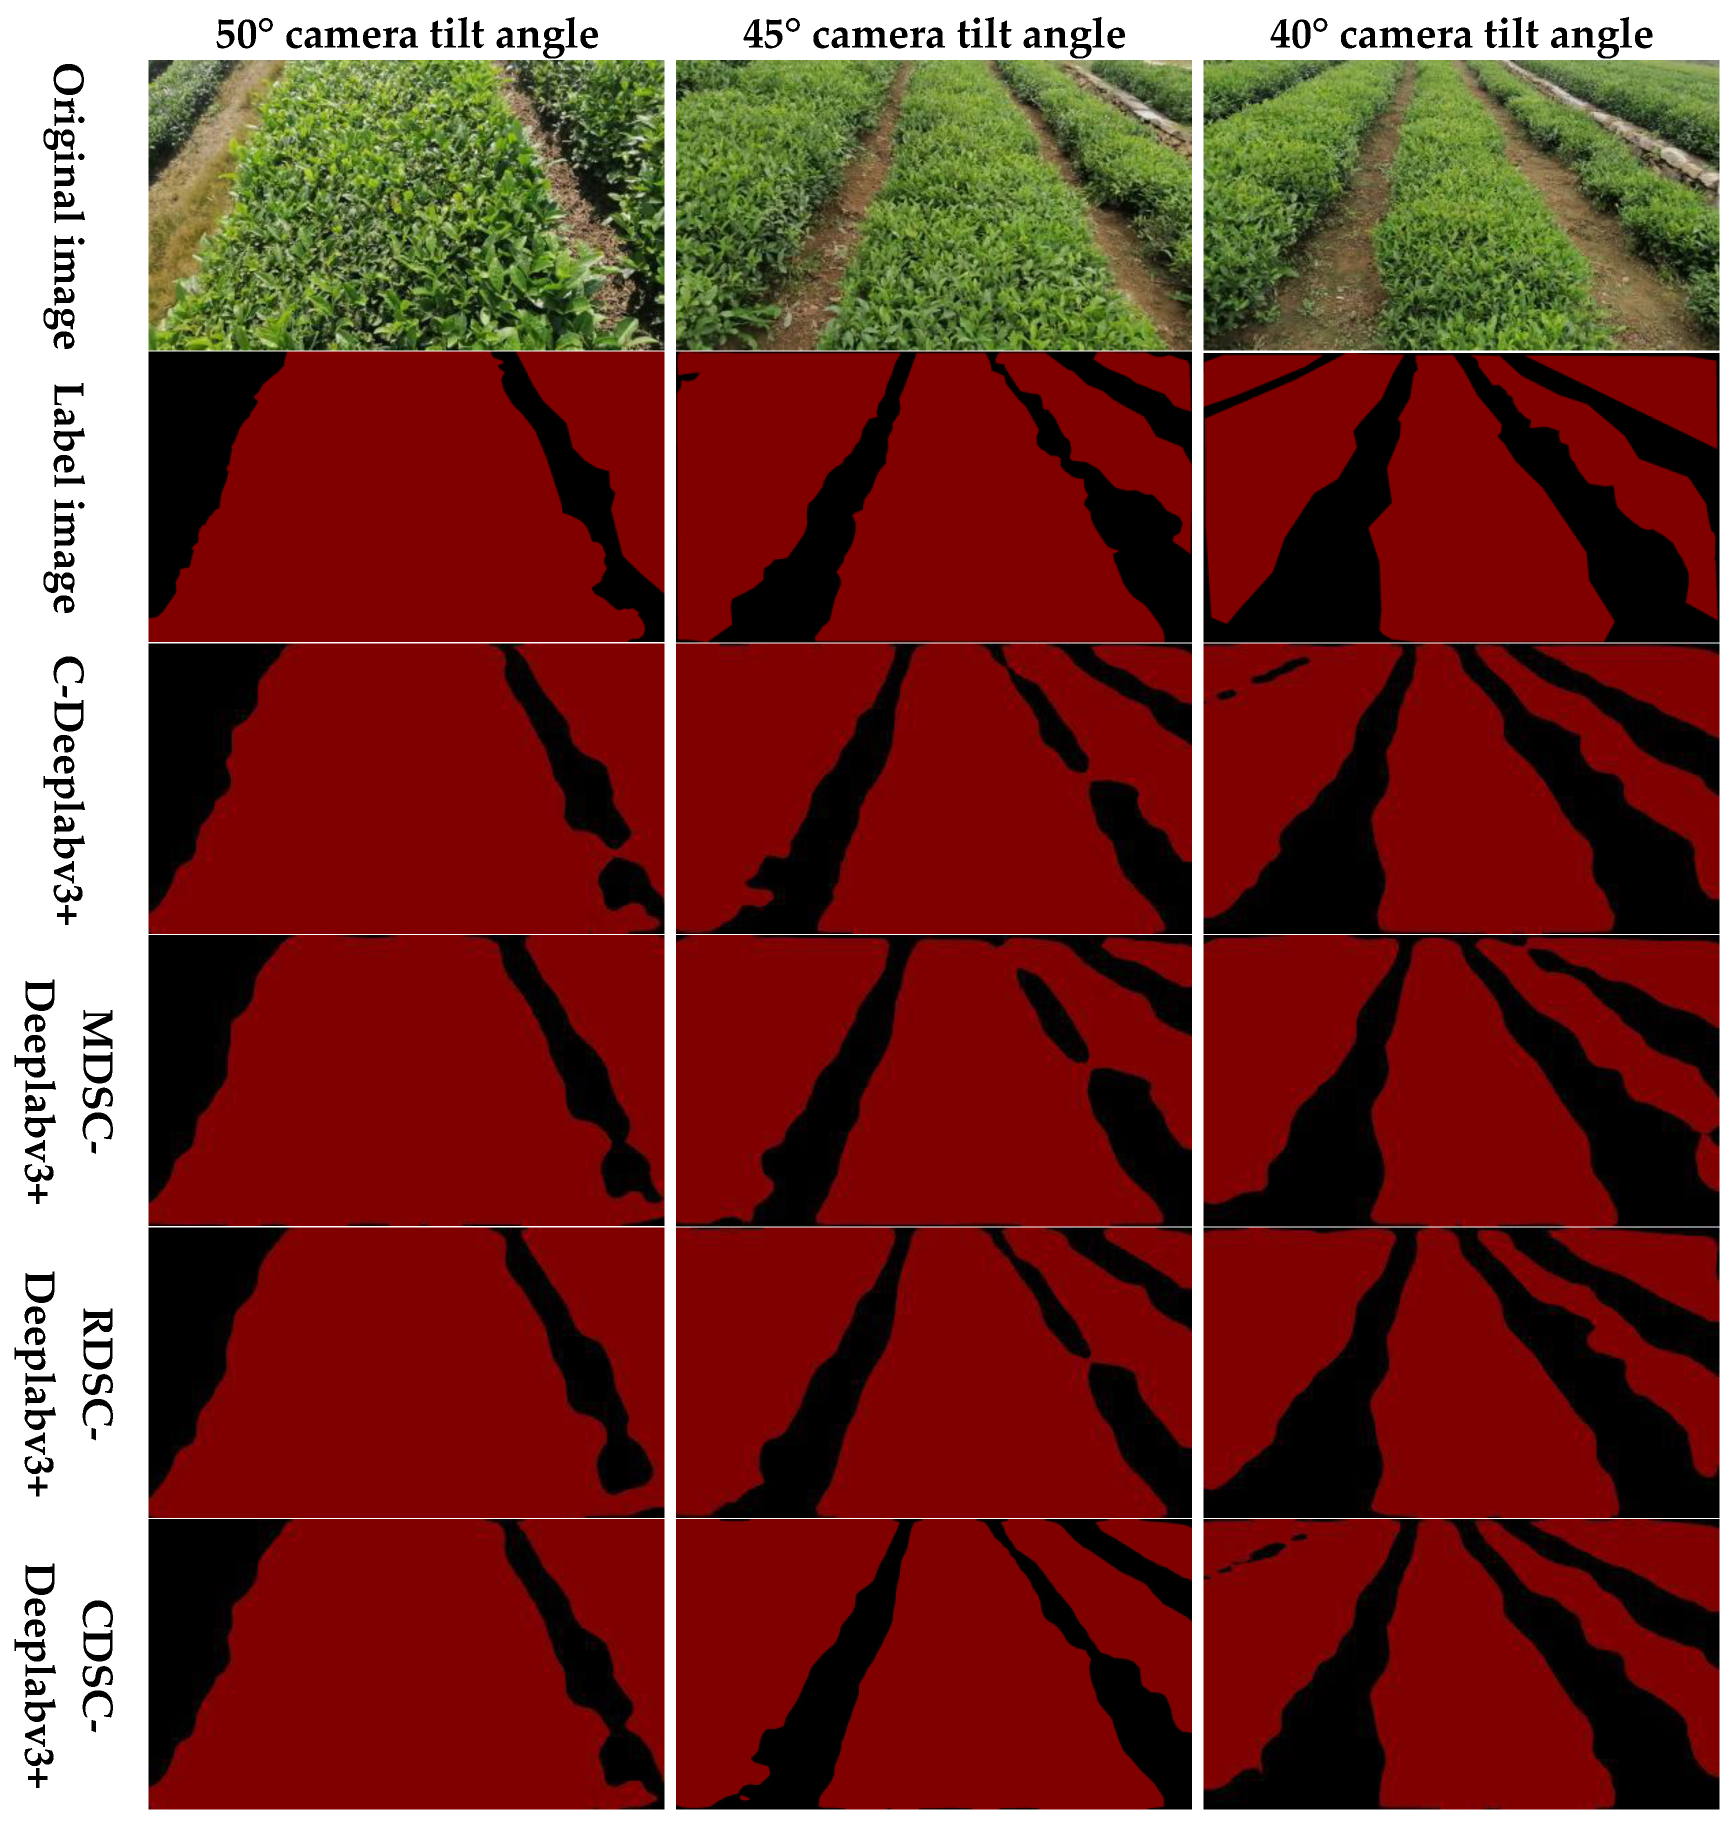
3.2.3. Ablation Experiments

To assess the effectiveness of the model enhancement techniques proposed in this study, we conducted a series of ablation experiments. In these experiments, the validation set served as the image data, with the network’s input image size configured to 512 × 512 × 3. Building upon the C-Deeplabv3+ model, we successively incorporated the DenseASPP, SP, and CFF modules to evaluate the performance of the improved models under various module combinations. The detailed results are presented in Table 3.
This experiment utilizes C-Deeplabv3+ as the baseline model and systematically verifies the contribution of each module based on this foundation. According to the data presented in Table 3, the mAP, mIoU, F1-score, parameter, and FPS for the baseline model C-Deeplabv3+ are recorded at 96.57%, 93.75%, 98.21%, 118.57 MB, and 6.4, respectively. Upon substituting the original ASPP module with DenseASPP, we observed an increase in mAP for CD-Deeplabv3+ by 0.08% to reach 96.65%, indicating that this modification effectively enhanced feature extraction capabilities within the model. Furthermore, after integrating an SP branch into the ASPP module, there was a notable improvement in the F1-score for CS-Deeplabv3+, which increased by 0.06% to achieve a value of 98.27%. This suggests that the incorporation of SP significantly bolstered feature expression abilities within our framework. Regarding module combinations, employing both CFF and SP modules jointly led to enhancements in mAP and mIoU for CSC-Deeplabv3+, increasing them by 0.07% and 0.08%, respectively, resulting in values of 96.64% for mAP and 93.83% for mIoU with a marked improvement evident overall. By comparing the CD-Deeplabv3+ and CDC-Deeplabv3+ models, it is observed that the introduction of the CFF module resulted in a reduction of 3.35 MB in parameter size for the CD-Deeplabv3+ model while simultaneously enhancing inference speed by 1.0 FPS. This indicates that the CFF module effectively reduces model complexity and improves inference efficiency. Furthermore, when all the improved modules were integrated into the original network, the CDSC-Deeplabv3+ model demonstrated increases in mAP, mIoU, and F1-score by 0.42%, 0.96%, and 0.45%, respectively, achieving values of 96.99%, 94.71%, and 98.66%. These results signify optimal performance for this configuration.

3.3. Navigation Central Line Fitting Experiments

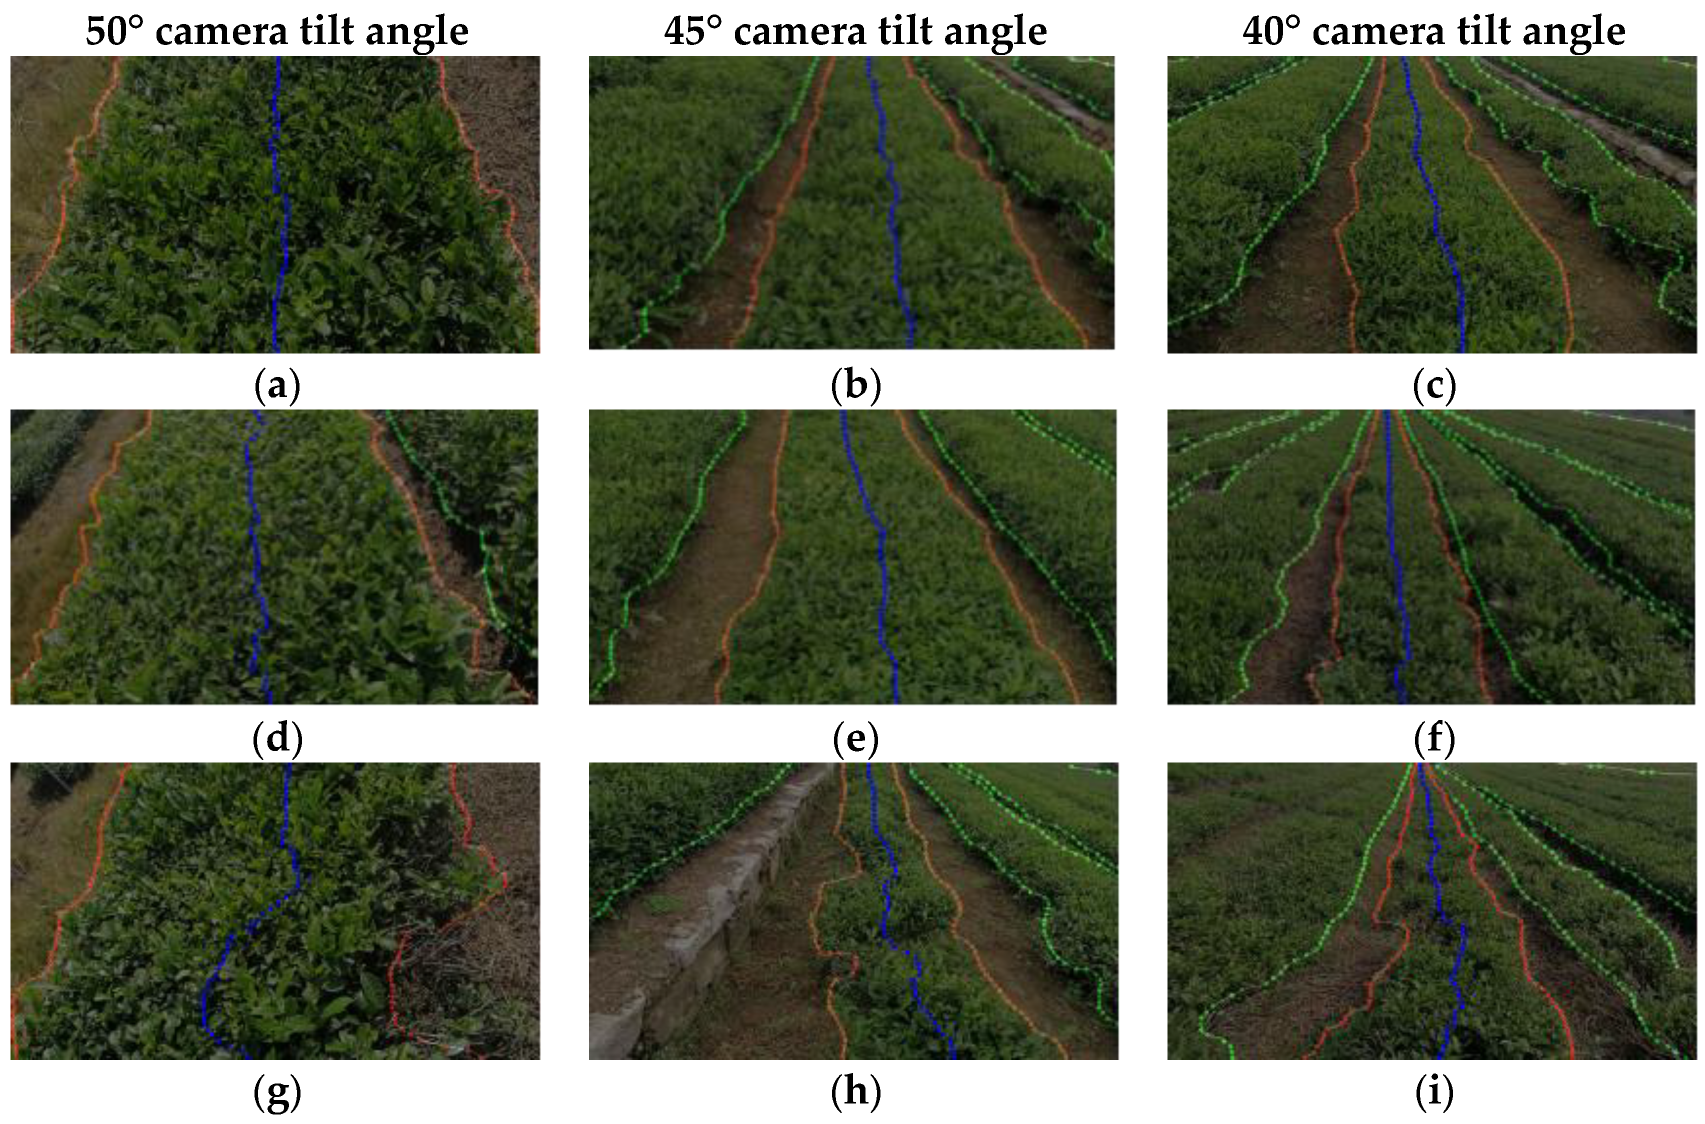
3.3.1. Experiment on the Extraction of Edge Lines and Central Point Sequences of Tea Canopy

To verify the effectiveness of extracting the tea canopy edge line, we processed the binary image obtained from model segmentation using the Canny edge detection algorithm. Leveraging the significant color contrast between the tea canopy area (red) and the ground area (black), the precise detection of the tea canopy boundary can be achieved. By filtering out invalid edge pixels associated with the tea canopy and retaining only valid edge coordinate points corresponding to the target tea canopy where the tea-harvesting robot is situated, we extracted edge pixel coordinates at equal intervals along the longitudinal direction to compute the central point coordinates.
Figure 15 presents the results of the experiments conducted to extract the coordinates of center points from tea canopies at three different camera tilt angles (50°, 45°, and 40°) across varying degrees of regularity. Specifically, images (a) to (c) depict rows of regular tea canopies, images (d) to (f) display relatively regular tea canopy rows, while images (g) to (i) illustrate irregular tea canopy formations. In these figures, the white lines represent the edge boundaries of the tea canopies; the green dots denote the invalid edge points that have been filtered out; the red dots indicate the valid edge points utilized for calculating center points; and the blue dots signify the computed center points. The experimental findings demonstrate that the algorithm employed in this study effectively extracts the edge boundaries of tea canopies and accurately determines their center points across different levels of regularity under various camera tilt angles. This capability holds significant potential for facilitating path planning of tea-harvesting robots.

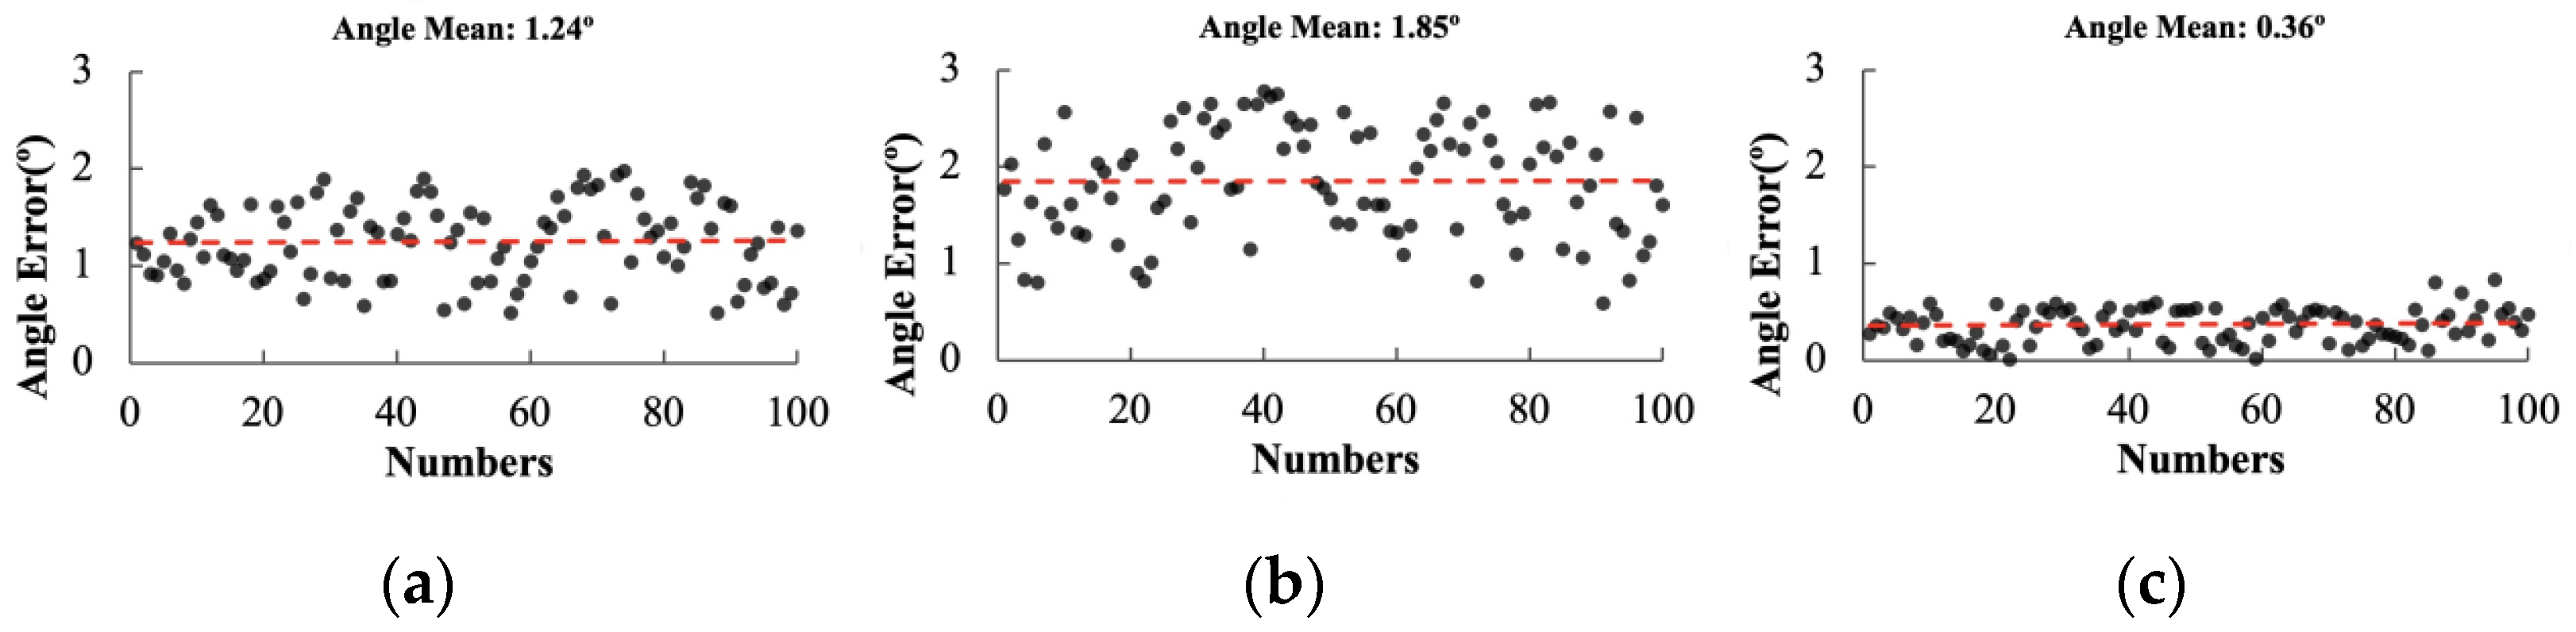
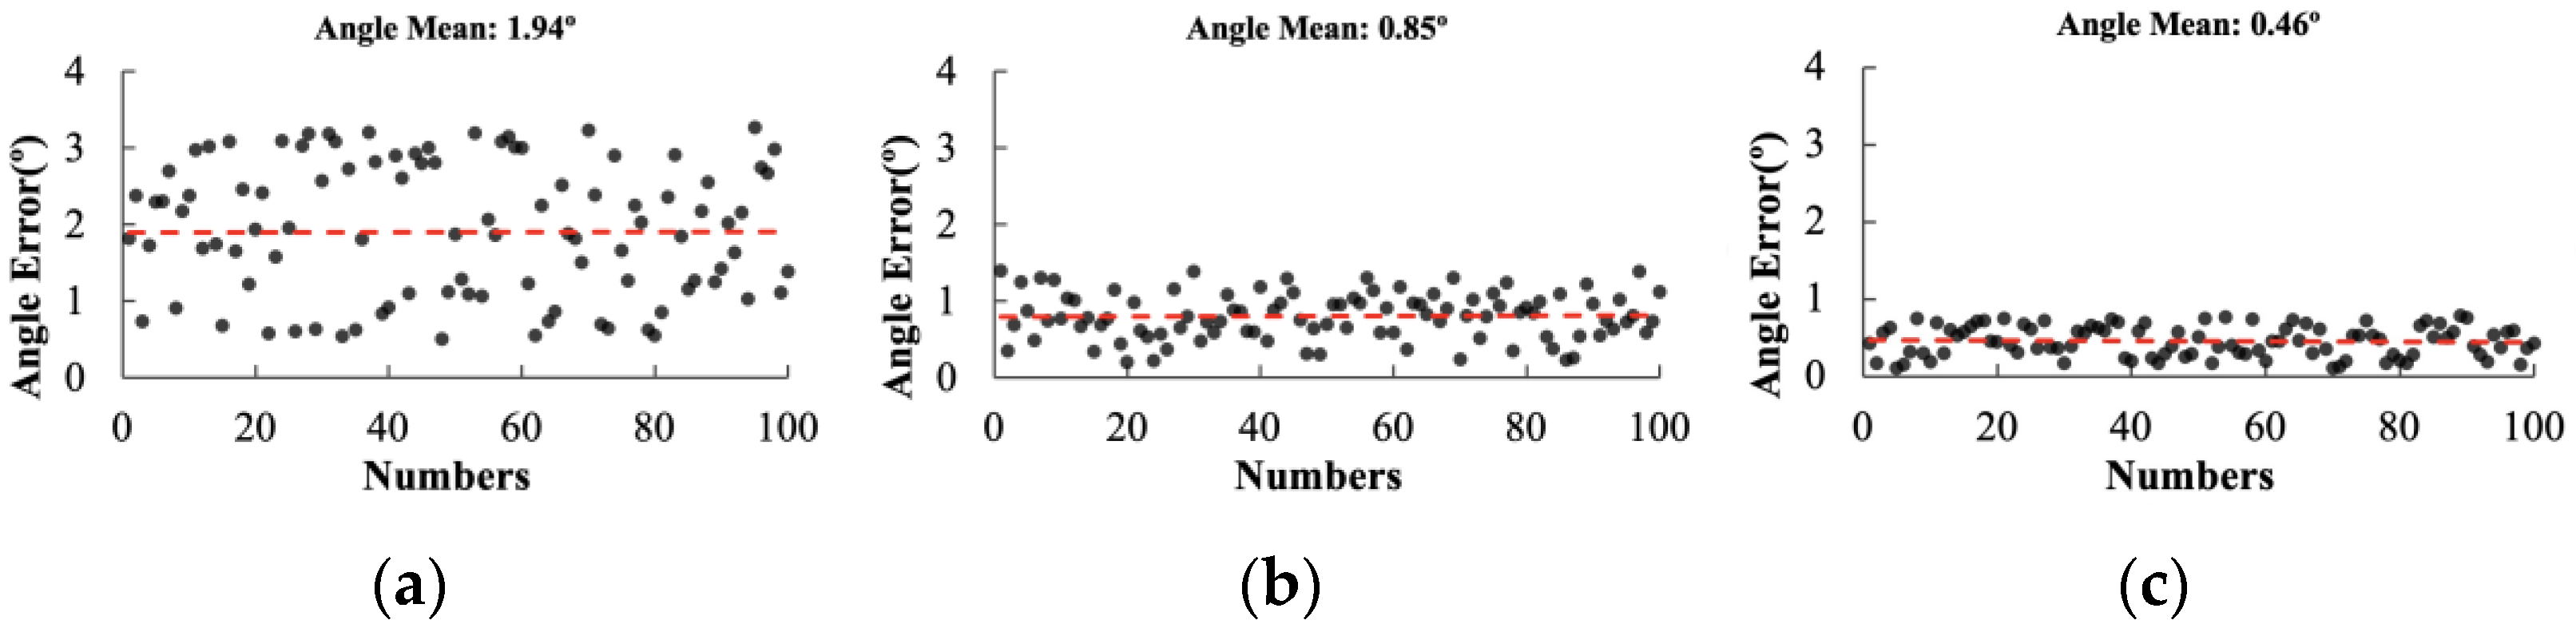
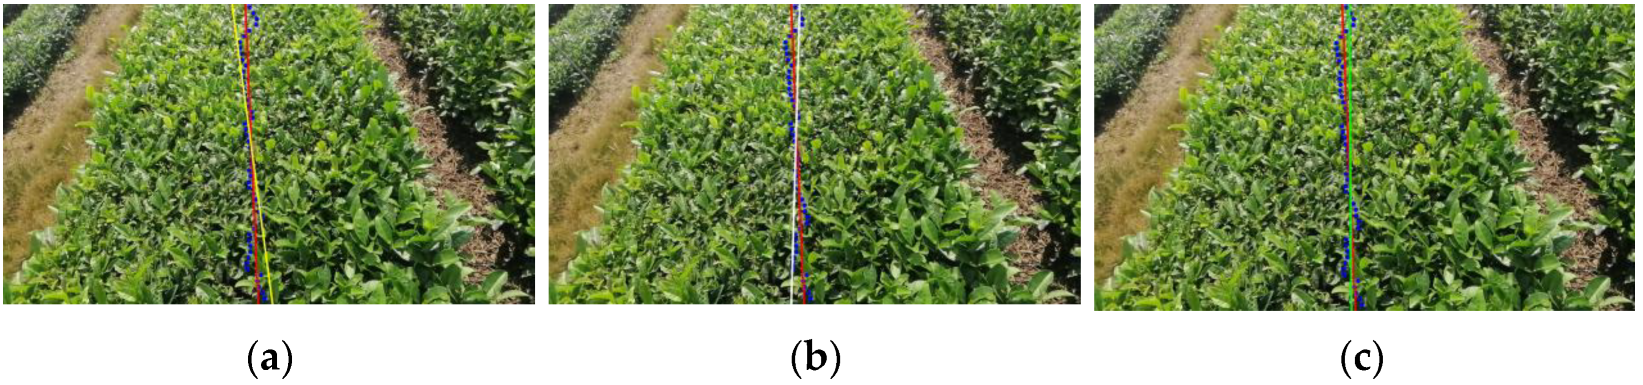
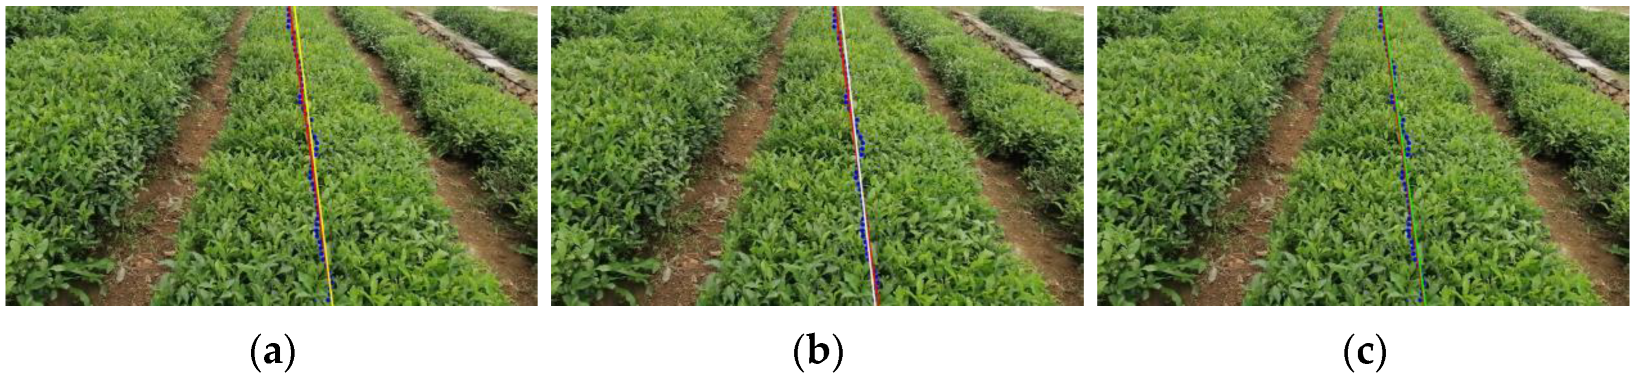
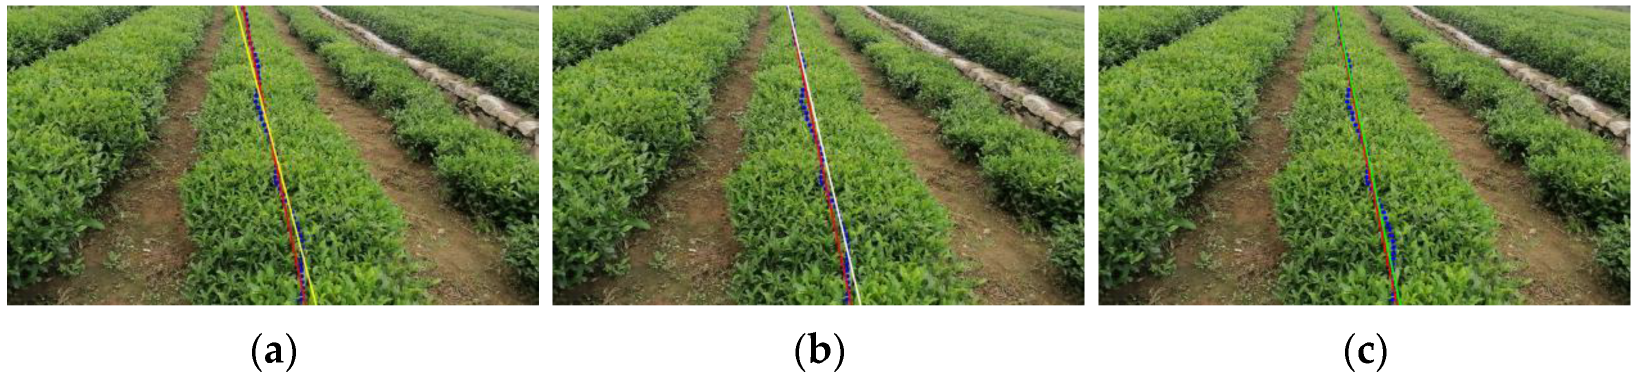
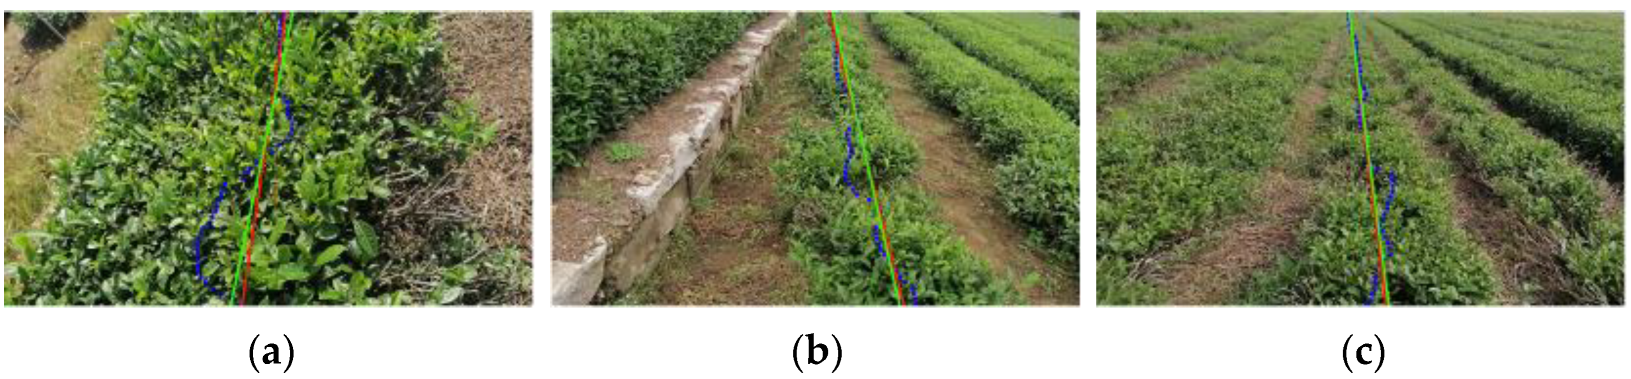
3.3.2. Comparison Experiment of Different Navigation Central Line Fitting Algorithms

Based on the tea canopy test set derived from semantic segmentation and the sequence of central points of tea canopies, 100 images were selected for each camera tilt angle of 50°, 45°, and 40°. The fitting results for the tea row navigation central line utilizing RANSAC, least squares method, and Hough transform algorithms are presented in Table 4 and Figure 16, Figure 17 and Figure 18. In these figures, the black dots represent the angle deviations of the tea row navigation central lines fitted by each algorithm’s least squares method, Hough transform, and RANSAC, while the red dotted lines indicate the average values of these angle deviations across all the fitted tea row navigation central lines.
The findings reveal that at a camera tilt angle of 50°, the average angular deviation for the tea row navigation central line fitted using RANSAC is measured at 2.02°, which is lower by 3.2° compared to that obtained via the least squares method and by 0.14° when contrasted with Hough transform. Furthermore, its average fitting time stands at an impressive 56.4 ms, representing a reduction of approximately 99.32% relative to that required by the Hough transform. At a camera tilt angle of 45°, RANSAC again demonstrates superior performance with an average angular deviation of just 0.36°. This value is lower than those achieved through the least squares method by 0.88° and Hough transform by 1.49°. Additionally, its average fitting time amounts to only 44.7 ms, a decrease of around 99.40% compared to that needed for the Hough transform. For a camera tilt angle of 40°, RANSAC maintains consistency in performance with an average angular deviation remaining at 0.46°. This represents reductions against both least squares method 1.48° lower and the Hough transform 0.34° lower, while achieving an average fitting time of merely 48.3 ms again demonstrating significant efficiency improvements over the Hough transform by about 99.35%. In summary, the RANSAC algorithm consistently achieves optimal fitting outcomes across all three tested camera tilt angles. While its mean fitting duration may be slightly longer than that associated with least square methods, it, nonetheless, delivers high efficiency alongside remarkable accuracy when determining precise fittings for navigation central lines within tea canopies.
Figure 19, Figure 20 and Figure 21 illustrate the comparative effects of three fitting algorithms under varying camera tilt angles. The blue dots denote the central points of the tea canopies as extracted by the model, while the red lines represent manually marked navigation central lines. The tea row navigation central lines, derived from fitting processes using the least squares method, Hough transform, and RANSAC algorithm, are indicated by the yellow lines, white lines, and green lines, respectively. In scenarios with a 50° camera tilt angle, the proximity of the camera to the tea canopies amplifies edge details. This magnification leads to an increased number of outliers during central point extraction. Consequently, all three algorithms exhibit considerable angular deviations in their fitted tea row navigation central lines; notably, among them, RANSAC demonstrates the smallest deviation. Through comparative analysis, it is evident that RANSAC provides superior overall fitting accuracy and its results closely align with those of manually marked navigation central lines. This advantage becomes particularly pronounced at camera tilt angles of 45° and 40°. While other algorithms show significant deviations from manual markings in their fitted navigation central lines, RANSAC’s fitted line nearly overlaps completely with those marks.
To assess the robustness of the navigation line fitting algorithm employed in this study within complex environments, we conducted an experiment involving navigation line fitting in an irregular tea canopy setting. As illustrated in Figure 22, the images captured at three camera tilt angles 50°, 45°, and 40° revealed challenges such as missing tea plants and uneven growth, which resulted in numerous outliers among the extracted center points of the tea canopies. Nevertheless, the RANSAC algorithm successfully identified and eliminated these interference points with precision. The navigation line fitting errors recorded under the three camera tilt angles were 2.73°, 0.45°, and 0.42°, respectively, indicating high fitting accuracy. The experimental results demonstrate that the algorithm exhibits strong adaptability to irregular tea canopies.

4. Discussion

Through the experiments and analyses conducted, the results indicate that the tea canopy segmentation model developed in this study demonstrates exceptional performance on the self-constructed dataset. Its mAP, mIoU, and F1-score are recorded at 96.99%, 94.71%, and 98.66%, respectively, all of which significantly surpass those of comparable models. The inference speed of the model is measured at 5.0 FPS, thereby fully satisfying the requirements for application outlined in this study. In terms of fitting tea row navigation central lines, this research employed the RANSAC algorithm and compared its efficacy with that of the least squares method and the Hough transform algorithm. The findings revealed that when extracting the tea row navigation central line, the average angular deviation and average fitting time for navigation central lines generated by the RANSAC algorithm were recorded at 0.95° and 49.8 ms, respectively, thereby facilitating the real-time and precise extraction of navigation central lines.
The model proposed in this study is compared and analyzed against crop row segmentation models employed in similar scenarios, as presented in Table 5. Li [14] enhanced feature representation by integrating the attention mechanism known as CBAM within the UNet architecture and substituting the backbone network to improve recognition accuracy. They utilized the least squares method to extract navigation lines from the segmentation results. The experimental findings indicate that the performance metrics mAP and mIoU for segmenting rapeseed rows achieved values of 90.15% and 87.3%, respectively, while the average fitting error and fitting time for navigation line extraction were recorded at 3.76° and 9 ms, respectively. Cheng [35] introduced a navigation line extraction method based on an improved DeepLabv3+ network tailored for the autonomous navigation of combine harvesters. This approach incorporates the MobileNetV2 module to optimize feature extraction, alongside employing Canny edge detection algorithms to accurately fit navigation lines derived from segmentation outcomes. The experimental results demonstrate that the segmentation performance metric mIoU for rice rows reached 79.22%, with an average fitting error of 3.14° for the navigation line. Additionally, other researchers replaced the backbone network with a novel spatial pyramid module (atrous), which significantly improved model performance in soybean row segmentation [36]. The corresponding performance indicators mAP and mIoU for soybean row segmentation were recorded at 92.1% and 82.9%, respectively. Subsequently, the CenterNet method was employed to analyze the segmentation map produced by our model to extract key points; here, the average angle difference in the navigation central line fitted using the RANSAC algorithm was found to be 2.09°. Moreover, Kong reengineered the upsampling module of their network to minimize computational load while enhancing inference speed [37]. They then utilized the Gou-Hall algorithm for feature point extraction, subsequently fitting a navigation central line between rice rows that resulted in an average angle difference of 1.91° along with an average fitting time of 24.6 ms. In comparison with these contemporary models, our proposed CDSC-Deeplabv3+ model demonstrated superior performance on the tea canopy dataset; notably, it yielded exceptional accuracy regarding tea row navigation central lines fitted based on the semantic segmentation results derived from employing the RANSAC algorithm.
In this paper, regarding the possible influences on tea harvesting operations under harsh environmental conditions, such as low light, overexposure, foggy days, dust generated during operations, and other environmental noises, we have currently carried out a preliminary optimization in the paper by enhancing the dataset. In the subsequent research, we will increase the robustness of the visual system through algorithm processing, and adopt technologies such as image filtering to remove noise, improve image quality, and further optimize the recognition and navigation accuracy of the system. Additionally, we also plan to collect data under different terrain environments, seasons, and weather conditions to further enhance the robustness of the visual navigation system.

5. Conclusions

This study aims to achieve the precise navigation and automatic control of unmanned tea-harvesting robots in complex tea garden environments. We propose a novel semantic segmentation model, CDSC-Deeplabv3+, based on the Deeplabv3+ framework, to facilitate the segmentation of tea canopies. Additionally, we integrate the RANSAC algorithm for fitting the navigation line, thereby constructing a comprehensive visual navigation solution that provides a technical foundation for the automatic harvesting of tea leaves. The innovations introduced by the CDSC-Deeplabv3+ model in this study are primarily reflected in three key aspects: Firstly, we incorporated the Convnext backbone network into our tea canopy segmentation framework, significantly enhancing segmentation accuracy through its robust feature extraction capabilities. Secondly, considering the morphological characteristics of tea canopies, we implemented a feature enhancement module with an SP dual-branch structure within the DenseASPP module. This effectively improved feature representation both horizontally and vertically. Furthermore, by introducing CFF, we supplemented crucial shallow feature information and achieved adaptive fusion between deep and shallow layer features. Collectively, these enhancements contributed to increased accuracy in segmenting tea canopies. Through comparative experiments involving various networks and semantic segmentation frameworks, the accuracy of the CDSC-Deeplabv3+ model was validated. On the test set, the model achieved an mAP of 97.04%, an mIoU of 94.71%, and an F1-score of 98.76%, significantly surpassing the other comparison models. Although the inference speed of the model was measured at 5.0 FPS, it still satisfied the practical application requirements for this study. Regarding the fitting process for tea canopy navigation lines, we employed the Canny algorithm to extract edge information from the segmented binary images. We further identified sequences of tea canopy center points by calculating the midpoints between edge points and utilized the RANSAC algorithm for navigating line fitting. The experimental results indicated that average angle deviations under camera tilt angles of 50°, 45°, and 40° were recorded at 2.02°, 0.36°, and 0.46°, respectively, with corresponding average fitting times of 56.4 ms, 44.7 ms, and 48.3 ms, respectively. This method not only achieved superior fitting accuracy but also met real-time task requirements in terms of fitting speed. In future research endeavors, our primary focus will be on optimizing model size and reducing parameter counts to enhance inference speed suitable for deployment on edge devices. Additionally, we aim to gather more extensive tea cluster data under varying lighting conditions to augment our dataset, thereby improving the robustness of our model for tea cluster segmentation.

Author Contributions

Conceptualization, R.Z. and L.Z.; methodology, L.Z. and H.T.; software, H.T.; validation, T.Y., D.Z. and H.T.; formal analysis, H.T. and M.W.; investigation, H.T. and L.Z.; resources, R.Z. and L.Z.; data curation, H.T. and M.W.; writing—original draft preparation, H.T.; writing—review and editing, H.T. and L.Z.; visualization, H.T. and M.W.; supervision, R.Z.; project administration, R.Z. and L.Z.; funding acquisition, R.Z. and L.Z. All authors have read and agreed to the published version of the manuscript.

Funding

This research was funded by the National Natural Science Foundation of China, grant number U23A20175-2.

Data Availability Statement

The original contributions presented in this study are included in the article. Further inquiries can be directed to the corresponding author.

Conflicts of Interest

The authors declare no conflicts of interest.

References

  1. Hang, Z.; Tong, F.; Xianglei, X.; Yunxiang, Y.; Guohong, Y. Research Status and Prospect of Tea Mechanized Picking Technology. J. Chin. Agric. Mech. 2023, 44, 28. [Google Scholar]
  2. Minglong, W.; Yao, X.; Zhihao, Z.; Lixue, Z.; Guichao, L. Research Progress of Intelligent Mechanized Tea Picking Technology and Equipment. J. Chin. Agric. Mech. 2024, 45, 305. [Google Scholar]
  3. Yu, R.; Xie, Y.; Li, Q.; Guo, Z.; Dai, Y.; Fang, Z.; Li, J. Development and Experiment of Adaptive Oolong Tea Harvesting Robot Based on Visual Localization. Agriculture 2024, 14, 2213. [Google Scholar] [CrossRef]
  4. Wang, T.; Zhang, K.; Zhang, W.; Wang, R.; Wan, S.; Rao, Y.; Jiang, Z.; Gu, L. Tea Picking Point Detection and Location Based on Mask-RCNN. Inf. Process. Agric. 2023, 10, 267–275. [Google Scholar] [CrossRef]
  5. Xu, W.; Zhao, L.; Li, J.; Shang, S.; Ding, X.; Wang, T. Detection and Classification of Tea Buds Based on Deep Learning. Comput. Electron. Agric. 2022, 192, 106547. [Google Scholar] [CrossRef]
  6. Yan, C.; Chen, Z.; Li, Z.; Liu, R.; Li, Y.; Xiao, H.; Lu, P.; Xie, B. Tea Sprout Picking Point Identification Based on Improved DeepLabV3+. Agriculture 2022, 12, 1594. [Google Scholar] [CrossRef]
  7. Moeller, R.; Deemyad, T.; Sebastian, A. Autonomous Navigation of an Agricultural Robot Using RTK GPS and Pixhawk. In Proceedings of the 2020 Intermountain Engineering, Technology and Computing (IETC), Orem, UT, USA, 2–3 October 2020; pp. 1–6. [Google Scholar]
  8. Oksanen, T.; Backman, J. Guidance System for Agricultural Tractor with Four Wheel Steering. IFAC Proc. Vol. 2013, 46, 124–129. [Google Scholar] [CrossRef]
  9. Yan, F.; Hu, X.; Xu, L.; Wu, Y. Construction and Accuracy Analysis of a BDS/GPS-Integrated Positioning Algorithm for Forests. Croat. J. For. Eng. J. Theory Appl. For. Eng. 2021, 42, 321–335. [Google Scholar] [CrossRef]
  10. Gao, P.; Lee, H.; Jeon, C.-W.; Yun, C.; Kim, H.-J.; Wang, W.; Liang, G.; Chen, Y.; Zhang, Z.; Han, X. Improved Position Estimation Algorithm of Agricultural Mobile Robots Based on Multisensor Fusion and Autoencoder Neural Network. Sensors 2022, 22, 1522. [Google Scholar] [CrossRef] [PubMed]
  11. Corno, M.; Furioli, S.; Cesana, P.; Savaresi, S.M. Adaptive Ultrasound-Based Tractor Localization for Semi-Autonomous Vineyard Operations. Agronomy 2021, 11, 287. [Google Scholar] [CrossRef]
  12. Wang, R.; Wang, S.; Xue, J.; Chen, Z.; Si, J. Obstacle Detection and Obstacle-Surmounting Planning for a Wheel-Legged Robot Based on Lidar. Robot. Intell. Autom. 2024, 44, 19–33. [Google Scholar] [CrossRef]
  13. De Silva, R.; Cielniak, G.; Wang, G.; Gao, J. Deep Learning-Based Crop Row Detection for Infield Navigation of Agri-Robots. J. Field Robot. 2024, 41, 2299–2321. [Google Scholar] [CrossRef]
  14. Li, G.; Le, F.; Si, S.; Cui, L.; Xue, X. Image Segmentation-Based Oilseed Rape Row Detection for Infield Navigation of Agri-Robot. Agronomy 2024, 14, 1886. [Google Scholar] [CrossRef]
  15. Adhikari, S.P.; Kim, G.; Kim, H. Deep Neural Network-Based System for Autonomous Navigation in Paddy Field. IEEE Access 2020, 8, 71272–71278. [Google Scholar] [CrossRef]
  16. Chen, L.-C.; Zhu, Y.; Papandreou, G.; Schroff, F.; Adam, H. Encoder-Decoder with Atrous Separable Convolution for Semantic Image Segmentation. In Computer Vision—ECCV 2018, 15th European Conference, Munich, Germany, 8–14 September 2018; Springer: Cham, Switzerland, 2018. [Google Scholar]
  17. Zhao, H.; Shi, J.; Qi, X.; Wang, X.; Jia, J. Pyramid Scene Parsing Network. In Proceedings of the 2017 IEEE Conference on Computer Vision and Pattern Recognition (CVPR), Honolulu, HI, USA, 21–26 July 2017. [Google Scholar]
  18. Ronneberger, O.; Fischer, P.; Brox, T. U-Net: Convolutional Networks for Biomedical Image Segmentation. In Medical Image Computing and Computer-Assisted Intervention—MICCAI 2015, 18th International Conference, Munich, Germany, 5–9 October 2015; Springer: Cham, Switzerland, 2015. [Google Scholar]
  19. Chollet, F. Xception: Deep Learning with Depthwise Separable Convolutions. In Proceedings of the 2017 IEEE Conference on Computer Vision and Pattern Recognition (CVPR), Honolulu, HI, USA, 21–26 July 2017; pp. 1800–1807. [Google Scholar]
  20. He, K.; Zhang, X.; Ren, S.; Sun, J. Deep Residual Learning for Image Recognition. In Proceedings of the 2016 IEEE Conference on Computer Vision and Pattern Recognition (CVPR), Las Vegas, NV, USA, 27–30 June 2016; pp. 770–778. [Google Scholar]
  21. Howard, A.G.; Zhu, M.; Chen, B.; Kalenichenko, D.; Wang, W.; Weyand, T.; Andreetto, M.; Adam, H. Mobilenets: Efficient convolutional neural networks for mobile vision applications. arXiv 2017, arXiv:1704.04861. [Google Scholar]
  22. Woo, S.; Debnath, S.; Hu, R.; Chen, X.; Liu, Z.; Kweon, I.S.; Xie, S. Convnext v2: Co-designing and scaling convnets with masked autoencoders. In Proceedings of the IEEE/CVF Conference on Computer Vision and Pattern Recognition, Vancouver, BC, Canada, 17–24 June 2023; pp. 16133–16142. [Google Scholar]
  23. Liu, Z.; Lin, Y.; Cao, Y.; Hu, H.; Wei, Y.; Zhang, Z.; Lin, S.; Guo, B. Swin Transformer: Hierarchical Vision Transformer Using Shifted Windows. In Proceedings of the 2021 IEEE/CVF International Conference on Computer Vision (ICCV), Montreal, QC, Canada, 10–17 October 2021. [Google Scholar]
  24. Liu, Z.; Mao, H.; Wu, C.-Y.; Feichtenhofer, C.; Darrell, T.; Xie, S. A ConvNet for the 2020s. In Proceedings of the 2022 IEEE/CVF Conference on Computer Vision and Pattern Recognition (CVPR), New Orleans, LA, USA, 18–24 June 2022. [Google Scholar]
  25. He, K.; Zhang, X.; Ren, S.; Sun, J. Spatial Pyramid Pooling in Deep Convolutional Networks for Visual Recognition. IEEE Trans. Pattern Anal. Mach. Intell. 2014, 37, 1904–1916. [Google Scholar] [CrossRef] [PubMed]
  26. Hou, Q.; Zhang, L.; Cheng, M.-M.; Feng, J. Strip Pooling: Rethinking Spatial Pooling for Scene Parsing. In Proceedings of the 2020 IEEE/CVF Conference on Computer Vision and Pattern Recognition (CVPR), Seattle, WA, USA, 13–19 June 2020. [Google Scholar]
  27. Wang, C.; Wang, H. Cascaded Feature Fusion with Multi-Level Self-Attention Mechanism for Object Detection. Pattern Recognit. 2023, 138, 109377. [Google Scholar] [CrossRef]
  28. Canny, J. A Computational Approach to Edge Detection. IEEE Trans. Pattern Anal. Mach. Intell. 1986, PAMI–8, 679–698. [Google Scholar] [CrossRef]
  29. Guo, P.; Diao, Z.; Zhao, C.; Li, J.; Zhang, R.; Yang, R.; Ma, S.; He, Z.; Zhao, S.; Zhang, B. Navigation line extraction algorithm for corn spraying robot based on YOLOv8s-CornNet. J. Field Robot. 2024, 41, 1887–1899. [Google Scholar] [CrossRef]
  30. Winterhalter, W.; Fleckenstein, F.; Dornhege, C.; Burgard, W. Localization for Precision Navigation in Agricultural Fields—Beyond Crop Row Following. J. Field Robot. 2021, 38, 429–451. [Google Scholar] [CrossRef]
  31. Chaudhari, S.; Mithal, V.; Polatkan, G.; Ramanath, R. An Attentive Survey of Attention Models. ACM Trans. Intell. Syst. Technol. 2021, 12, 1–32. [Google Scholar] [CrossRef]
  32. Luo, C.; Carey, M.J. LSM-Based Storage Techniques: A Survey. VLDB J. 2020, 29, 393–418. [Google Scholar] [CrossRef]
  33. Yang, R.; Zhai, Y.; Zhang, J.; Zhang, H.; Tian, G.; Zhang, J.; Huang, P.; Li, L. Potato Visual Navigation Line Detection Based on Deep Learning and Feature Midpoint Adaptation. Agriculture 2022, 12, 1363. [Google Scholar] [CrossRef]
  34. Du, X.; Hong, F.; Ma, Z.; Zhao, L.; Zhuang, Q.; Jia, J.; Chen, J.; Wu, C. CYVIO: A visual inertial odometry to acquire real-time motion information of profiling tea harvester along the planting ridge. Comput. Electron. Agric. 2024, 224, 109116. [Google Scholar] [CrossRef]
  35. Cheng, G.; Jin, C.; Chen, M. DeeplabV3+-Based Navigation Line Extraction for the Sunlight Robust Combine Harvester. Sci. Prog. 2024, 107, 00368504231218607. [Google Scholar] [CrossRef] [PubMed]
  36. Liu, Q.; Zhao, J. MA-Res U-Net: Design of Soybean Navigation System with Improved U-Net Model. PHYTON 2024, 93, 2663–2681. [Google Scholar] [CrossRef]
  37. Kong, X.; Guo, Y.; Liang, Z.; Zhang, R.; Hong, Z.; Xue, W. A Method for Recognizing Inter-Row Navigation Lines of Rice Heading Stage Based on Improved ENet Network. Measurement 2025, 241, 115677. [Google Scholar] [CrossRef]
Figure 1. Collection of image dataset from tea canopy. (a) Dataset acquisition experiment; (b) schematic of camera shooting angle.
Electronics 14 00988 g001
Figure 2. Original image of tea canopy. (a) The 50° camera tilt angle; (b) the 45° camera tilt angle; (c) the 40° camera tilt angle.
Electronics 14 00988 g002
Figure 3. Tea canopy label image. (a) The 50° camera tilt angle; (b) the 45° camera tilt angle; (c) the 40° camera tilt angle.
Electronics 14 00988 g003
Figure 4. Enhancement results of tea ridge dataset.
Electronics 14 00988 g004
Figure 5. CDSC-Deeplabv3+ model structure.
Electronics 14 00988 g005
Figure 6. Convnext network structure.
Electronics 14 00988 g006
Figure 7. DenseASP_SP module structure.
Electronics 14 00988 g007
Figure 8. Strip Pooling unit structure.
Electronics 14 00988 g008
Figure 9. CFF unit structure.
Electronics 14 00988 g009
Figure 10. Sequence extraction steps of tea canopy central points. (a) Tea canopy binary image; (b) tea canopy edge detection and edge coordinate extraction; (c) calculate the sequence of central points of the tea canopy.
Electronics 14 00988 g010
Figure 11. Segmentation results of different frame models.
Electronics 14 00988 g011
Figure 12. Loss curve graph. (a) Train Loss; (b) Val Loss.
Electronics 14 00988 g012
Figure 13. Accuracy fitting curve graph.
Electronics 14 00988 g013
Figure 14. The segmentation results of tea canopies by the four models under three camera tilt angles.
Electronics 14 00988 g014
Figure 15. Tea canopy edge extraction and pixel coordinate point generation. Images (ac) depict rows of regular tea canopies; images (df) display relatively regular tea canopy rows; Images (gi) illustrate irregular tea canopy formations.
Electronics 14 00988 g015
Figure 16. The fitting accuracy of three fitting algorithms at a 50° camera tilt angle. (a) LSM; (b) Hough; (c) RANSAC.
Electronics 14 00988 g016
Figure 17. The fitting accuracy of three fitting algorithms at a 45° camera tilt angle. (a) LSM; (b) Hough; (c) RANSAC.
Electronics 14 00988 g017
Figure 18. The fitting accuracy of three fitting algorithms at a 40° camera tilt angle. (a) LSM; (b) Hough; (c) RANSAC.
Electronics 14 00988 g018
Figure 19. The results of fitting the tea row navigation central line by three algorithms at a 50° camera tilt angle. (a) LSM; (b) Hough; (c) RANSAC.
Electronics 14 00988 g019
Figure 20. The results of fitting the tea row navigation central line by three algorithms at a 45° camera tilt angle. (a) LSM; (b) Hough; (c) RANSAC.
Electronics 14 00988 g020
Figure 21. The results of fitting the tea row navigation central line by three algorithms at a 40° camera tilt angle. (a) LSM; (b) Hough; (c) RANSAC.
Electronics 14 00988 g021
Figure 22. The results of navigation line fitting on irregular tea canopies by RANSAC algorithm. (a) The 50° camera tilt angle; (b) the 45° camera tilt angle; (c) the 40° camera tilt angle.
Electronics 14 00988 g022
Table 1. Indicators for evaluation of multiple framework models.
ModelmAP %mIoU %F1-Score %Parameter (MB)FPS
PspNetConvnext94.3691.6596.0231.0625.4
MobileNetV294.8992.2396.752.3830.2
ResNet5094.8191.0597.2446.7122.3
U-NetConvnext87.8284.2195.0143.123.9
MobileNetV295.3492.0196.3110.6428.4
ResNet5094.8692.8496.0343.9323.6
Deeplabv3Convnext96.5793.7598.21118.576.4
MobileNetV294.3789.4595.7612.4327.1
ResNet5095.0291.3196.51110.879.5
Table 2. Performance indicators of the four models’ detection.
ModelR2Accuracy %mAP %mIoU %F1-Score %Parameter (MB)FPS
C-Deeplabv3+0.8696.3496.5793.7598.21118.576.4
MDSC-Deeplabv3+0.8295.3194.0490.3595.9718.4429.7
RDSC-Deeplabv3+0.8495.8795.0792.6496.98116.468.02
CDSC-Deeplabv3+0.8897.3296.9994.7198.66123.565.0
Table 3. Ablation experiment table.
ModelConvnextDenceASPPCFFSPmAP %mIoU %F1-Score %Parameter (MB)FPS
C-Deeplabv3+ 96.5793.7598.21118.576.4
CD-Deeplabv3+ 96.4593.6198.06125.864.5
CF-Deeplabv3+ 96.6593.8198.25118.846.4
CS-Deeplabv3+ 96.5893.8098.27119.626.1
CDC-Deeplabv3+ 96.6094.7598.22122.515.5
CDS-Deeplabv3+ 96.6394.8198.3128.484.1
CSC-Deeplabv3+ 96.6493.8398.32119.886.0
CDSC-Deeplabv3+96.9994.7198.66123.565.0
Table 4. The fitting performance of three fitting algorithms.
Performance IndicatorsLSMHoughRANSAC
50°45°40°50°45°40°50°45°40°
Average angular deviation (n/°)5.221.241.942.161.850.802.020.360.46
Average fitting time (t/ms)6.87.37.98320.07420.07380.056.444.748.3
Table 5. Performance indicators of segmentation and navigation central line fitting between CDSC-Deeplabv3+ and other models.
ModelTargetmAP %mIoU %AlgorithmsAverage Angle
Error/°
Average Fitting Time/ms
VC-UNet [14]Rape Crop Rows90.1587.3LSM3.769
Deeplabv3+ [35]Rice Crop Rows \79.22Canny3.33\
MA-Res UNet [36]Soybean Crop rows92.182.9RANSAC2.09\
SEU-ENet [37]Rice Crop Rows96.3989.0LSM1.9124.6
CDSC-Deeplabv3+Tea Crop Rows97.0494.96RANSAC0.9549.8
Disclaimer/Publisher’s Note: The statements, opinions and data contained in all publications are solely those of the individual author(s) and contributor(s) and not of MDPI and/or the editor(s). MDPI and/or the editor(s) disclaim responsibility for any injury to people or property resulting from any ideas, methods, instructions or products referred to in the content.

