Abstract
The parity problem, a generalization of the XOR problem to higher-dimensional inputs, is a challenging benchmark for evaluating learning algorithms, due to its increased complexity as the number of dimensions of the feature space grows. In this work, a single-qubit classifier is developed, which can efficiently learn the parity function from input data. Despite the qubit model’s simplicity, the solution landscape created in the context of the parity problem offers an attractive test bed for exploring optimization methods for quantum classifiers. We propose a new optimization method called Ensemble Stochastic Gradient Descent (ESGD), with which density matrices describing batches of quantum states are incorporated into the loss function. We demonstrate that ESGD outperforms both Gradient Descent and Stochastic Gradient Descent given the aforementioned problem. Additionally, we show that applying ESGD with only one measurement per data input does not lead to any performance degradation. Our findings not only highlight the potential of a single-qubit model, but also offer valuable insights into the use of density matrices for optimization. Further to this, we complement the outcome with interesting results arising by the employment of a Doubly Stochastic Gradient Descent for training quantum variational circuits.
1. Introduction: The Parity Problem
Representing the XOR function is a fundamental problem for neural networks (NNs), as it involves solving a nonlinearly separable classification problem. Unlike other problems represented by logical functions with two-bit inputs, the XOR problem requires the use of two layers of neurons [1]. The parity function extends the XOR function from 2 to N inputs, forming a proportionally challenging binary classification problem for inputs, an illustration of which in the 3-dimensional space () is depicted in Figure 1. According to the universal approximation theorem, any function, including the parity function, can be represented by a deep NN. However, it is always preferable to employ an NN architecture with minimal cost in terms of the number of synapses, neurons, and layers. Another key consideration is the morphology of the solution landscape, as well as the representational capacity and extrapolation capabilities of the chosen NN model. An optimal NN architecture using perceptrons with one hidden layer of size N is described in [2,3], while a modular NN architecture is presented in [3], and a single product unit approach is discussed in [4].
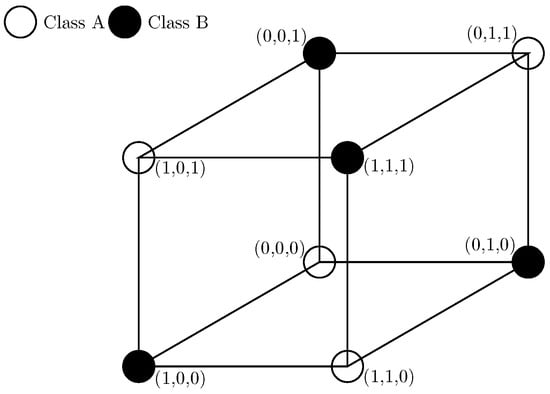
Figure 1.
Binary classification of the data points produced for the parity problem with 3-bit input ().
Variational quantum circuits (VQCs) [5,6,7] combine the properties of quantum circuits and classical methods to solve classification tasks in a hybrid way. In particular, quantum circuits perform data processing, which encompasses data encoding, label extraction, etc., whereas optimization is handled by classical—typically local optimization—algorithms. The data flow follows a sequential combination of the processes, meaning that the data collected via measurements on the output quantum state of the VQC are subsequently exploited to perform the optimization task. The purpose of this hybrid formation is to optimally harvest the best of both worlds in an attempt to create new efficient learning methods. However, quantum measurement results are intrinsically stochastic, presenting a challenge in developing suitable optimization algorithms [8].
In this work, our aim is to employ an optimized VQC model in place of an NN and demonstrate that it can be efficiently trained to solve the N-bit parity problem. It is widely known that all Boolean logical functions can be represented by a quantum circuit [9]. Considering this, one can easily construct a quantum Boolean parity function using N qubits as input and an ancilla qubit to register the output, as shown in Figure 2. While the problem of computing the parity of an oracle function has been explored in the literature, it has been shown [10] that at least oracle queries are required, offering no quantum advantage. Finally, another class of parity problems has been used to evaluate the effectiveness of different VQC models in [11], further highlighting the importance of finding an efficient way of solving the parity problem.
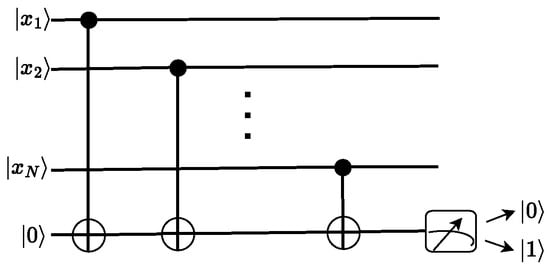
Figure 2.
A quantum circuit representing a solution to the N-bit parity problem. N qubits encode the Boolean input , and N CNOT gates act on an ancilla qubit, which registers the output.
The remainder of the manuscript is divided so as to showcase two main concepts; the first concerns the presentation of the quantum variational model for solving the parity problem; the second follows the methodology for training this model. More specifically, in Section 2, we propose a variational single-qubit classifier and investigate the solution landscape for the parity problem. In Section 3, we present the technical details of the training procedure’s preparation, and we showcase the application of optimization methods by employing Gradient Descent (GD) and obtaining some initial results. In Section 4, we propose and test a new stochastic gradient method, to the best of our knowledge, for which batches are represented by density matrices. This method can be transformed into a doubly stochastic approach if single stochastic measurement outcomes are considered and averaged over the batches. We present results from numerical tests on both methods, demonstrating the effectiveness of the approach.
2. A Single-Qubit Classifier for the Parity Problem
Given a series of N bits, , where , , the parity function determines whether the value “1” appears an even or odd number of times in the series. The parity problem can, thus, be considered a classification problem, where the data are divided into two equally populated classes: class A (even parity) and class B (odd parity), as shown in Figure 1. This problem can also be extended to real numbers, i.e., noisy data , generated by adding Gaussian noise to the integer values of .
Following the logic of [12], where a general model of a variational qudit classifier was introduced, we specify the following model for the parity problem:
where is the jth component of an input data point. We will refer to this model as the single-qubit classifier (SQC). In Equation (1), represent the Pauli operators, |0⟩ is the eigenstate of with eigenvalue 1, and , , , , , , are the variational parameters, which are optimized during training. The training procedure updates the variational parameters’ given data points , with each data point labeled as for even or for odd parity. The classes are, hence, represented by labels that can be directly matched to the mean measurement outcome of operator , , where positive is classified as even parity and negative is classified as odd parity.
Solution Landscape
The SQC in Equation (1) is inspired by the quantum digital circuit shown in Figure 2; the relation between the two can be directly derived. For noiseless data, a periodic (global) solution emerges, allowing the SQC to classify all inputs with perfect accuracy when and for all j and k, with . In this solution, the SQC reproduces the conditional evolution of the ancillary qubit in Figure 2: an X gate is applied whenever . An even number of gate applications results in the final state |0⟩, while an odd number of applications leads to the state |1⟩. A measurement of the observable at the end of the variational circuit can perfectly distinguish the two cases, resulting in the accurate classification of the input.
Even if the parameters converge to a solution with some deviation around the global solution , the model classifies noiseless data successfully. Correspondingly, if the parameters are fixed at , the classifier can tolerate noise of the same order in the data. We observe that, for , the classifier can tolerate a maximum deviation , or equivalently . For N inputs, the total noise in the exponent of Equation (1) increases by , meaning that the tolerable noise for each individual input scales with . Finally, the second rotation of the SQC’s state—represented by the second term of Equation (1)—is added, so that the model can tolerate recurrent additive errors in the form of in the input data. In the remainder of this work, we will ignore this term and set in Equation (1).
We initially employ the square loss function for evaluating the result of the learning procedure of the VQC; however, we observe that no local minima appear in this case. The solution landscape for can be seen in Figure 3a over two periods. Since illustrations of the landscape’s morphology can only be extracted as cross-sections when , we plot an example for and 10, where the cross-section is applied along the principal hyper-diagonal, namely, where , shown in Figure 3b. We notice that, as N increases, the number of local minima along the diagonal increases moderately. Nonetheless, the existence of local minima persists if for some inputs. This suggests that the number of minima within a period increases at least linearly with N, while the global solution remains unique.
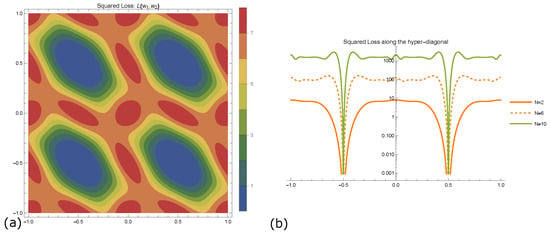
Figure 3.
The square loss function for . (a) Contour plot of the objective function Equation (1), versus the parameters and , over two periods. (b) Plot along the cross-section of the objective function for .
On the other hand, our numerical investigation shows that input sets which include a subset of points whose coordinates coincide with that of the global solution and, simultaneously, the rest of the data points have coordinates of local minima, also corresponding to local minima of the loss function. Reaching the aforementioned minima will also yield a perfect classification of the input. Based on the analysis of numerical results in the following section, we conclude that both local minima that achieve accuracy 1, meaning that all points are correctly classified, and those that do not, increase in number proportionally as N grows. A final observation on Figure 3b, supported by our numerical investigations, is that as N increases, the area in the parametric space covered by barren plateaus also increases. This makes the approach to a local minimum more time consuming or, in some cases, impossible.
3. Configuration of the Training Procedure
The versatile landscape of the parametric space, combined with the fact that there is at least one known solution, renders the parity problem an attractive test bed for investigating different optimization techniques for the training of SQV. We will, first, provide a description of the common steps involved in training a variational quantum classifier, followed by an introduction to the basic optimization technique for adjusting the weights, namely the Gradient Descent (GD) method. It is essential to gain a deeper understanding of the solution landscape through the application of GD before more advanced optimization techniques can be explored.
Let us restrict the discussion to the case of binary classification tasks, where the data are to be classified into two classes, A and B, consisting of and points respectively, where . We denote the output circuit state by and assume that a measurement on a single observable (specifically, in our case), which has two eigenvalues , is performed on the quantum state. For fixed values of the parameters , the standard procedure involves running the quantum circuit multiple times to estimate
where represents the stochastic outcome of the m-th (independent) experiment. For , we have .
The step of estimating via the quantum circuit and the corresponding measurements is followed by a classical procedure to update the parameters using a classical optimization method. The first step in this procedure is to construct a loss function based on and the information about the classes. Here, we use the negative log-likelihood loss, which is commonly employed to learn the weights in NNs. If the classes A and B—corresponding to even and odd parity in our case study, respectively—are labeled as , the probability that the training data belongs to the class y can be evaluated as follows:
By defining the class label for each input , the loss function can be constructed by summing the negative log-likelihood of the probabilities as follows:
or,
Using GD, the weights are updated according to
where is the learning rate. The numerical differentiation that produces the gradient of the loss function requires at least evaluations of g of Equation (2), giving the mean value, to be estimated via the quantum circuit, where N is the dimension of each input data vector. The analytical formulas [13,14] of the partial derivatives of the gradient vector can potentially relate these derivatives to the mean values of other observables in the quantum state, offering an improvement in the precision of the optimization procedure. In our case, where the model is relatively simple, the analytic formula is straightforward and involves the mean value of only one observable:
where denotes the jth component of the vector . The elements of the gradient can be accurately derived using the chain rule in combination with Equations (2) and (8).
We optimize the parameters of the SQC given by Equation (1), designed to learn the solution to the parity problem with -bit input, using the GD method. For a given N, the learning rate is optimized empirically and then kept constant for all epochs, while the number of epochs is fixed in all simulations. The gradient is calculated analytically using Equations (2) and (8). We report two important metrics concerning the classification results; the average accuracy , listed in Table 1, as well as the percentage of times that accuracy reached 1, i.e., where all inputs were correctly classified after training. The metrics are reported over 50 runs where the weight vector is randomly initialized for each run. Our implementation is available on GitHub (https://github.com/sanantoniochili/QSGD.git accessed on 23 February 2025).

Table 1.
The results of GD optimizations for learning the parity problem using the SQC model. For all runs, the number of epochs was set to 200. Notation is explained as follows. N: the dimension of the input for the parity problem. : the learning rate. : the average accuracy over 50 runs with random initializations of . : the standard deviation of the accuracy. : the percentage of runs where accuracy reached 1.
The results of the GD optimization, shown in Table 1, as well as the evolution of the observed loss during optimization, lead to the following conclusions. The difficulty of the problem increases rapidly with the input dimension N, as expected, highlighting the need for more fine-tuned optimization methods. For , the few occurrences of unsuccessful training are mainly due to the optimization method being trapped in the small neighborhood around local minima. However, for , the presence of barren plateaus becomes equally problematic and the loss function appears to oscillate randomly over these regions. Since, presents the first non-trivial case for the solution of the parity problem, in the following we employ it to numerically test the performance of more sophisticated gradient optimization methods.
4. The ESGD Method: Towards an Optimization with Single Measurement Sampling
Inspired by recent studies [8,15,16] on exploiting the intrinsic stochasticity of quantum measurements in gradient optimization methods and, at the same time, motivated by the need to reduce quantum resources, we explore whether the SQC can be trained using just one measurement (one repetition of the quantum circuit) for a very rough estimate of and . The imbalance caused by a single measurement calls for some averaging during the calculation of the partial derivatives, which induces a desirable smoothness to the loss function. Intuition suggests that this average should be taken over different input data . In the following, we present a logical procedure to justify such averaging, while keeping the negative log-likelihood as the loss function, contrary to previous works. We begin by reviewing and numerically testing the Stochastic Gradient Descent (SGD), known to provide better optimization results, i.e., less epochs and higher probability to converge to global minima, in variational quantum circuits. Then, we introduce the ESGD method, with which batches of input vectors are used—similarly to SGD—but now these are treated as quantum ensembles represented by density operators. The loss function in ESGD involves a double summation over stochastic measurement outcomes and batch input data. Even with single measurements, the sought-after smoothness of the loss function is provided by summing over batch input data and leading naturally to the Doubly Stochastic Gradient Descent (DSGD) method described in the next. We will show that, according to our simulations, both ESGD and DSGD outperform GD and SGD, in the case for case.
4.1. Application of the Stochastic Gradient Descent (SGD) Method
In SGD, the n data points are randomly split into k batches, each batch containing points. During an epoch, the weights are updated k times using the gradient of the loss function of the k-th batch:
which is constructed analogously to Equation (9).
Focusing, now, on the specific conditions of the parity problem, where , we introduce a “balanced” cost functional with an equal number of points () from each class and in each batch:
We schematically present the steps of evaluating via the SQC of Equation (1) in Figure 4a.
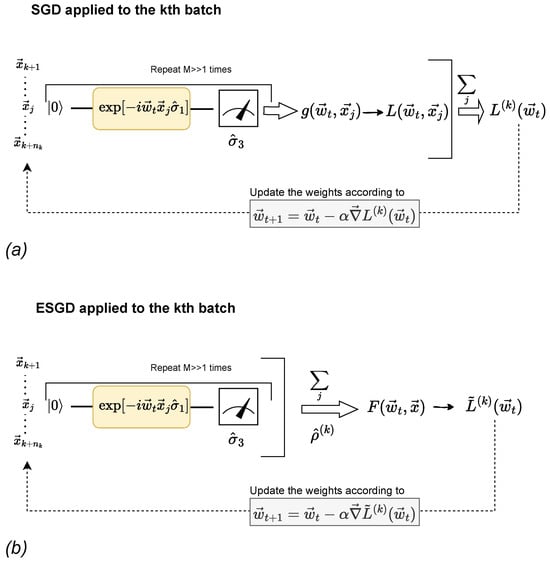
Figure 4.
(a) SGD: A schematic depiction for the evaluation of the gradient via the SQC, defined by Equation (1), using the kth batch of the input. For an analytic evaluation of , the whole procedure needs to be repeated, measuring the observable (instead of ) so that of Equation (8) is estimated as well. (b) ESGD: The batch is treated as an ensemble and, contrary to SGD, the measurement outcomes are first averaged out over the batch to estimate and then used as inputs in the loss . DSGD is represented by sub-figure (b) for .
We apply the SGD method for features and for a varied number of points per batch by simulating the procedure described in Figure 4a, the results shown in Table 2. As for GD, we use the analytical expressions of Equation (8) for the evaluation of the gradient and we perform statistics over 25 random initializations of . Comparing the results of Table 2 with the results of Table 1 corresponding to the case, we can conclude that SGD performs better than GD, especially as the number of batches increases for a fixed number of total input points.

Table 2.
The results of SGD optimizations for learning the parity problem with and the loss function given by Equation (10). The results concern 25 runs, each with random initial and analytical derivatives. The notation is explained as follows. : the average accuracy; : the standard deviation of the accuracy; : the percentage of runs where accuracy reached 1. For all runs, the number of function evaluations was set to 1024.
4.2. The Ensemble Stochastic Gradient Descent (ESGD) Method
Quantum mechanics introduces quantum ensembles, a novel perspective in studying data as far as machine learning is concerned, which has been partially explored in a different context in [17] and which we apply here. Let us take the batches of quantum states in SGD and construct density matrices based on them, as follows:
We can derive an expectation value of the observable for each of the batch ensemble, as in
We can, then, define the corresponding probability and estimate the ensemble’s loss accordingly, as in
We will, hereafter, elaborate on a gradient optimization method where the weights are updated according to expectation values of batch ensembles represented by density matrices, as in Equation (14). This is called Ensemble Stochastic Gradient Descent (ESGD), and its relation to SGD when applied on our SQC is illustrated in Figure 4b. Its geometric interpretation can be easily understood as follows: if a Bloch vector is assigned to each of the density matrices of Equations (11) and (12), then the aforementioned gradients method guides the ensemble of the Bloch vectors associated with each class towards two opposite directions on the Bloch sphere (). In the edge case of , ESGD reduces to SGD, since Equations (11) and (12) reduce to
and the label assignment becomes
In the opposite edge case where , ESGD serves the same purpose as the learning procedure in [17]; it adjusts the parameters in the quantum circuit so that the distance between two Bloch vectors representing the classes is maximized. Finally, as with GD, the components of the gradient can be calculated either analytically, deriving equations similar to Equation (14), or by using a numerical derivative. We implemented ESGD using numerical derivatives and the statistics over 25 runs are reported in Table 3.

Table 3.
The results of ESGD optimizations for learning the parity problem with and the loss function given by Equation (14). The results concern 25 runs, each with random initial and numerical derivatives. For all runs, the number of function evaluations was set to 1024. The notation is explained as follows. : the average accuracy; : the standard deviation of the accuracy; : the percentage of runs where accuracy reached 1.
4.3. The Doubly Stochastic Gradient Descent (DSGD) Method
Let us now proceed with an approximate version of Equation (17) by considering a finite number M of measurements:
If the batch size is large enough, the double summation involved in Equation (18) allows one to reduce M without introducing discontinuities to the mean value function F, thus avoiding non-differentiability. In this work, we simulate the most challenging case of single-measurement () per input for batch size and we list the outcomes in Table 4. The described version of ESGD, where only a small number of quantum measurements is performed per input, will be referred to as the Doubly Stochastic Gradient Descent (DSGD) method, since it incorporates both the processing of random input batches and the stochasticity of a single (or small number of) measurements. For more clarity on ‘the points of contact’ of the four gradient optimization methods employed in this work, Figure 5 provides a schematic view clarifying their relation with respect to the the number of batches and number of measurements performed on the quantum system.

Table 4.
The results of DSGD optimizations, namely using a single-measurement , are used for learning the parity problem with and the loss function given by the revised version of Equation (14). The results concern 25 runs, each with random initial and numerical derivatives. For all runs, the number of function evaluations was set to 1024. The notation is explained as follows. : the average accuracy; : the standard deviation of the accuracy; : the percentage of runs where accuracy reached 1.
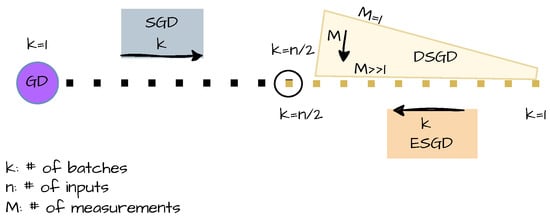
Figure 5.
A schematic view of the four gradient optimization methods employed in this work: GD, SGD, ESGD, and DSGD. SGD is presented by a dotted (black) line indicating the number k of batches with (see Equation (10)). For , SGD reduces to GD. ESGD is indicated as a dotted (orange) line, where k is now decreasing from left to right. For , ESGD coincides with SGD. Above ESGD there is a (yellow) trapezoidal area describing DSGD, which depends on k but also on the number M of measurements per input. With increasing M, DSGD approaches ESGD, while this convergence is faster (with M) when the number of batches is small. The direction of the arrows in the figure shows the direction of increase for the respective value.
4.4. Results of Optimization Methods
As mentioned previously, we evaluate each method according to its accuracy, over a set of configurations. The results are gathered in Table 2, Table 3 and Table 4, listing those of the SGD, ESGD, and DSGD optimization methods for the same classification problem, namely the parity problem for an input dimension of , and using SQC. Regarding the SGD and ESGD methods, the exact expression of the mean values of the observables has been employed, while the random outcomes of single measurements needed for DSGD have been simulated according to analytical probability distributions.
We will, now, elaborate on some key technical details about the implementation of the methods. The random weight-vector initialization differs for each point in Figure 6. The performance of the methods is naturally influenced by the choice of hyperparameters, such as the learning rate and the number of epochs; hence, for all three methods and each batch size, we roughly optimized the learning rate to achieve the best outcomes. For all methods, the learning rate was also reduced by a factor if the loss function was below a certain pre-fixed threshold value—constant for all different number of batches. The latter practice did improve the results of ESGD and DSGD methods but not those of SGD. For comparison purposes, the number of function evaluations is kept constant at 1024, meaning the number of epochs increases with in order to accommodate all points in the input dataset. Note that the cases are not included in Table 4 due to the fact that the doubly stochastic derivation introduces excessive noise, preventing the model parameters from converging to a solution vector. Finally, in the ESGD and DSGD methods where we numerically evaluate the gradient vector, we average over the last four steps the components of the gradient vector, in order to achieve smoother progress. The code is available at https://github.com/sanantoniochili/QSGD.git (accessed on 23 February 2025) for further testing and potential optimization.
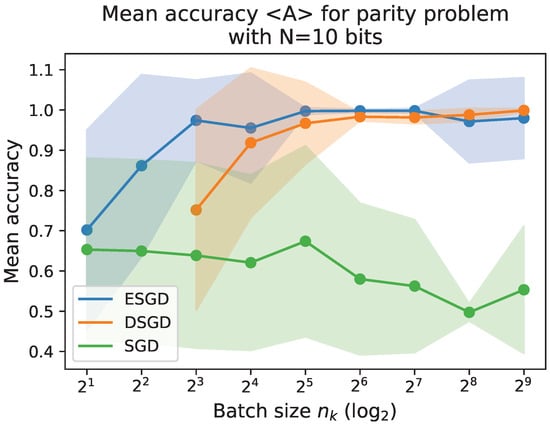
Figure 6.
The evolution of the mean accuracy with respect to the size of the batches for each method, ESGD, DSGD, and SGD. The batch size is measured as the number of data points used for each loss and gradient calculation. The x-axis showing the size of the batch is given in the logarithmic scale with base 2. DSGD evaluations start with .
From Figure 6, it is evident that both ESGD and DSGD outperform SGD for all batch sizes. Specifically, the mean accuracy of ESGD and its stochastic counterpart, DSGD, increases as the batch size grows, whereas SGD experiences a mild performance degradation, as shown in Figure 4. SGD eventually converges to the performance of GD (see Table 1 for ). The close relationship between SGD and ESGD for is also apparent, with both showing poor performance due to the continuous, uncorrelated treatment of the data, which fails to collectively guide the weight vector toward a solution. In contrast, ESGD consistently achieves high accuracy, close to 100%, for any . DSGD, being stochastic, does not easily achieve 100% accuracy, as it tends to oscillate even once average convergence is reached.
5. Conclusions
This work presents two key contributions that advance both the theoretical understanding and practical application of quantum machine-learning techniques. First, we demonstrate that the N-bit parity problem can be efficiently solved using a single qubit, highlighting the remarkable potential of qubits as powerful learning units in quantum circuits. This result underscores the fact that any Boolean logical function, including parity, can be implemented within a quantum framework, opening an exciting avenue for future work. The second significant contribution of this work is the introduction of a novel optimization method, ESGD, which utilizes batches represented by density matrices. Our numerical investigations show that ESGD outperforms traditional SGD in terms of accuracy and efficiency, particularly for the parity problem. Furthermore, ESGD maintains its effectiveness even when reduced to the extreme scenario of using a single measurement per input, a result that highlights its robustness in noisy environments.
Overall, we believe that our methods and numerical results further motivate the exploration of incorporating quantum mechanics logic into learning tasks and classical optimization algorithms, hence creating new research directions. Limiting resources to one qubit, as carried out here, allows for more accessible, easily tested, and easily distributed implementations. This is a crucial property, especially in the field of machine learning, as it facilitates the increase in the range of practical applications, it promotes parallel execution, and it accelerates the production of novel and significant results. Furthermore, our preliminary investigation of a more universal logical function representation with variational quantum circuits suggests that quantum systems beyond qubits need to be considered, opening another exciting avenue for future work.
Author Contributions
Conceptualization, A.M. and A.T.; methodology, A.M. and G.M.; formal analysis, A.T. and A.M.; writing—original draft preparation, A.M., A.T. and G.M.; writing—review and editing, A.M., A.T., G.M. and D.S.; supervision, D.S.; funding acquisition, D.S. All authors have read and agreed to the published version of the manuscript.
Funding
This work was supported by the project Hellas QCI co-funded by the European Union under the Digital Europe Programme grant agreement No.101091504. A.M. acknowledges partial support from the European Union’s Horizon Europe research and innovation program under grant agreement No.101092766 (ALLEGRO Project).
Institutional Review Board Statement
Not applicable.
Informed Consent Statement
Not applicable.
Data Availability Statement
The programs (GD, SGD, ESGD, DSGD methods) are written with Wolfram Mathematica and are available on GitHub (https://github.com/sanantoniochili/QSGD.git accessed on 23 February 2025).
Acknowledgments
A.M. is grateful to Uwe Jaekel and Babette Dellen for helpful discussions.
Conflicts of Interest
All authors were employed by the company Eulambia Advanced Technologies. The authors declare no conflicts of interest.
Abbreviations
The following abbreviations are used in this manuscript:
| ESGD | Ensemble Stochastic Gradient Descent |
| NN | Neural Network |
| VQC | Variational Quantum Circuit |
| SQC | Single-Qubit Classifier |
| GD | Gradient Descent |
| SGD | Stochastic Gradient Descent |
| DSGD | Doubly Stochastic Gradient Descent |
References
- Theodoridis, S.; Koutroumbas, K. Pattern Recognition, 4th ed.; Academic Press: Cambridge, MA, USA, 2009. [Google Scholar]
- Fung, H.K.; Li, L.K. Minimal Feedforward Parity Networks Using Threshold Gates. Neural Comput. 2001, 13, 319–326. [Google Scholar] [CrossRef]
- Franco, L.; Cannas, S. Generalization properties of modular networks: Implementing the parity function. IEEE Trans. Neural Netw. 2001, 12, 1306–1313. [Google Scholar] [CrossRef] [PubMed]
- Leerink, L.R.; Giles, C.L.; Horne, B.G.; Jabri, M.A. Learning with product units. In Proceedings of the 8th International Conference on Neural Information Processing Systems NIPS’94, Denver, CO, USA, 1 January 1994; MIT Press: Cambridge, MA, USA, 1994; pp. 537–544. [Google Scholar]
- Havlíček, V.; Córcoles, A.D.; Temme, K.; Harrow, A.W.; Kandala, A.; Chow, J.M.; Gambetta, J.M. Supervised learning with quantum-enhanced feature spaces. Nature 2019, 567, 209–212. [Google Scholar] [CrossRef]
- Schuld, M.; Killoran, N. Quantum Machine Learning in Feature Hilbert Spaces. Phys. Rev. Lett. 2019, 122, 040504. [Google Scholar] [CrossRef]
- Schuld, M.; Bocharov, A.; Svore, K.M.; Wiebe, N. Circuit-centric quantum classifiers. Phys. Rev. A 2020, 101, 032308. [Google Scholar] [CrossRef]
- Sweke, R.; Wilde, F.; Meyer, J.; Schuld, M.; Faehrmann, P.K.; Meynard-Piganeau, B.; Eisert, J. Stochastic gradient descent for hybrid quantum-classical optimization. Quantum 2020, 4, 314. [Google Scholar] [CrossRef]
- Nielsen, M.A.; Chuang, I.L. Quantum Computation and Quantum Information: 10th Anniversary Edition; Cambridge University Press: Cambridge, UK, 2010. [Google Scholar]
- Farhi, E.; Goldstone, J.; Gutmann, S.; Sipser, M. Limit on the Speed of Quantum Computation in Determining Parity. Phys. Rev. Lett. 1998, 81, 5442–5444. [Google Scholar] [CrossRef]
- Jerbi, S.; Fiderer, L.J.; Poulsen Nautrup, H.; Kübler, J.M.; Briegel, H.J.; Dunjko, V. Quantum machine learning beyond kernel methods. Nat. Commun. 2023, 14, 517. [Google Scholar] [CrossRef]
- Mandilara, A.; Dellen, B.; Jaekel, U.; Valtinos, T.; Syvridis, D. Classification of data with a qudit, a geometric approach. Quantum Mach. Intell. 2024, 6, 17. [Google Scholar] [CrossRef]
- Crooks, G.E. Gradients of parameterized quantum gates using the parameter-shift rule and gate decomposition. arXiv 2019, arXiv:1905.13311. [Google Scholar]
- Schuld, M.; Bergholm, V.; Gogolin, C.; Izaac, J.A.; Killoran, N. Evaluating analytic gradients on quantum hardware. Phys. Rev. A 2019, 99, 032331. [Google Scholar] [CrossRef]
- Harrow, A.W.; Napp, J.C. Low-Depth Gradient Measurements Can Improve Convergence in Variational Hybrid Quantum-Classical Algorithms. Phys. Rev. Lett. 2021, 126, 140502. [Google Scholar] [CrossRef]
- Kübler, J.M.; Arrasmith, A.; Cincio, L.; Coles, P.J. An Adaptive Optimizer for Measurement-Frugal Variational Algorithms. Quantum 2020, 4, 263. [Google Scholar] [CrossRef]
- Lloyd, S.; Schuld, M.; Ijaz, A.; Izaac, J.; Killoran, N. Quantum embeddings for machine learning. arXiv 2020, arXiv:2001.03622. [Google Scholar]
Disclaimer/Publisher’s Note: The statements, opinions and data contained in all publications are solely those of the individual author(s) and contributor(s) and not of MDPI and/or the editor(s). MDPI and/or the editor(s) disclaim responsibility for any injury to people or property resulting from any ideas, methods, instructions or products referred to in the content. |
© 2025 by the authors. Licensee MDPI, Basel, Switzerland. This article is an open access article distributed under the terms and conditions of the Creative Commons Attribution (CC BY) license (https://creativecommons.org/licenses/by/4.0/).