Article

Deployment of TinyML-Based Stress Classification Using Computational Constrained Health Wearable

by
Asma Abu-Samah
1,*,
Dalilah Ghaffa
1,
Nor Fadzilah Abdullah
1,
Noorfazila Kamal
1,
Rosdiadee Nordin
2,
Jennifer C. Dela Cruz
3,
Glenn V. Magwili
3 and
Reginald Juan Mercado
4
1
Faculty of Engineering and Built Environment, Universiti Kebangsaan Malaysia, Bangi 43600, Malaysia
2
School of Engineering and Technology, Sunway University, Bandar Sunway 47500, Malaysia
3
School of Electrical, Electronics and Computer Engineering, Mapua University, Metro Manila 1002, Philippines
4
GTek Enterprise, Project 2, Quezon City 1102, Philippines
*
Author to whom correspondence should be addressed.
Electronics 2025, 14(4), 687; https://doi.org/10.3390/electronics14040687
Submission received: 23 December 2024 / Revised: 30 January 2025 / Accepted: 8 February 2025 / Published: 10 February 2025

Abstract

:
Stress has become a common mental health issue in modern society, causing individuals to experience acute behavioral changes. Exposure to prolonged stress without proper prevention and treatment may cause severe damage to one’s physiological and psychological health. Researchers around the world have been working to find and create solutions for early stress detection using machine learning (ML). This paper investigates the possibility of utilizing Tiny Machine Learning (TinyML) in developing a wearable device, comparable to a smartwatch, that is equipped with both physiological and psychological data detection system to enable edge computing and give immediate feedback for stress prediction. The main challenge of this study was to fit a trained ML model into the microcontroller’s limited memory without compromising the model’s accuracy. A TinyML-based framework using a Raspberry Pi Pico RP2040 on a customized board equipped with several health sensors was proposed to predict stress levels by utilizing accelerations, body temperature, heart rate, and electrodermal activity from a public health dataset. Moreover, a few selected machine learning models underwent hyperparameter tuning before a porting library was used to translate them from Python to C/C++ for deployment. This approach led to an optimized XGBoost model with 86.0% accuracy and only 1.12 MB in size, hence perfectly fitting into the 2 MB constraint of RP2040. The prediction of stress on the edge device was then tested and validated using a separate sub-dataset. This trained model on TinyML can also be used to obtain an immediate reading from the calibrated health sensors for real-time stress predictions.

1. Introduction

Stress disorder has now become a common mental health issue in the community. Stress, however, is a highly subjective experience due to its nature occurring for various reasons, even in similar pressuring or unavoidable circumstances [1]. People tend to adjust to stress over time, but unknowingly, even being exposed to prolonged minor stress can cause severe health damage [2]. Untreated stress may cause not only psychological but also umpteen physiological health issues such as a suppressed immune system, heart attack, and stroke [3,4]. Since this matter has become a significant issue in the general health of society, rapid technological innovations have encouraged the solution for early stress detection to enhance the healthcare system with better aids [5,6]. Hence, it is important to first detect the existence of stress to avoid aggravating this problem. The most user-friendly solution is the usage of wearable devices embedded with multimodal sensors for real-time stress monitoring. There are various wearable commercial devices available in the market nowadays but most of them rely on limited health monitoring sensors.
The most commonly used devices in research for data collection, continuous study, and monitoring of participants’ stress levels are the Empatica E4 and, most recently, the Embrace Plus [2]. The device is used for stress detection as it provides an electrodermal activity (EDA) sensor, which measures and suggests a body reaction to stress. Empatica devices are very helpful in this aspect, but the cost is not for mass usage, and no detection model has been integrated for automated detection and alarm triggers. Despite commercial devices, some researchers have taken another direction and developed their own wearable devices [7,8], made from low-cost sensors.
Appropriate use of wearable multimodal sensors for health data collection can be beneficial for evaluating and analyzing stress detection based on the physiological and/or psychological features of interest [9]. Physiological traits that are frequently used in stress detection studies comprise EDA, also known as Galvanic Skin Response (GSR), photoplethysmogram (PPG), electrocardiogram (ECG), and respiration. Generally, stress detection using these traits is regarded as the most dependable initiative in practical applications. Among the numerous physiological traits, features extracted from ECG and EDA signals, such as heart rate and skin conductivity metrics, are found to be the most closely correlated with the level of stress and have been utilized in various fields for stress detection [1,10].
In most recent studies, machine learning (ML) models have been widely used to automatically identify stress by exploiting a number of physiological and psychological signals obtained from a collection of data [11]. The research aspect in this paper is the identification of ML models with powerful detection performance that can operate on limited power and computational capacity. The trend in this aspect is now to integrate a stress detection model on the cloud or the device itself. The latter empowers the integration of complex and ML-based models on the edge to give immediate detection to users. As such, this study is motivated to identify and test ML models that can be integrated into an edge device.
This paper explores the feasibility of deploying machine learning models on a TinyML device with constrained resources to classify stress levels using data from wrist-worn wearable sensors. The study addresses key challenges in implementing such systems, including handling large datasets, optimizing models for deployment, and ensuring real-world applicability. The primary contributions of this work are as follows:
  • Focus on Wrist-Worn Wearable Data: Unlike other datasets, such as the Wearable Stress and Affect Detection (WESAD) [12], which combine wrist-worn and chest-worn wearables, this study exclusively uses wrist-worn wearable data to reflect real-world use cases of compact, user-friendly devices. The dataset also features three stress levels, no stress, low stress, and high stress, providing a broader scope than binary classification datasets.
  • Prediction from Multiple Physiological and Motion Features: This study incorporates six physiological and motion-based features collected from wrist-worn wearable sensors: heart rate (HR), electrodermal activity (EDA), body temperature (TEMP), and 3-axis accelerometer data (X, Y, Z). By leveraging these diverse features, the study achieves a comprehensive assessment of stress levels, capturing both physiological responses and physical activity patterns. This holistic approach enhances the robustness of stress predictions compared to systems relying on fewer features.
  • Optimization for TinyML Deployment: Machine learning models, including XGBoost and Random Forest, were selected for deployment based on their compatibility with a micromlgen [13] library. Hyperparameter tuning ensured the models fit within the 2 MB memory of the Raspberry Pi RP2040 while maintaining competitive accuracy. The study demonstrates how resource constraints were balanced with model performance.
  • Real-World Implications and Compact System Design: This study advances the integration of machine learning into TinyML devices by demonstrating the potential for real-time stress classification. The RP2040 controller serves as the central component of the system, showcasing the viability of deploying computationally efficient models in low-cost, embedded systems.
The work in this paper is part of the PJ2022-03, ASEAN IVO Project entitled “P2EI-WEALTH (Physiological and Psychological Edge Intelligence WEArable LoRa HealTH) System for Remote Indigenous Community and Disaster Recovery Operation”. The paper is structured as follows: Section 2 elaborates on related works, focusing on existing datasets to help develop the model, relevant ML models to be considered and an overview of TinyML. Section 3 focuses on the research methodology, while Section 4 elaborates on the results and provides analysis. Finally, Section 5 provides discussion and concludes the paper.

2. Related Works

2.1. Available Dataset for Stress Identification Using Health Wearable

Over the years, many datasets containing health sensor data recorded using wearable wrist devices have become available for public use. This study is specifically interested in datasets with EDA signals generated from wearable devices for stress detection. Table 1 shows the current work on stress detection using different datasets. One of the most commonly used datasets is the WESAD dataset [12], which incorporates physiological signals from two wearable devices, Empatica E4 (wrist-worn) and RespiBan (chest-worn). Combining both devices, this dataset contains signals from EDA, ECG, blood volume pulse (BVP), electromyogram (EMG), respiration, body temperature, and acceleration. The recorded data were from 15 participants who were required to do several activities while collecting physiological signals.
Research by [14] has presented the Cognitive Load, Affect and Stress (CLAS) dataset, which can be utilized for general studies which include stress detection. The dataset contains physiological signals such as ECG, PPG, EDA, and accelerometer from 62 participants, for which they are required to perform several tasks. The device used was Shimmer3 GSR+ (wrist-worn) with GSR and ECG sensors, where the EDA signals were collected from the fingers via two electrodes from the GSR sensor. A private dataset from [15] called the VerBIO contains physiological signals such as EDA, ECG, and BVP. They were recorded during 344 public speaking sessions given by 55 subjects to study if stress can cause changes in physiological signals while giving a public speech with the aid of a virtual reality device. The EDA signals were specifically recorded using the Empatica E4 device.
In this study, a multimodal sensor dataset for continuous stress detection of nurses in a hospital collected by researchers at the University of Louisiana [6] was used. The dataset contains physiological data such as acceleration, temperature of the skin, heart rate (HR), EDA, and BVP from 15 nurses working hospital shifts over one week during the COVID-19 outbreak. The data were collected using the Empatica E4 wristwatch.

2.2. Machine Learning-Based Techniques for Stress Prediction

Relevant research in published papers has greatly influenced this study and is essential to developing theory and experimental design of stress detection using wrist-worn devices [16]. Using the WESAD dataset, researchers in [17] evaluates their selected features (EDA, BVP, and TEMP) with different ML models such as Stacking Ensemble Learning (SEL), Logistic Regression, Decision Tree, and Random Forest. Meanwhile, a comparative study by [18] compares and evaluates deep learning architecture using Convolutional Neural Networks (CNN) to the traditional ML methods (KNN and XGBoost). This study uses the same dataset but with slight difference in their choices of features, where they have selected ECG instead of BVP, opposed to the prior study.
Additionally, a study by [19] examined the performance of six ML methods, including Support Vector Machine (SVM), SEL, Random Forest, Naïve Bayes, Logistic Regression, and KNN. Three physiological features (EDA, ECG, PPG) from the WESAD and CLAS datasets were chosen for training and testing in the pre-acquisition phase. Another collaborative study by [20] included the VerBIO dataset to assist their practical study by including EDA sensors on smartwatches. All the physiological features available on the dataset (EDA, ECG, BVP) were used to train and test KNN, Logistic Regression, and Random Forest models.
Findings by [21] revealed that the researchers had designed their sensor board using nRF52832 microcontroller embedded with MAX86150 for ECG and EDA data collection. They first test and train some features from the WESAD dataset using the KNN model before implementing the model into their own dataset. The custom dataset consists of ECG and EDA signals from 18 participants who were required to complete three phases of the stress test. Table 1 shows the summary of recent works in this aspect.
Table 1. Recent works on stress detection using different datasets.
DatasetAuthorFeatures SelectionDevicesBest ML ModelAccuracy
WESAD[17]EDA, BVP, TEMPEmpatica E4Random
Forest
73.40%
[18]EDA, ECG, TEMPEmpatica E4,
RespiBAN
XGBoost96.83%
CLAS[19]EDA, ECG, PPGShimmer3
GSR+
SVM66.70%
VerBIO[20]EDA, ECG, BVPEmpatica E4,
Actiwave
Logistic
Regression
85.30%
Custom[21]EDA, ECGCustomKNN94.40%

2.3. TinyML Optimization in Predicting Stress
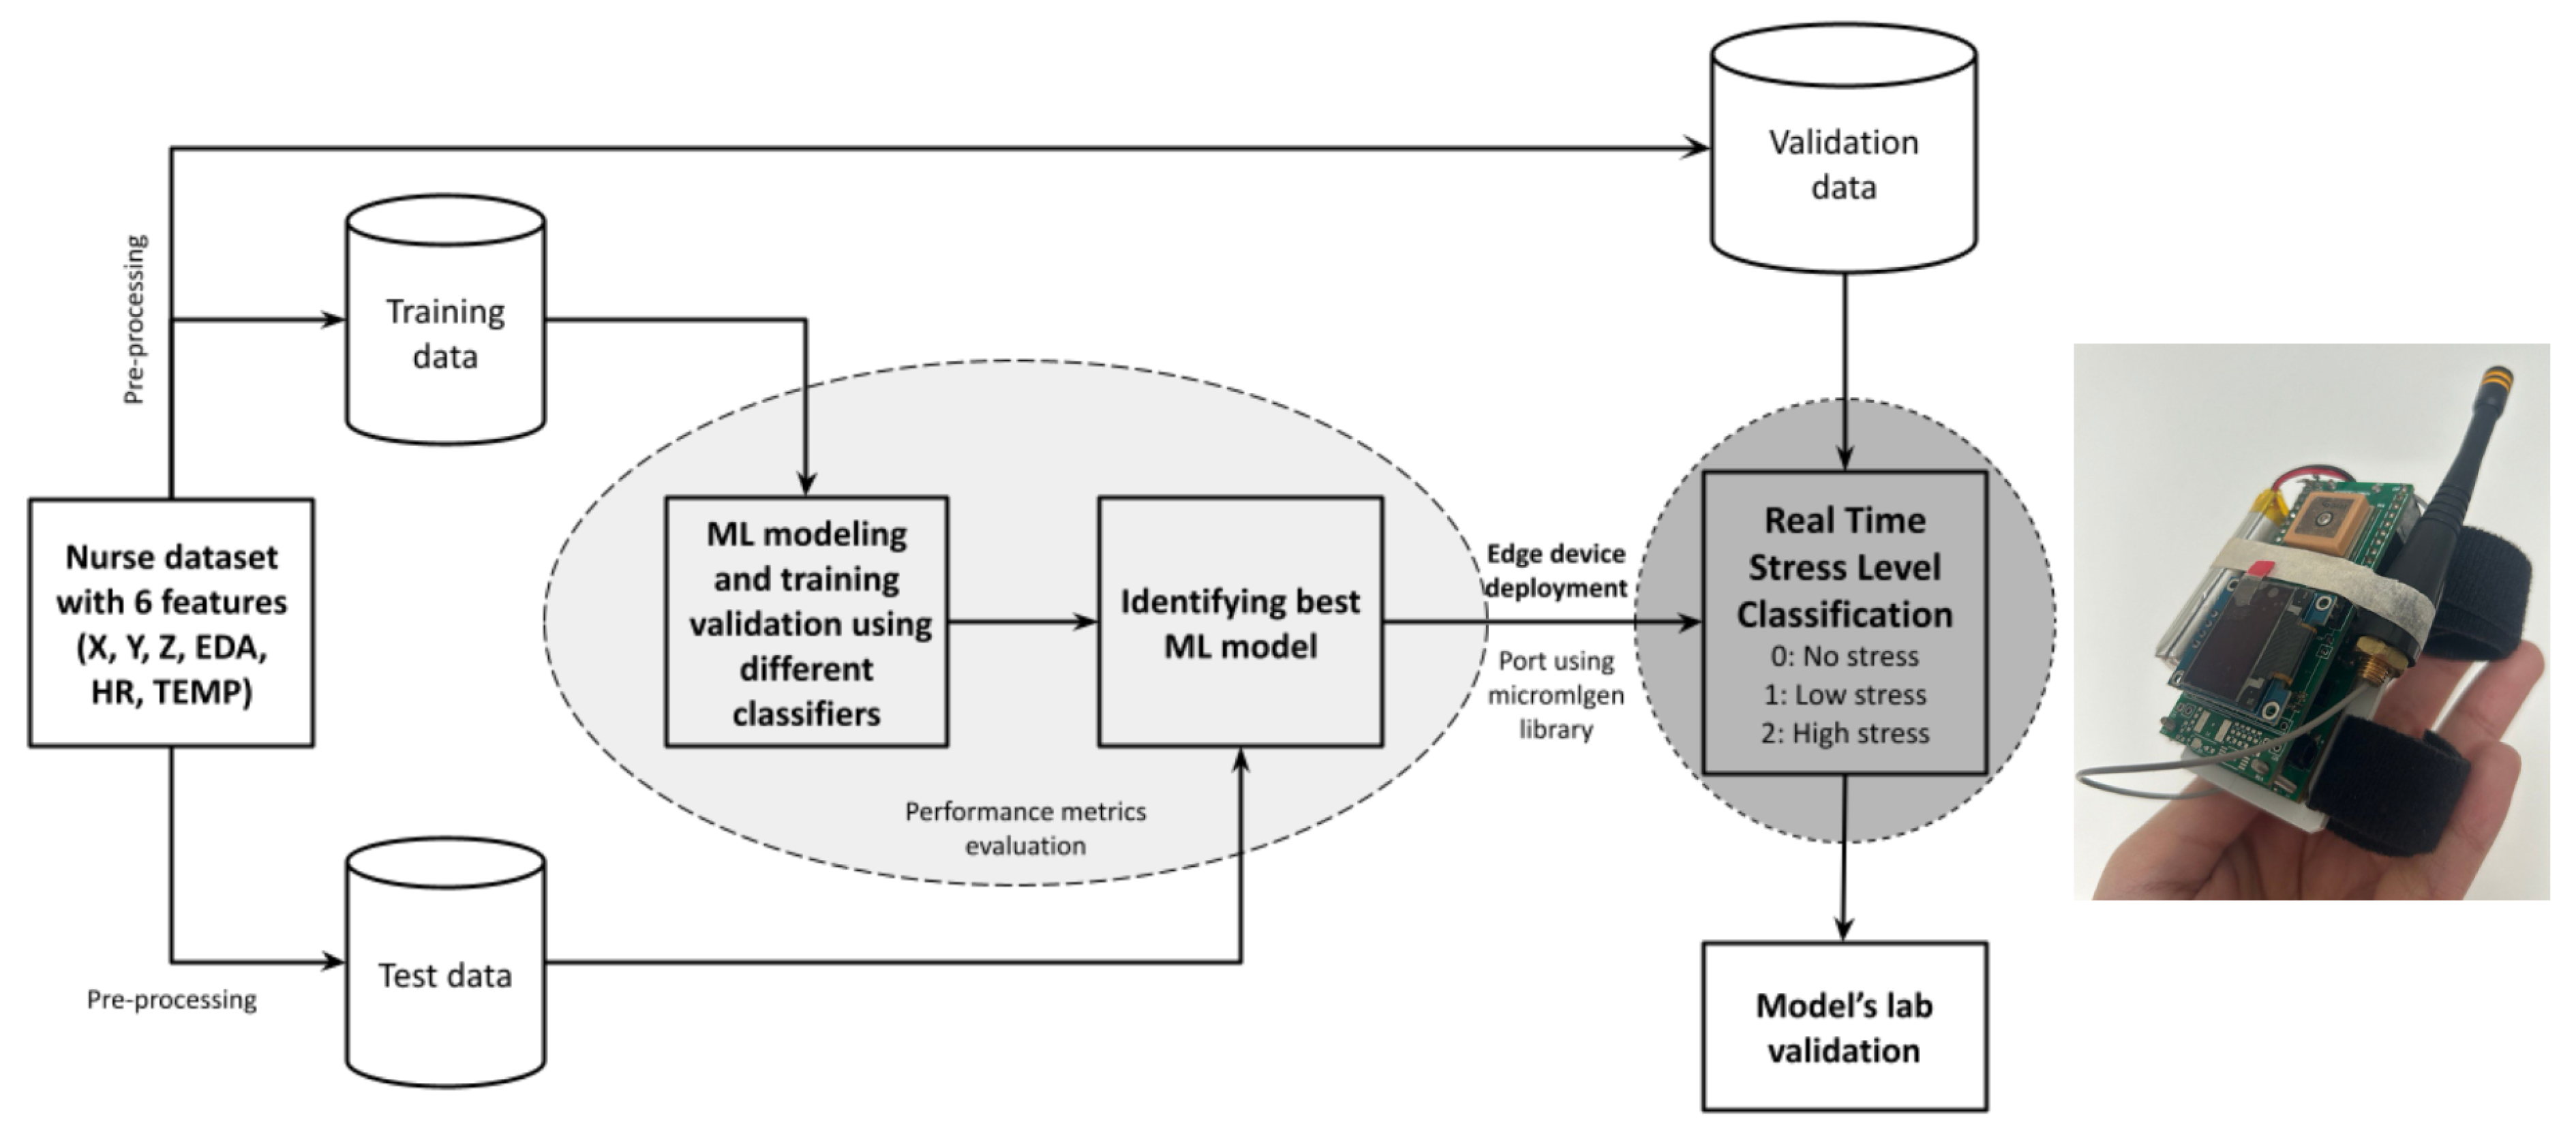
Tiny Machine Learning (TinyML) is an emerging field that focuses on deploying machine learning models on resource-constrained devices, such as microcontrollers and low-power embedded systems. This approach enables on-device data processing, reducing latency and enhancing privacy by minimizing data transmission to external servers. The integration of TinyML into small devices not only makes them intelligent but also offers advantages like reduced computation, power usage, and response time [22].
One of the primary advantages of TinyML is its ability to perform real-time inference on low-power devices. This capability is particularly beneficial in applications where immediate decision-making is crucial, such as wearable stress detection systems. By processing data locally, TinyML reduces the reliance on continuous data transmission, thereby conserving energy and extending battery life, a critical factor for wearable devices. Additionally, on-device processing enhances data privacy, as sensitive information remains within the device, mitigating potential security risks associated with data transfer [22].
Recent advancements in TinyML have demonstrated its potential in health monitoring applications. For instance, a study by [23] has presented a real-time stress detection system employing an LSTM-based deep learning model on STM32H7xx microcontrollers. Their approach effectively processed raw photoplethysmography (PPG) signals to distinguish between stressed and non-stressed states, achieving high accuracy with minimal computational overhead. Similarly, researchers in [24] has developed a microcontroller-based EdgeML system for real-time health monitoring, focusing on stress and sleep analysis via heart rate variability (HRV). Their approach effectively processed HRV data to provide continuous and personalized insights into stress levels and sleep quality. These studies underscore the feasibility of implementing TinyML in wearable stress detection systems, offering scalable and efficient solutions that align with current technological trends.

3. Methodology

The methodology subsection is organized into several subsections to highlight the different research activities involved in the different stages of the study. The first is the preparation of the historical dataset for the purpose of model training and modeling, followed by the propose pre-processing and dataset resampling. Different models were then tested to select the most relevant model before being deployed in the proposed hardware configuration. Figure 1 iterates the different steps of the studies, also highlighting the dataset that was input to the development.

3.1. Dataset for Modeling

In this paper, a merged csv file dataset provided on Kaggle based on the study for continuous stress detection of nurses in a hospital during the COVID-19 outbreak was used for the training and testing of the best stress model classification [6,25]. The merged dataset was made up of approximately 11.5 million inputs across nine columns, which include accelerations in X, Y, and Z-axis, EDA, HR, the temperature of the skin (TEMP), id of the 15 users (id), extensive date and time inputs (datetime), and three levels of stress (label). The full database containing the signals, stress events, and survey responses was also made available on Dryad [26] for public release as the data has been properly anonymised. The structure of the dataset is presented in Table 2, while the distribution of each feature in the dataset is illustrated as in Figure 2.
From Figure 2, a few observations can be made while referring to the skewness and kurtosis values in Table 2. Features like EDA, HR, and X exhibit notable positive skewness, indicating higher values are less frequent. Apart from that, most features have flat peaks or platykurtic, except HR, which shows a sharper peak (leptokurtic). These features should be normalized by min-max scaling during dataset preprocessing to ensure all features are on a similar scale for machine learning models. Finally, the most obvious observation is that the class imbalance in the label distribution could affect model training and might require techniques like resampling to address the imbalance.
Table 2. Structure of the dataset that is employed in the study along with the skewness and kurtosis of each variables.
DataXYZEDAHRTEMPidDatetimeLabel
0−13.0−61.05.06.76999599.4331.17158 July 2020 14:03:00.0002.0
      .
      .
      .
11,509,050−22.0−24.029.03.37454388.3333.75F523 July 2020 17:29:00.0002.0
Skewness0.966240−0.206264−0.3490530.8149980.927843−0.282816-0.078673-
Kurtosis0.848937−0.0674350.254031−0.0143492.327563−1.088713-−1.183099-

3.2. Data Preprocessing and Feature Scaling

Before training any machine learning models, a dataset must be preprocessed to convert raw data into polished and functional format. In this stage, data frame training was conducted to find data with missing or unimportant values. This particular dataset was proven to have 11,509,051 entries with no null values. The dataset information dated from 8th until 23rd of July 2020 with time stamps was provided in the ’datetime’ column as shown in Table 2. Since it was originally non-numerical labels, the column was then converted to numerical labels using LabelEncoder() from the sklearn.preprocessing module. Another crucial process is to reduce the number of bits used to represent data using a technique called quantization. In the study, data was converted from 64-bit to 32-bit using the astype() function to emit the data from float64 to float32 data types. This conversion was performed to optimize the memory usage and computational efficiency for processing the data. However, for real-time, embedded applications, further compression to 16-bit or 8-bit precision must be done to reduce computational load and power consumption.
It is also important to identify the most pertinent features that contribute to a model’s performance. Based on the process, the six main activity and physiological data features namely the three axis of acceleration (X, Y, Z), EDA, HR, and TEMP, were selected for the model training process and the rest were dropped. The selection of the most relevant features was guided by a combination of prior research and exploratory analyses. Specifically, referring to the work of the dataset provider [6], the researchers highlighted key features such as heart rate (HR), electrodermal activity (EDA), and body temperature (TEMP) as significant indicators of stress. Building on this foundation, this study has expanded the feature set by incorporating data from the 3-axis accelerometer (X, Y, Z), which provides motion-related information. This addition was made to enhance the model’s ability to capture physical activity patterns and postural changes, which are also relevant in stress detection.
The dataset was then divided into training, testing, and validation set using a 6:2:2 split to help prevent overfitting. The training set is used to train the model, the testing set is used to test the model after completing the training, while the validation set is for validating the model performance after deployment. The split was performed using a fixed random state (random_state = 42) to maintain consistency across different runs of the experiment. Additionally, the splitting process was stratified to preserve the class distribution of the dataset, ensuring that all three stress levels (no stress, low stress, and high stress) were proportionately represented in each subset. This approach enhances the reliability of the results which helps improve generalization and mitigate biases introduced by the original imbalance. The training features are then transformed by scaling each of them using MinMaxScaler() to a given range, usually of zero to one. Without altering the shape of the original distribution, it scaled the values to the specified range.
Since the size of this dataset is too large to fit in memory, a method to reduce the dimension of the input features called Incremental Principal Component Analysis (IPCA) was introduced in the process. IPCA was selected over traditional PCA and other dimensionality reduction techniques due to the large dataset size, which exceeded available memory. IPCA processes data in smaller batches, making it more suitable for handling high-dimensional datasets efficiently [27]. To determine the optimal number of components, standard PCA was first applied, and the cumulative explained variance ratio was analyzed, leading to the selection of five components to retain most of the dataset’s variance while reducing dimensionality. The transformed features were then used as inputs for machine learning models to improve performance by removing irrelevant and redundant information.

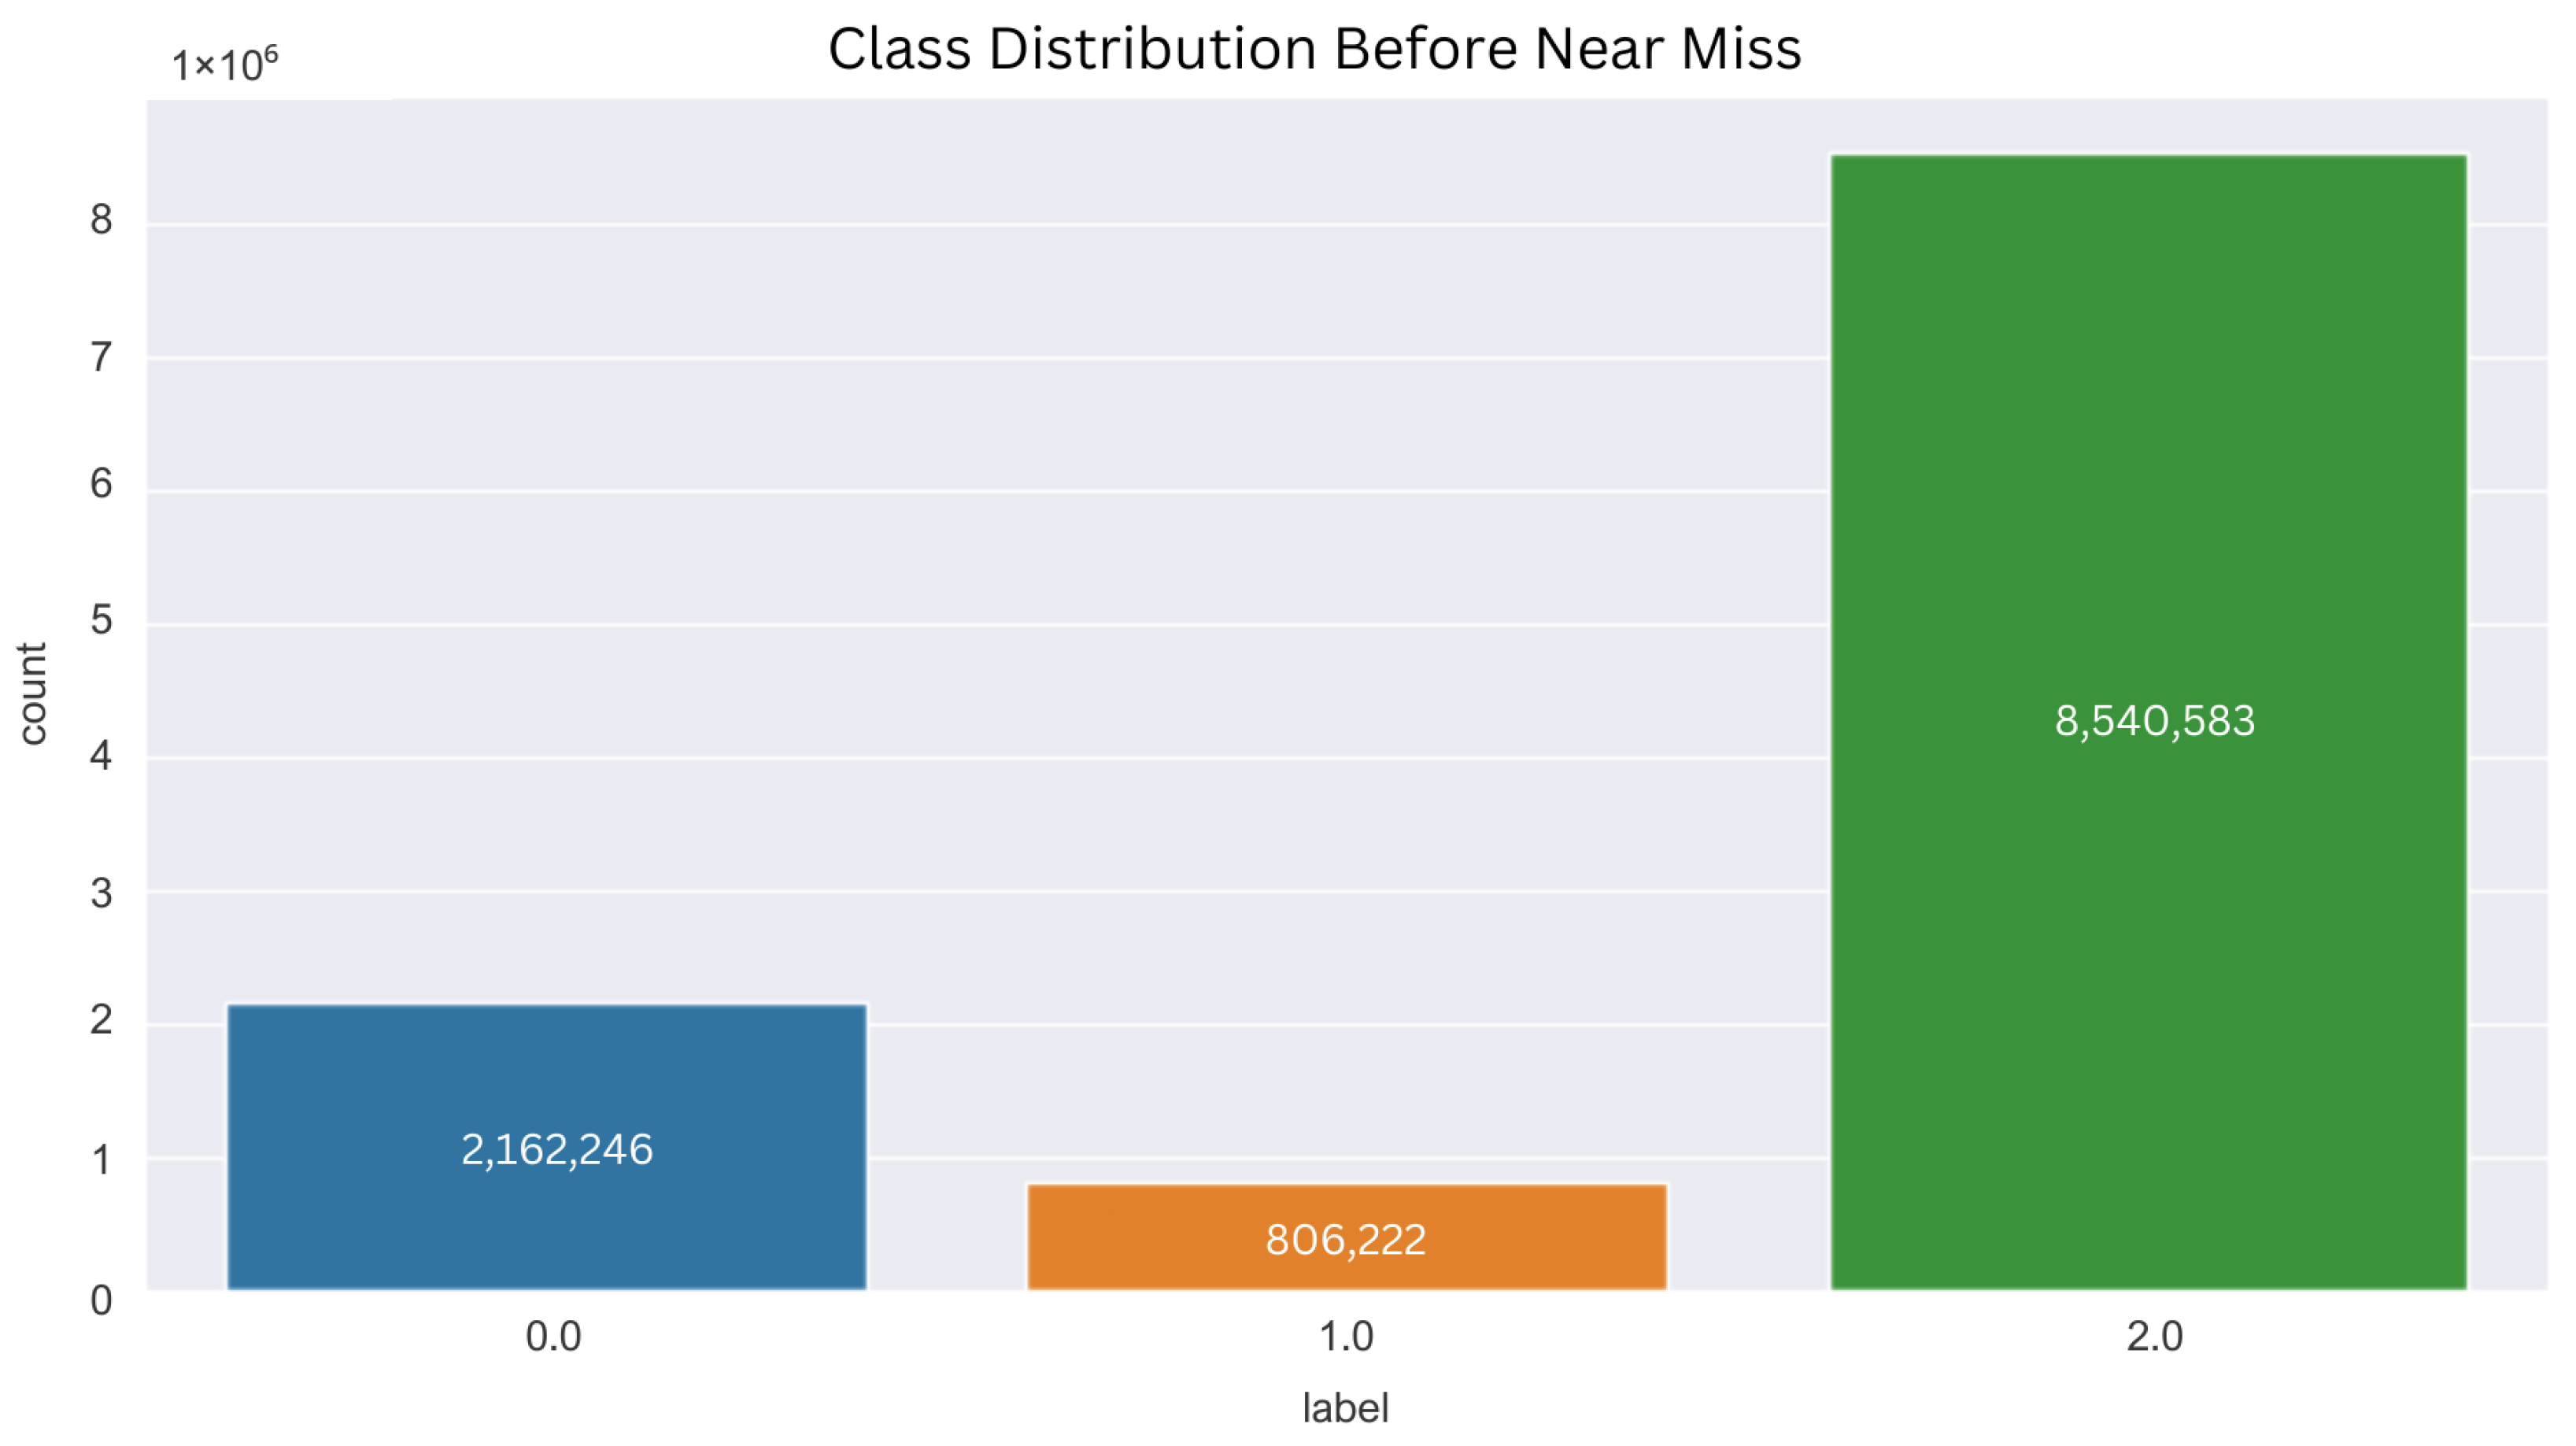
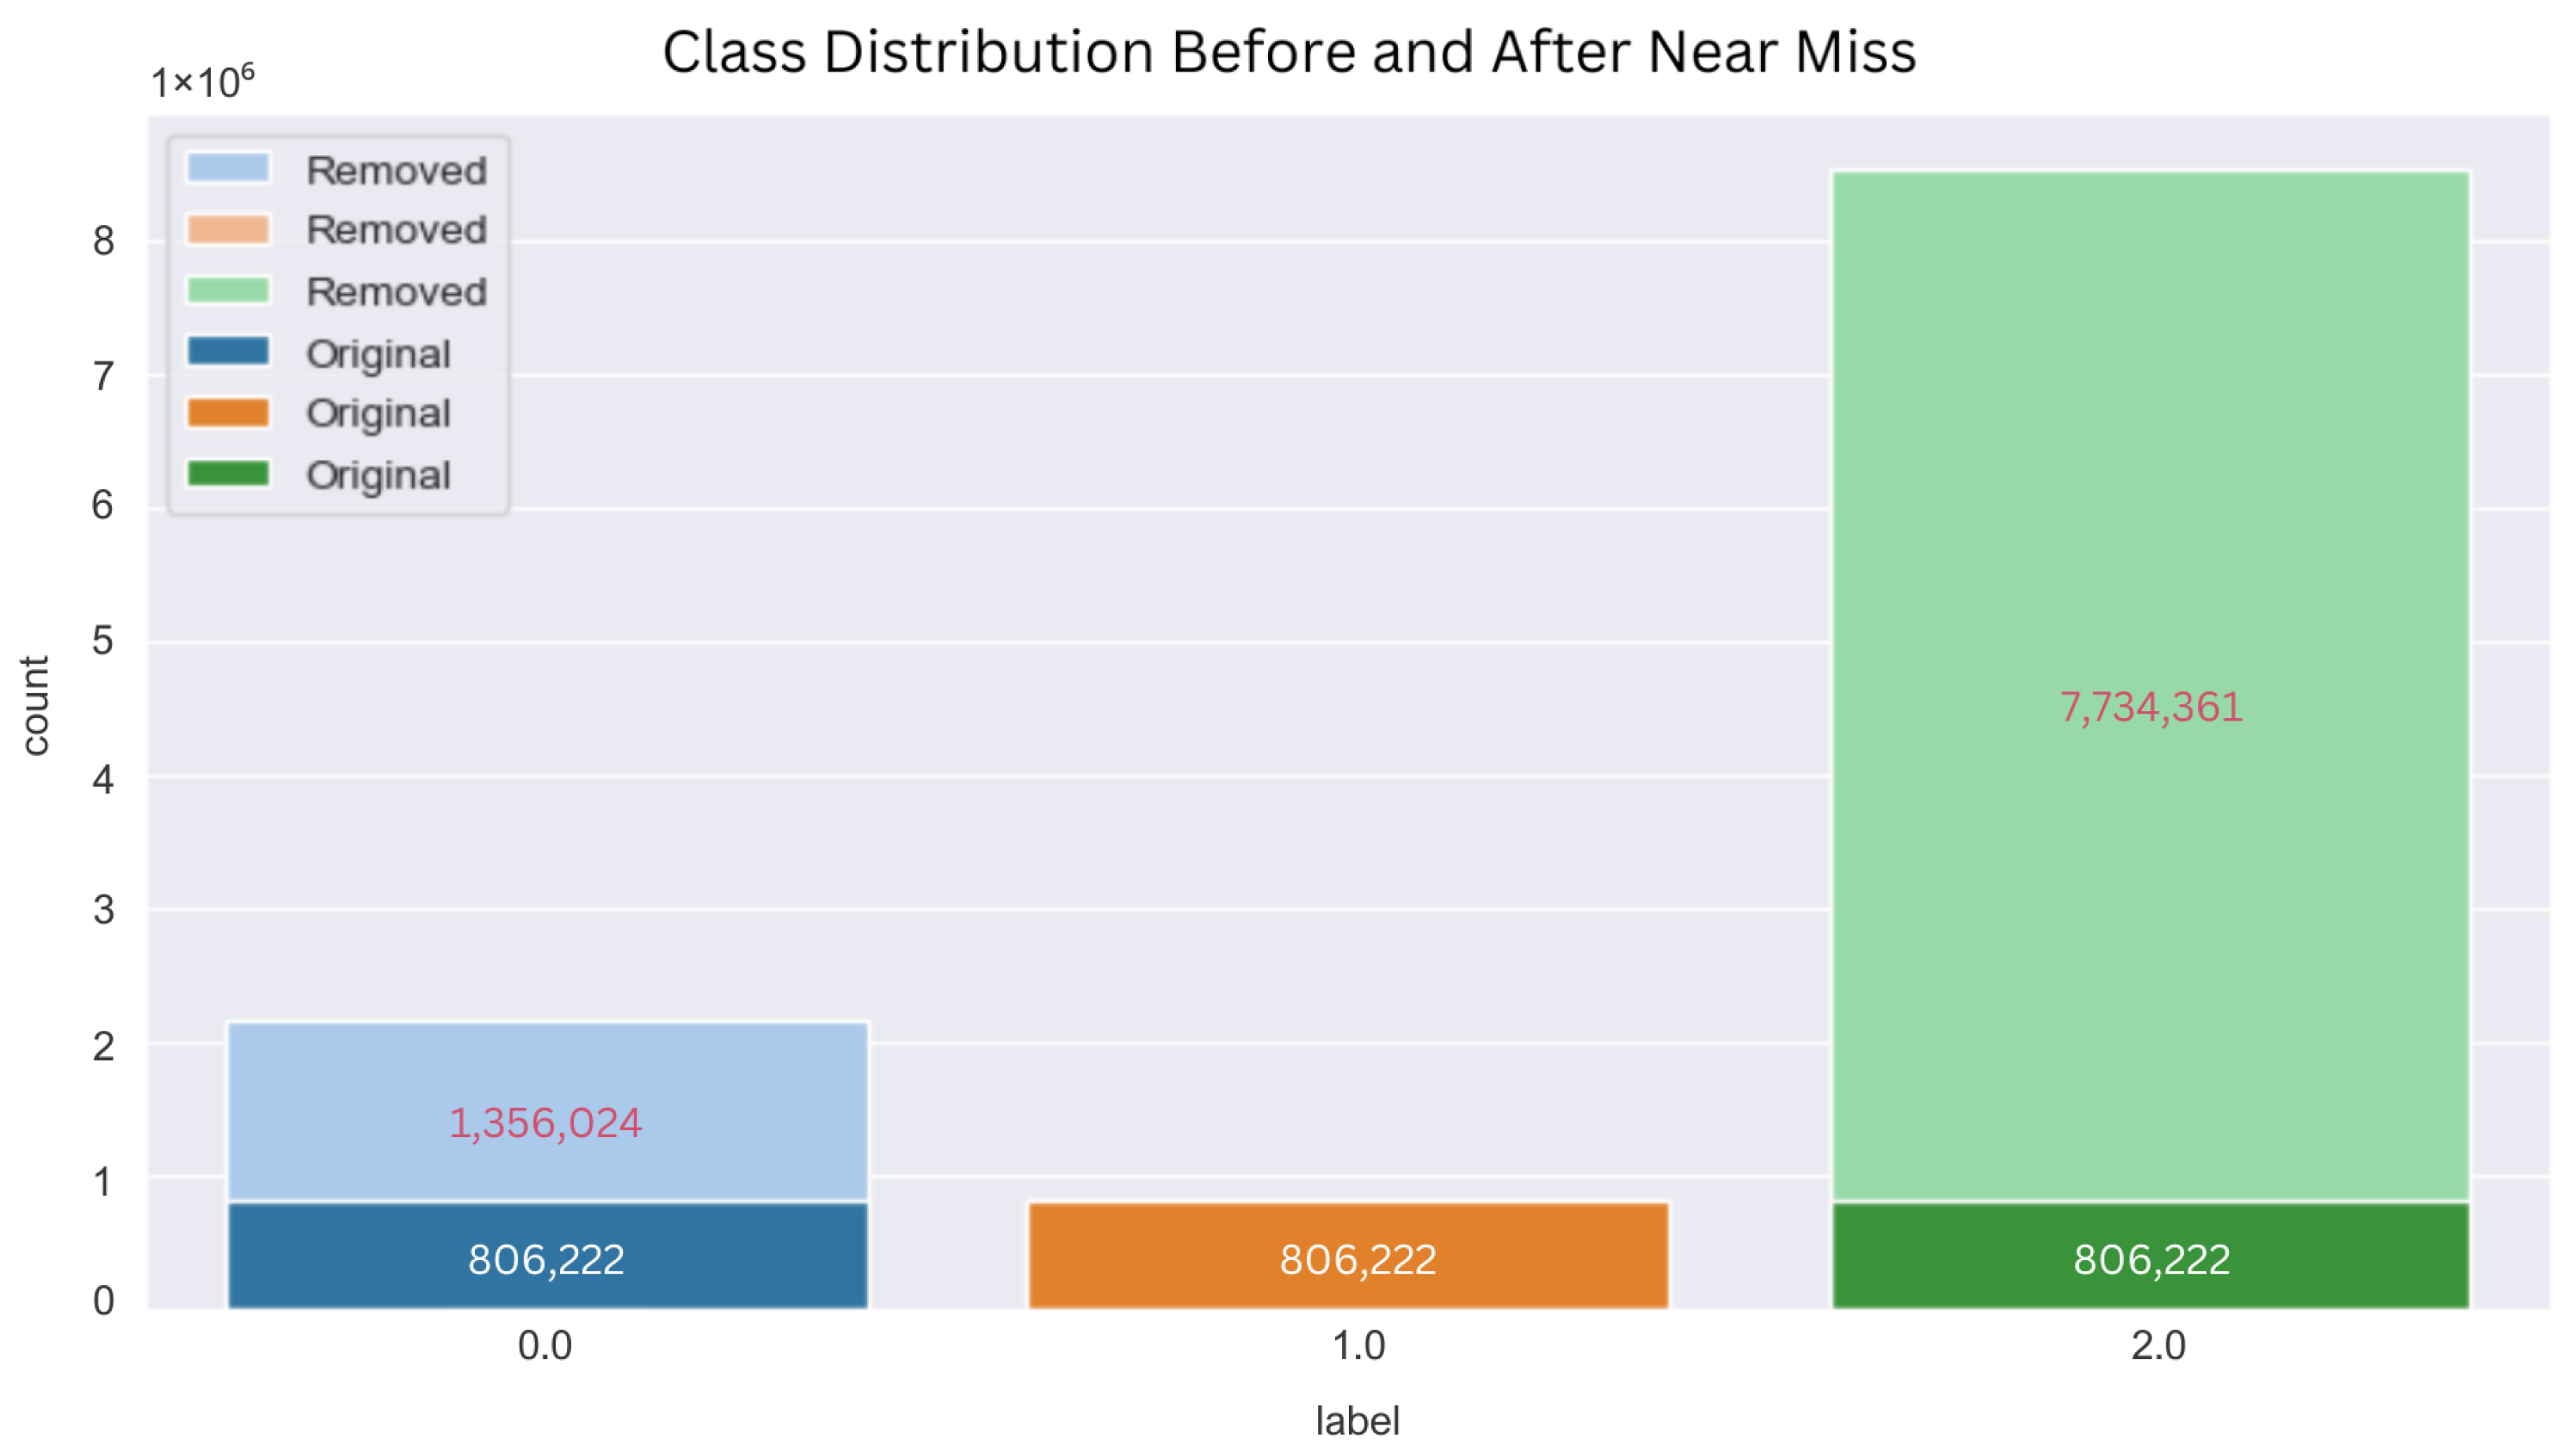
3.3. Dataset Resampling Using near Miss Undersampling

The stress in nurse dataset is considered a multiclass classification as it is composed of more than two classes, and each sample can only be assigned to one target class. This particular dataset is divided into three levels of stress; class 0 representing no-stress (18.8%), class 1 representing low stress (7%), and class 2 representing high stress (74.2%). The distribution of the three classes are depicted in Figure 3. Referring to the study by [6] for the dataset collection, the classes were calculated based on the mean value of stress ‘S’ during the session between the start and end time where: ‘no stress’ if S ≤ 0.65, ‘low stress’ if 0.65 ≤ S ≤ 1.3, and ‘high stress’ if S ≥ 1.3. These thresholds were established by them using the AffectiveRoad [28] dataset and were subsequently confirmed through survey responses in the early stage of their [6] study.
From Figure 3, it was evident that the dataset are highly imbalanced and biased, which means that the distribution of classes within the dataset are unequally distributed [29]. This issue can be solved with either two of the resampling methods, undersampling where samples are removed from the majority class, or oversampling where samples are added to the minority class. In this study, both techniques have been explored to identify which resampling method is the best to solve this specific classification problem.
Since the dataset originally has over 11 million entries, performing oversampling to replicate the existing samples or generate new synthetic samples for the minority class resulted in a high computing time (up to days or weeks) and an excessive amount of data [30]. In this case, nearly 14 million new samples will be generated, causing the ML model to train over 25 million data and suffer in memory usage due to its high complexity. Therefore, an undersampling approach was taken to manage computational resources effectively, despite the potential trade-off of information loss [31]. The results were then analyzed.
The resampling method used in this case was the Near Miss, an undersampling technique that minimizes the distance of dominant samples nearer to the minority class. This technique delivers a more vigorous and equitable class distribution boundary to enhance the performance of prediction classifiers in large-scale imbalanced datasets [32]. According to imbalance-learn documentation [33], the Near Miss technique has three versions:
  • NearMiss-1 picks samples from the majority class for which the mean distance to some closer neighbors, k is the smallest.
  • NearMiss-2 picks samples from the majority class for which the mean distance to the farthest neighbors, k is the smallest.
  • NearMiss-3 has two steps; first, a nearest-neighbors will short-listed samples from the majority class. Then, the sample with the highest mean distance to the k nearest-neighbors are picked.
In this particular study, NearMiss-1 undersampling technique was applied to the original dataset and the post-resampling class distribution is visualized in Figure 4. In this process, NearMiss-1 picked samples from Class 0 and Class 2 (majority classes) with the smallest mean distance to the 10 nearest neighbors of Class 1 (minority class) samples. As a result, around 62.7% of samples from Class 0 and 90.6% of samples from Class 2 were removed. The three classes were equally distributed totaling up to 2,418,666 entries for the dataset training.

3.4. Model Selection and Hyperparameters Tuning

In this study, six different models which are K-Nearest Neighbor (KNN), XGBoost, Random Forest (RF), Decision Tree (DT), LightGBM, and Logistic Regression (LR) have been empirically tested. An extensive explanation on each models are discussed in Section 3.4.1. The hyperparameters were fine-tuned through a grid search within a spectrum of parameters using GridSearchCV tool from the scikit-learn library to identify the optimal hyperparameters for the model to achieve the best performance. The optimal hyperparameters setting chosen for each model are shown in Table 3.

3.4.1. Classification Model

KNN is ideal for sensor data classification and has better noise sensitivity control due to its flexibility in choosing number of neighbors or the k-value [18]. The KNN algorithm is a non-complex, non-parametric method that can be used for classification and regression. It operates on the principle that similar data points are near each other in the feature space. When making a prediction, KNN identifies the ‘k’ closest training examples to the input data point based on a chosen distance metric (e.g., Euclidean distance). For classification, hyperparameter tuning is needed in the KNN algorithm. It needs to assign the input to the class most common among its ‘k’ nearest neighbors. K-fold cross-validation (CV) will produce consistent results and help provide reliable training errors while reducing fluctuations caused by them [34].
Extreme Gradient Boosting or most commonly known as XGBoost is a Boosting iterative algorithm based on a linear classifier or tree which integrates several weak classifiers to produce one strong classifier with better classification or regression outcomes [35]. The XGBoost model consistently incorporates and trains new trees in every iteration to adjust for the residuals of the predicted values from the prior decision tree and the total predicted values from all preceding decision trees. As the final result, it summed up all the predicted values of the decision trees together. XGBoost is broadly used due to its great performance in both classification and regression and it provides fast computing speed. A proper hyperparameter tuning is needed for XGBoost model’s training performance, including objective, ‘max_depth’, and ‘n_estimators’. To perform multiclass classification, the objective function was set to ‘multi:softmax’ as it outlines the learning task for the model. On the other hand, ‘max_depth’ represents the maximum depth of the tree, influencing the XGBoost model’s degree of overfitting or underfitting to a certain extent, while ‘n_estimators’ represents the total count of iterations, which is equivalent to the number of decision trees.
Random Forest consists of a group of decision trees used for data classification and prediction [16]. The input is passed through the root node at the top and then traverses down to the leaf nodes. Each tree in the forest can have hundreds of branches, all built using the same method. For classification, the Random Forest analysis produces results based on the mode of each tree in the forest, while prediction results are derived from the average value of all the trees. The function criterion is used to decide a split in decision trees and measure the quality of a split. Supported criterias are ‘gini’ for the Gini impurity and ‘entropy’ for the Shannon information gain.
Decision Tree model is a top-down structure that transforms data into a decision tree and generates rules. It offers a structure that starts from the root node at the top and extends down to the leaf nodes [36]. Branches are used to connect the nodes. Decision trees utilize if-then conditions, which form the logical structure within the nodes. Decision trees can reveal relationships. This structure begins with the root node at the top level, and each branch’s possible outcome is evaluated at the decision nodes. This model uses recursive partitioning to make decisions, as its flowchart structure closely mirrors human thought processes. The time complexity of a decision tree is influenced by the number of features in the given data and is independent of any assumptions about probability distributions [37].
LightGBM is a framework designed to support efficient parallel training and offers several advantages, including faster training speeds and the ability to quickly handle large datasets [38]. LightGBM uses the negative gradient of the loss function as a residual approximation for the current decision tree, which is then used to fit a new tree. The framework employs a histogram-based algorithm that reduces memory usage and simplifies data partitioning. Additionally, it follows a leaf-wise strategy with depth restrictions, selecting the leaf with the largest splitting gain and the most data for each split. This approach minimizes errors and improves accuracy when the number of splits is the same. To perform multiclass classification using LightGBM, the objective function was set to ‘multiclass’.
Logistic Regression is a supervised machine learning technique that is mainly used in classification tasks to predict the probability of an instance belonging to a particular class [37]. In classification, Logistic Regression takes the output from linear regression and transforms it with a sigmoid function to estimate class probabilities. This model focused on predicting the likelihood of an instance belongs to a specific class, unlike linear regression which produces continuous values. In the case of multiclass classification, the training algorithm applies cross-entropy loss when the ‘multi_class’ option is set to ‘multinomial’. The ‘multinomial’ option is compatible with the ‘newton-cg’ solver, which implement regularized logistic regression. For multiclass problems, the ‘newton-cg’ solver handle multinomial loss as it support only L2 regularization with a primal formulation. The ‘max_iter’ is the maximum number of iterations required for the solvers to reach convergence.
Table 3. Model hyperparameter settings.
ModelHyperparametersSettings
KNNn_neighbors3
cv10
XGBoostobjective‘multi:softmax’
max_depth15
n_estimators100
Random Forestcriterion‘entropy’
max_depth15
n_estimators100
Decision Treecriterion‘entropy’
max_depth15
LightGBMobjective‘multiclass’
Logistic Regressionsolver‘newton-cg’
penalty‘L2’
multi_class‘multinomial’
max_iter100

3.4.2. Performance Metrics

The performance evaluation of the prediction model is carried out by considering several performance evaluation metrics, the most common to evaluate the model’s performance in predicting stress. These metrics including accuracy, precision, recall, and F1-score are derived from the confusion matrix. It is a valid results’ representation, alongside classification report, to assess the performance of a classifier model against a set of test data [39].
A multiclass confusion matrix with three classes depicting the three labels (stress level) from the dataset used in this study is visualized in Table 4a. The outcome of a predicted class from the actual class is also visualized in this table. This matrix is made up of true positive (TP), true negative (TN), false positive (FP), and false negative (FN). Referring to Table 4b, TP is considered as the numbers of positive classes that are correctly classified for class C3, whereas FN and FP are the values that were misclassified as class C3 on the row and the column respectively. TN on the other hand compromises all the other tiles apart from the considered class C3. When switching from one class to another, the values are recalculated and the labels for the confusion matrix must be changed accordingly [40].
From the confusion matrix, the accuracy, precision, recall, and F1-score of a test data can be calculated as shown in Equations (1)–(4).
Accuracy = TP + TN TP + TN + FP + FN
Precision = TP TP + FP
Recall = TP TP + FN
F 1 - score = 2 Precision Recall Precision + Recall

3.5. Deployment in Tiny Edge Device

3.5.1. System Design and Prototype Development

Four sensors were carefully chosen for the prototype to designate the features selected from the trained ML models. These include a BMA400 accelerometer sensor to acquire the values of X, Y, and Z, a MAX86150 sensor for HR values, an STS21 temperature sensor for TEMP values, and an LM324 circuit connected with two electrodes for EDA measurements. These sensors were calibrated to replicate and function as similarly as possible to the health sensors in Empatica E4 that was used to gather the nurse dataset. The sensor data output and the stress prediction are then displayed on an SSD1306 OLED display. The sensors data are programmed to be aligned in a single frequency so that all sensors data can be used to predict the condition regularly using the developed model.
These sensors are connected to a microcontroller board based on the Raspberry Pi RP2040 microcontroller chip [41]. This versatile and affordable Dual-Core, 32-bit ARM Cortex M0+ processor board was chosen because of its compact size and extremely lightweight, which makes it perfect for embedded system devices like TinyML. In terms of memory, the Raspberry Pi module comes with 264 KB of high-performance SRAM and 2 MB of flash memory. The SRAM is used for temporary data storage while the flash memory holds the code and other data needed to operate the board. The microcontroller appears as USB mass storage by default where no driver is needed if connected to a USB port. This function is valuable in the circuit design. The microcontroller is flexible and can be programmed using basic programming languages such as MicroPython, CircuitPython, C, C++, C alike in Arduino IDE Programming Language. A comparative study of this controller to Arduino SAMD21 was performed to highlight its advantages in embedded machine learning [42].

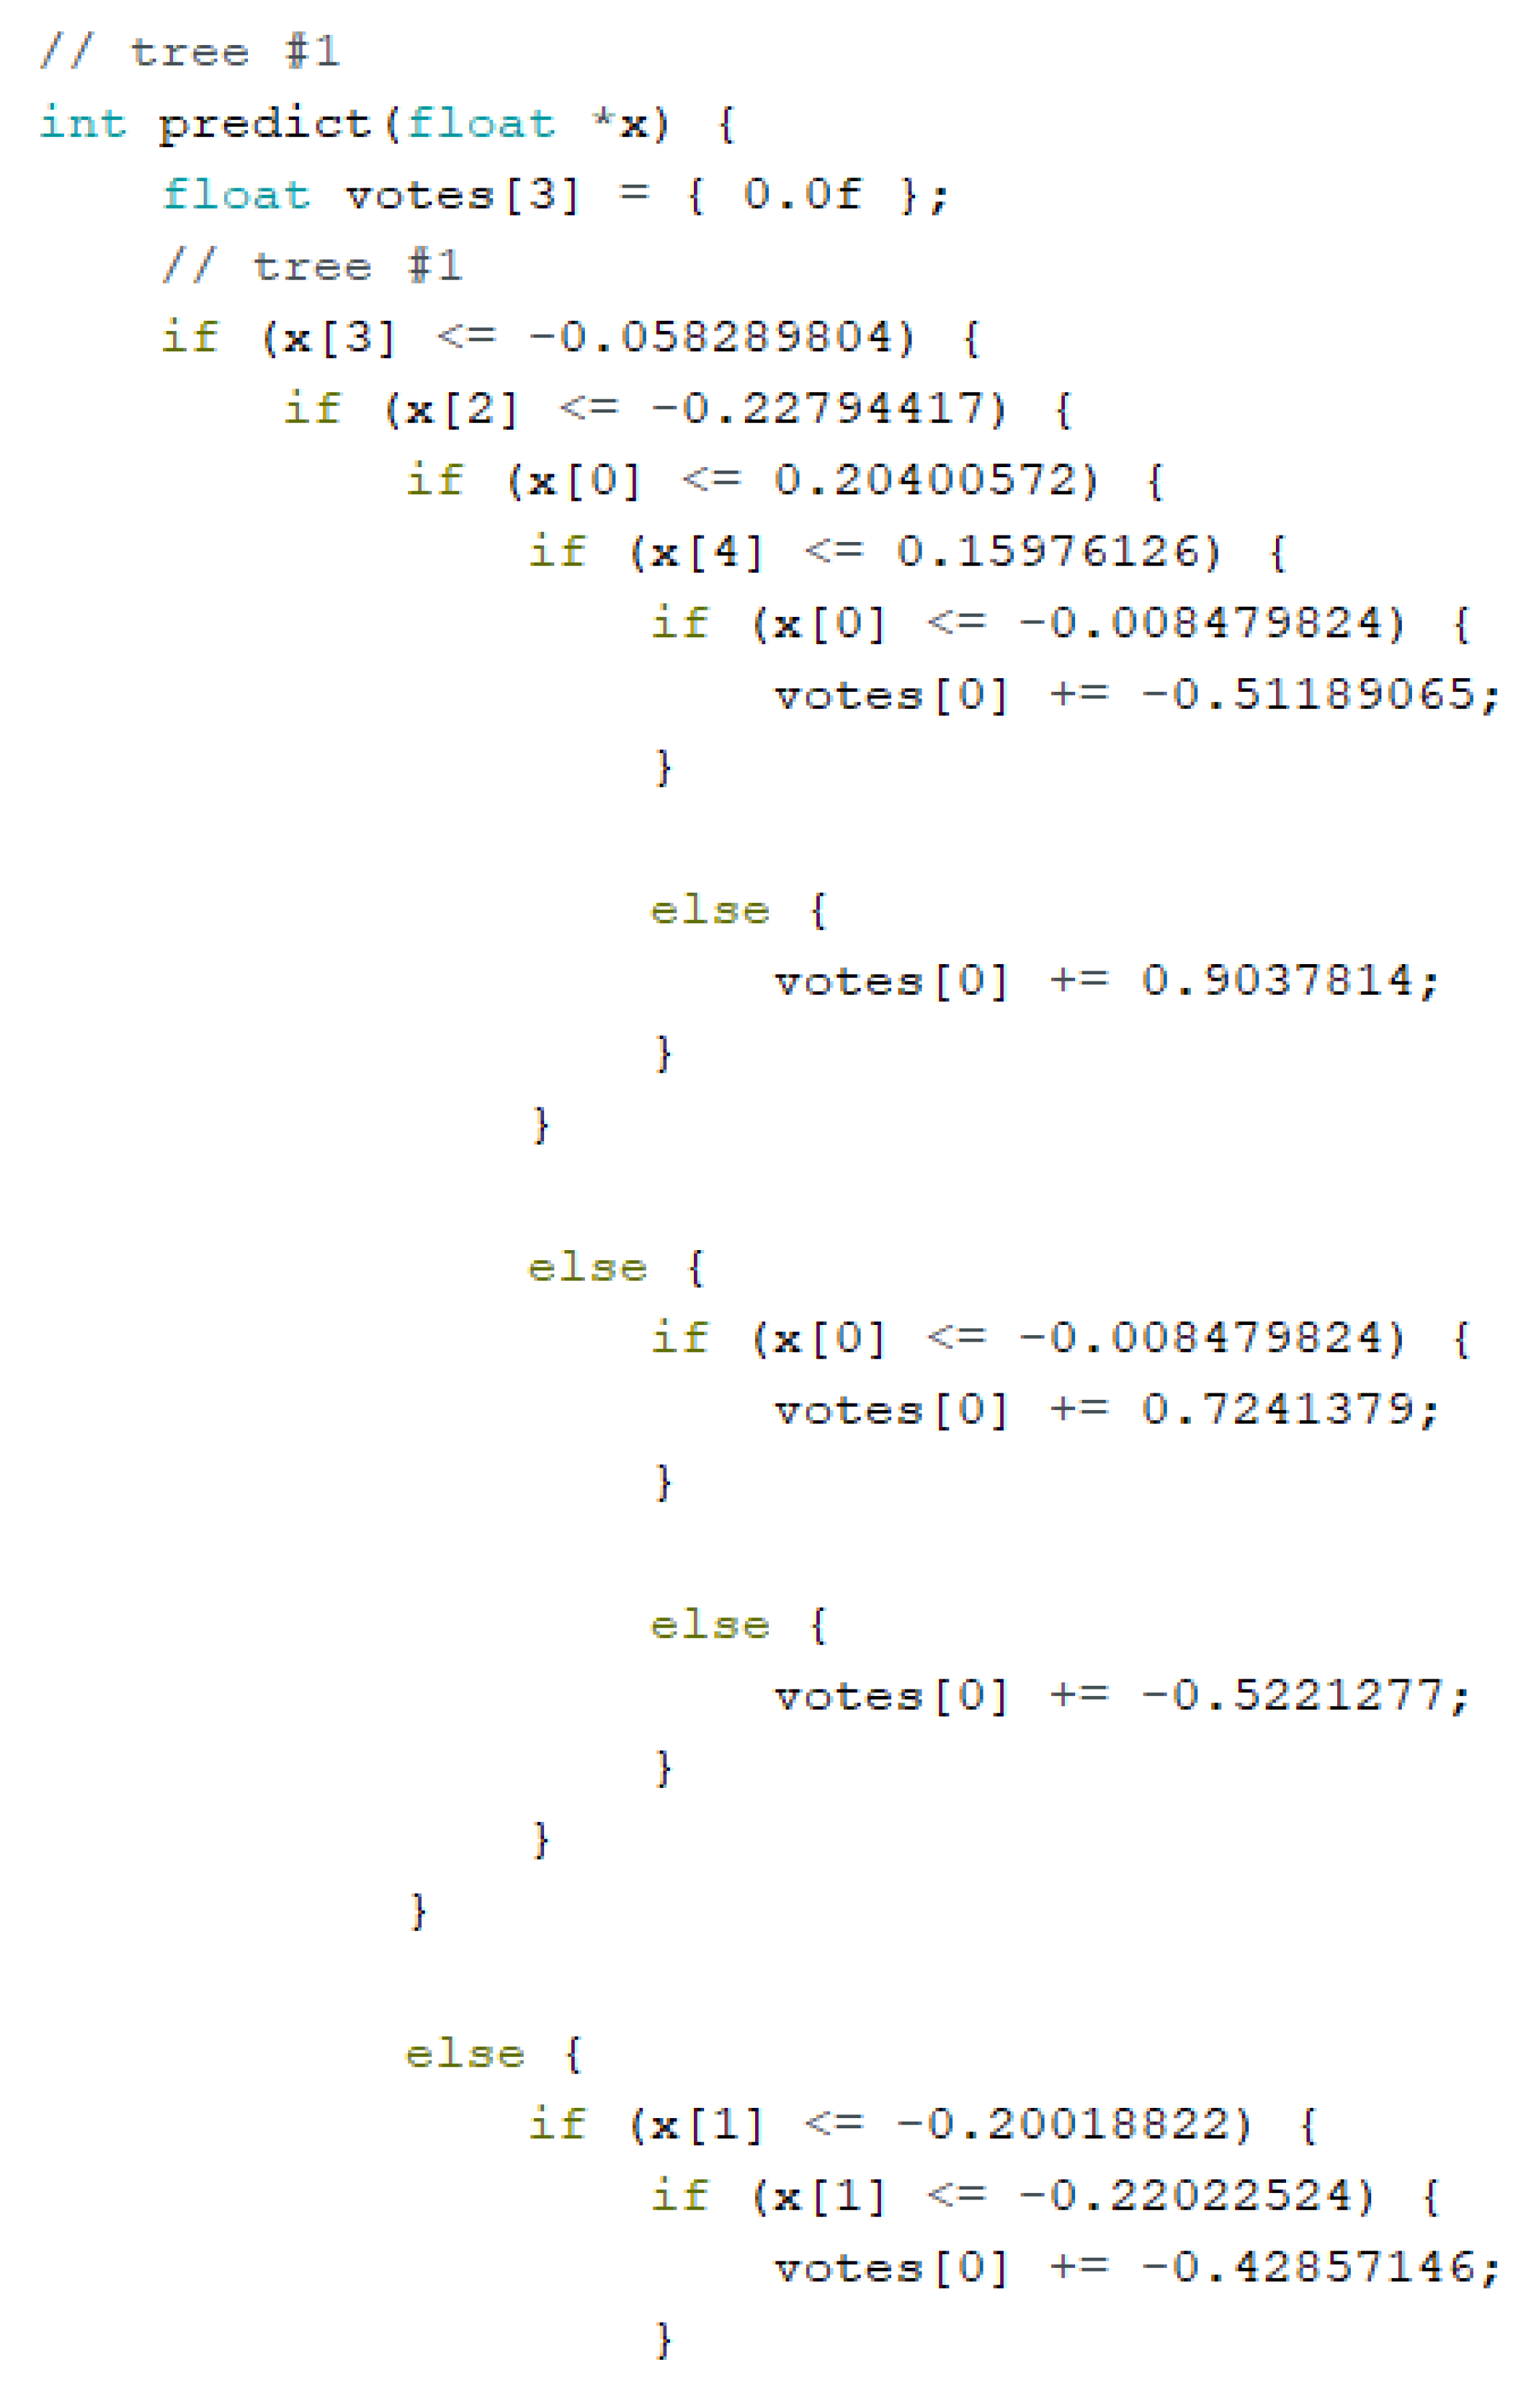
3.5.2. Porting the ML Model

After being validated and tested, a trained ML model with the best performance was thoroughly picked for deployment. This includes the process of distinguishing a porting library that is compatible with Raspberry Pi RP2040 and should support classifier models designed for classification tasks. Several libraries are available on Github that fit the criteria of this study, such as micromlgen [13], m2cgen [43], and everywhereml [44]. They are issued as Python libraries which incorporate functions that can read pre-trained scikit-learn models to translate them into plain if-else C/C++ codes.
In this study, micromlgen was used primarily as the porting library, as it supports most scikit-learn models used during data preprocessing. Since this library only supports certain classifier models, XGBoost and Random Forest were the main choices for deployment. The decision to focus on these models was further reinforced by their strong performance in the evaluation phase, where they ranked as the second and third best-performing models after K-Nearest Neighbors (KNN). However, deploying KNN was not feasible due to its incompatibility with micromlgen and the limitations of the Raspberry Pi RP2040.
KNN’s memory-intensive nature, requiring the storage of the entire training dataset and distance calculations during inference, made it unsuitable for the resource-constrained microcontroller, which has only 2 MB of flash memory. On the other hand, XGBoost and Random Forest are more memory-efficient and compatible with micromlgen, allowing their successful integration into the TinyML framework. To further optimize the models for deployment, their hyperparameters were fine-tuned to balance flash memory usage and predictive performance, ensuring the system’s viability while maintaining robust accuracy. This selection process reflects a careful alignment of computational constraints, hardware compatibility, and model effectiveness.

3.5.3. Data Acquisition and Validation

When porting the model from python, it was necessary to save it as a header file with .h extension. This header file contains the definitions for functions and variables of the ML model. It can be used as an external library for the programming in Arduino IDE and was called using the #include function. In the IDE sketch, a complete code to read the sensor data was written and the stress predictions were made in real-time by utilizing the predict function whenever inference from the ML model is required. This whole code was verified, compiled, and uploaded into the RP2040. The prediction of stress on edge device was then tested and validated in a laboratory environment using different sub-dataset (validation set) to quantify that the prediction accuracy made by the deployed model is similar to the origin model in Python.

4. Result and Discussion

4.1. Classification Models Comparative Analysis

The performance evaluation of the prediction model is carried out by considering several performance evaluation matrices, the most common to evaluate the model’s performance in predicting stress. These matrices include accuracy, precision, recall, F1-score, and confusion matrix. The results of classification using different models can be analyzed in Table 5 to show the accuracy, precision, recall, and F1-score of each trained classifier for both validation and test sets.
From Table 5, it can be deduced that KNN and XGBoost classifiers attained the highest performance in making predictions regarding all the matrix evaluation results. These models achieved an accuracy, precision, recall, and F1-score of slightly over 98.0%, with KNN surpassing XGBoost’s performance with only 0.08% difference. Random Forest on the other hand reached an adequate results of over 91.0% in all four performance metrics for both validation and test set. Relatively, Decision Tree outperformed LightGBM classifier by merely 0.03% across all the evaluation metrics on both sets. Logistic Regression classifier on the contrary, performed the worst out of the six with performance below than 50% in all matrices and in both sets.
In the machine learning model classification task, the confusion matrix is used as an evaluation method to evaluate the operational capability of the ML model tuned with different hyperparameters and feature extractions. This matrix issues an overview of the model’s classification performance on the test dataset. Figure 5 shows the confusion matrix for the six classifier models tested in this study. The values 0, 1, and 2 represent the classification’s stress class or data label. A value of 0 represents data classified as no stress, a value of 1 as low stress, and a value of 2 as high stress.
From Figure 5a–f, inferences can be made for each classifier models based on the generated confusion matrix from sklearn_metrics function. Out of 483,734 test data across all three classes, KNN classifier model could provide 475,485 TPs and misclassified only 1.71% (8249) of the total test data. For XGBoost classifier, it was evident that 158,092 values were correctly predicted for the high stress class, whereas Random Forest classifier accurately predicted 148,002 at most for the same class. Respectively, Decision Tree and LightGBM classifiers precisely predicted 140,623 and 133,381 values to their actual class (Class 2). Contrariwise, Logistic Regression misclassified around 59.8% (96,428 FNs) values of the no stress class and predicted only 64,816 values correctly.
Table 5. Comparison of machine learning model performance.
Validation SetTest Set
Classifier Accuracy Precision Recall F1-Score Accuracy Precision Recall F1-Score
KNN0.98310.98310.98310.98310.98290.98290.98290.9829
XGBoost0.98230.98230.98230.98230.98210.98210.98210.9821
Random Forest0.91250.91330.91250.91260.91280.91360.91280.9129
Decision Tree0.87080.87100.87080.87090.87020.87040.87020.8703
LightGBM0.84390.84440.84390.84400.84430.84480.84430.8444
Logistic Regression0.45860.45950.45860.45750.45990.46090.45990.4588

4.2. Deployment Classification Models Comparative Analysis

In the proposed workflow, the best ML model was identified and selected to be deployed in an edge device comprising of Raspberry Pi RP2040 as the main microcontroller unit. Since it has limited computational capacities, the model must be translated from Python into simple if-else C/C++ codes using the micromlgen porting library. Larger models can be accommodated in C/C++ implementations, allowing us to achieve greater accuracy from them [45]. The aim of this study is to find the best performing model with high accuracy that can adhere to the 2MB flash memory constraints of the Raspberry Pi RP2040 module. If this limitation is breached, the sketch will fail to compile indicating high complexity in the code.
Even though an accuracy of 98.2% were achieved during the ML model training, hyperparameters tuning must be done to generate a proper model that occupies the memory within the 2MB constraint despite there will be slight decrease in accuracy. In this case, two models (XGBoost and Random Forest) were selected to undergo hyperparameters tuning. The hyperparameters were optimized using a grid search across a range of valid parameters: maximum depth (3, 5, 7, 15), number of estimators (30, 50, 100), learning rate for XGBoost (0.1, 0.3, 0.7), and criterion for Random Forest (entropy, gini), as well as 10-fold cross-validation for both models to ensure that the model is not overfitting.
Table 6 shows three different hyperparameters settings of XGBoost and Random Forest respectively along with the accuracy and size of the models. Comparing the three versions of the XGBoost model, it was evident that by tuning the learning rate to 0.7 and the number of estimators to 50, the size of the model was significantly reduced by 200 MB. However, the maximum depth also played a big role in determining the size of the model as the difference between depth of 7 and 5 were profoundly visible in XGBoost(2) and XGBoost(3). Even though the accuracy of the model decreased by 6.5%, resulting in only 86.0% of accuracy, the size of the XGBoost(3) model is the one that fit into memory constraints of the Raspberry Pi with 1.12 MB in size.
Random Forest models with different hyperparameter settings were also tested for comparison. It is apparent that by changing the criterion from ’gini’ to ’entropy’ and lowering the maximum depth and number of estimators from 15 and 100 to 7 and 50, respectively, the model size was notably reduced by 200 MB, down to 1.5 MB. However, this adjustment also led to a decrease in accuracy for Random Forest(3) model, which dropped from over 90% to only 73.2%.
Therefore, to fulfill the objective of this study to find the best performing model with high accuracy that could fit in the 2MB memory constraints of the RP2040, the XGBoost(3) model with 86.0% accuracy and 1.12 MB was specifically chosen to deploy in the edge device. The individual decision trees from the trained XGBoost(3) model was visualized in Appendix A. A zoom in on one of the XGBoost(3) branch (or parallel tree) of the Figure A1 in making decision can be referred in Figure A2. XGBoost(3) uses a method that improves decision trees by focusing on the significance of weights. Before making predictions, each variable is given a weight. If a variable is incorrectly predicted by the first decision tree, it gets more weight and is then processed by the next tree. This process shown in Figure A1 uses multiple trees to create a strong and accurate model.
The selected XGBoost(3) model was then translated into C/C++ codes from Python using the micromlgen porting library. Since XGBoost(3) is a decision tree based model, it was executed through a sequence of interconnected conditional statements within one predict function. The data input vector is sent to the predict function in the form of an array of floating point numbers, and the function infers and returns the outcome as another floating point number. Figure A3 on Appendix A shows a part of the conditional statements based decision tree of XGBoost(3).
Table 6. Size of model and its performance comparison when model have different hyperparameter settings.
ModelHyperparametersSettingsModel AccuracySize of Model
XGBoost(1)objective‘multi:softmax’98.2%226 MB
max_depth15
n_estimators100
XGBoost(2)objective‘multi:softmax’92.5%4.47 MB
learning_rate0.7
max_depth7
n_estimators50
XGBoost(3)objective‘multi:softmax’86.0%1.12 MB
learning_rate0.7
max_depth5
n_estimators50
Random Forest(1)criterion‘gini’92.3%213.7 MB
max_depth15
n_estimators100
Random Forest(2)criterion‘entropy’91.4%241 MB
max_depth15
n_estimators100
Random Forest(3)criterion‘entropy’73.2%1.5 MB
max_depth7
n_estimators50

5. Conclusions

This study has successfully developed a machine learning model targeted for wearable devices using physiological and psychological data to classify stress levels to meet the growing need for early stress detection in healthcare. The potential of using TinyML for stress prediction using a wearable device equipped with physiological sensors was also thoroughly discussed and demonstrated. A stress prediction classifier was trained, tested and evaluated using an imbalance class nurse dataset that was addressed using the Near Miss undersampling method. For classification purposes, the stress levels were categorized into three classes: no stress, low stress, and high stress. The dataset was trained using six different ML classifiers but only KNN and XGBoost that performed well in terms of all performance metrics, reaching above 98.0%. Since KNN model is not supported by the existing micromlgen porting library, XGBoost and Random Forest were chosen, then empirically trained and tested for deployment after tuning their hyperparameters.
The proposed system, built on a Raspberry Pi RP2040, effectively addresses the challenge of fitting a machine learning model into the microcontroller’s limited memory without sacrificing the model’s accuracy. The optimized XGBoost(3) model achieved 86.0% of accuracy and was successfully deployed on the edge device with only 1.12 MB in size. When being tested and validated using a separate sub-dataset, the classification of stress on the edge device exudes a satisfactory prediction results. This approach paves the way for real-time stress monitoring and can be applied to other real-time applications and analyses in the future.
There are several improvements, limitations, as well as strong points that can be highlighted in this study. First, this system can be further improved with a more robust real-time validation system that includes an immediate reading from the calibrated health sensors as they give an immediate feedback for the stress prediction. Apart from that, this work could also be enhanced by extracting more features from the current dataset or include features from another dataset to achieve an unbiased performance score while still satisfying the strong constraint of the memory limit of a tiny and low cost microcontroller. Lastly, future research is needed to explore different combinations of resampling techniques for an imbalanced dataset and classification models because the effectiveness of some resampling technique may relatively be contingent to the classifier. On a positive note, the results from this study could inform researchers on how to deploy ML model of their choice using a porting library, depending on which microcontroller they are using. Additionally, the empirical results from the comparison among different ML models’ performance might as well guide researchers in choosing the most suitable hyperparameter settings for their TinyML device.
Overall, the objectives of this study have been propitiously achieved. The research effectively addressed the key challenges outlined at the beginning, including the development of an efficient machine learning model for stress prediction within strict memory constraints on TinyML device, and ability to deliver an ML model that met performance criteria, such as high accuracy but in compact size. These achievements not only fulfill the study’s primary goals but also open up avenues for further research and real-time applications in stress prediction and monitoring.

Author Contributions

Conceptualization, A.A.-S., J.C.D.C. and N.F.A.; methodology, D.G., A.A.-S. and R.J.M.; software, D.G., J.C.D.C., G.V.M. and A.A.-S.; validation, D.G., N.K., R.J.M. and R.N.; formal analysis, D.G., A.A.-S. and N.F.A.; investigation, D.G., R.J.M. and N.K.; resources, A.A.-S., R.N. and R.J.M.; data curation, D.G. and A.A.-S.; writing—original draft preparation, D.G., A.A.-S. and N.F.A.; writing—review and editing, D.G.and R.N.; visualization, D.G.; supervision, A.A.-S., N.F.A. and R.N.; project administration, A.A.-S., J.C.D.C. and R.J.M.; funding acquisition, A.A.-S. All authors have read and agreed to the published version of the manuscript.

Funding

This work is the output of the ASEAN IVO (http://www.nict.go.jp/en/asean_ivo/index.html (accessed on 7 February 2025)) project PJ2022-03, “P2EI-WEALTH (Physiological and Psychological Edge Intelligence WEArable LoRa HealTH) System for Remote Indigenous Community and Disaster Recovery Operation”, and financially supported by NICT Japan (http://www.nict.go.jp/en/index.html (accessed on 7 February 2025)). The grant code under Universiti Kebangsaan Malaysia is DPK-2022-010.

Data Availability Statement

Data available on request due to restrictions.

Acknowledgments

The authors would like to acknowledge help received by the different members of the Universiti Kebangsaan Malaysia’s Wireless Research@UKM Laboratory who has participated in the testing and validation of the studies.

Conflicts of Interest

The authors declare no conflicts of interest. The funders have contributed to the feedback of the system throughout the project’s execution and participated in the decision to publish the results.

Abbreviations

The following abbreviations are used in this manuscript:
BVPBlood Volume Pulse
CLASCognitive Load, Affect and Stress
CNNConvolutional Neural Networks
DTDecision Tree
ECGElectrocardiogram
EDAElectrodermal Activity
EMGElectromyogram
FNFalse Negative
FPFalse Positive
GSRGalvanic Skin Response
HRHeart Rate
IPCAIncremental Principal Component Analysis
LRLogistic Regression
MLMachine Learning
TEMPTemperature
PPGPhotoplethysmogram
RFRandom Forest
SELStacking Ensemble Learning
SFSpreading Factor
SVMSupport Vector Machine
TNTrue Negative
TPTrue Positive
WESADWearable Stress and Affect Detection

Appendix A

Figure A1. XGBoost(3) individual decision trees.
Electronics 14 00687 g0a1
Figure A2. A zoom in of Figure A1 on one of the XGBoost branch (or parallel tree) in making decision.
Electronics 14 00687 g0a2
Figure A3. Some part of the conditional statements based decision tree of XGBoost(3) when being translated into C/C++ code.
Electronics 14 00687 g0a3

References

  1. Anusha, A.; Sukumaran, P.; Sarveswaran, V.; Shyam, A.; Akl, T.J.; Preejith, S.; Sivaprakasam, M. Electrodermal activity based pre-surgery stress detection using a wrist wearable. IEEE J. Biomed. Health Inform. 2019, 24, 92–100. [Google Scholar]
  2. Gedam, S.; Paul, S. A review on mental stress detection using wearable sensors and machine learning techniques. IEEE Access 2021, 9, 84045–84066. [Google Scholar] [CrossRef]
  3. Angalakuditi, H.; Bhowmik, B. Impact of stress during covid-19 pandemic. In Proceedings of the 2023 9th International Conference on Advanced Computing and Communication Systems (ICACCS), Coimbatore, India, 17–18 March 2023; Volume 1, pp. 1719–1724. [Google Scholar]
  4. Nirjhar, E.H. Expression and Perception of Stress Through the Lens of Multimodal Signals: A Case Study in Interpersonal Communication Settings. In Proceedings of the 2023 11th International Conference on Affective Computing and Intelligent Interaction Workshops and Demos (ACIIW), Cambridge, MA, USA, 10–13 September 2023; pp. 1–5. [Google Scholar]
  5. Iqbal, T.; Simpkin, A.J.; Roshan, D.; Glynn, N.; Killilea, J.; Walsh, J.; Molloy, G.; Ganly, S.; Ryman, H.; Coen, E.; et al. Stress monitoring using wearable sensors: A pilot study and stress-predict dataset. Sensors 2022, 22, 8135. [Google Scholar] [CrossRef]
  6. Hosseini, S.; Gottumukkala, R.; Katragadda, S.; Bhupatiraju, R.T.; Ashkar, Z.; Borst, C.W.; Cochran, K. A multimodal sensor dataset for continuous stress detection of nurses in a hospital. Sci. Data 2022, 9, 255. [Google Scholar] [CrossRef]
  7. Rachakonda, L.; Mohanty, S.P.; Kougianos, E.; Sundaravadivel, P. Stress-Lysis: A DNN-integrated edge device for stress level detection in the IoMT. IEEE Trans. Consum. Electron. 2019, 65, 474–483. [Google Scholar] [CrossRef]
  8. Vela, L.M.; Crandall, H.; Lim, T.; Zhang, F.; Gibbs, A.; Mitchell, A.R.; Condon, A.; Diamond, L.M.; Zhang, H.; Sanchez, B. IoMT-enabled stress monitoring in a virtual reality environment and at home. IEEE Internet Things J. 2023, 10, 10649–10661. [Google Scholar] [CrossRef]
  9. Chen, J.; Abbod, M.; Shieh, J.S. Pain and stress detection using wearable sensors and devices—A review. Sensors 2021, 21, 1030. [Google Scholar] [CrossRef] [PubMed]
  10. Zhao, L.; Niu, X.; Wang, L.; Niu, J.; Zhu, X.; Dai, Z. Stress detection via multimodal multi-temporal-scale fusion: A hybrid of deep learning and handcrafted feature approach. IEEE Sens. J. 2023, 23, 27817–27827. [Google Scholar] [CrossRef]
  11. Hosseini, E.; Fang, R.; Zhang, R.; Parenteau, A.; Hang, S.; Rafatirad, S.; Hostinar, C.; Orooji, M.; Homayoun, H. A low cost eda-based stress detection using machine learning. In Proceedings of the 2022 IEEE International Conference on Bioinformatics and Biomedicine (BIBM), Las Vegas, NV, USA, 6–8 December 2022; pp. 2619–2623. [Google Scholar]
  12. Schmidt, P.; Reiss, A.; Duerichen, R.; Marberger, C.; Van Laerhoven, K. Introducing WESAD, a Multimodal Dataset for Wearable Stress and Affect Detection. In Proceedings of the 20th ACM International Conference on Multimodal Interaction, New York, NY, USA, 16–20 October 2018; ICMI ’18. pp. 400–408. [Google Scholar]
  13. MicroML. Available online: https://github.com/eloquentarduino/micromlgen/tree/master (accessed on 4 September 2024).
  14. Markova, V.; Ganchev, T.; Kalinkov, K. Clas: A database for cognitive load, affect and stress recognition. In Proceedings of the 2019 International Conference on Biomedical Innovations and Applications (BIA), Varna, Bulgaria, 8–9 November 2019; pp. 1–4. [Google Scholar]
  15. Yadav, M.; Sakib, M.N.; Nirjhar, E.H.; Feng, K.; Behzadan, A.H.; Chaspari, T. Exploring Individual Differences of Public Speaking Anxiety in Real-Life and Virtual Presentations. IEEE Trans. Affect. Comput. 2022, 13, 1168–1182. [Google Scholar] [CrossRef]
  16. Mohd, T.M.A.A.T.; Samah, A.A.; Cruz, J.C.D.; Ghaffa, D.; Nordin, R.; Abdullah, N.F. Classification of Stress using Machine Learning Based on Physiological and Psychological Data from Wearables. In Proceedings of the 2023 IEEE 15th International Conference on Humanoid, Nanotechnology, Information Technology, Communication and Control, Environment, and Management (HNICEM), Coron, Philippines, 19–23 November 2023; pp. 1–6. [Google Scholar]
  17. Shedage, P.S.; Pouriyeh, S.; Parizi, R.M.; Han, M.; Sannino, G.; Dehbozorgi, N. Stress Detection Using Multimodal Physiological Signals With Machine Learning From Wearable Devices. In Proceedings of the 2024 IEEE Symposium on Computers and Communications (ISCC), Paris, France, 26–29 June 2024; pp. 1–6. [Google Scholar]
  18. Narwat, N.; Kumar, H.; Jadon, J.S.; Singh, A. Multi-Sensory Stress Detection System. In Proceedings of the 2024 14th International Conference on Cloud Computing, Data Science & Engineering (Confluence), Noida, India, 18–19 January 2024; pp. 685–689. [Google Scholar]
  19. Zhu, L.; Spachos, P.; Gregori, S. Multimodal physiological signals and machine learning for stress detection by wearable devices. In Proceedings of the 2022 IEEE International Symposium on Medical Measurements and Applications (MeMeA), Messina, Italy, 22–24 June 2022; pp. 1–6. [Google Scholar]
  20. Zhu, L.; Ng, P.C.; Yu, Y.; Wang, Y.; Spachos, P.; Hatzinakos, D.; Plataniotis, K.N. Feasibility study of stress detection with machine learning through eda from wearable devices. In Proceedings of the ICC 2022-IEEE International Conference on Communications, Seoul, Republic of Korea, 16–20 May 2022; pp. 4800–4805. [Google Scholar]
  21. Mohammadi, A.; Fakharzadeh, M.; Baraeinejad, B. An integrated human stress detection sensor using supervised algorithms. IEEE Sens. J. 2022, 22, 8216–8223. [Google Scholar] [CrossRef]
  22. Elhanashi, A.; Dini, P.; Saponara, S.; Zheng, Q. Advancements in TinyML: Applications, Limitations, and Impact on IoT Devices. Electronics 2024, 13, 3562. [Google Scholar] [CrossRef]
  23. Rostami, A.; Tarvirdizadeh, B.; Alipour, K.; Ghamari, M. Real-Time Stress Detection from Raw Noisy PPG Signals Using LSTM Model Leveraging TinyML. Arab. J. Sci. Eng. 2024, 1–23. [Google Scholar] [CrossRef]
  24. Srivastava, P.; Shah, N.; Jaiswal, K. Microcontroller-Based EdgeML: Health Monitoring for Stress and Sleep via HRV. Eng. Proc. 2024, 78, 3. [Google Scholar] [CrossRef]
  25. Nurse Stress Prediction Wearable Sensors. Available online: https://www.kaggle.com/datasets/priyankraval/nurse-stress-prediction-wearable-sensors/data (accessed on 16 June 2023).
  26. Hosseini, S.; Katragadda, S.; Bhupatiraju, R.T.; Ashkar, Z.; Borst, C.; Cochran, K.; Gottumukkala, R. A Multi-Modal Sensor Dataset for Continuous Stress Detection of Nurses in a Hospital [Dataset]. 2021. Dryad. Available online: https://doi.org/10.5061/dryad.5hqbzkh6f (accessed on 24 September 2023).
  27. Rehman, A.; Khan, A.; Ali, M.A.; Khan, M.U.; Khan, S.U.; Ali, L. Performance analysis of pca, sparse pca, kernel pca and incremental pca algorithms for heart failure prediction. In Proceedings of the 2020 International Conference on Electrical, Communication, and Computer Engineering (ICECCE), Istanbul, Turkey, 12–13 June 2020; pp. 1–5. [Google Scholar]
  28. Haouij, N.E.; Poggi, J.M.; Sevestre-Ghalila, S.; Ghozi, R.; Jaïdane, M. AffectiveROAD system and database to assess driver’s attention. In Proceedings of the 33rd Annual ACM Symposium on Applied Computing, Pau, France, 9–13 April 2018; pp. 800–803. [Google Scholar]
  29. Mohammed, R.; Rawashdeh, J.; Abdullah, M. Machine Learning with Oversampling and Undersampling Techniques: Overview Study and Experimental Results. In Proceedings of the 2020 11th International Conference on Information and Communication Systems (ICICS), Irbid, Jordan, 7–9 April 2020; pp. 243–248. [Google Scholar]
  30. Hasanin, T.; Khoshgoftaar, T.M.; Leevy, J.L.; Bauder, R.A. Severely imbalanced big data challenges: Investigating data sampling approaches. J. Big Data 2019, 6, 107. [Google Scholar] [CrossRef]
  31. Hancock, J.T.; Khoshgoftaar, T.M.; Johnson, J.M. Evaluating classifier performance with highly imbalanced big data. J. Big Data 2023, 10, 42. [Google Scholar] [CrossRef]
  32. Mqadi, N.M.; Naicker, N.; Adeliyi, T. Solving misclassification of the credit card imbalance problem using near miss. Math. Probl. Eng. 2021, 2021, 7194728. [Google Scholar] [CrossRef]
  33. Sample Selection in NearMiss. Available online: https://imbalanced-learn.org/stable/auto_examples/under-sampling/plot_illustration_nearmiss.html#sample-selection-in-nearmiss (accessed on 1 December 2024).
  34. Bajpai, D.; He, L. Evaluating KNN performance on WESAD dataset. In Proceedings of the 2020 12th International Conference on Computational Intelligence and Communication Networks (CICN), Los Alamitos, CA, USA, 25–26 September 2020; pp. 60–62. [Google Scholar]
  35. Lu, Y.; Fu, X.; Guo, E.; Tang, F. XGBoost algorithm-based monitoring model for urban driving stress: Combining driving behaviour, driving environment, and route familiarity. IEEE Access 2021, 9, 21921–21938. [Google Scholar] [CrossRef]
  36. Erkal, B.; Başak, S.; Çiloğlu, A.; Şener, D.D. Multiclass classification of brain cancer with machine learning algorithms. In Proceedings of the 2020 Medical Technologies Congress (TIPTEKNO), Antalya, Turkey, 19–20 November 2020; pp. 1–4. [Google Scholar]
  37. Bhattacharya, M.; Datta, D. Diabetes Prediction using Logistic Regression and Rule Extraction from Decision Tree and Random Forest Classifiers. In Proceedings of the 2023 4th International Conference for Emerging Technology (INCET), Belgaum, India, 26–28 May 2023; pp. 1–7. [Google Scholar]
  38. Xu, Y.; Cai, W.; Wang, L.; Xie, T. Intelligent diagnosis of rolling bearing fault based on improved convolutional neural network and LightGBM. Shock Vib. 2021, 2021, 1205473. [Google Scholar] [CrossRef]
  39. Khan, M.S.; Nath, T.D.; Hossain, M.M.; Mukherjee, A.; Hasnath, H.B.; Meem, T.M.; Khan, U. Comparison of multiclass classification techniques using dry bean dataset. Int. J. Cogn. Comput. Eng. 2023, 4, 6–20. [Google Scholar]
  40. Grandini, M.; Bagli, E.; Visani, G. Metrics for multi-class classification: An overview. arXiv 2020, arXiv:2008.05756. [Google Scholar]
  41. Raspberry Pi Pico W Datasheet: An RP2040-Based Microcontroller Board with Wireless. Available online: https://datasheets.raspberrypi.com/picow/pico-w-datasheet.pdf (accessed on 13 November 2024).
  42. Belatik, A.; Sabri, M.A.; El Khoukhi, H.; Aarab, A. A Comparative Review of Microcontroller Architectures in Embedded Machine Learning: The Raspberry Pi Pico (RP2040) and Arduino Nano 33 IoT (SAMD21). In Proceedings of the International Conference on Digital Technologies and Applications, Benguerir, Morocco, 10–11 May 2024; pp. 446–456. [Google Scholar]
  43. M2cgen. Available online: https://github.com/BayesWitnesses/m2cgen (accessed on 4 September 2024).
  44. EverywhereML. Available online: https://github.com/eloquentarduino/everywhereml/tree/master (accessed on 4 September 2024).
  45. Datta, A.; Pal, A.; Marandi, R.; Chattaraj, N.; Nandi, S.; Saha, S. Efficient Air Quality Index Prediction on Resource-Constrained Devices using TinyML: Design, Implementation, and Evaluation. In Proceedings of the 25th International Conference on Distributed Computing and Networking, Chennai, India, 4–7 January 2024; pp. 304–309. [Google Scholar]
Figure 1. The complete proposed workflow accompanied by an image of the edge device prototype.
Electronics 14 00687 g001
Figure 2. Data distribution of each feature.
Electronics 14 00687 g002
Figure 3. Original class distribution of the nurse dataset.
Electronics 14 00687 g003
Figure 4. Class distribution before and after NearMiss-1 undersampling.
Electronics 14 00687 g004
Figure 5. Confusion matrix of the six classifier models: (a) K-Nearest Neighbour. (b) XGBoost. (c) Random Forest. (d) Decision Tree. (e) LightGBM. (f) Logistic Regression.
Electronics 14 00687 g005
Table 4. Confusion matrix and representation of three classes.
(a)(b)
Predicted Predicted
ClassC1 C2 C3 ClassC1 C2 C3
ActualC1T1 F12 F13ActualC1TN TN FP
C2F21 T2 F23C2TN TN FP
C3F31 F32 T3C3FN FN TP
Disclaimer/Publisher’s Note: The statements, opinions and data contained in all publications are solely those of the individual author(s) and contributor(s) and not of MDPI and/or the editor(s). MDPI and/or the editor(s) disclaim responsibility for any injury to people or property resulting from any ideas, methods, instructions or products referred to in the content.

